Improving oligo-conjugated antibody signal in multimodal single-cell analysis
- Department of Pathology, New York University School of Medicine, United States
- LEO Foundation Skin Immunology Research Center, University of Copenhagen, Denmark
- Department of Immunology and Microbiology, University of Copenhagen, Denmark
- Technology Innovation Lab, New York Genome Center, United States
- Department of Genetics and Genome Sciences, University of Connecticut School of Medicine, United States
- Department of Biostatistics and Epidemiology, School of Public Health and Health Sciences, University of Massachusetts, United States
- NYU Langone Vaccine Center, Department of Medicine, New York University School of Medicine, United States
Figures
Figure 1 with 2 supplements
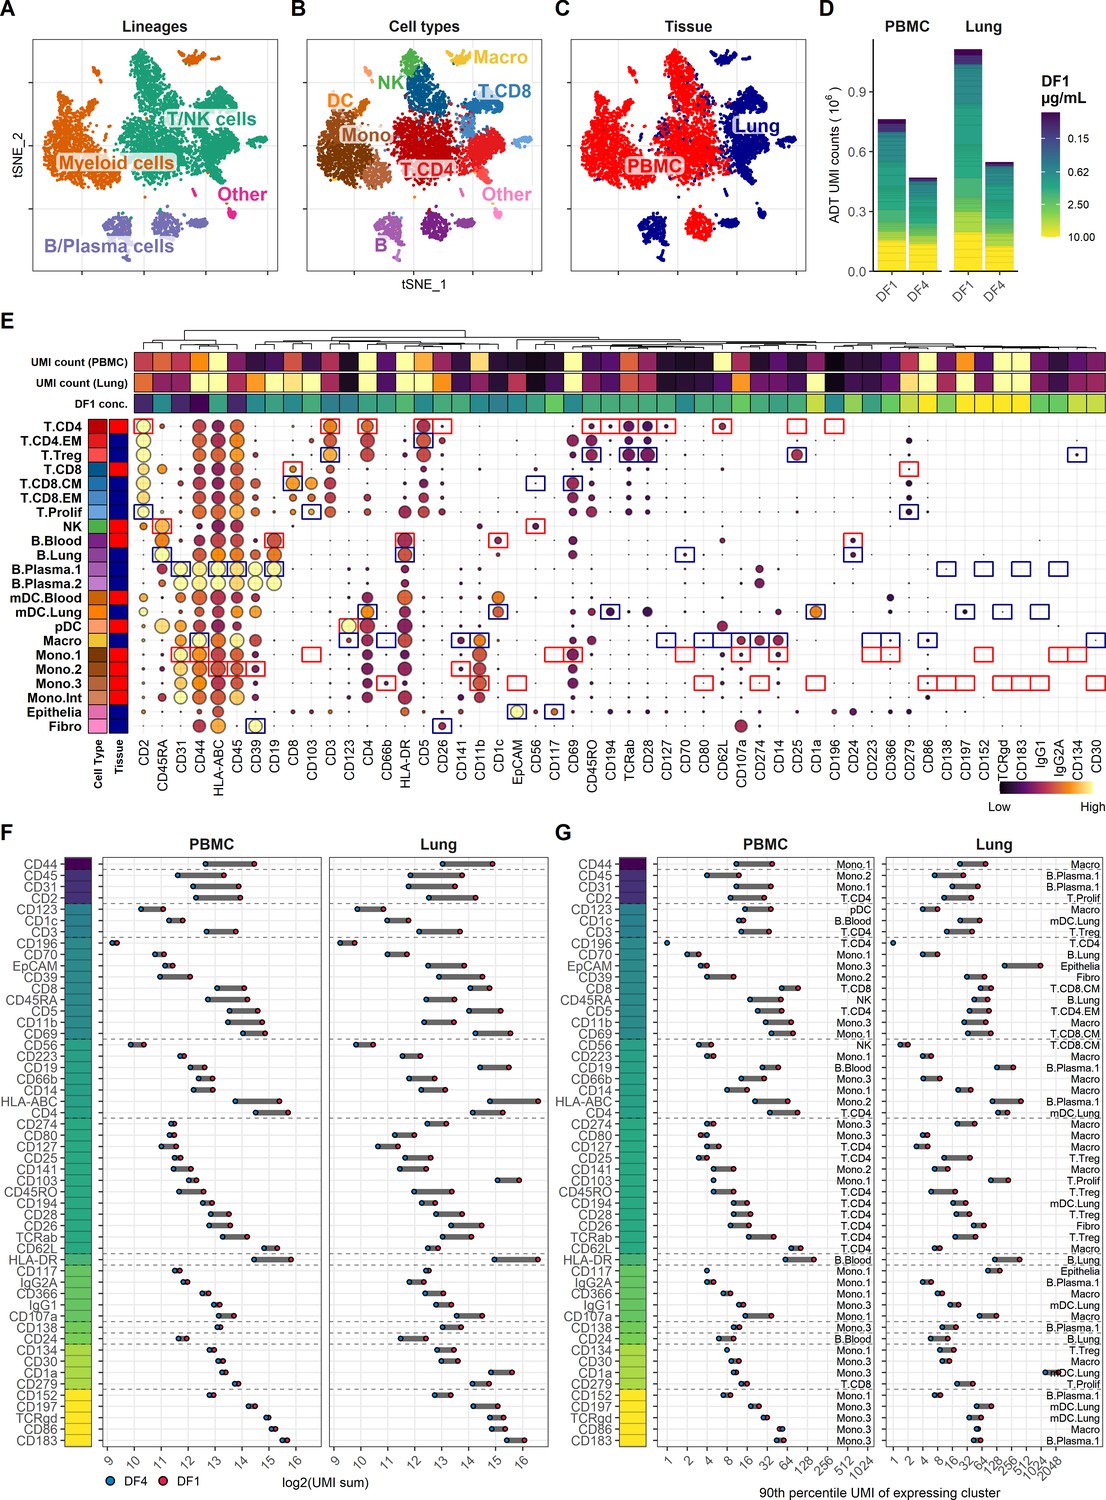
Fourfold antibody dilution response in peripheral blood mononuclear cell (PBMC) and lung tumor immune cells.
(A–C) Single cells from all samples and conditions were clustered and visualized according to their gene expression and colored by (A) overall cell lineage, (B) cell type, and (C) tissue of origin. (D) Summarized unique molecular identifier (UMI) counts within cell-containing droplets segmented by the individual antibodies stained at the starting concentrations (dilution factor 1 [DF1]) or at a fourfold dilution (DF4) in PBMC and lung samples (concentrations of each antibody can be found in Supplementary file 1). Antibody segments are colored by their concentration at DF1. (E) Heatmap of normalized antibody-derived tag (ADT) signal within each transcription-based cluster identified in (B). Visualized by frequency of positive cells (circle size) and colored by the median ADT signal within the positive fraction (i.e., signal from a marker that is highly expressed by all cells in a cluster will have the biggest circle and be colored yellow). Red and blue colored boxes denote the clusters chosen for evaluating titration response within blood and lung samples, respectively. (F, G) Change in ADT signal for each antibody by fourfold dilution. Individual antibodies are colored by their concentration at DF1 and quantified by (F) sum of UMIs within cell-containing droplets assigned to each antibody and (G) 90th percentile UMI count within expressing cell cluster identified in (E) and annotated by numbers to the right.
Figure 1—figure supplement 1
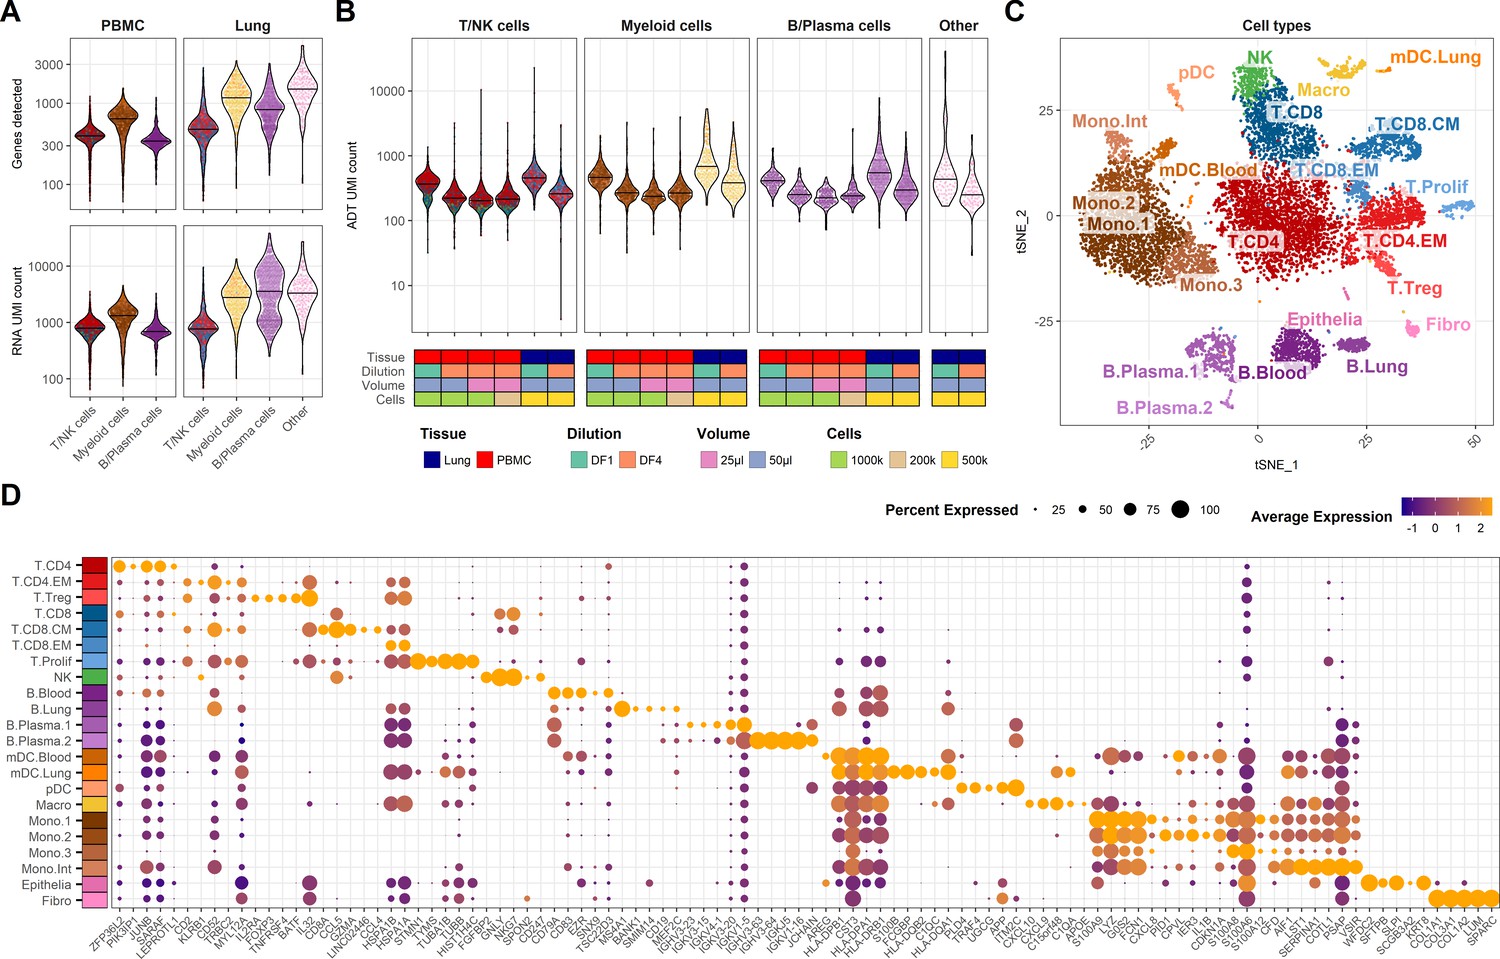
Quality control metrics and cell-type annotation.
(A) Number of genes detected (top) and unique molecular identifier (UMI) count (bottom) for each cell across major cell lineages within the mRNA modality. (B) UMI count within antibody-derived tag modality across different experimental conditions and cell lineages. (C) Detailed cell-type annotation visualized by t-distributed stochastic neighbor embedding (tSNE). (D) Top five marker genes for each cell type (expressed by >30% of cells and having being at least 20% more abundant compared to other cell types). Only showing dots for genes expressed in >10% of the cluster.
Figure 1—figure supplement 2
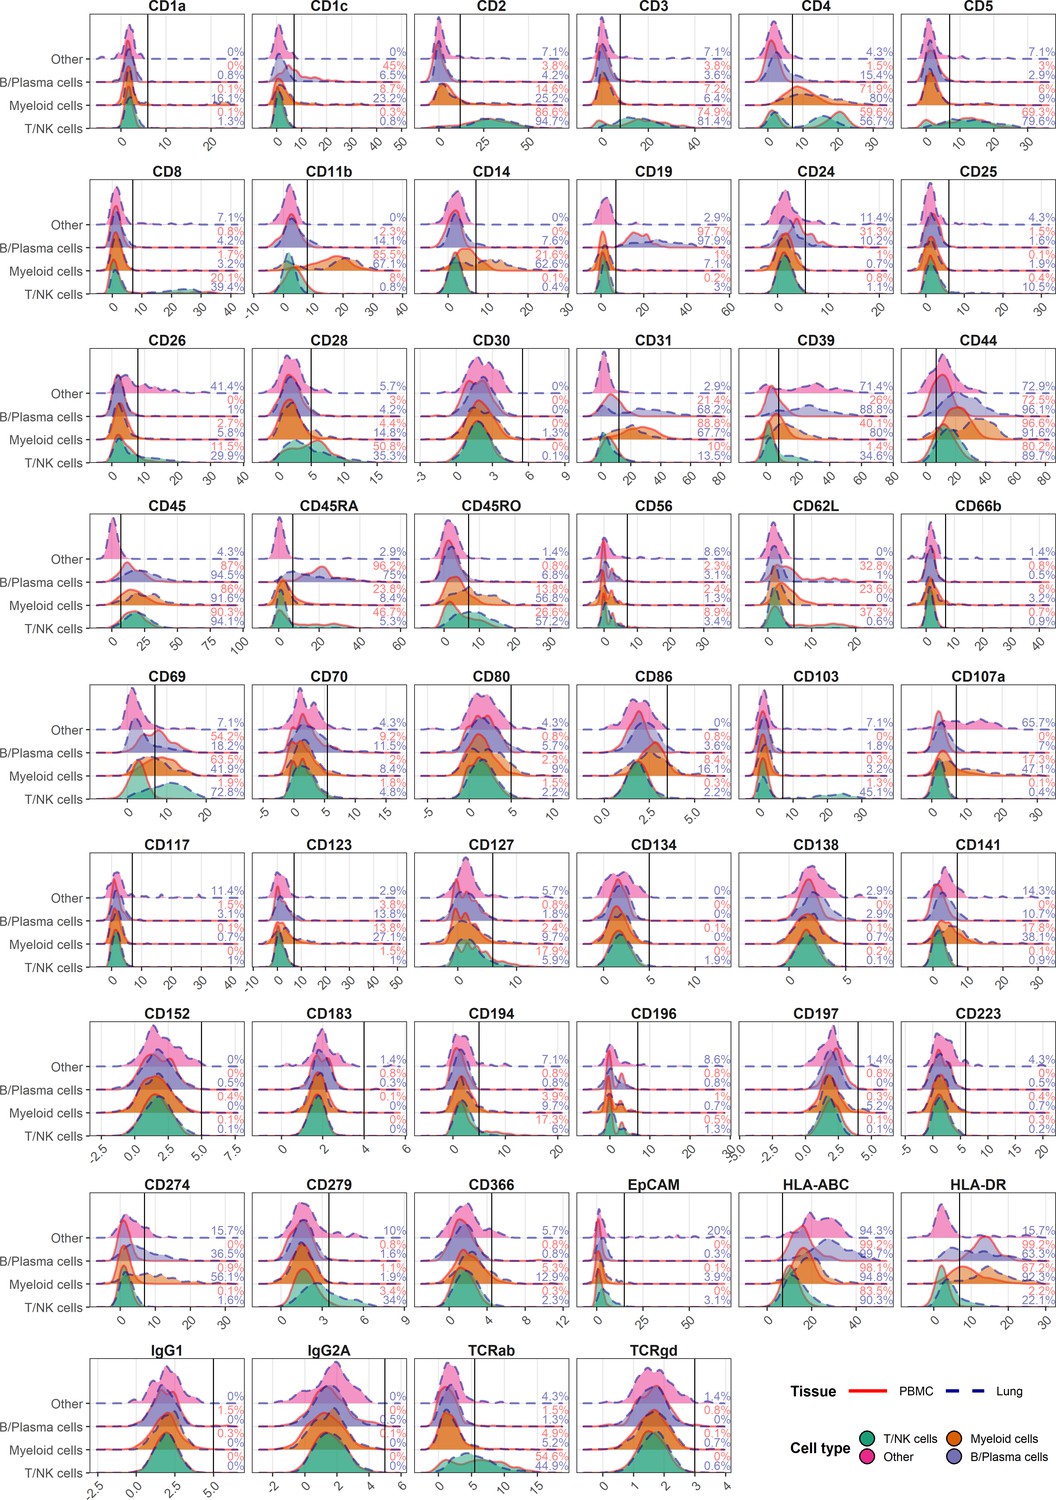
Gating positive cells based on antibody-derived tag (ADT) signal at dilution factor 1.
Histograms for normalized ADT expression of each marker within major cell types in peripheral blood mononuclear cells (red) and lung (blue). Gating threshold indicated by vertical line, and numbers denote percent positive within each cell type of each tissue.
Figure 2 with 5 supplements
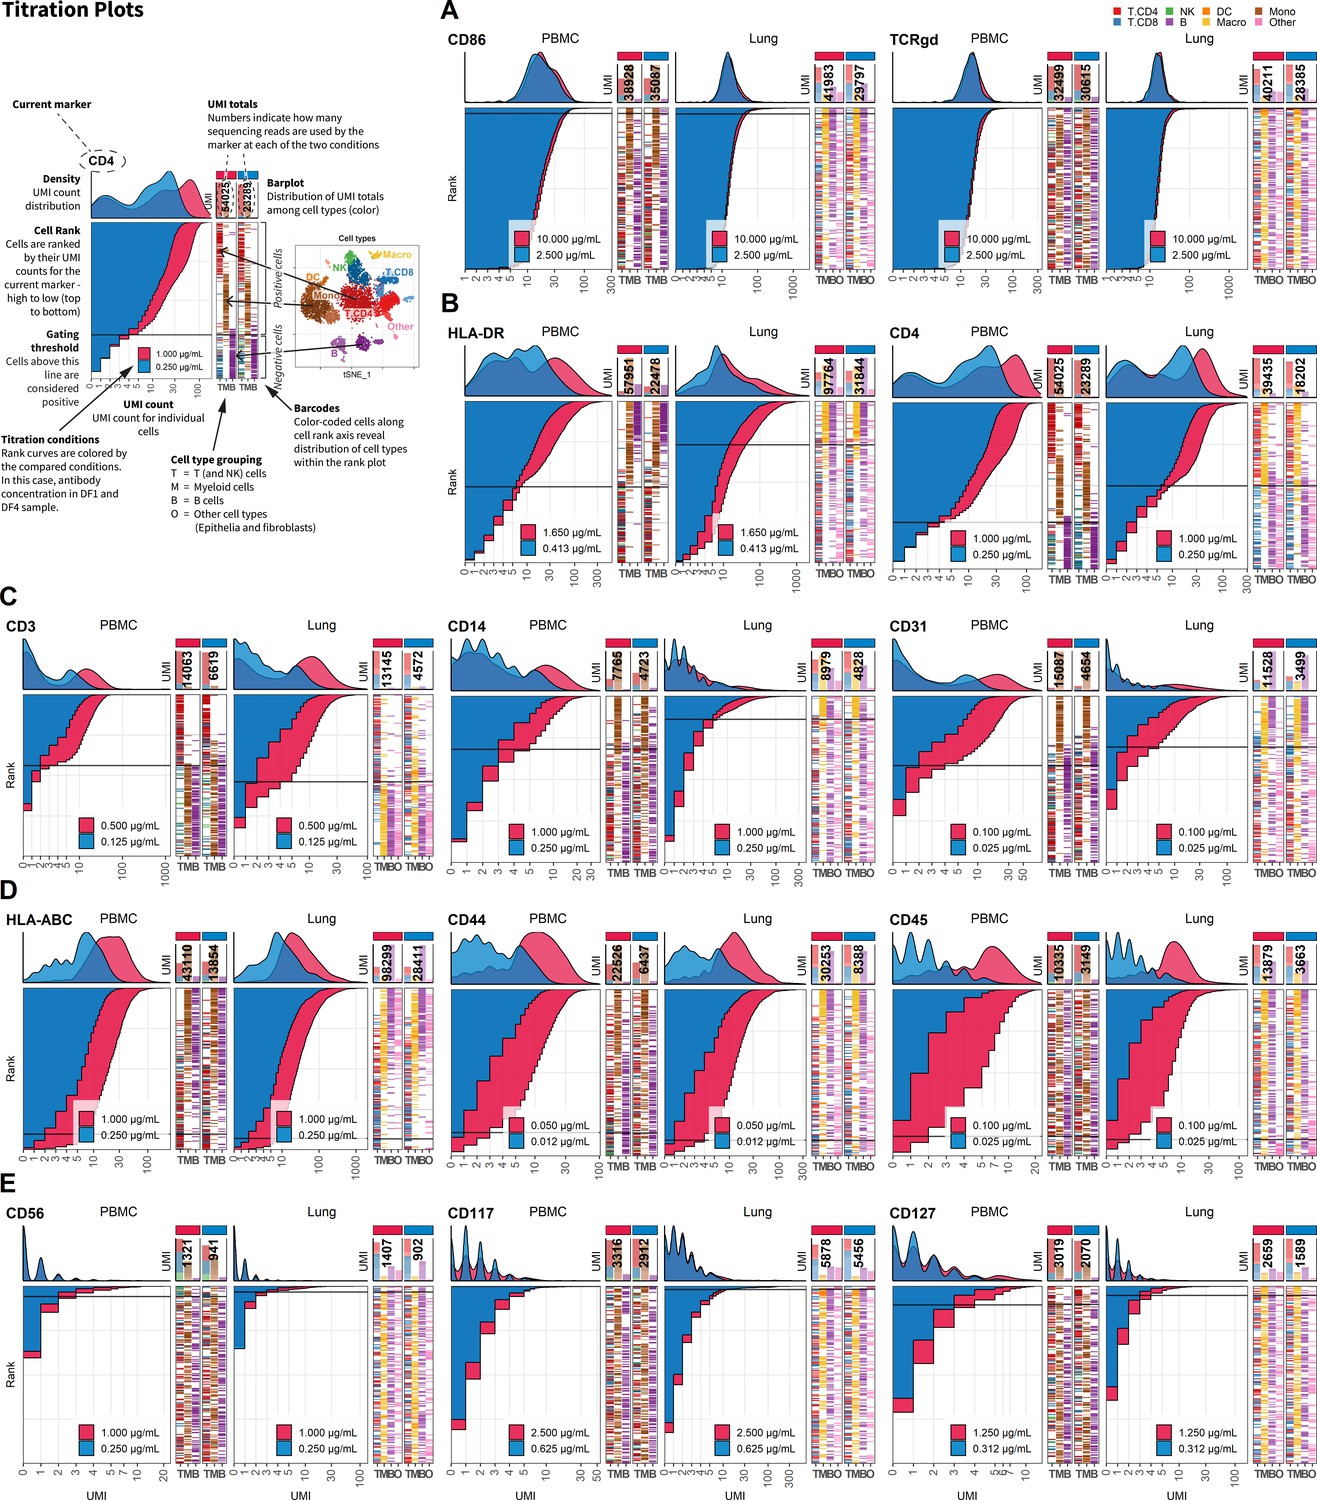
Fourfold antibody dilution response is dependent on epitope abundance.
Titration plots (unique molecular identifier [UMI] count vs. cell rank) showing response to reduction in antibody concentration from dilution factor 1 (DF1) to DF4 within peripheral blood mononuclear cells (left) and lung (right). Histogram depicts distribution of UMIs at each condition colored by dilution factor (and annotated with concentration). Numbers within bar plot denote total UMI count within cell-containing droplets at each antibody concentration. Barcodes to the right depict cell type by color at the corresponding rank to visualize specificity of the antibody. Horizontal line depicts gating threshold for cells considered positive for the marker. Antibody response to fourfold dilution can be divided into five categories exemplified in (A-E). (A) Antibodies where the positive signal is obscured within the background signal (category A). (B) Antibodies that respond by a reduction in signal but without hampering the ability to distinguish positive from negative cells (category B). These antibodies also show strict cell-type specificity (i.e., HLA-DR is restricted to non-T cells, whereas CD4 is highly expressed in T cells and intermediately expressed in myeloid cells as shown in the barcode plot). (C) Antibodies that respond by a reduction in both signal and change the ability to distinguish positive from negative cells (category C). (D) Antibodies targeting ubiquitously expressed markers (category D). (E) Antibodies that do not show a convincing positive population due to either lack of epitopes (no positive cells in either tissue) or lack of antibody binding (non-functional antibody) (category E). Titration plots for all markers can be found in Figure 2—figure supplements 1–5.
Figure 2—figure supplement 1
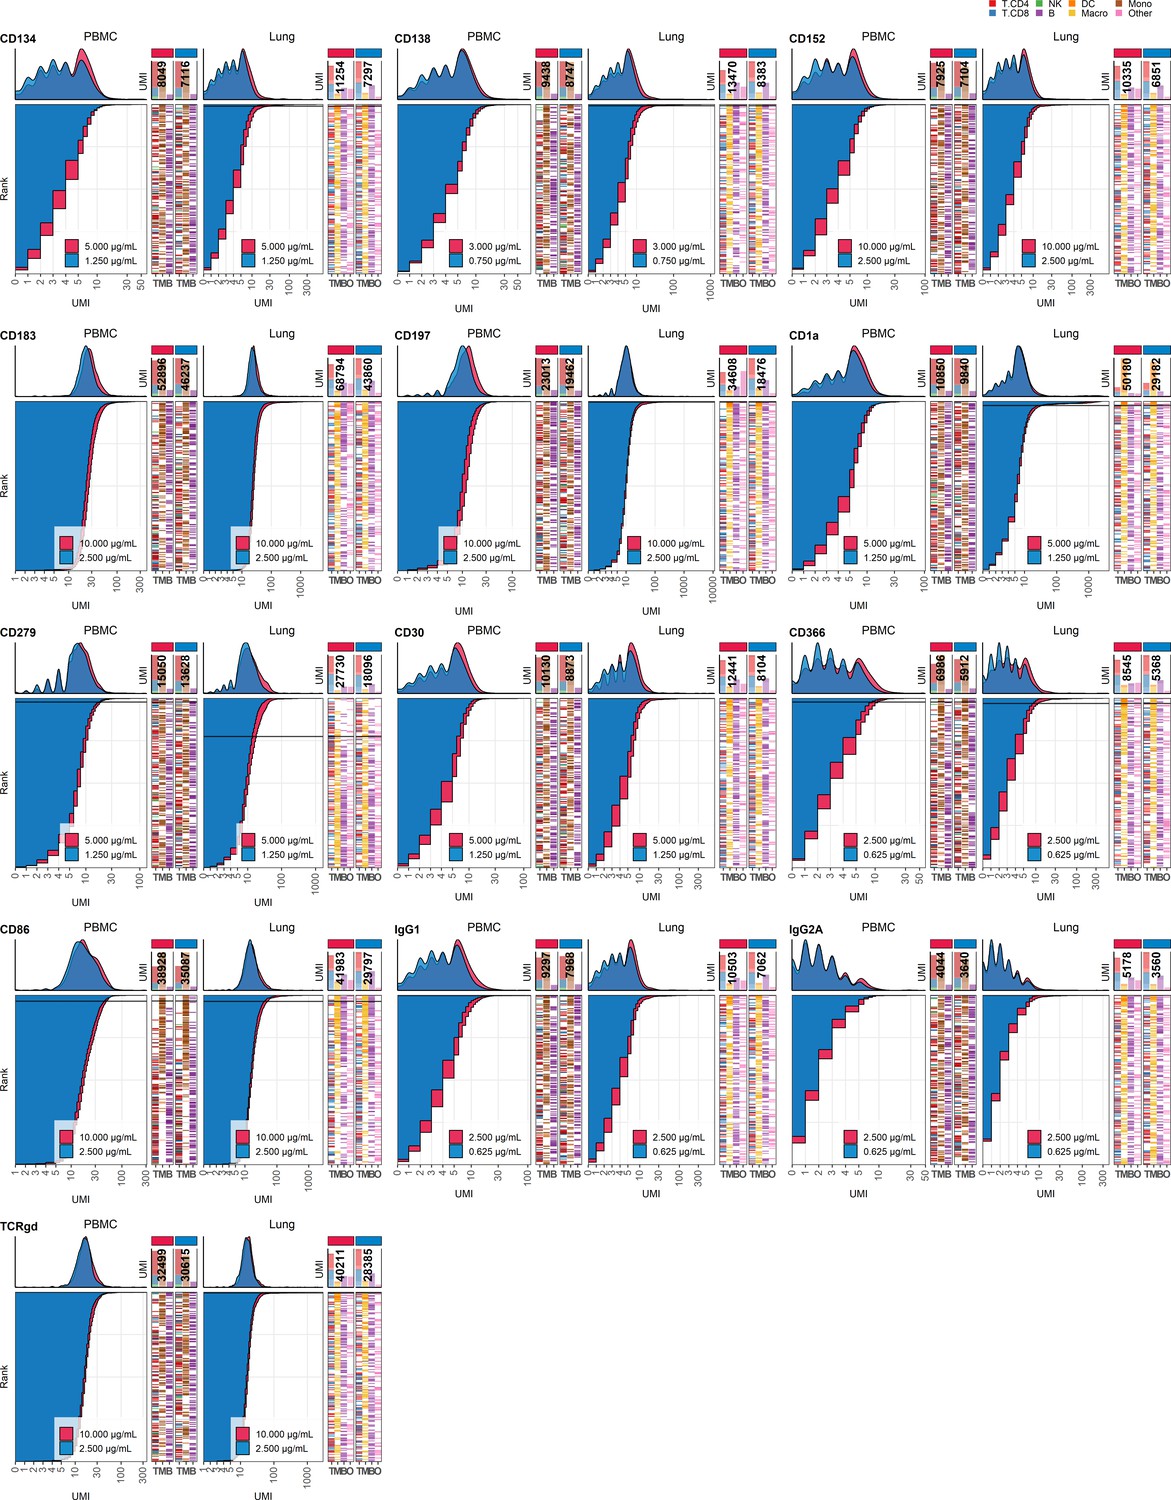
Response of individual antibodies to fourfold reduction in concentration in peripheral blood mononuclear cells (PBMCs) and lung tumor immune cells – category A.
Titration plots (unique molecular identifier [UMI] count vs. cell rank) showing response to reduction in antibody concentration from dilution factor 1 (DF1) to DF4 within PBMC (left) and lung (right) within antibodies assigned to category A. Histogram depicts distribution of UMIs at each condition colored by dilution factor (and annotated with concentration). Numbers within bar plot denote total UMI count within cell-containing droplets at each antibody concentration. Barcodes to the right depict cell type by color at the corresponding rank to visualize specificity of the antibody. Horizontal line depicts gating threshold for cells considered positive for the marker.
Figure 2—figure supplement 2
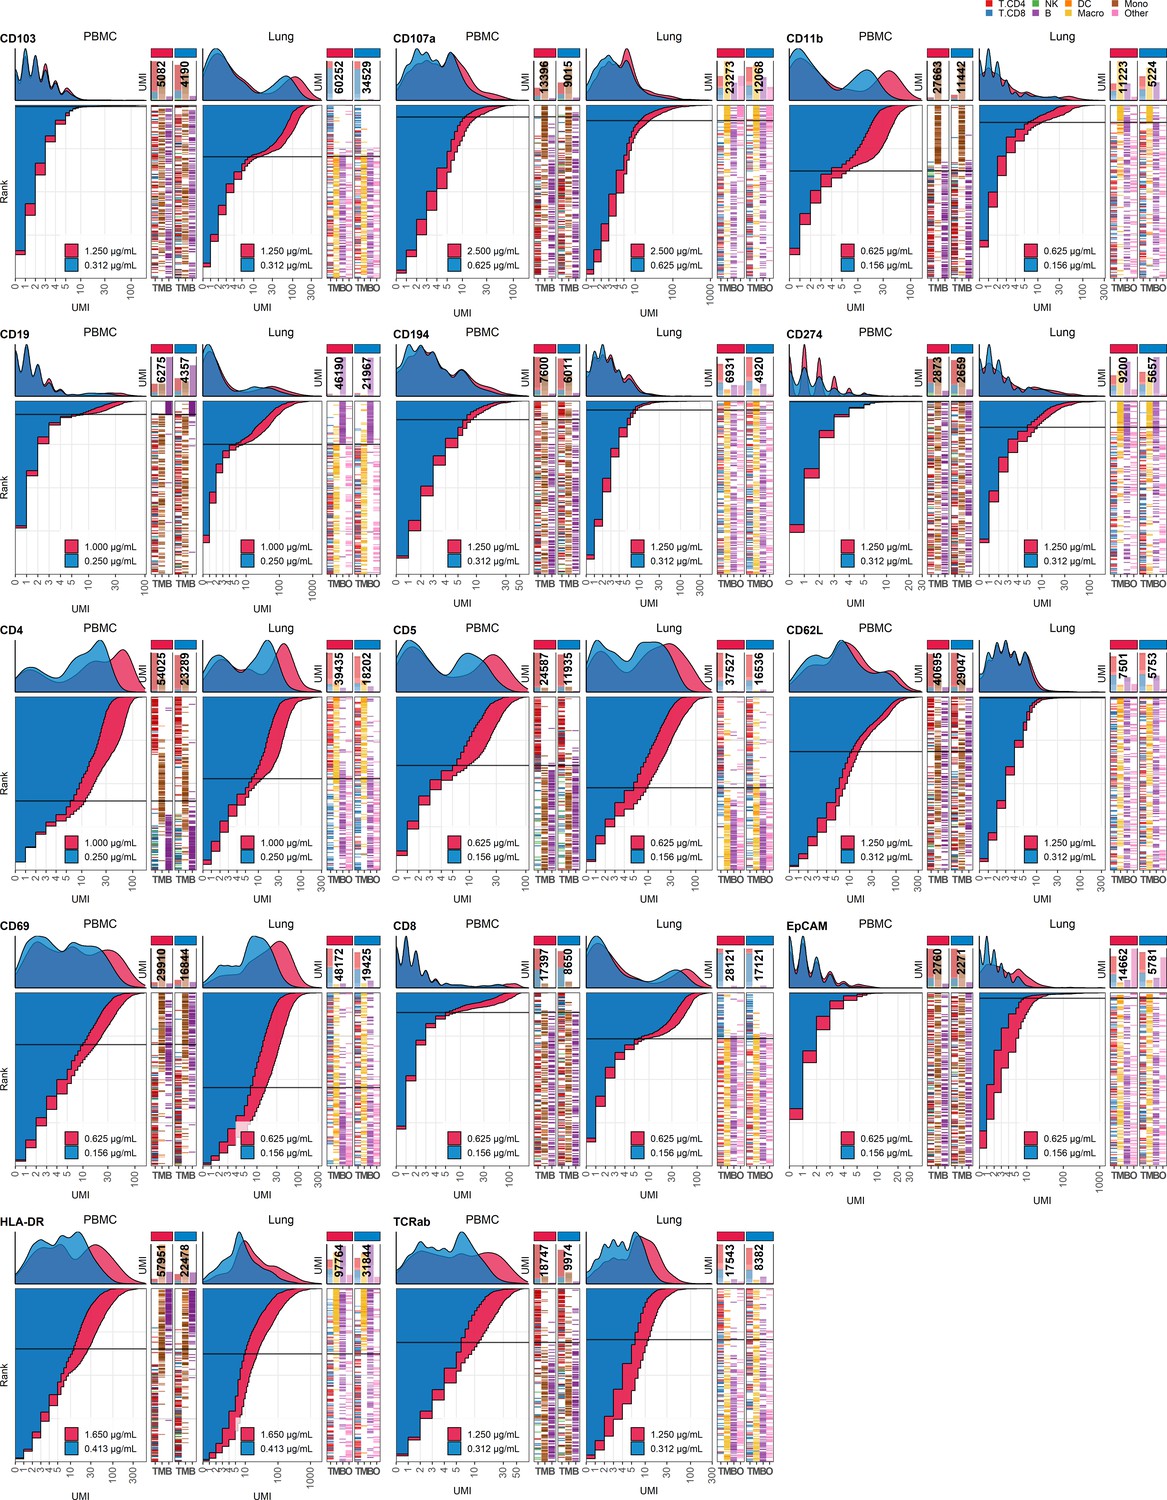
Response of individual antibodies to fourfold reduction in concentration in peripheral blood mononuclear cells (PBMCs) and lung tumor immune cells – category B.
Titration plots (unique molecular identifier [UMI] count vs. cell rank) showing response to reduction in antibody concentration from dilution factor 1 (DF1) to DF4 within PBMC (left) and lung (right) within antibodies assigned to category B. Histogram depicts distribution of UMIs at each condition colored by dilution factor (and annotated with concentration). Numbers within bar plot denote total UMI count within cell-containing droplets at each antibody concentration. Barcodes to the right depict cell type by color at the corresponding rank to visualize specificity of the antibody. Horizontal line depicts gating threshold for cells considered positive for the marker.
Figure 2—figure supplement 3
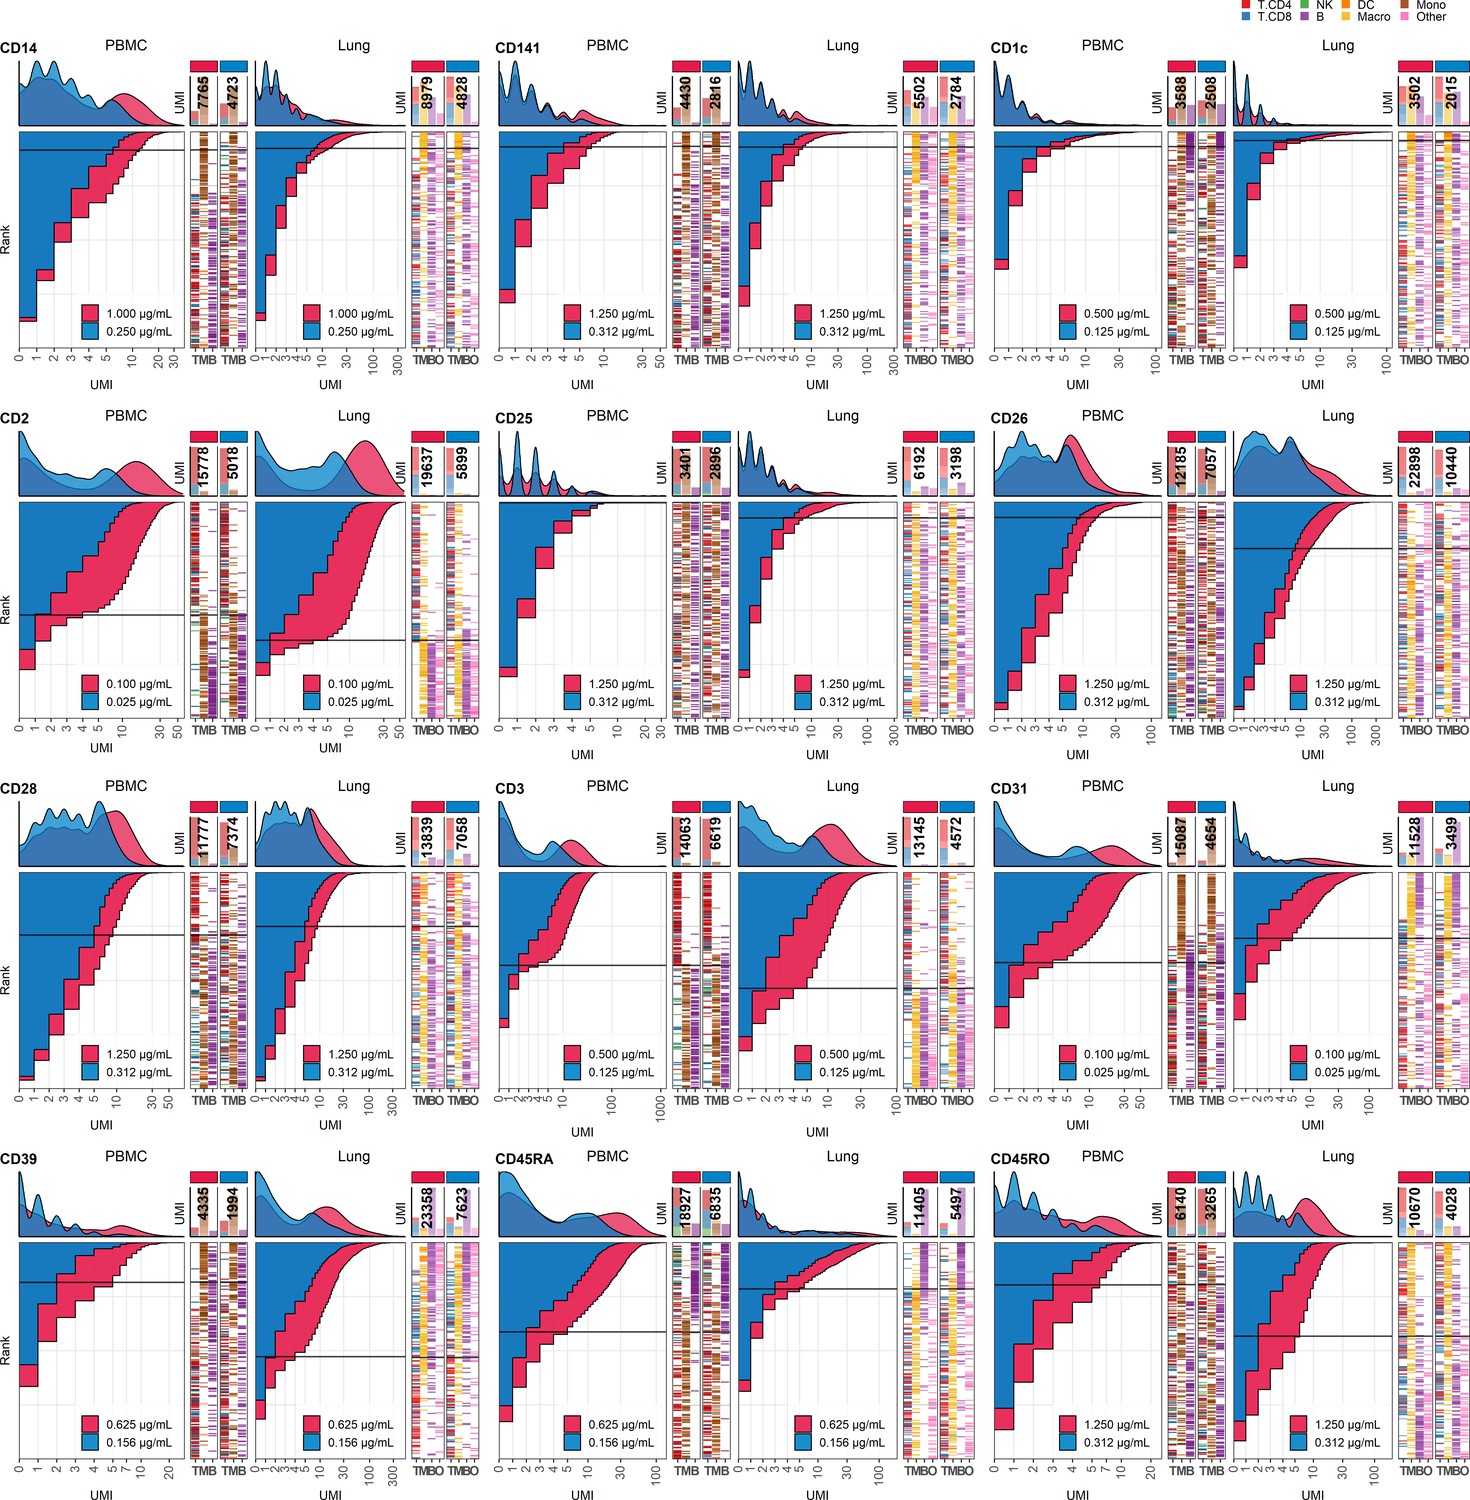
Response of individual antibodies to fourfold reduction in concentration in peripheral blood mononuclear cells (PBMCs) and lung tumor immune cells – category C.
Titration plots (unique molecular identifier [UMI] count vs. cell rank) showing response to reduction in antibody concentration from dilution factor 1 (DF1) to DF4 within PBMC (left) and lung (right) within antibodies assigned to category C. Histogram depicts distribution of UMIs at each condition colored by dilution factor (and annotated with concentration). Numbers within bar plot denote total UMI count within cell-containing droplets at each antibody concentration. Barcodes to the right depict cell type by color at the corresponding rank to visualize specificity of the antibody. Horizontal line depicts gating threshold for cells considered positive for the marker.
Figure 2—figure supplement 4
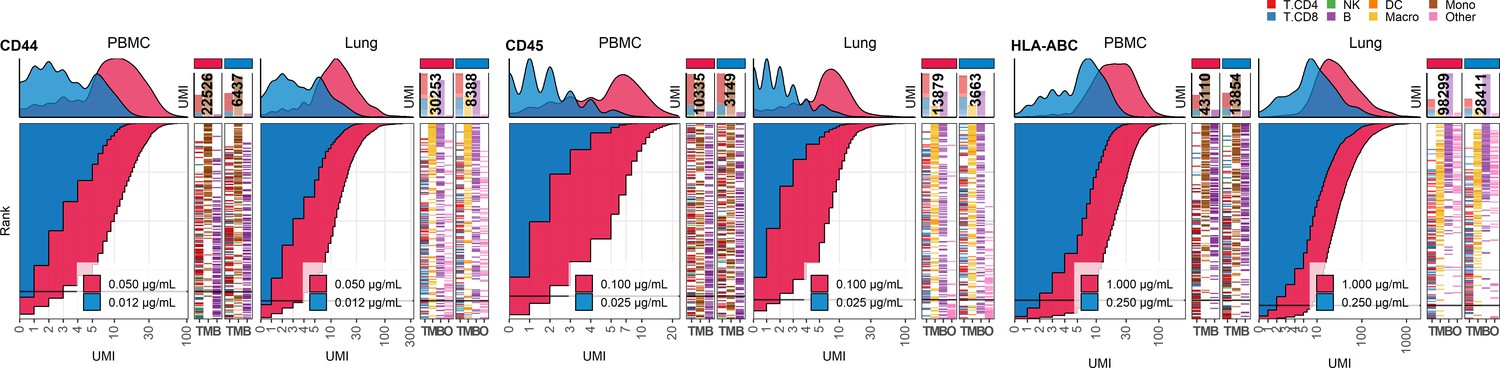
Response of individual antibodies to fourfold reduction in concentration in peripheral blood mononuclear cells (PBMCs) and lung tumor immune cells – category D.
Titration plots (unique molecular identifier [UMI] count vs. cell rank) showing response to reduction in antibody concentration from dilution factor 1 (DF1) to DF4 within PBMC (left) and lung (right) within antibodies assigned to category D. Histogram depicts distribution of UMIs at each condition colored by dilution factor (and annotated with concentration). Numbers within bar plot denote total UMI count within cell-containing droplets at each antibody concentration. Barcodes to the right depict cell type by color at the corresponding rank to visualize specificity of the antibody. Horizontal line depicts gating threshold for cells considered positive for the marker.
Figure 2—figure supplement 5
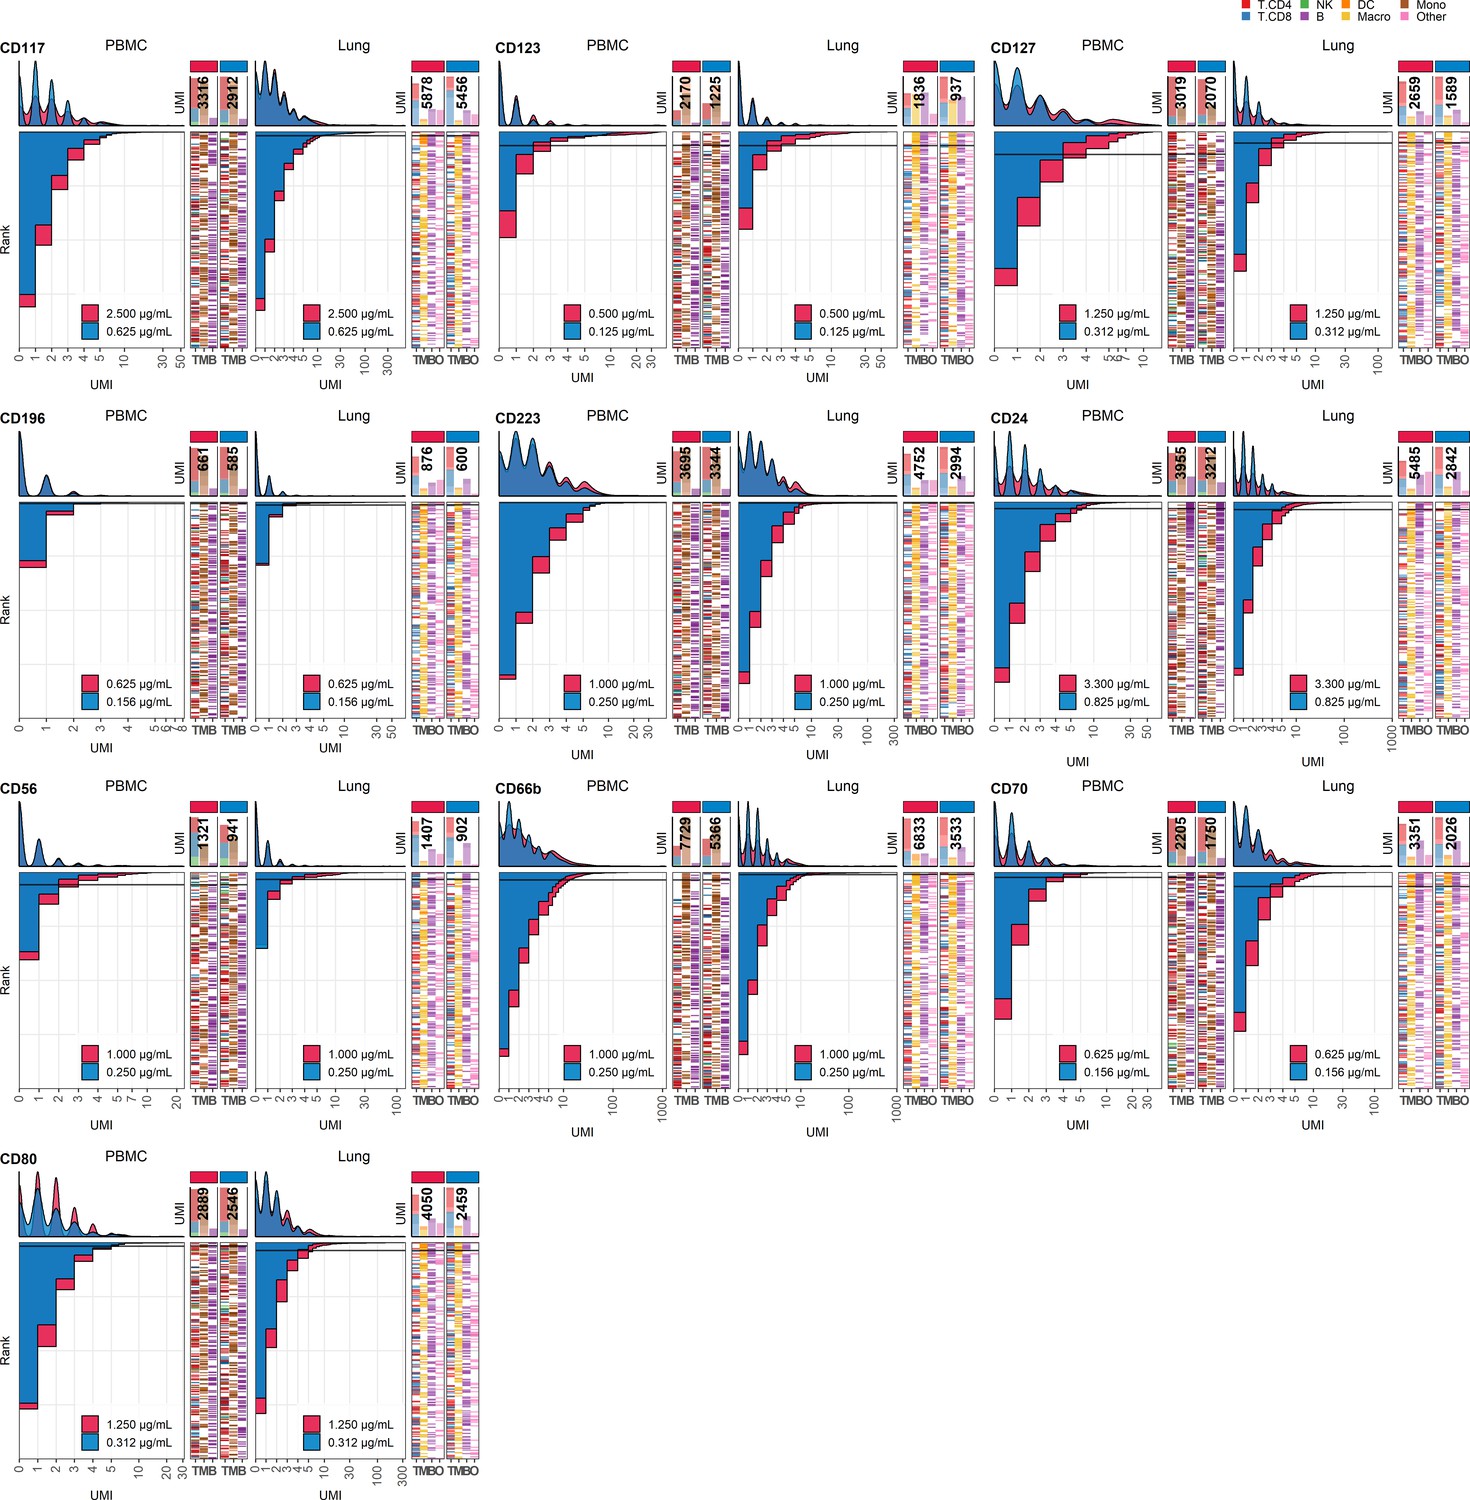
Response of individual antibodies to fourfold reduction in concentration in peripheral blood mononuclear cells (PBMCs) and lung tumor immune cells – category E.
Titration plots (unique molecular identifier [UMI] count vs. cell rank) showing response to reduction in antibody concentration from dilution factor 1 (DF1) to DF4 within PBMC (left) and lung (right) within antibodies assigned to category E. Histogram depicts distribution of UMIs at each condition colored by dilution factor (and annotated with concentration). Numbers within bar plot denote total UMI count within cell-containing droplets at each antibody concentration. Barcodes to the right depict cell type by color at the corresponding rank to visualize specificity of the antibody. Horizontal line depicts gating threshold for cells considered positive for the marker.
Figure 3 with 2 supplements
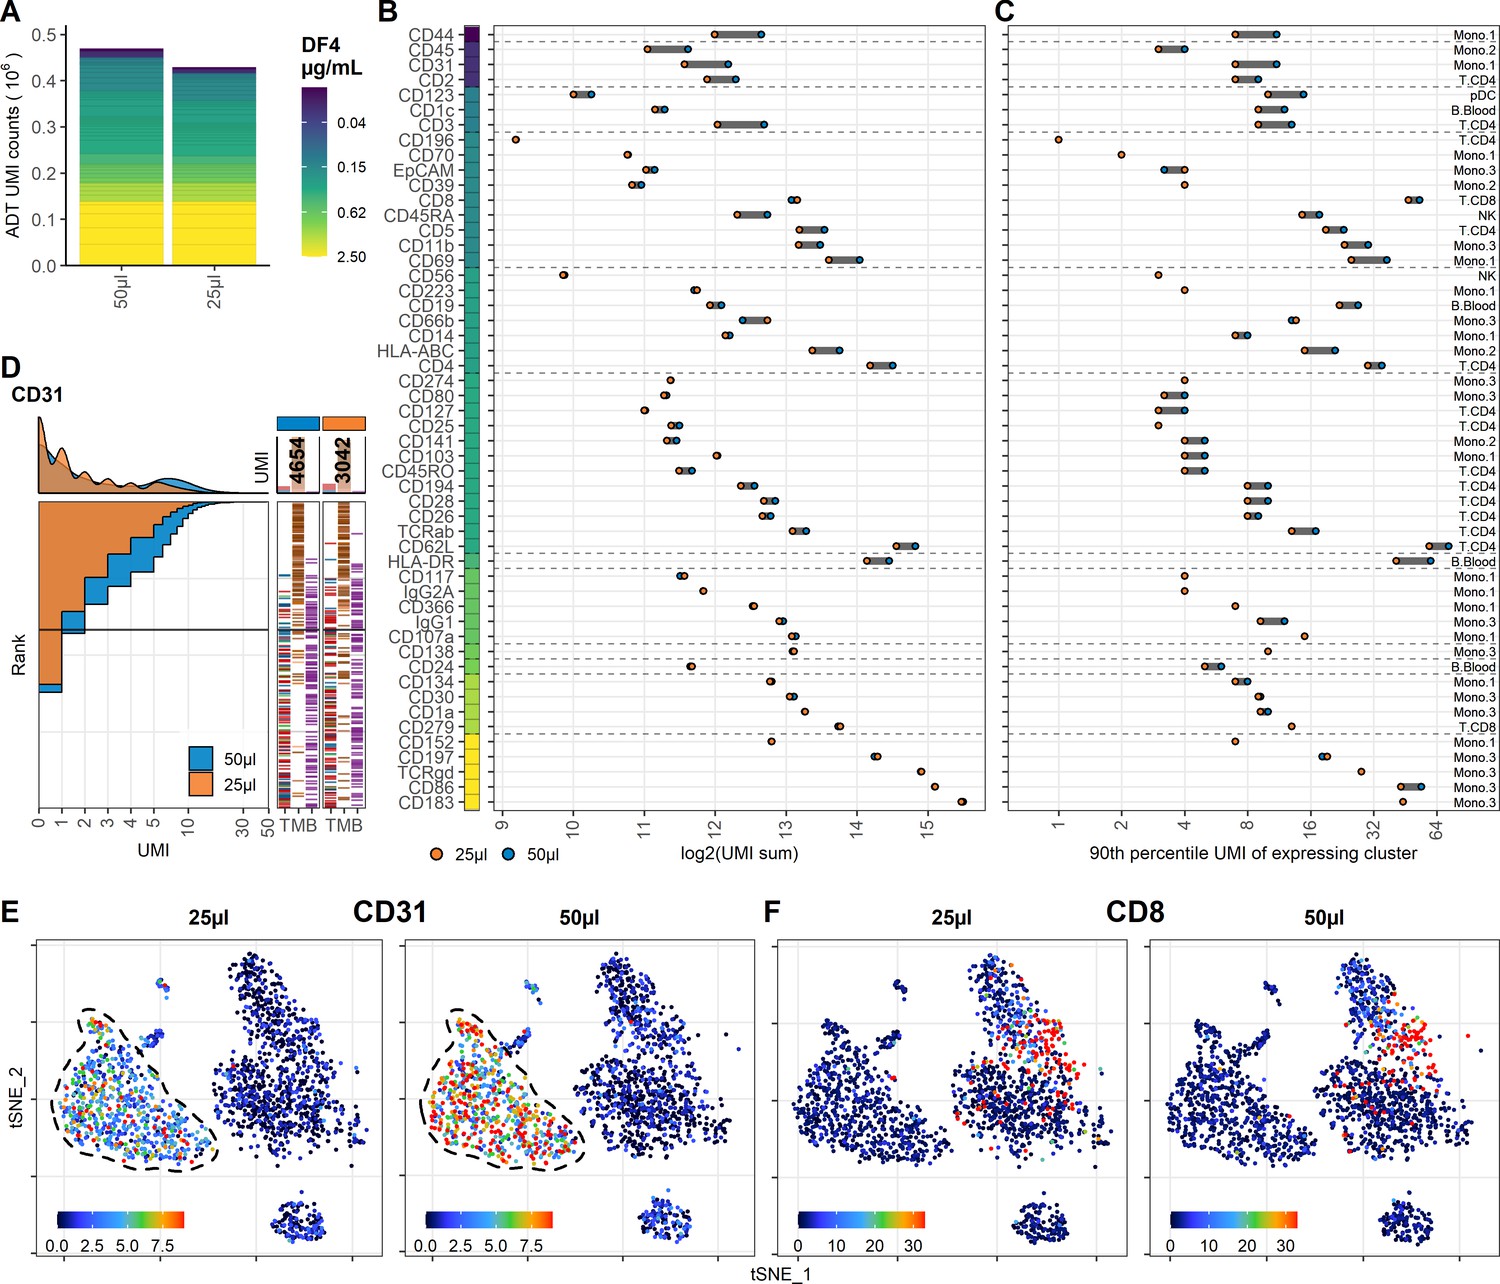
Reducing staining volume primarily affects highly expressed markers.
Comparison of peripheral blood mononuclear cell samples stained in 50 µL (same sample as dilution factor [DF] 4 in Figure 1) or 25 µL volume at DF4. (A) Summarized unique molecular identifier (UMI) counts within cell-containing droplets segmented by the individual antibodies colored by their concentration. (B, C) Change in antibody-derived tag signal for each antibody by reducing staining volume from 50 to 25 µL. Individual antibodies are colored by their concentration. Quantified by (B) sum of UMIs within cell-containing droplets assigned to each antibody and (C) 90th percentile UMI count within the cell type with most abundant expression (the assayed cell type is annotated to the right). (D) Titration plot (marker UMI count vs. normalized cell rank) for CD31 signal response when reducing staining volume from 50 µL to 25 µL. Histogram depicts distribution of UMIs at each condition. Barcodes to the right depict cell-type occurrence at the corresponding rank to visualize cell specificity of the antibody. Numbers on top of the small bar plot denote total UMI count assigned to CD31 within cell-containing droplets from each condition. (E, F) Non-normalized UMI counts visualized on t-distributed stochastic neighbor embedding (tSNE) plots of an affected (CD31; E) or an unaffected (CD8; F) marker by the reduction in cell density. Dashed line indicates the region where expression levels vary between volumes. Titration plots for all markers can be found in Figure 3—figure supplements 1 and 2.
Figure 3—figure supplement 1
Response of individual antibodies to reduction in staining volume.
Titration plots (unique molecular identifier [UMI] count vs. cell rank) showing response to reducing staining volume from 50 µL to 25 µL. Histogram depicts distribution of UMIs at each condition colored by condition. Numbers within bar plot denote total UMI count within cell-containing droplets at each antibody concentration. Barcodes to the right depict cell type by color at the corresponding rank to visualize specificity of the antibody. Horizontal line depicts gating threshold for cells considered positive for the marker.
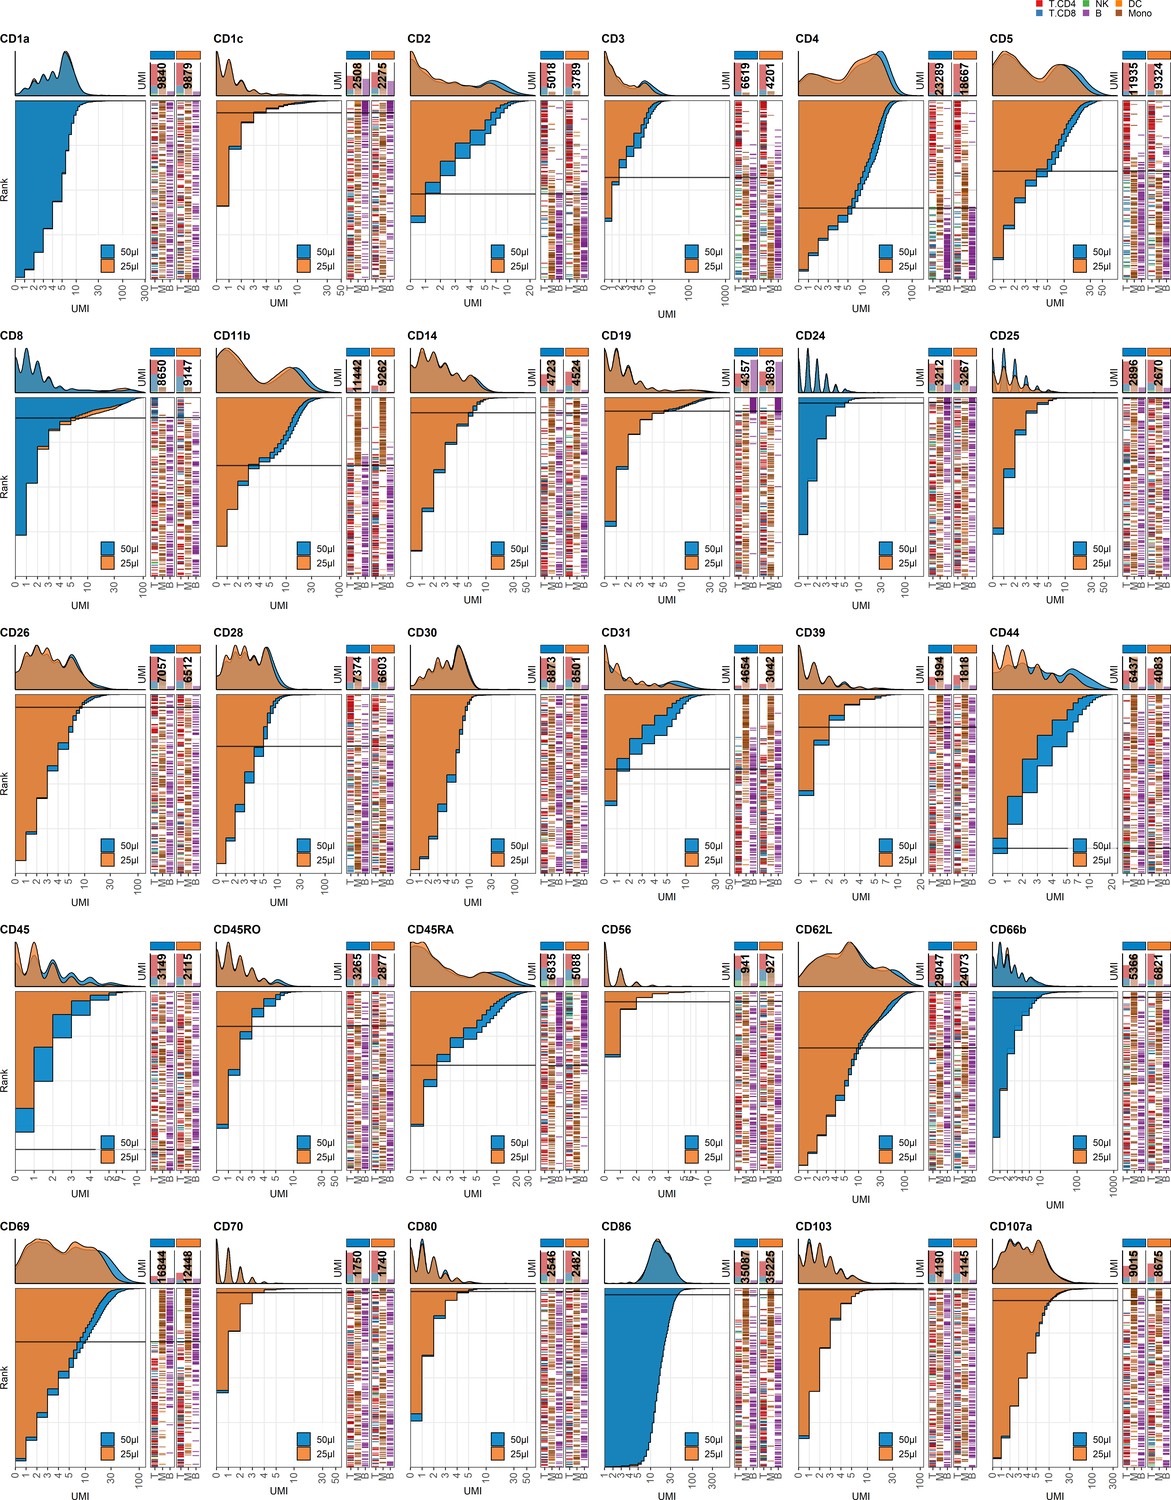
Figure 3—figure supplement 2
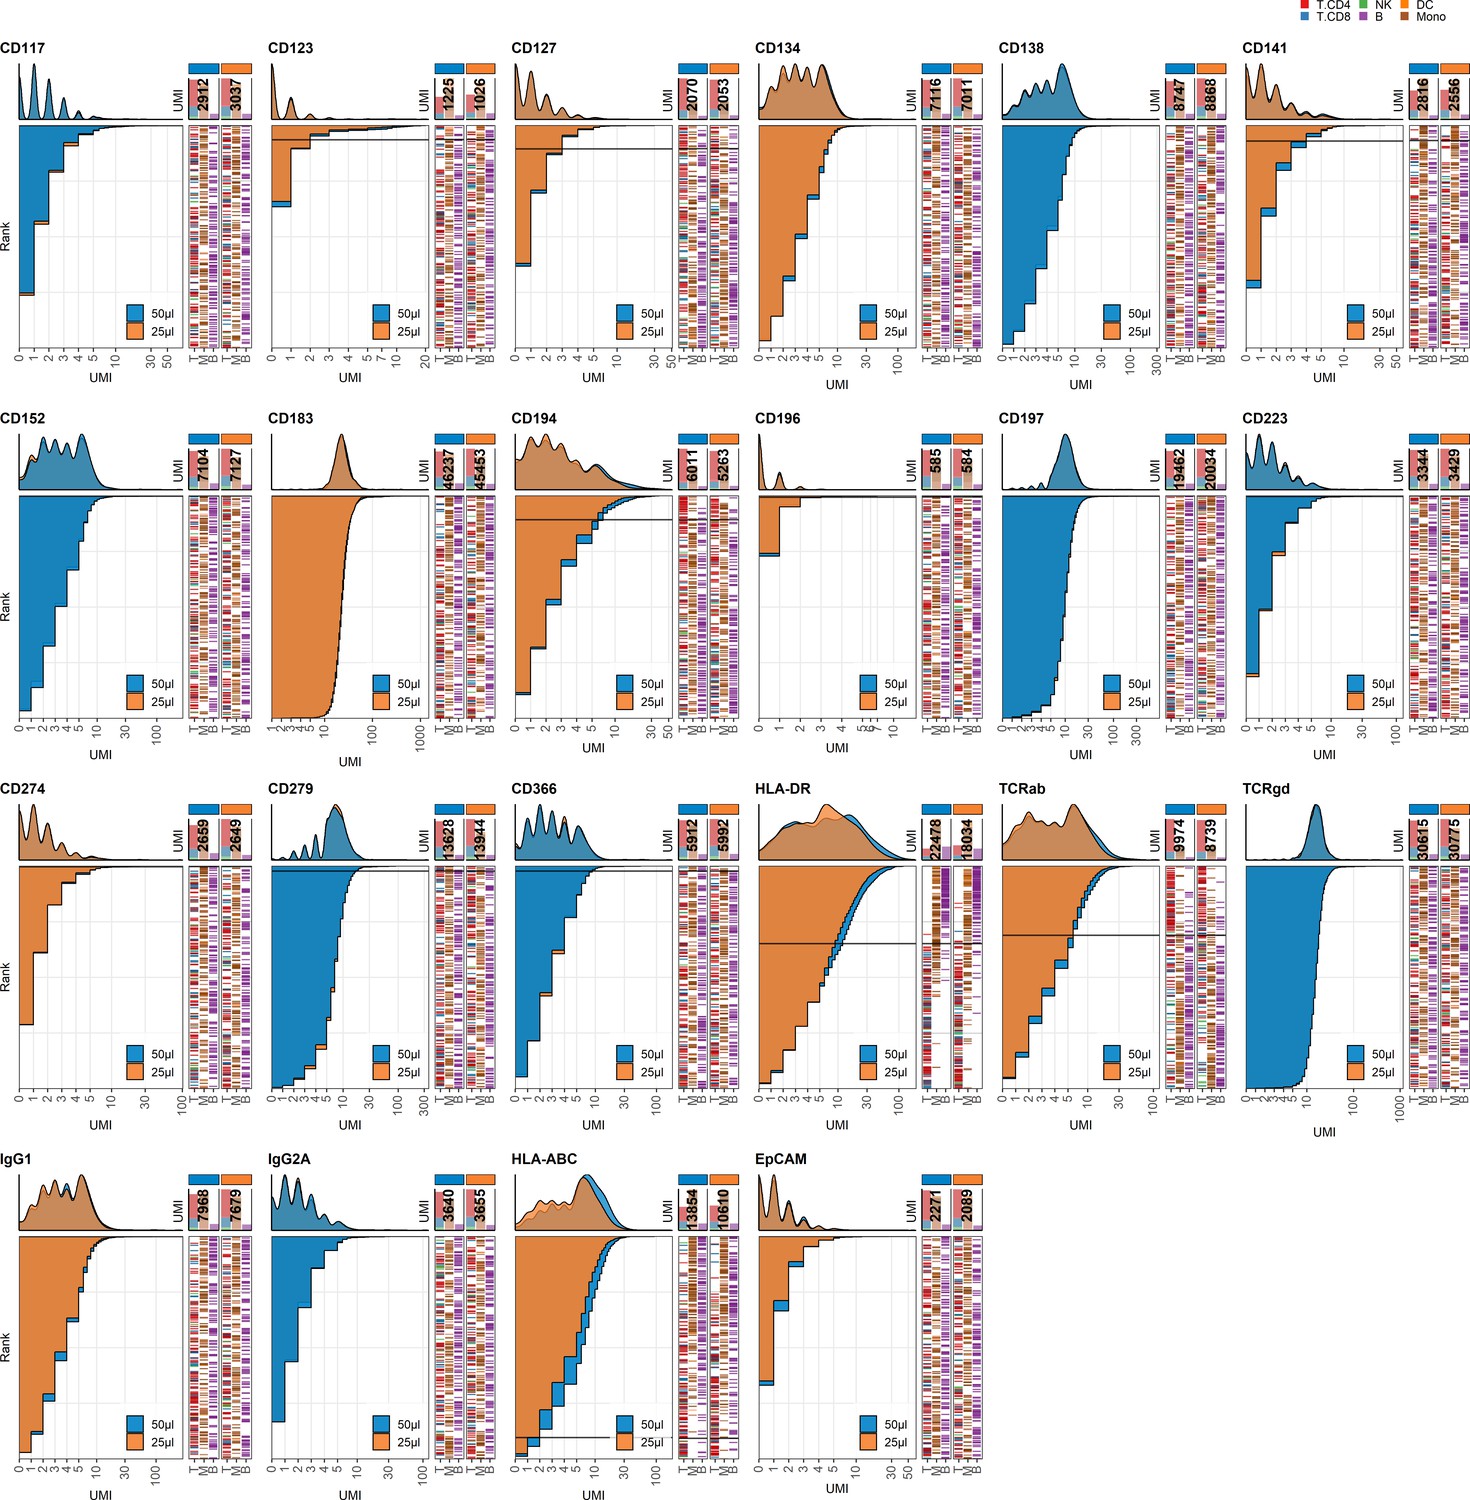
Response of individual antibodies to reduction in staining volume.
Titration plots (unique molecular identifier [UMI] count vs. cell rank) showing response to reducing staining volume from 50 µL to 25 µL. Histogram depicts distribution of UMIs at each condition colored by condition. Numbers within bar plot denote total UMI count within cell-containing droplets at each antibody concentration. Barcodes to the right depict cell type by color at the corresponding rank to visualize specificity of the antibody. Horizontal line depicts gating threshold for cells considered positive for the marker.
Figure 4 with 3 supplements
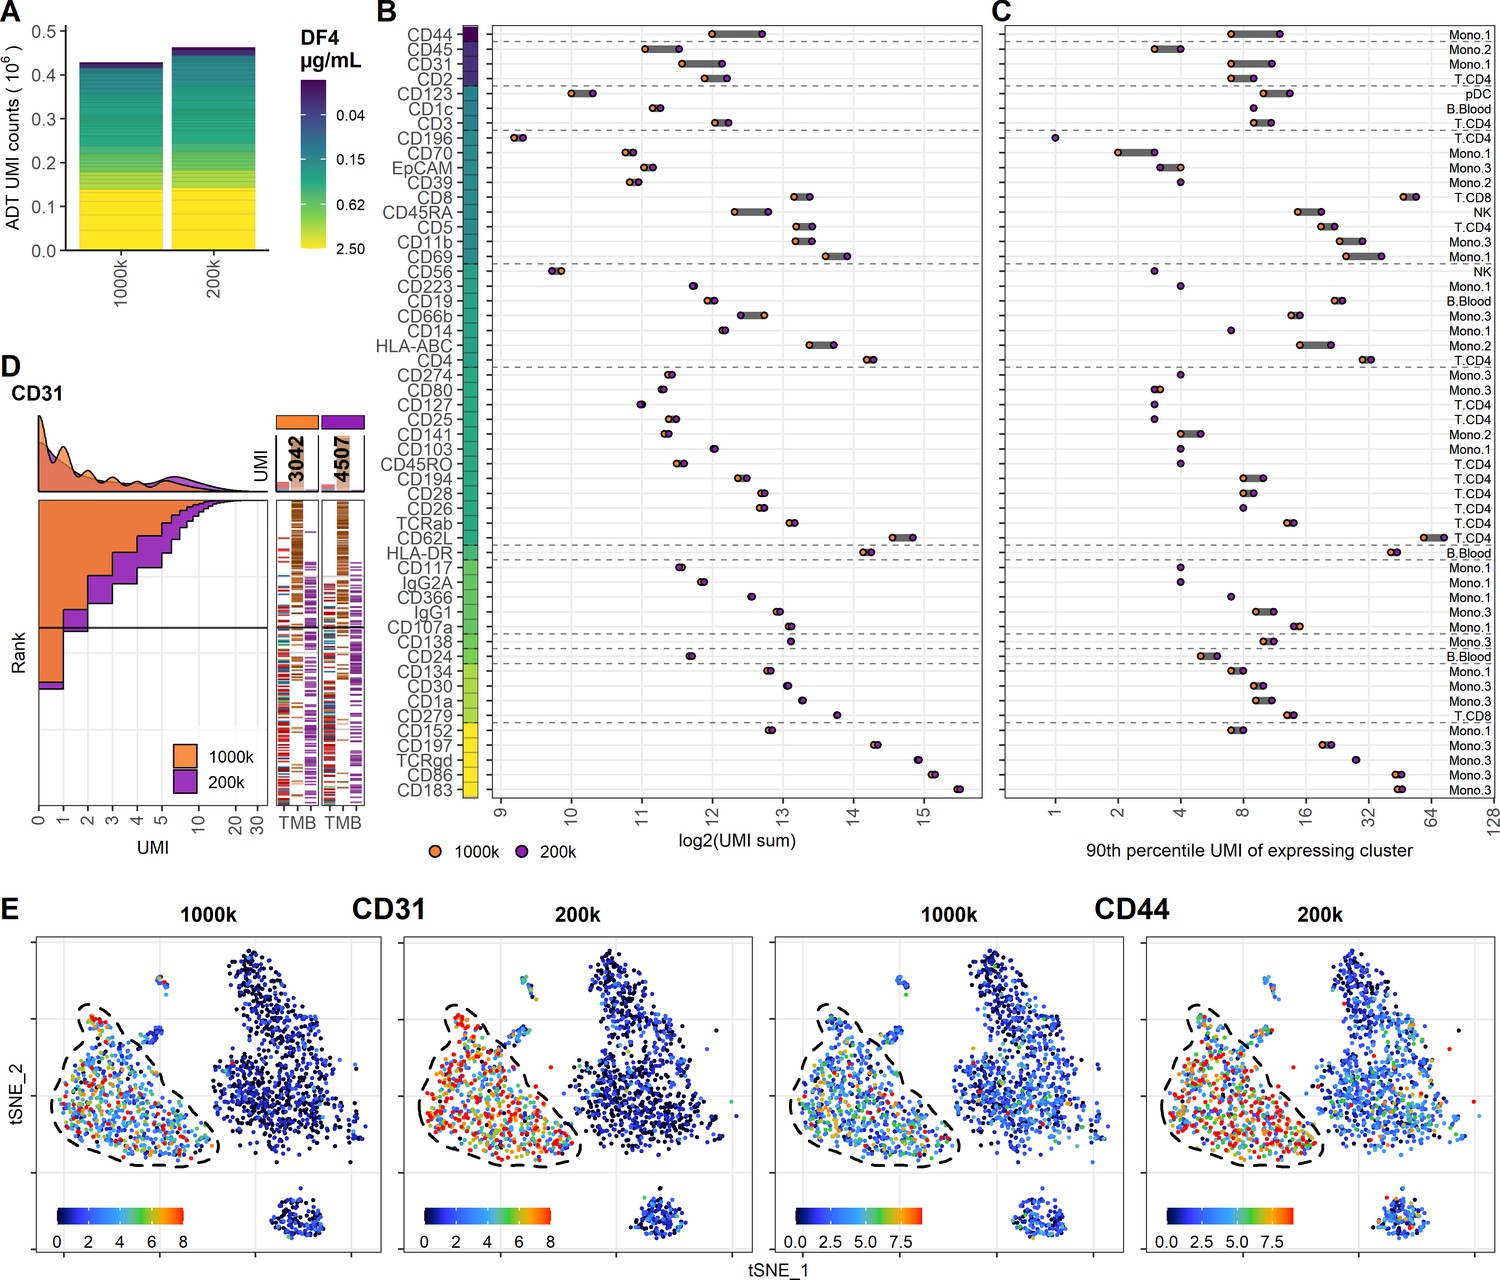
Reducing cell number during staining increases signal for antibodies at low concentration.
Comparison of peripheral blood mononuclear cell samples stained in 25 µL antibody staining solution at dilution factor 4 at two cell densities: 1 × 10⁶ (1000k; same sample as 25 µL in Figure 3) or 0.2 × 10⁶ (200k) cells. (A) Summarized unique molecular identifier (UMI) counts within cell-containing droplets segmented by the individual antibodies colored by their concentration. (B, C) Change in antibody-derived tag signal for each antibody by reducing cell numbers at staining from 1 × 10⁶ to 0.2 × 10⁶ cells. Individual antibodies are colored by their concentration. Quantified by (B) sum of UMIs within cell-containing droplets assigned to each antibody and (C) 90th percentile UMI count within cell type with most abundant expression (the assayed cell type is annotated to the right). (D) Titration plot (marker UMI count vs. normalized cell rank) for CD31 signal response when reducing cell numbers at staining from 1 × 10⁶ to 0.2 × 10⁶ cells. Histogram depicts distribution of UMIs at each condition. Barcodes to the right depict cell-type occurrence at the corresponding rank to visualize cell specificity of the antibody. Numbers on top of the small bar plot denote total UMI count assigned to CD31 within cell-containing droplets from each condition. (E) Non-normalized UMI counts visualized on t-distributed stochastic neighbor embedding (tSNE) plot of CD31 and CD44 that are affected by the reduction in staining volume, mitigated by a concomitant reduction in cell density. Dashed line indicates the region where expression levels vary between cell densities. Titration plots for all markers can be found in Figure 4—figure supplements 1 and 2.
Figure 4—figure supplement 1

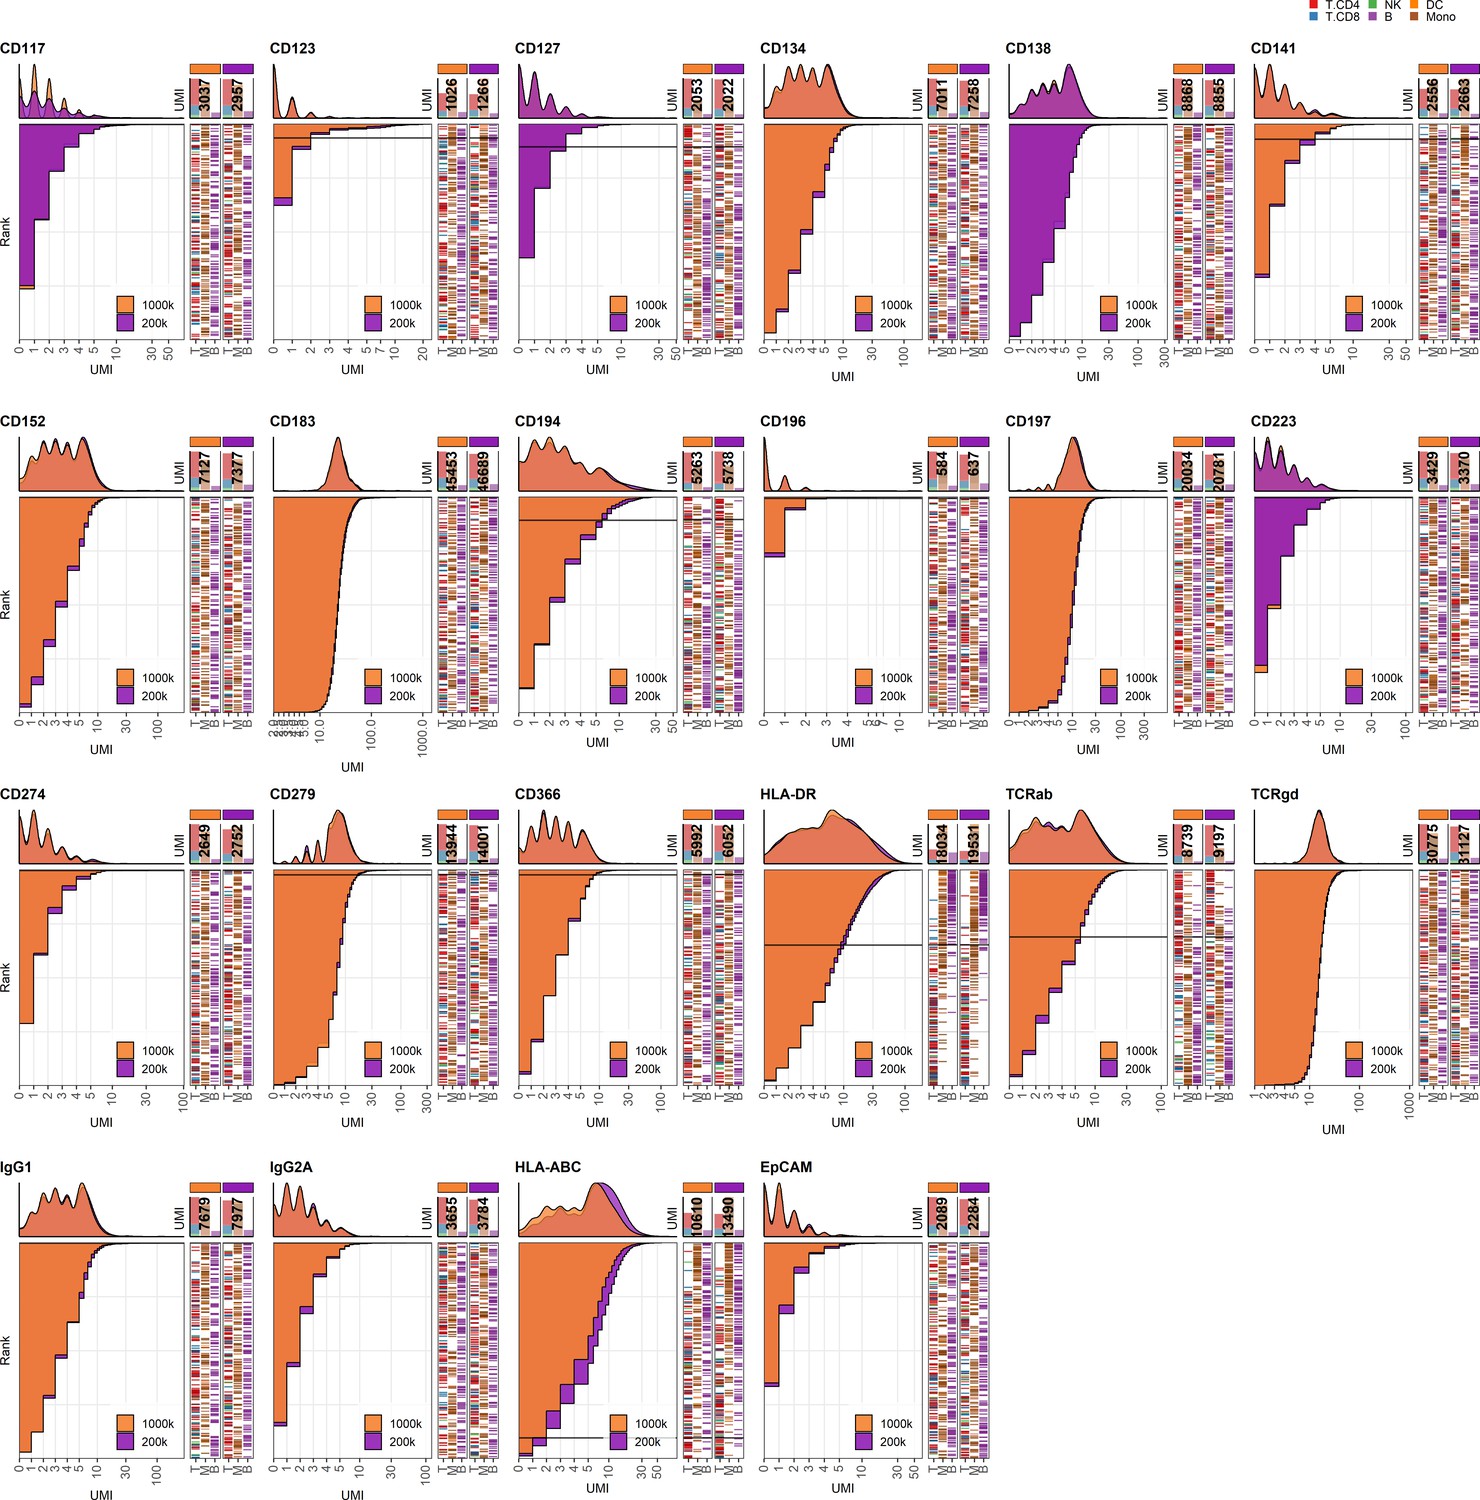
Response of individual antibodies to reduction in cell numbers at staining.
Titration plots (marker unique molecular identifier [UMI] count vs. cell rank) showing response to reducing cell numbers at staining from 1 × 10⁶ to 0.2 × 10⁶ cells. Histogram depicts distribution of UMIs at each condition colored by condition. Numbers within bar plot denote total UMI count within cell-containing droplets at each antibody concentration. Barcodes to the right depict cell type by color at the corresponding rank to visualize specificity of the antibody. Horizontal line depicts gating threshold for cells considered positive for the marker.
Figure 4—figure supplement 2
Response of individual antibodies to reduction in cell numbers at staining.
Titration plots (marker unique molecular identifier [UMI] count vs. cell rank) showing response to reducing cell numbers at staining from 1 × 10⁶ to 0.2 × 10⁶ cells. Histogram depicts distribution of UMIs at each condition colored by condition. Numbers within bar plot denote total UMI count within cell-containing droplets at each antibody concentration. Barcodes to the right depict cell type by color at the corresponding rank to visualize specificity of the antibody. Horizontal line depicts gating threshold for cells considered positive for the marker.
Figure 4—figure supplement 3
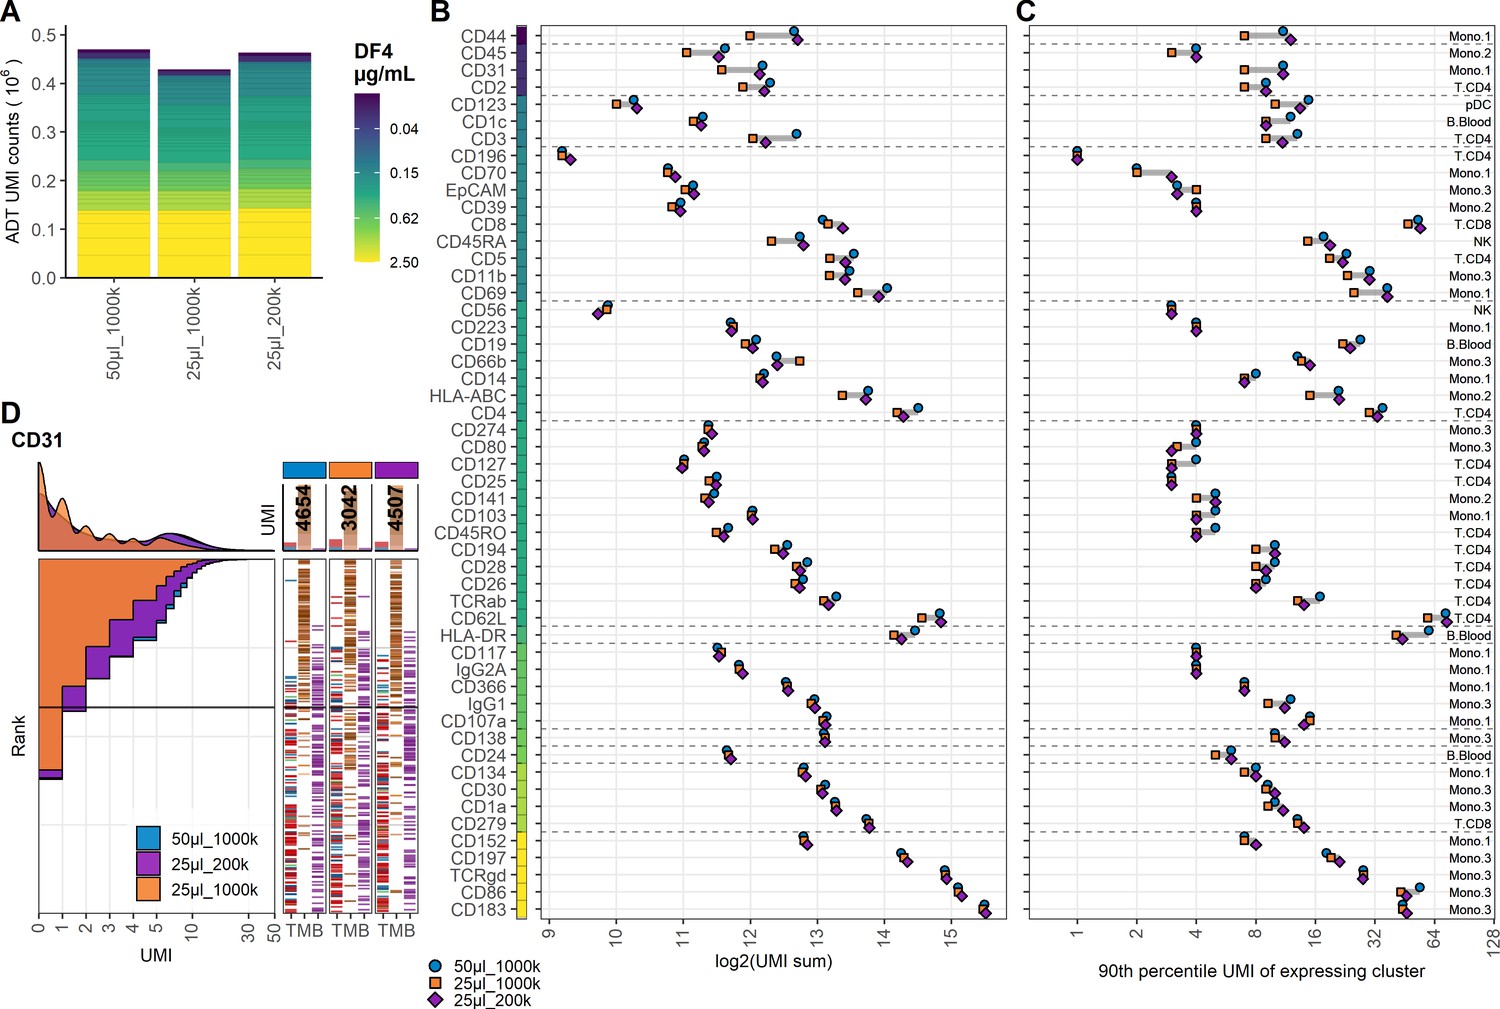
Fivefold reduction in cell density mitigates but does not supersede twofold reduction in staining volume.
Comparison of peripheral blood mononuclear cell samples stained in 50 µL, 25 µL, and 25 µL antibody staining solution at dilution factor 4 at cell densities: 1 × 10⁶ (50 µL_1000k), 1 × 10⁶ (25 µL_1000k), or 0.2 × 10⁶ (25 µL_200k) cells, respectively. (A) Summarized unique molecular identifier (UMI) counts within cell-containing droplets segmented by the individual antibodies colored by their concentration. (B, C) Antibody-derived tag signal for each antibody at each condition. Individual antibodies are colored by their concentration. Quantified by (B) sum of UMIs within cell-containing droplets assigned to each antibody and (C) 90th percentile UMI count within cell cluster with most abundant expression (the assayed cluster is annotated to the right). (D) Titration plot (marker UMI count vs. cell rank) showing response to changing staining volume and/or cell density. Histogram depicts distribution of UMIs at each condition colored by condition. Numbers on top of the small bar plot denote total UMI count assigned to CD31 within cell-containing droplets from each sample. Barcodes to the right depict cell type by color at the corresponding rank to visualize specificity of the antibody. Horizontal line depicts gating threshold for cells considered positive for CD31.
Figure 5 with 5 supplements
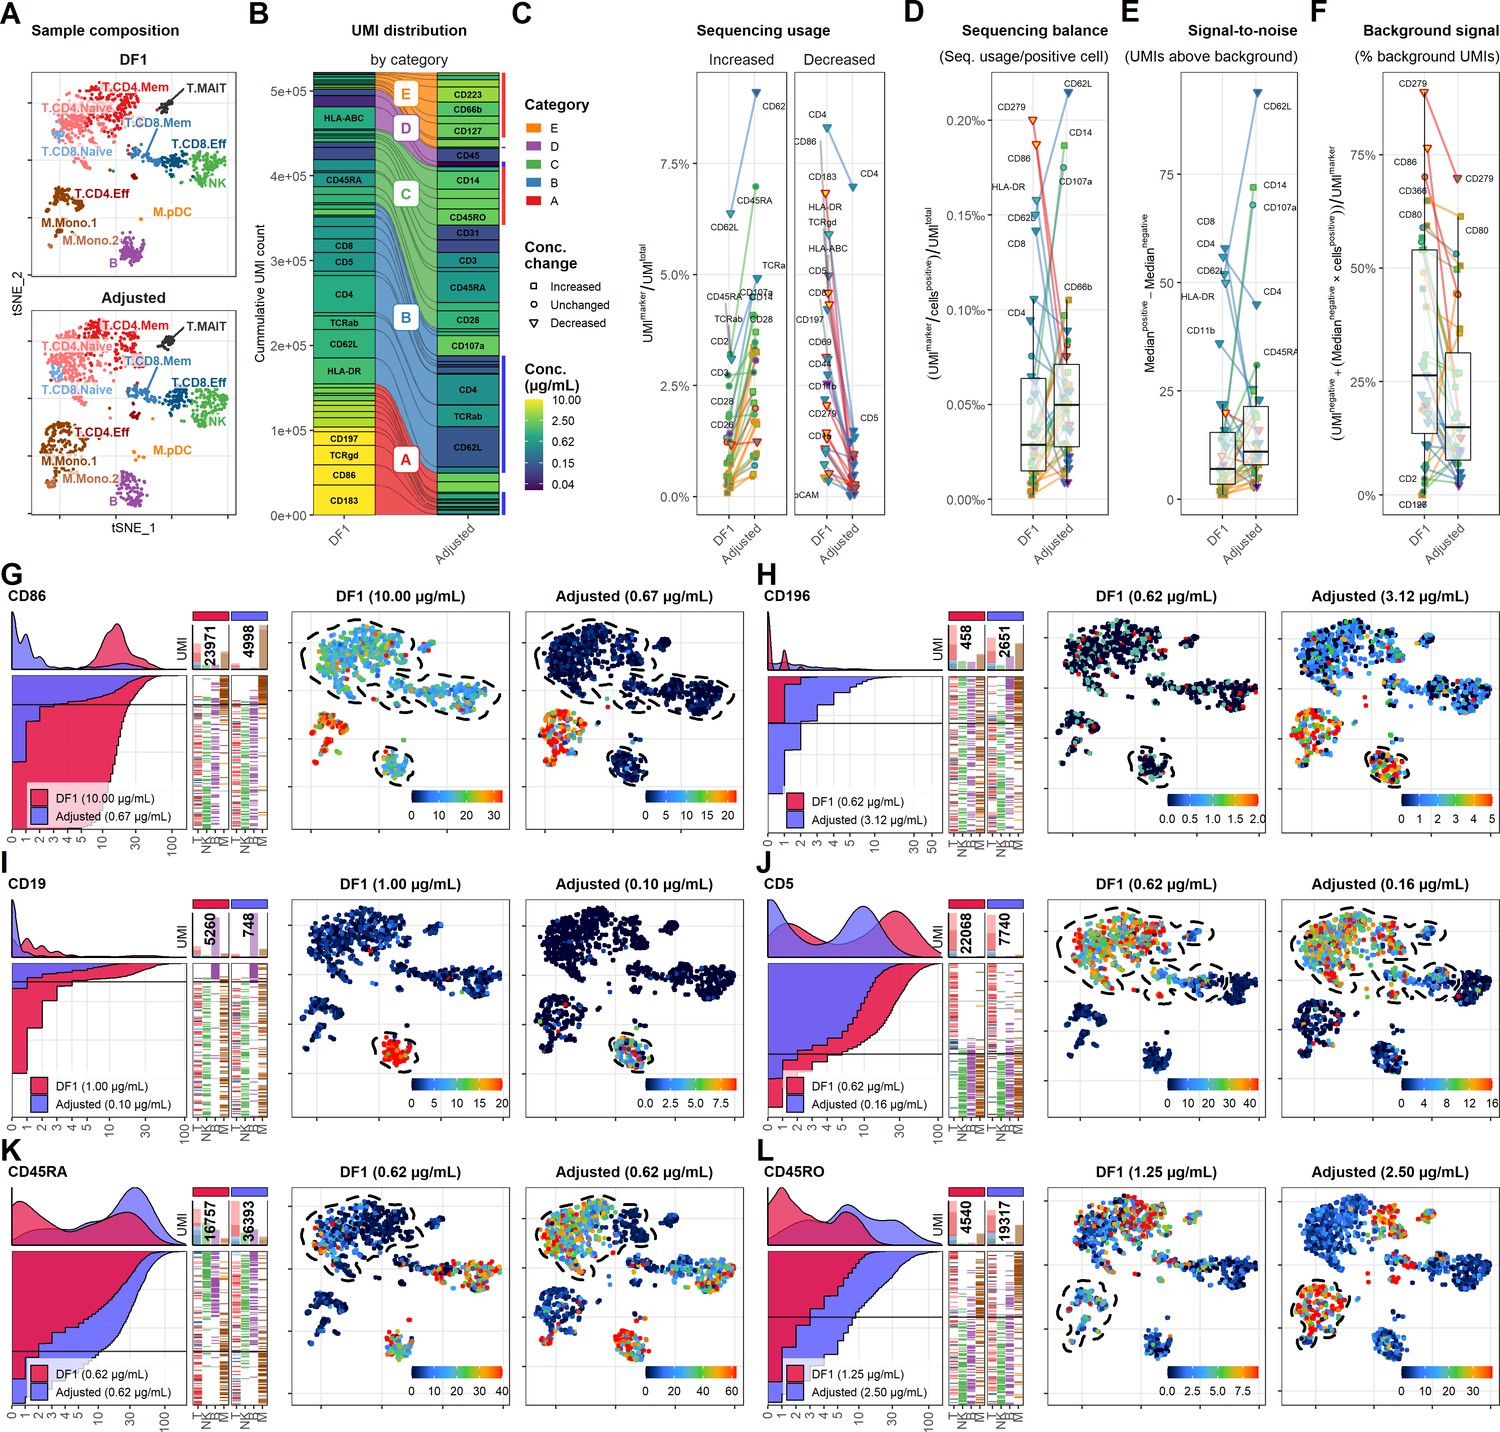
Adjusting antibody concentrations increases signal, lowers background, and reduces costs and sequencing requirements.
(A) Single cells from the dilution factor (DF) 1 and adjusted sample were integrated and selected to yield similar number of cells within each annotated cell type, visualized by t-distributed stochastic neighbor embedding (tSNE). (B) Antibody-derived tag reads from DF1 and adjusted samples were subsampled to yield similar number of unique molecular identifiers (UMIs) within the selected cells. Size of each segment shows the distribution of UMIs among the antibodies in the panel divided into categories that determined how they were adjusted (Table 1). (C–F) Response of adjustment of individual antibodies assayed by (C) their overall sequencing usage (fraction of UMIs assigned to each marker), (D) balancing (percent of UMIs used per positive cell), (E) signal-to-noise (difference in median UMI count within positive and negative cells), and (F) background signal (percentage of UMIs used for background signal). Shapes of marker denote whether the antibody concentration was changed between the DF1 and adjusted sample. Color of ‘shapes’ denotes antibody concentration. Color of connecting lines denotes antibody category. Center line in box plot denotes the median. (G–L) Titration plot (left) and tSNE plots showing raw UMI counts (right) for antibodies in different categories. Dashed lines indicate regions of interest highlighting the differences (or lack thereof) between the DF1 and adjusted samples. Titration plots for all markers by category can be found in Figure 5—figure supplements 1–5.
Figure 5—figure supplement 1
Dilution factor (DF) 1 vs.adjusted antibody concentration comparisons – category A.
Titration plots (left; marker unique molecular identifier [UMI] count vs. cell rank) and t-distributed stochastic neighbor embedding (tSNE) plots colored by raw UMI counts (right) showing response to changing the antibody concentration from DF1 to the adjusted sample for markers assigned to category A. Within titration plots, histogram depicts distribution of UMIs at each condition colored by sample (and annotated with antibody concentration). Numbers within bar plot denote total UMI count within cells at each antibody concentration. Barcodes to the right depict cell type by color at the corresponding rank to visualize cell-type specificity of the antibody. Horizontal line depicts gating threshold for cells considered positive for the marker.
Figure 5—figure supplement 2

Dilution factor (DF) 1 vs. adjusted antibody concentration comparisons – category B.
Titration plots (left; marker unique molecular identifier [UMI] count vs. cell rank) and t-distributed stochastic neighbor embedding (tSNE) plots colored by raw UMI counts (right) showing response to changing the antibody concentration from DF1 to the adjusted sample for markers assigned to category B. Within titration plots, hHistogram depicts distribution of UMIs at each condition colored by sample (and annotated with antibody concentration). Numbers within bar plot denote total UMI count within cells at each antibody concentration. Barcodes to the right depict cell type by color at the corresponding rank to visualize cell-type specificity of the antibody. Horizontal line depicts gating threshold for cells considered positive for the marker.
Figure 5—figure supplement 3

Dilution factor (DF) 1 vs. adjusted antibody concentration comparisons – category C.
Titration plots (left; marker unique molecular identifier [UMI] count vs. cell rank) and t-distributed stochastic neighbor embedding (tSNE) plots colored by raw UMI counts (right) showing response to changing the antibody concentration from DF1 to the adjusted sample for markers assigned to category C. Within titration plots, histogram depicts distribution of UMIs at each condition colored by sample (and annotated with antibody concentration). Numbers within bar plot denote total UMI count within cells at each antibody concentration. Barcodes to the right depict cell type by color at the corresponding rank to visualize cell-type specificity of the antibody. Horizontal line depicts gating threshold for cells considered positive for the marker.
Figure 5—figure supplement 4
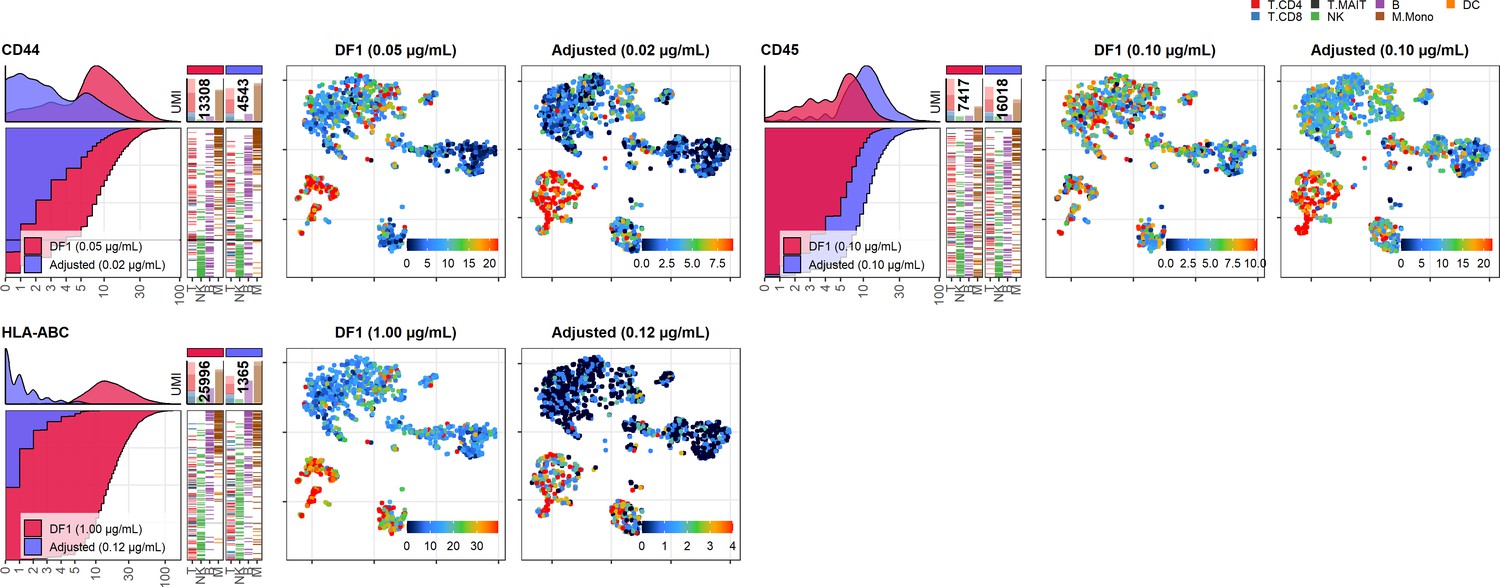
Dilution factor (DF) 1 vs. adjusted antibody concentration comparisons – category D.
Titration plots (left; marker unique molecular identifier [UMI] count vs. cell rank) and t-distributed stochastic neighbor embedding (tSNE) plots colored by raw UMI counts (right) showing response to changing the antibody concentration from DF1 to the adjusted sample for markers assigned to category D. Within titration plots, histogram depicts distribution of UMIs at each condition colored by sample (and annotated with antibody concentration). Numbers within bar plot denote total UMI count within cells at each antibody concentration. Barcodes to the right depict cell type by color at the corresponding rank to visualize cell-type specificity of the antibody. Horizontal line depicts gating threshold for cells considered positive for the marker.
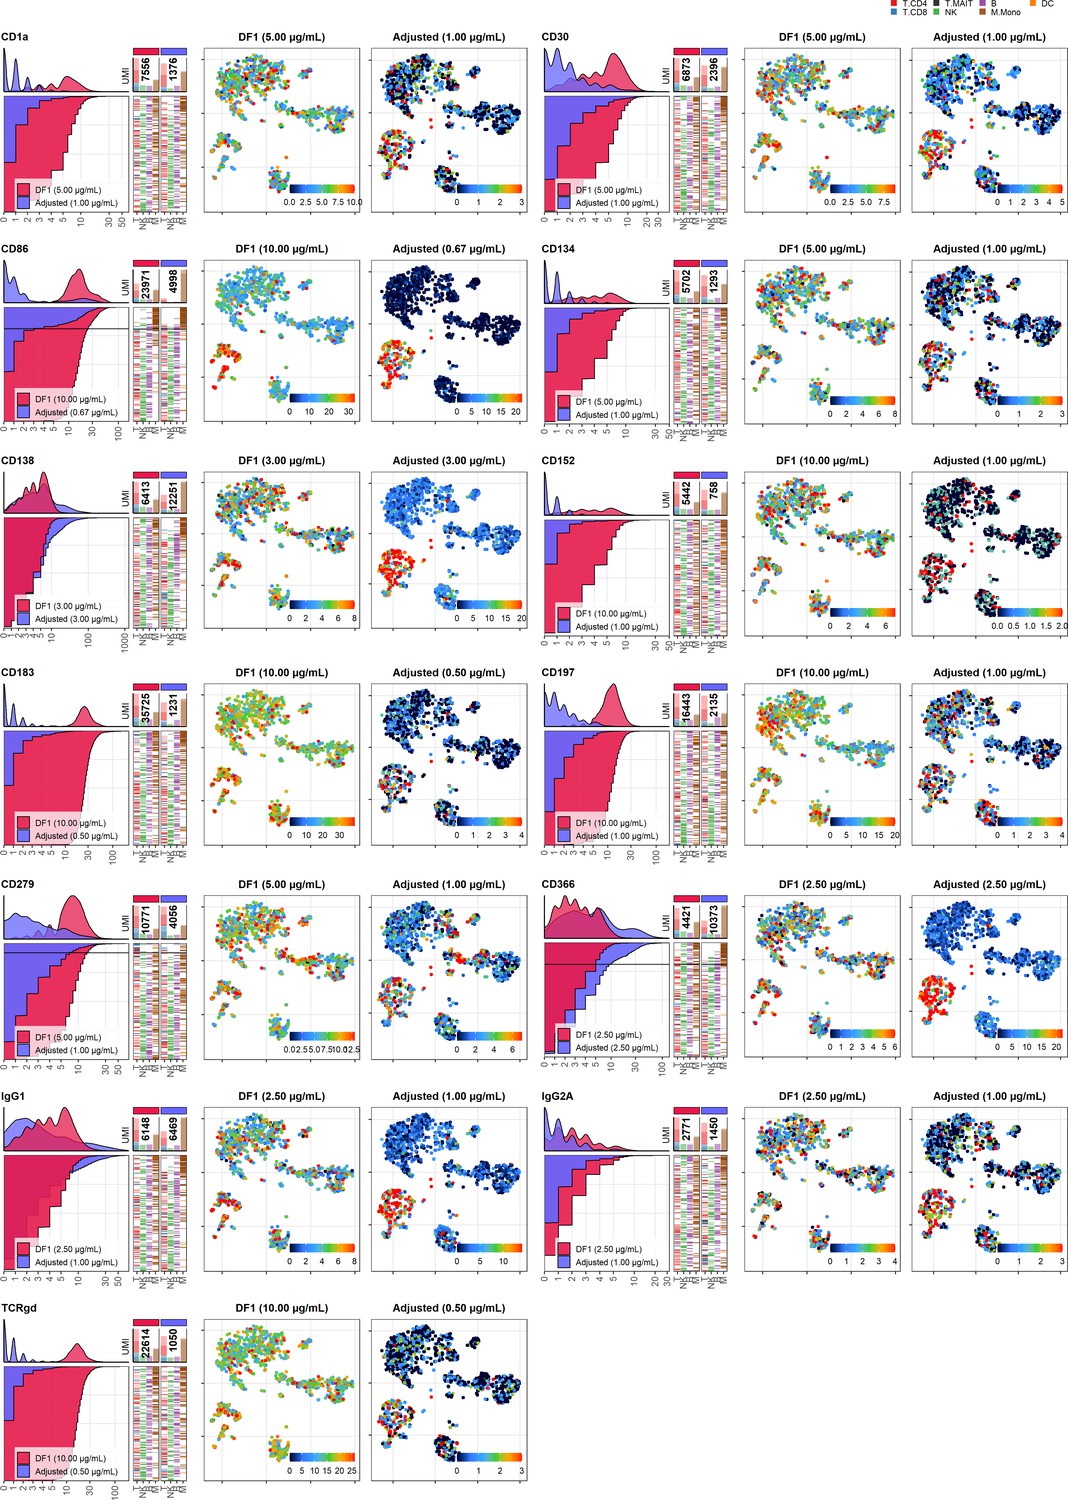
Figure 5—figure supplement 5
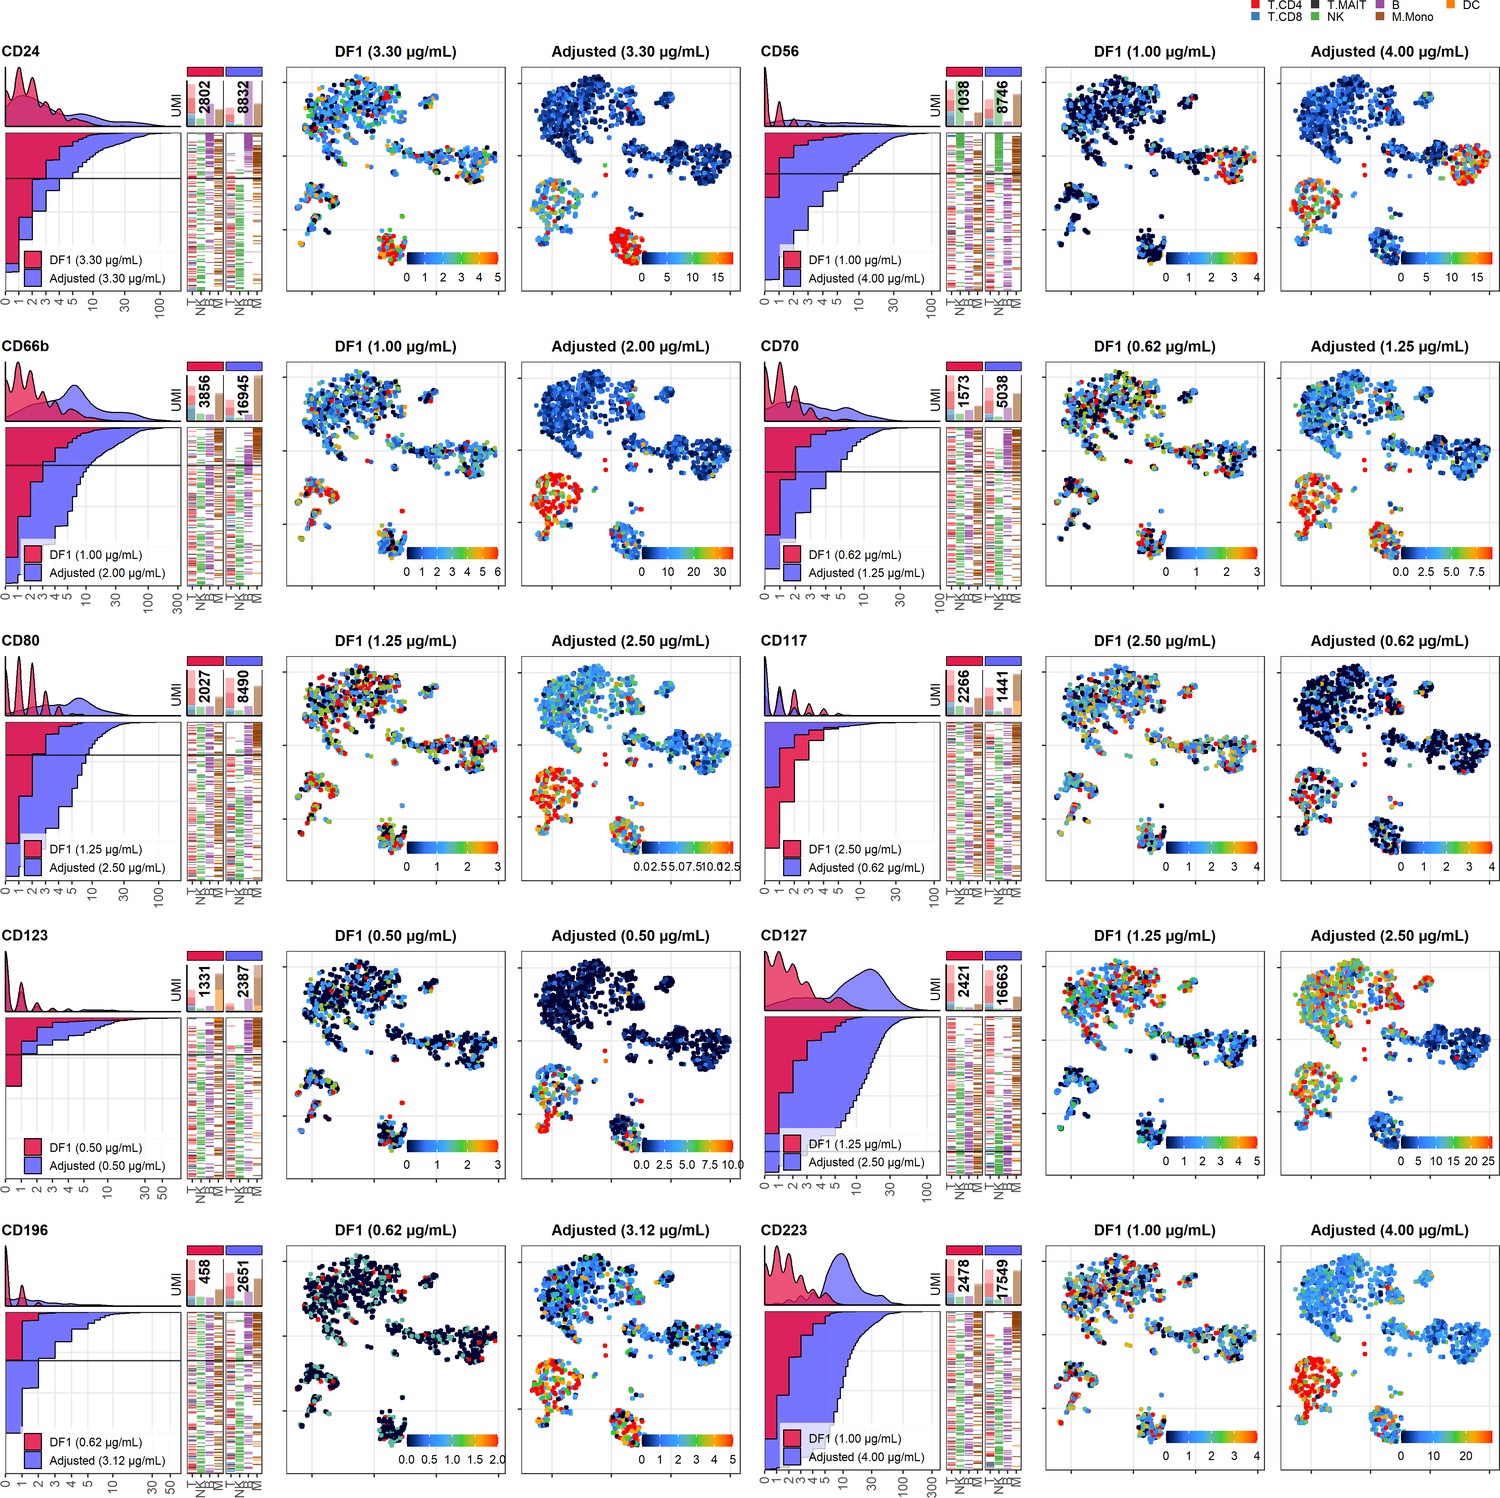
Dilution factor (DF) 1 vs. adjusted antibody concentration comparisons – category E.
Titration plots (left; marker unique molecular identifier [UMI] count vs. cell rank) and t-distributed stochastic neighbor embedding (tSNE) plots colored by raw UMI counts (right) showing response to changing the antibody concentration from DF1 to the adjusted sample for markers assigned to category E. Within titration plots, histogram depicts distribution of UMIs at each condition colored by sample (and annotated with antibody concentration). Numbers within bar plot denote total UMI count within cells at each antibody concentration. Barcodes to the right depict cell type by color at the corresponding rank to visualize cell-type specificity of the antibody. Horizontal line depicts gating threshold for cells considered positive for the marker.
Figure 6 with 4 supplements
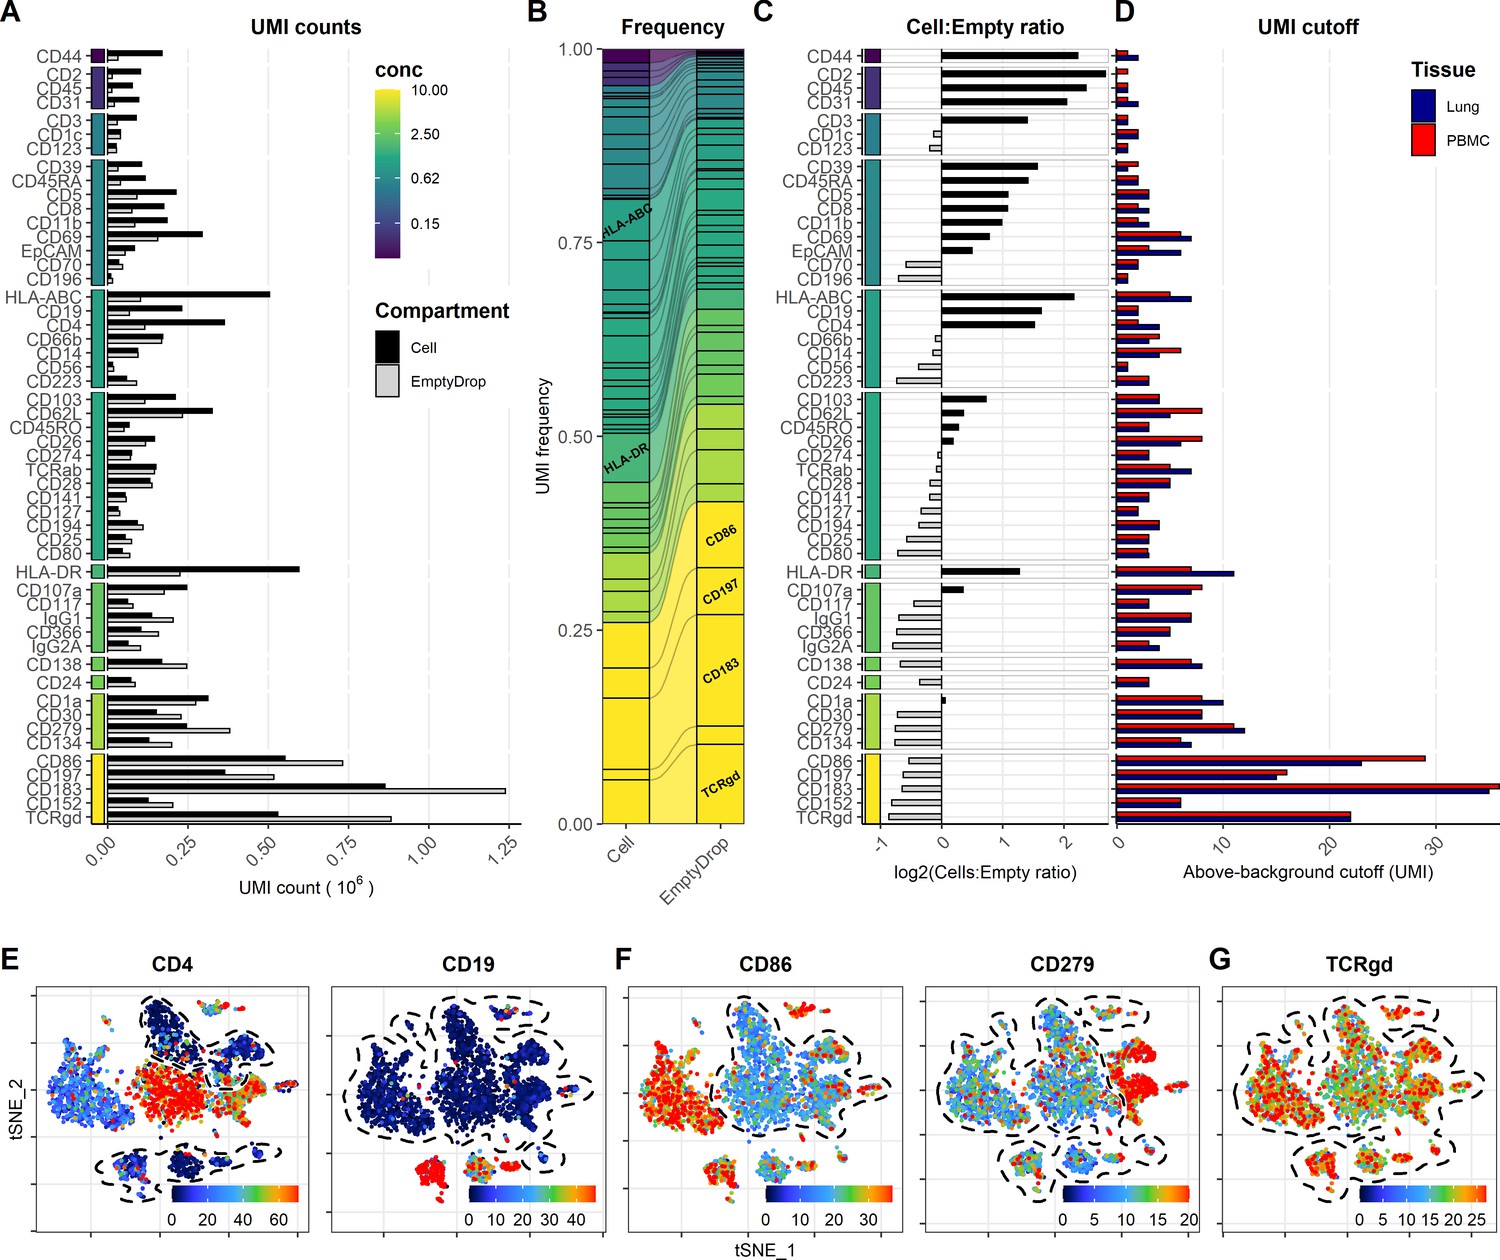
Background signal from oligo-conjugated antibodies is dependent on concentration and presence of epitopes.
Signal from free-floating antibodies in the cell suspension is a major source of background in droplet-based scRNA-seq and can be assayed by their signal within non-cell-containing (empty) droplets. (A, B) Comparison of signal from each antibody within cell-containing and empty droplets (identified in Figure 6—figure supplement 1) by (A) their total unique molecular identifier (UMI) counts or (B) their relative frequency within each compartment. Color bar denotes antibody concentration at dilution factor 1 (DF1). (C) Ratio of UMI frequencies of each marker between cell-containing and empty droplets. Markers with black bars have greater frequency in cell-containing droplets, whereas gray bars have greater frequency in empty droplets. (D) UMI thresholds for detection above-background for each marker within peripheral blood mononuclear cells and lung tumor samples (based on gating in Figure 1—figure supplement 2). (E–G) Examples of t-distributed stochastic neighbor embedding (tSNE) plots showing non-normalized (raw) UMI counts from cells stained at DF1 for (E) markers with low background, (F) markers with high background that still exhibit cell-type-specific signal (CD86 and CD279), and (G) markers where positive signal is absent or obscured by the background. Regions of background signal are encircled by dashed lines. To make the color scale in the tSNE plots less sensitive to extreme values, we set the upper threshold to the 90% percentile. tSNE plots for all markers can be found in Figure 6—figure supplements 3 and 4.
Figure 6—figure supplement 1

Quantifying unique molecular identifiers (UMIs) within cells and empty droplets of antibody-derived tag (ADT) and hashtag-oligo (HTO).
Knee plots (barcode rank vs. total UMIs within barcode) for mRNA, ADT, and HTO libraries. Cell-containing droplets were filtered based on the total UMI count at the inflection point in the mRNA plot. Red lines depict the position of rank 18039, largely corresponding to the cutoff for cell-containing droplets.
Figure 6—figure supplement 2
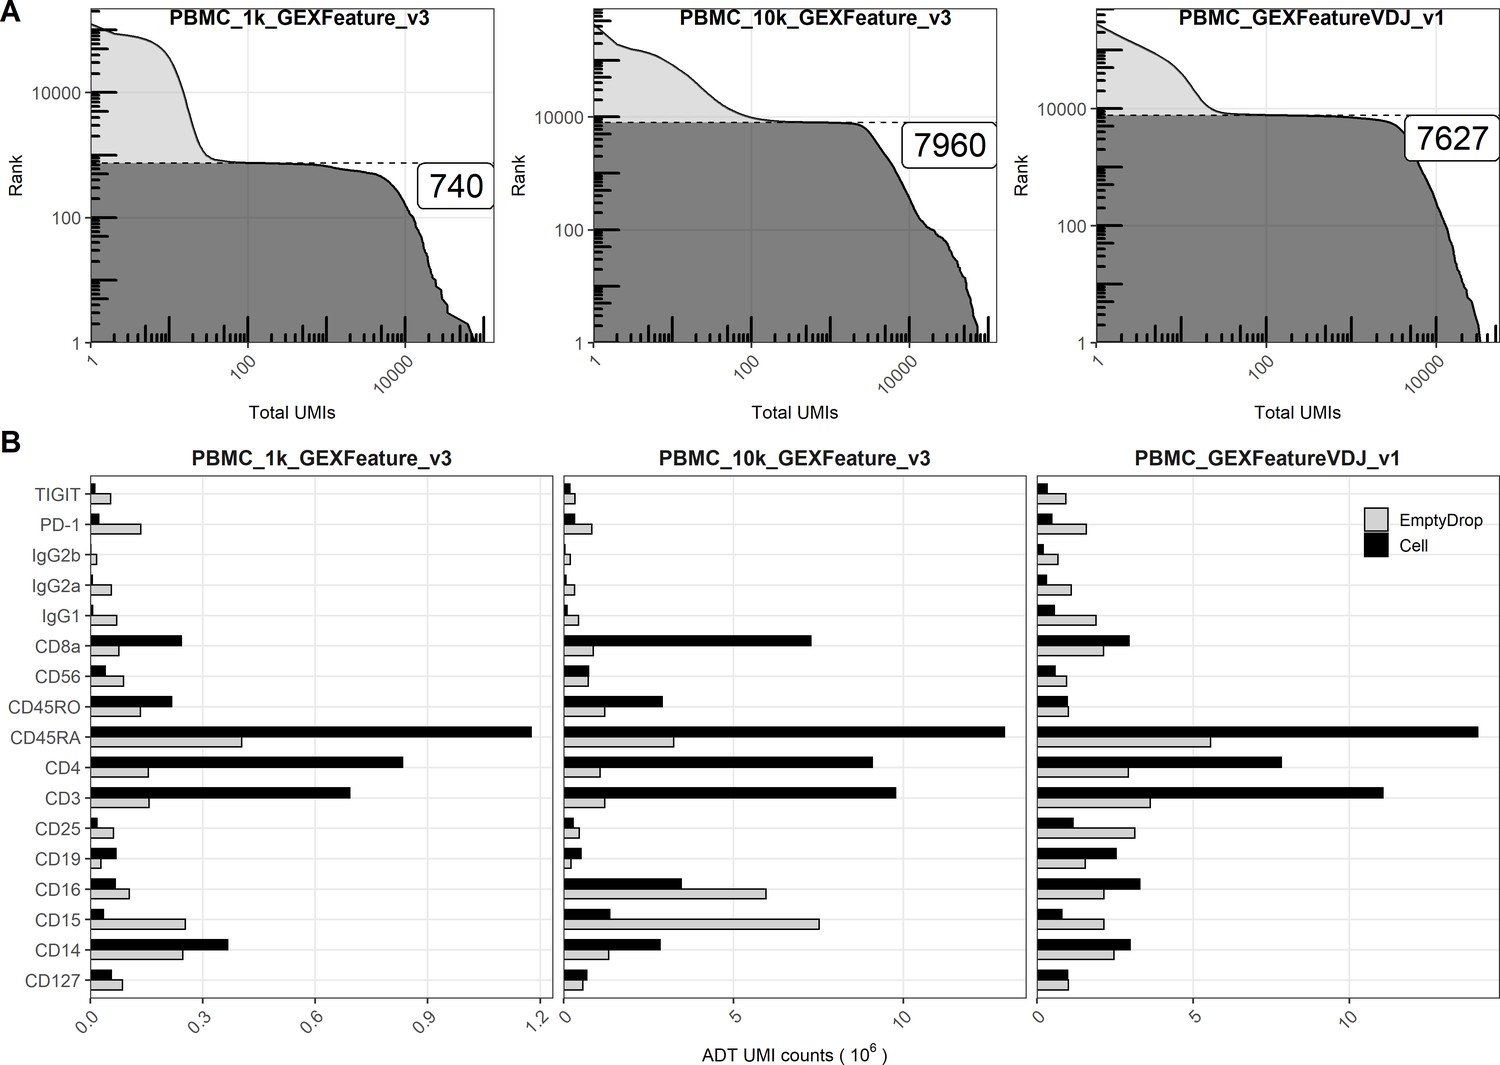
Quantifying unique molecular identifiers (UMIs) within cell-containing and empty droplets from public 10X datasets.
(A) Knee plots (barcode rank vs. total UMIs within barcode) for mRNA libraries within three publicly available single-cell RNA sequencing runs (from the 10X Genomics website) showing filtering of cell-containing and empty droplets based on the total UMI count at the inflection point. (B) Total UMI counts for the individual antibodies from each of the antibody-derived tag libraries within cell-containing and empty droplets.
Figure 6—figure supplement 3

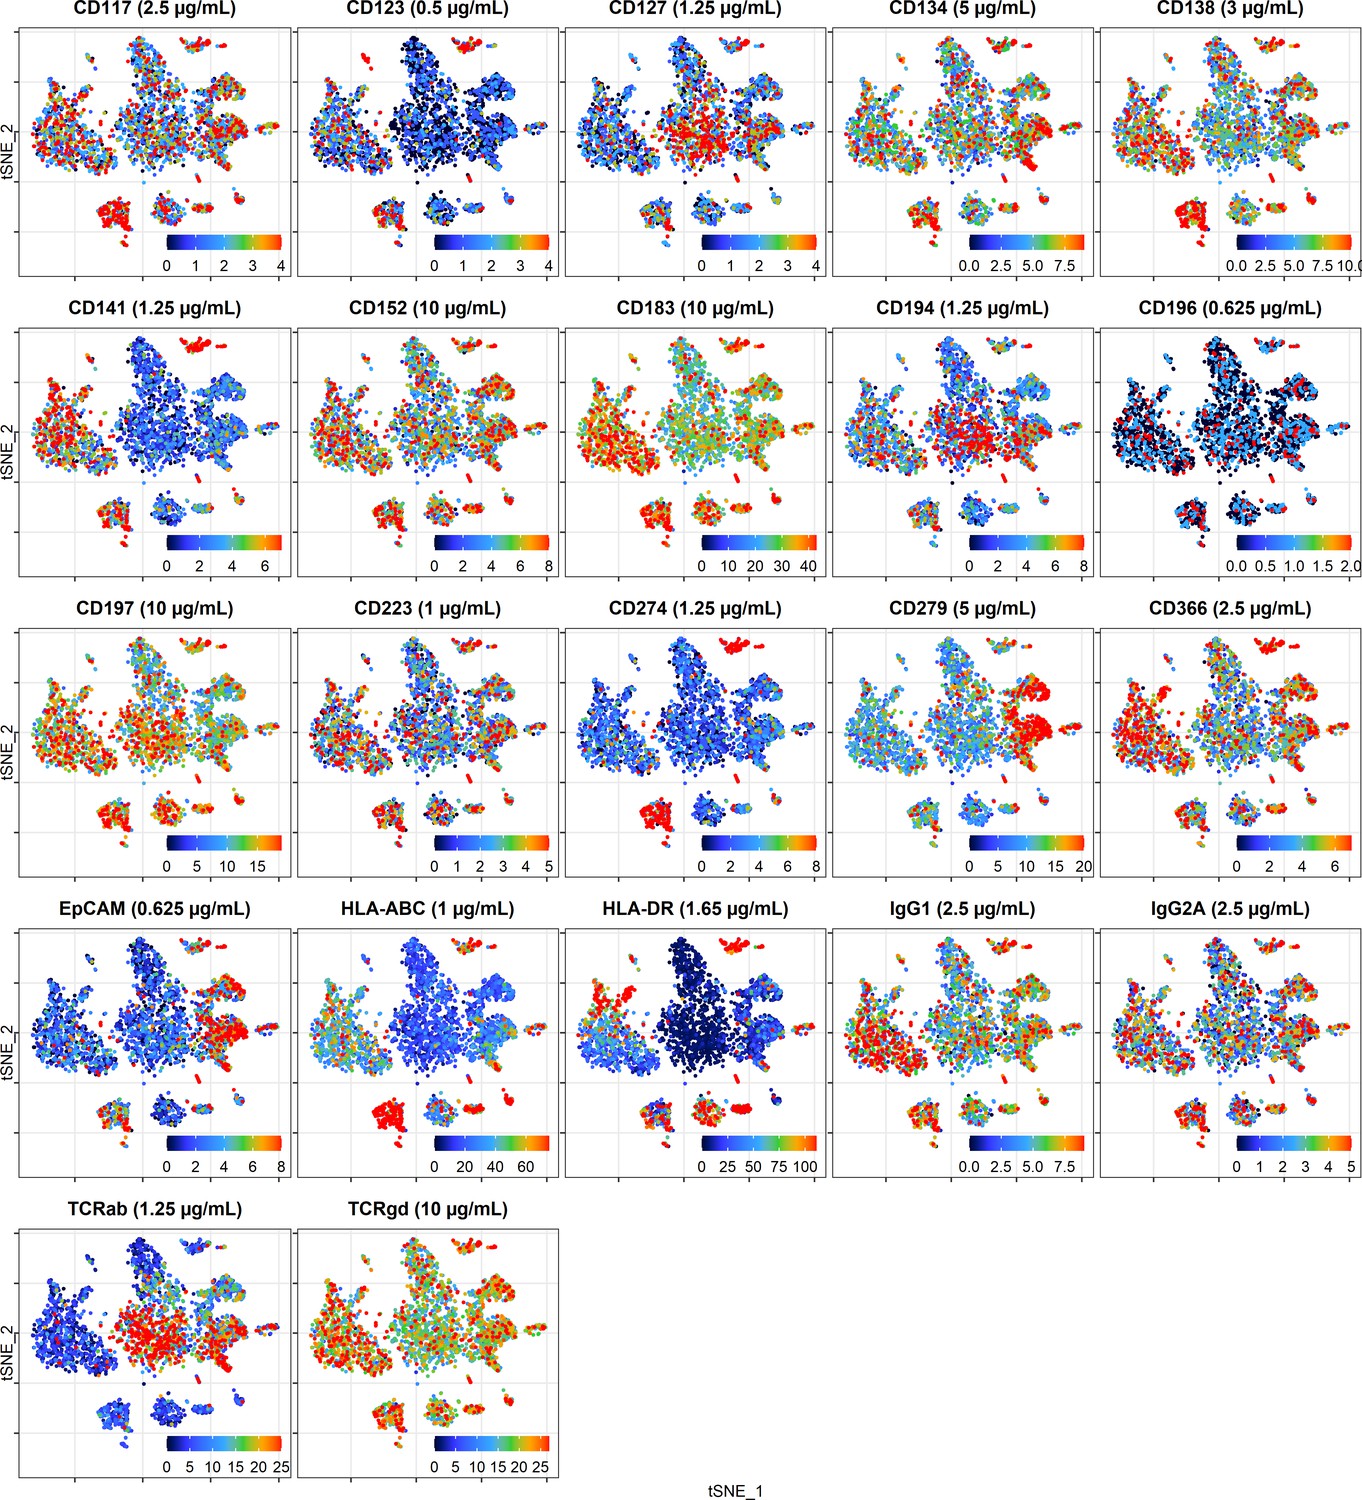
Cellular distribution of ADT signal visualized by t-distributed stochastic neighbor embedding (tSNE) plots displaying raw (unnormalized) UMI counts from the cells stained at dilution factor 1 for each antibody.
To make the color scale less sensitive to outliers, we set upper threshold at the 90% percentile.
Figure 6—figure supplement 4
Cellular distribution of ADT signal visualized by t-distributed stochastic neighbor embedding (tSNE) plots displaying raw (unnormalized) UMI counts from the cells stained at dilution factor 1.
To make the color scale less sensitive to outliers, we set upper threshold at the 90% percentile.
Author response image 1
Author response image 2
Author response image 3
Tables
Table 1
Five categories of response to fourfold dilution.
| Categories | Responses to fourfold dilution | Markers | Considerations |
|---|---|---|---|
| A (Figure 2A) | Antibodies exhibiting no response to dilution, indicating that the positive signal is fully saturated, absent, or obscured within high background signal. | CD1a, CD30, CD86, CD134, CD138, CD152, CD183, CD197, CD279, CD336, IgG1, IgG2A, and TCRgd | Reducing antibody concentration is always the right choice. These antibodies sequester a large amount of unique molecular identifiers without yielding critical insight. Reducing concentration may reveal a true positive population obscured by the background signal. |
| B (Figure 2B) | Antibodies that respond by a reduction in signal but without hampering the ability to distinguish positive and negative fractions. | CD4, CD5, CD8, CD11b, CD19, CD62L, CD69, CD103, CD107a, CD194, CD274, EpCAM, HLA-DR, and TCRab | Reducing antibody concentrations will be economically beneficial with minimal loss of biological information. For instance, In the lung at dilution factor 1, HLA-DR uses 9% of the total unique molecular identifier counts within cell-containing droplets and can be reduced at least fourfold without any apparent change in ability to discriminate between positive and negative cells. |
| C (Figure 2C) | Antibodies that respond by a reduction in signal that subsequently changes the ability to distinguish positive from negative cells or bring the cutoff value for positive cells down to only a few unique molecular identifiers. | CD1c, CD2, CD3, CD14, CD25, CD26, CD28, CD31, CD39, CD45RA, CD45RO, and CD141 | Reducing antibody concentration will reduce biological information as cells expressing the targeted epitopes may not exhibit sufficient signal. If only cells expressing high levels of the marker need to exhibit signal, these can be slightly reduced. |
| D (Figure 2D) | Antibodies that respond linearly to titration but take up high numbers of unique molecular identifiers due to targeting (almost) ubiquitously expressed markers. | CD44, CD45, and HLA-ABC | These can be reduced if all cells exhibit high unique molecular identifier counts. Unless these markers have a clear purpose, most experiments will benefit from dropping them from the panel as they tend to sequester a large proportion of total sequencing reads with little biological information. |
| E (Figure 2E) | Antibodies where response is hard to assess due to not showing expected positive population either due to lack of epitopes (no positive cells in either tissue) or lack of antibody binding (non-functional antibody). | CD24, CD56, CD66b, CD70, CD80, CD117, CD123, CD127, CD196, and CD223 | Should be evaluated individually. Is there prior information indicating that this marker is expressed by cells in these types of samples? Do any cells in the sample express high levels of the gene encoding the targeted protein? If so, increasing the concentration of the antibody or trying a different clone may yield better signal. |
Additional files
-
Supplementary file 1
Antibody panel and concentrations. Table of the 52 antibodies included in the panel.
Also contains individual clones and concentrations used for the different conditions included in the study.
- https://cdn.elifesciences.org/articles/61973/elife-61973-supp1-v1.docx
-
Supplementary file 2
Antibody cost calculations.
Antibody costs of the 52 antibody panel using vendor recommendations for staining volume and concentrations, pre-titration (dilution factor 1) concentrations, and adjusted concentrations.
- https://cdn.elifesciences.org/articles/61973/elife-61973-supp2-v1.docx
-
Transparent reporting form
- https://cdn.elifesciences.org/articles/61973/elife-61973-transrepform-v1.pdf
Download links
A two-part list of links to download the article, or parts of the article, in various formats.
Downloads (link to download the article as PDF)
Open citations (links to open the citations from this article in various online reference manager services)
Cite this article (links to download the citations from this article in formats compatible with various reference manager tools)
Improving oligo-conjugated antibody signal in multimodal single-cell analysis
eLife 10:e61973.
https://doi.org/10.7554/eLife.61973


