DIAPH3 deficiency links microtubules to mitotic errors, defective neurogenesis, and brain dysfunction
- Université catholique de Louvain, Institute of Neuroscience, Developmental Neurobiology, Belgium
- Université catholique de Louvain, Institute of Neuroscience, Mammalian Development and Cell Biology, Belgium
- College of Health and Life Sciences, HBKU, Qatar
- Université catholique de Louvain, Institute of Neuroscience, Cell Physiology, Belgium
Figures
Figure 1 with 1 supplement
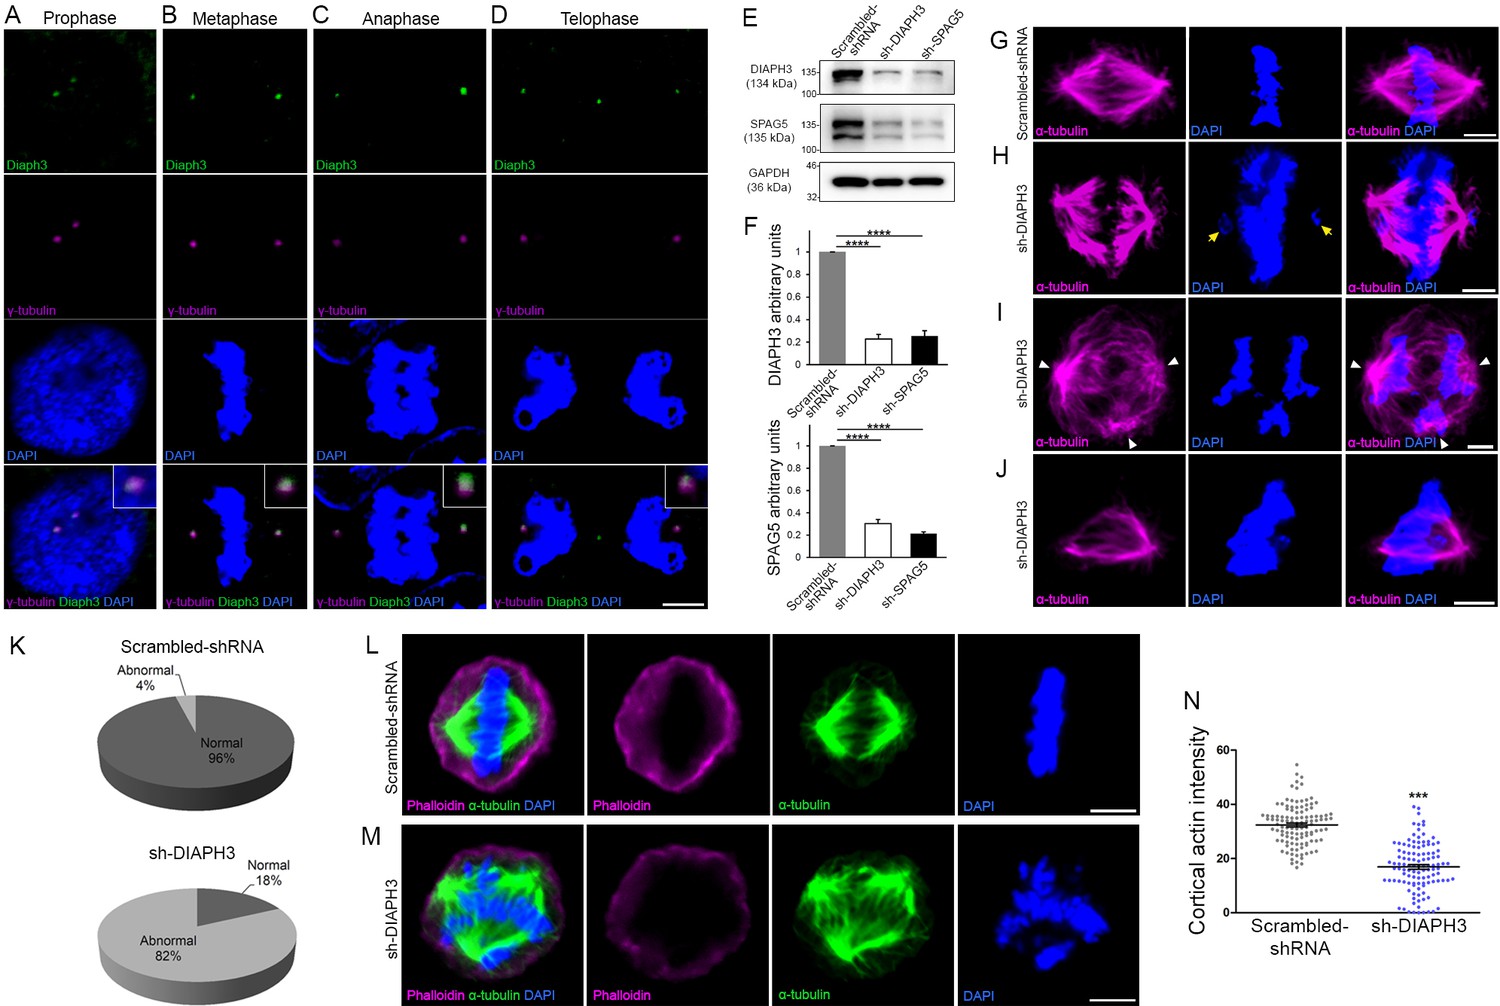
Loss of DIAPH3 disrupts the expression/stability of SPAG5 and causes mitotic defects.
(A–D) Immunostaining of U2OS cells at prophase (A), metaphase (B), anaphase (C), and telophase (D), with anti-DIAPH3 (green) and anti-γ tubulin (magenta). The chromosomes were counterstained with DAPI (blue). Diaphanous three (DIAPH3) localizes at the centrosome at all mitotic stages. Insets are zooms in the centrosomal region, showing that the DIAPH3 signal is pericentrosomal. Scale bar, 10 µm. n = 20 cells for each phase from three distinct experiments. (E, F) Western blot analysis of DIAPH3 and SPAG5 levels upon shRNA downregulation in U2OS cells. shRNA against DIAPH3 (sh-DIAPH3) significantly reduced the levels of DIAPH3 and SPAG5 proteins (p=0.000044 and 0.000046, respectively). Reciprocally, shRNA against SPAG5 (sh-SPAG5) reduced SPAG5 and DIAPH3 protein levels (p=0.000001 and 0.000097, respectively). Scrambled shRNA were used as control for the transfection and GAPDH as loading control. n = 3 independent experiments, Student’s t-test; error bars represent s.e.m. (G–J) Representative images of mitotic cells transfected with scrambled shRNA (G) and shRNA against DIAPH3 (sh-DIAPH3) (H–J), immunostained with anti-α tubulin (magenta). Chromosomes were counterstained with DAPI (blue). Yellow arrows in (H) point to lagging chromosomes. Arrowheads in (I) depict poles of mitotic spindle. (J) Representative image of a mitotic cell with disorganized/shrunk microtubule (MT), single centrosome/pole, and asymmetric metaphase plate. Scale bar, 5 µm. (K) Quantification of mitotic errors. 82% of DIAPH3 knockdown cells exhibit mitotic abnormalities (4% in control cells). n = 118 and 115 cells from five individual experiments of scrambled shRNA and sh-DIAPH3, respectively. (L–N) Diminished cortical actin in DIAPH3 knockdown cells. (L, M) Illustration of mitotic cells transfected with scrambled shRNA (L) or sh-DIAPH3 (M), and immunostained with phalloidin (magenta) and α-tubulin (green). Chromosomes were counterstained with DAPI; scale bar, 5 µm. (N) Quantification of cortical actin (fluorescence intensity) showing a reduction of 48% of cortical actin in DIAPH3 knockdown cells. n = 113 cells per condition from three distinct experiments. Student’s t-test, p=1.07 × 10⁻³². Error bars represent s.e.m.
-
Figure 1—source data 1
Downregulation of DIAPH3 and SPAG5.
- https://cdn.elifesciences.org/articles/61974/elife-61974-fig1-data1-v2.xlsx
Figure 1—figure supplement 1
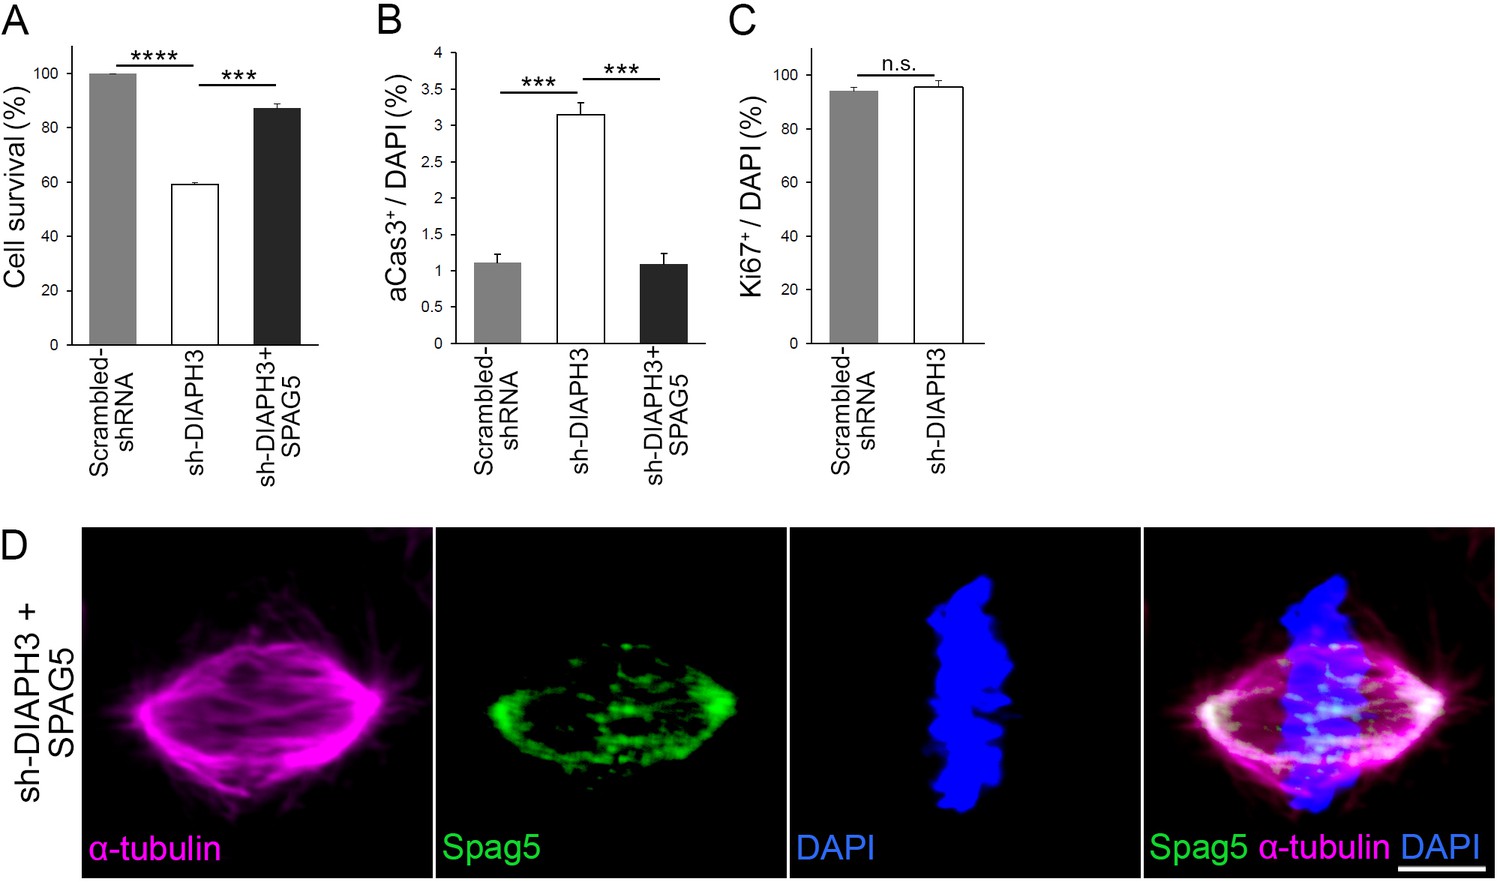
DIAPH3 knockdown reduced cell survival and overexpression of SPAG5 rescued the phenotype.
(A) sh-DIAPH3 knockdown reduced cell survival to 59.1 ± 0.73% of control cells (transfected with scrambled shRNA, p=6.0 × 10⁻⁷). Overexpression of SPAG5 rescued cell survival to 87.1 ± 1.7% of control cells (p=0.00011). (B) Evaluation of cell death by aCas3 immunostaining (3.2 ± 0.16% of cells were apoptotic in sh-DIAPH3 transfections versus 1.1 ± 0.12% in scrambled shRNA [p=0.00052]). Overexpression of SPAG5 restored the percentage of apoptotic cells to normal levels (1.1 ± 0.15% of cells, p=0.00071, when compared to sh-DIAPH3 plus empty vector). (C) Evaluation of proliferation by Ki67 immunoreactivity (95.5 ± 2.5% after transfection with sh-DIAPH3 versus 94.1 ± 1.5% in cells transfected with scrambled shRNA [p=0.661]). Counts were from three independent experiments, Student’s t-test; error bars represent s.e.m. (D) Representative image of a mitotic cell transfected with DIAPH3 shRNA (sh-DIAPH3) and SPAG5 cDNA, immunostained with anti-SPAG5 (green) and anti-α tubulin (magenta) antibodies. Chromosomes were counterstained with DAPI (blue). Scale bar, 5 μm. n = 20 cells from five individual experiments.
-
Figure 1—figure supplement 1—source data 1
Downregulation of DIAPH 3 and SPAG5 in U2OS cells.
- https://cdn.elifesciences.org/articles/61974/elife-61974-fig1-figsupp1-data1-v2.xlsx
Figure 2 with 2 supplements
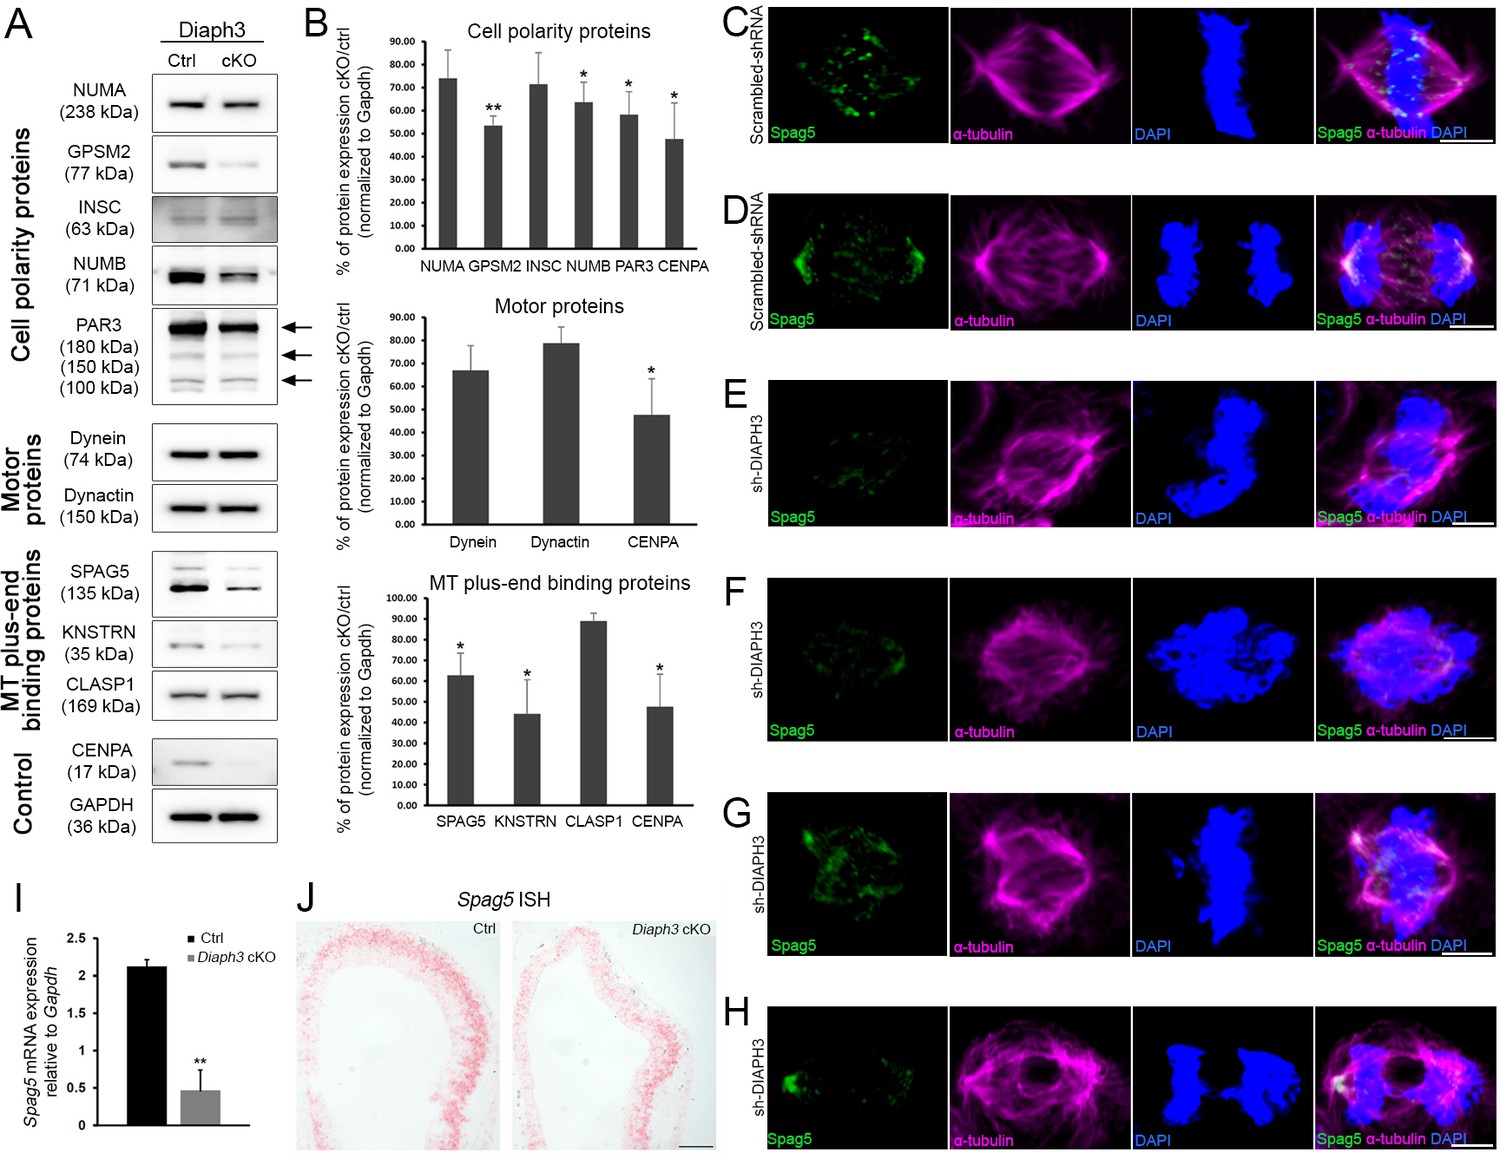
Diaph3 deficiency impairs the expression and stability of mitotic spindle polarity proteins.
(A, B) Assessment of nuclear mitotic apparatus (NUMA), G-protein signaling modulator 2 (GPSM2), INSC, NUMB, PAR3, Dynein, Dynactin, SPAG5, KNSTRN, and CLASP1 levels in telencephalon extracts of Diaph3 cKO embryos by western blotting. CENPA was used as positive control (Liu and Mao, 2016) and GAPDH as loading control for quantification. Both the higher and lower bands of SPAG5 were quantified. n = 4 embryos for each genotype. *p<0.05, ** p<0.01, Student’s t-test; error bars represent s.e.m. Fold change and p-value are listed in Supplementary file 2. (C–H) Representative images of mitotic cells transfected with scrambled shRNA (C, D) or DIAPH3 shRNA (sh-DIAPH3, E–H), and immunostained with anti-SPAG5 (green) and anti-α tubulin (magenta) antibodies. Chromosomes were counterstained with DAPI (blue). SPAG5 localized at the centrosome and kinetochore in control cells (C, D), and both its expression level and distribution were altered in DIAPH3 knockdown cells (E–H). Scale bar, 5 μm. n = 118 and 115 cells from five individual experiments of scrambled shRNA and sh-DIAPH3, respectively. (I) Quantification of the Spag5 mRNA by real-time RT-PCR. There is a reduction of 78% in Diaph3 cKO relative to control mice (p=0.0046). n = 3 from nine embryos for each genotype. (J) Coronal sections of e11.5 forebrain from control (left) and Diaph3 cKO (right, hybridized with a Spag5 fast red-labelled RNAscope probe). The expression of Spag5 mRNA is downregulated in Diaph3 cKO; scale bar, 150 µm. n = 3 for each genotype.
-
Figure 2—source data 1
Quantification of SPAG5 mRNA in DIAPH3 cKO cortex.
- https://cdn.elifesciences.org/articles/61974/elife-61974-fig2-data1-v2.xlsx
Figure 2—figure supplement 1
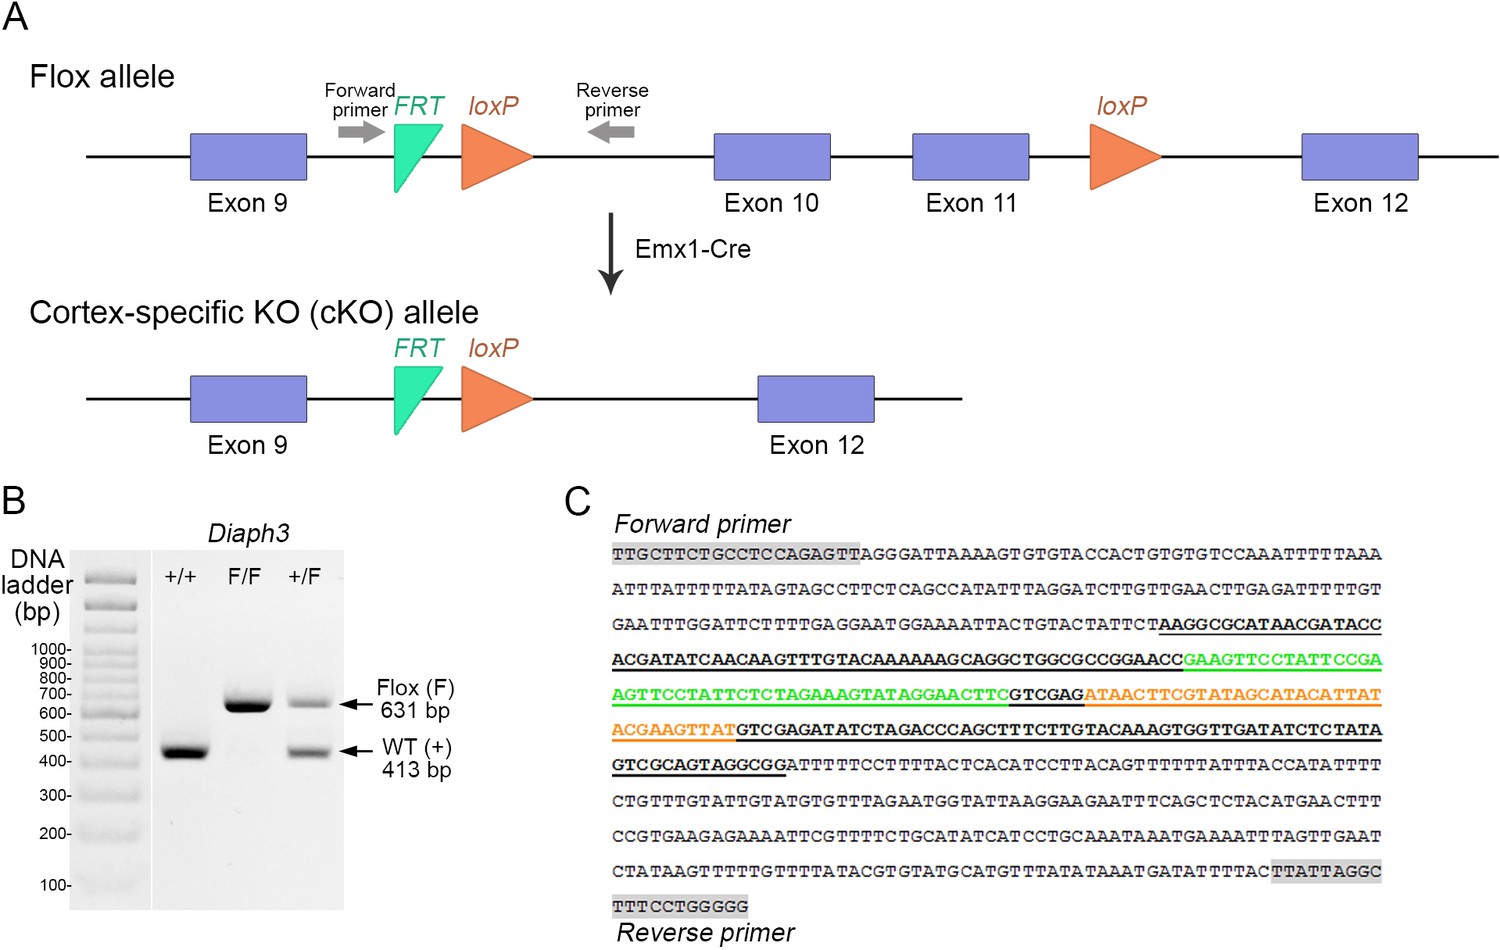
Generation of cortex-specific knockout (Diaph3 cKO) mice.
(A) Schematic representation of the Diaph3 conditional allele. Two LoxP sites (orange arrowheads) were inserted in introns 9 and 11. Exons 10 and 11 were excised in the dorsal telencephalon by crosses with Emx1-Cre mice. (B, C) Genotyping of Diaph3 cKO mice. Forward and reverse primers, flanking the FRT-LoxP cassette in intron 9, amplified a fragment of 413 bp from the wildtype allele (+) and 631 bp from the Floxed (F) allele (B). (C) DNA sequence of the recombinant amplicon depicting the FRT (green), LoxP (orange), and PCR primers (grey boxes).
Figure 2—figure supplement 2
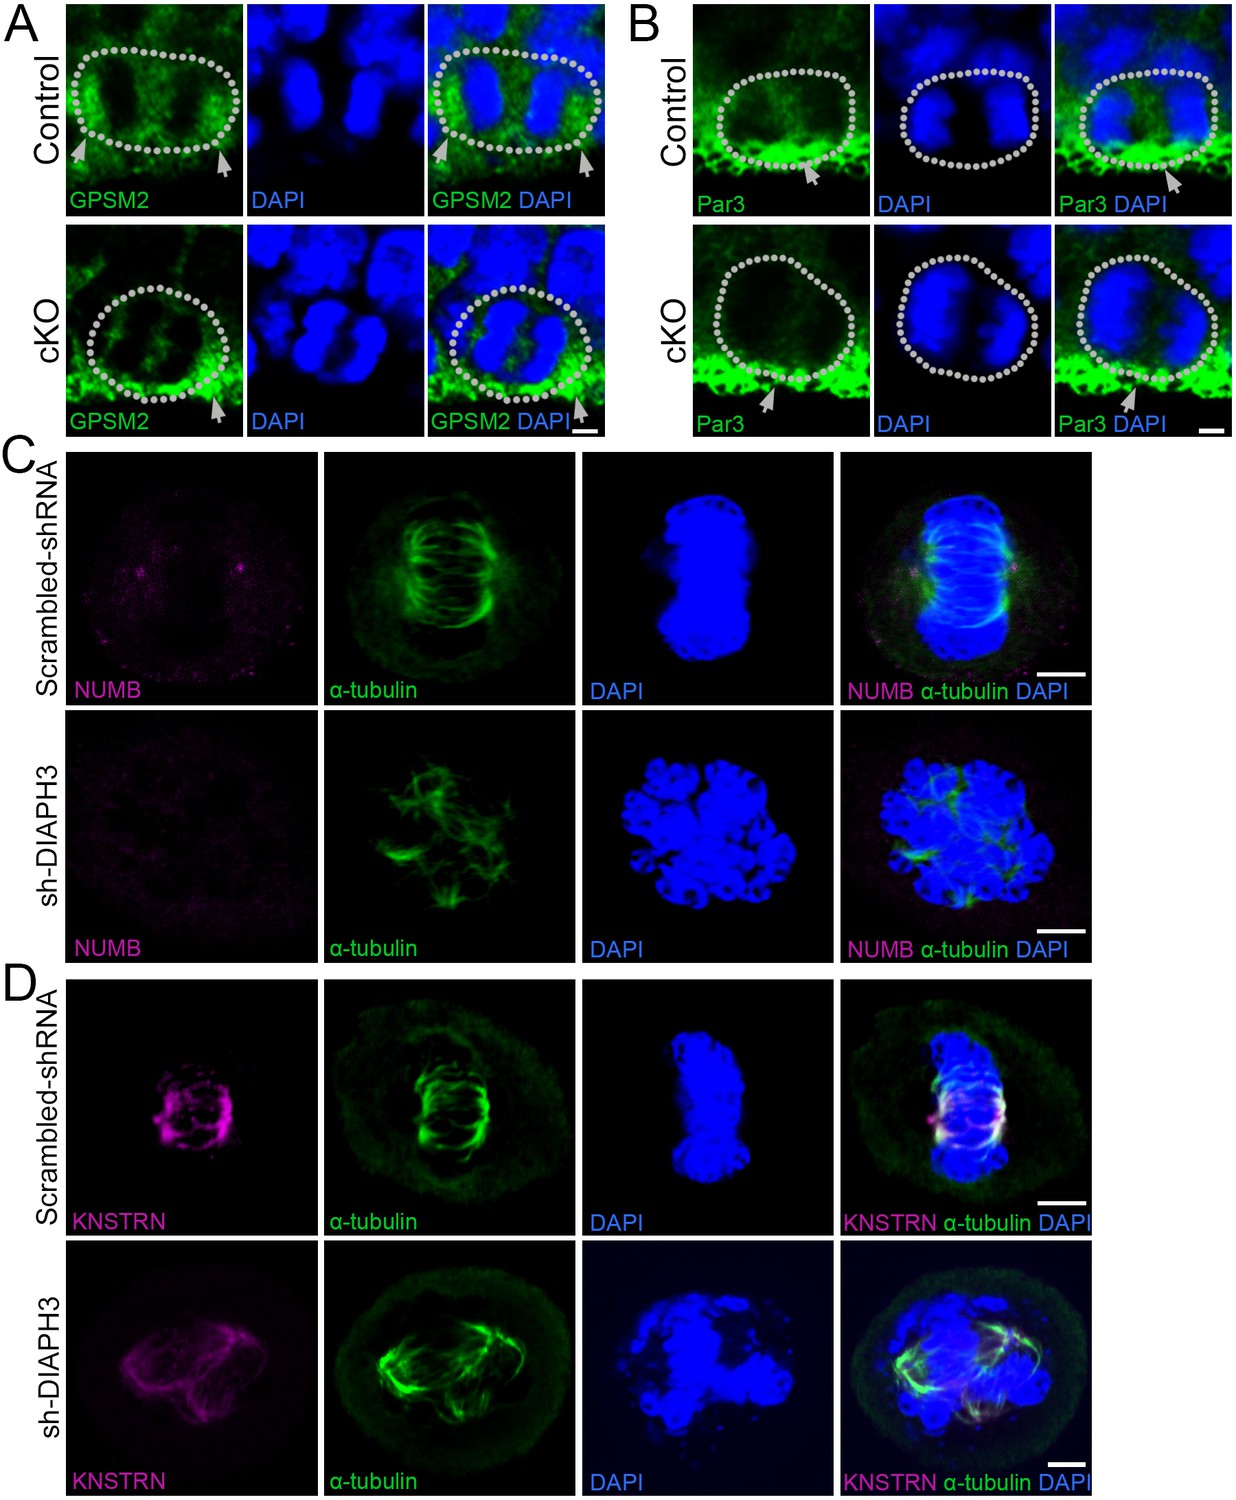
KO/KD of DIAPH3 disrupts the localization of cytocortical proteins.
(A–B) Dividing apical neural progenitor cells (aNPCs) in telencephalic ventricular zone (VZ) stained with anti-GPSM2 (A) or anti-Par3 (B) antibodies (green) and DAPI (blue) to label chromosomes in control and Diaph3 cKO e12.5 cortical sections. (A) G-protein signaling modulator 2 (GPSM2) was concentrated in poles of dividing cells in control, but not in Diaph3 cKO (as indicated by the grey arrows). (B) Par3 was distributed in the apical side (grey arrow) in control, and this expression was reduced in Diaph3 cKO (as indicated by the grey arrow). Dotted line indicates the cell boundary. Scale bar, 2 µm. n = 20 cells from five individual experiments. (C) Immunostaining of scrambled shRNA and sh-DIAPH3 knockdown cells during mitosis with anti-α tubulin (green) and anti-NUMB (magenta). (D) Immunostaining of scrambled shRNA and sh-DIAPH3 knockdown cells during mitosis with anti-α tubulin (green) and anti-KNSTRN (magenta). Scale bar, 5 µm. n = 20 cells from five individual experiments.
Figure 3
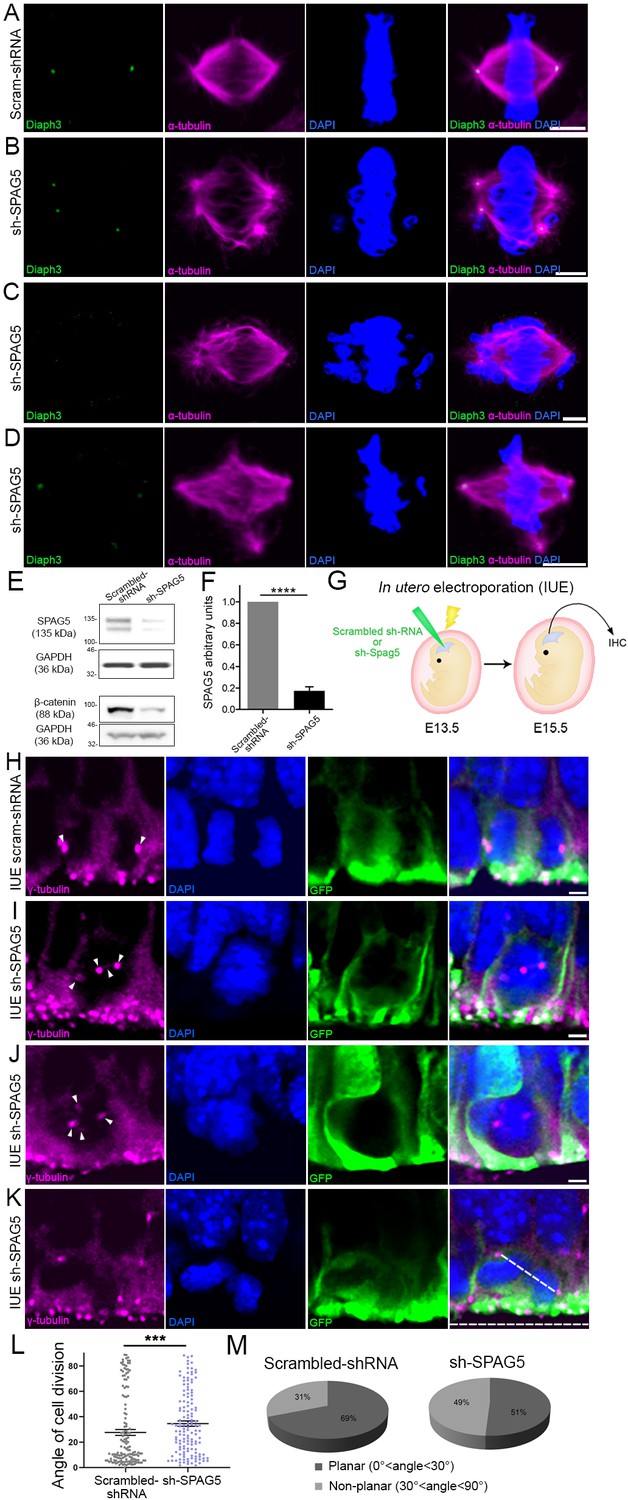
Downregulation of SPAG5 phenocopies DIAPH3 deficiency.
(A–D) Representative images of mitotic cells transfected with scrambled shRNA (A) or SPAG5 shRNA (sh-SPAG5) (B–D) and immunostained with anti-DIAPH3 (green) and anti-α tubulin (magenta) antibodies. Chromosomes were counterstained with DAPI (blue). SPAG5 deficiency downregulated diaphanous three (DIAPH3) and caused mitotic errors. Note the mis-localization of DIAPH3 and spindle abnormalities in sh-SPAG5-transfected cells. Scale bar, 5 µm. n = 100 cells per condition from five distinct experiments. (E, F) Western blot analysis of SPAG5 levels upon shRNA-mediated downregulation in NIH3T3 cells. Transfection of shRNA against SPAG5 (sh-SPAG5) significantly reduced the protein levels (−82.8%, p=0.00001, n = 3 independent experiments, Student’s t-test; error bars represent s.e.m.). Beta-catenin, a protein downregulated by knockdown of SPAG5 (Liu et al., 2019), was used as control of knockdown efficiency. (G) Schematic representation of in utero electroporation of sh-SPAG5 in cortical progenitors at e13.5 and immunohistochemistry (IHC) analysis at e15.5. (H–K) Ventricular zone of telencephalic sections of e15.5 embryos electroporated in utero with scrambled shRNA and GFP (H) or SPAG5 shRNA and GFP (I–K) at e13.5, and immunostained with anti-γ tubulin (magenta) at e15.5. White arrowheads depict normal centrosomes in (H) and numerical abnormalities of the centrosome in (I–K). (K) Illustration of a neural progenitor undergoing a non-planar division. The horizontal and oblique dashed lines delineate the ventricular surface and mitotic spindle orientation, respectively. When the mitotic spindle is parallel to the ventricular surface (0°<angle<30°), the cell division is planar. When it is oblique (30°<angle<60°) or perpendicular (60°<angle<90°) to the ventricular surface, the division is non-planar. Scale bar = 2 µm. n = 5 embryos for both scrambled shRNA and sh-SPAG5. (L, M) Quantification of cell division modalities in electroporated apical neural progenitor cells (aNPCs). There is a bias toward non-planar divisions (larger angles) in sh-SPAG5-electroporated aNPCs when compared with scrambled shRNA, p=0.0009. Student’s t-test; error bars represent s.e.m. (L). 49% (67/137 cells) of sh-SPAG5 progenitors undergo non-planar division compared to 31% (45/147 cells) in scrambled shRNA (M).
-
Figure 3—source data 1
Quantification of cell division modalities.
- https://cdn.elifesciences.org/articles/61974/elife-61974-fig3-data1-v2.xlsx
Figure 4 with 1 supplement
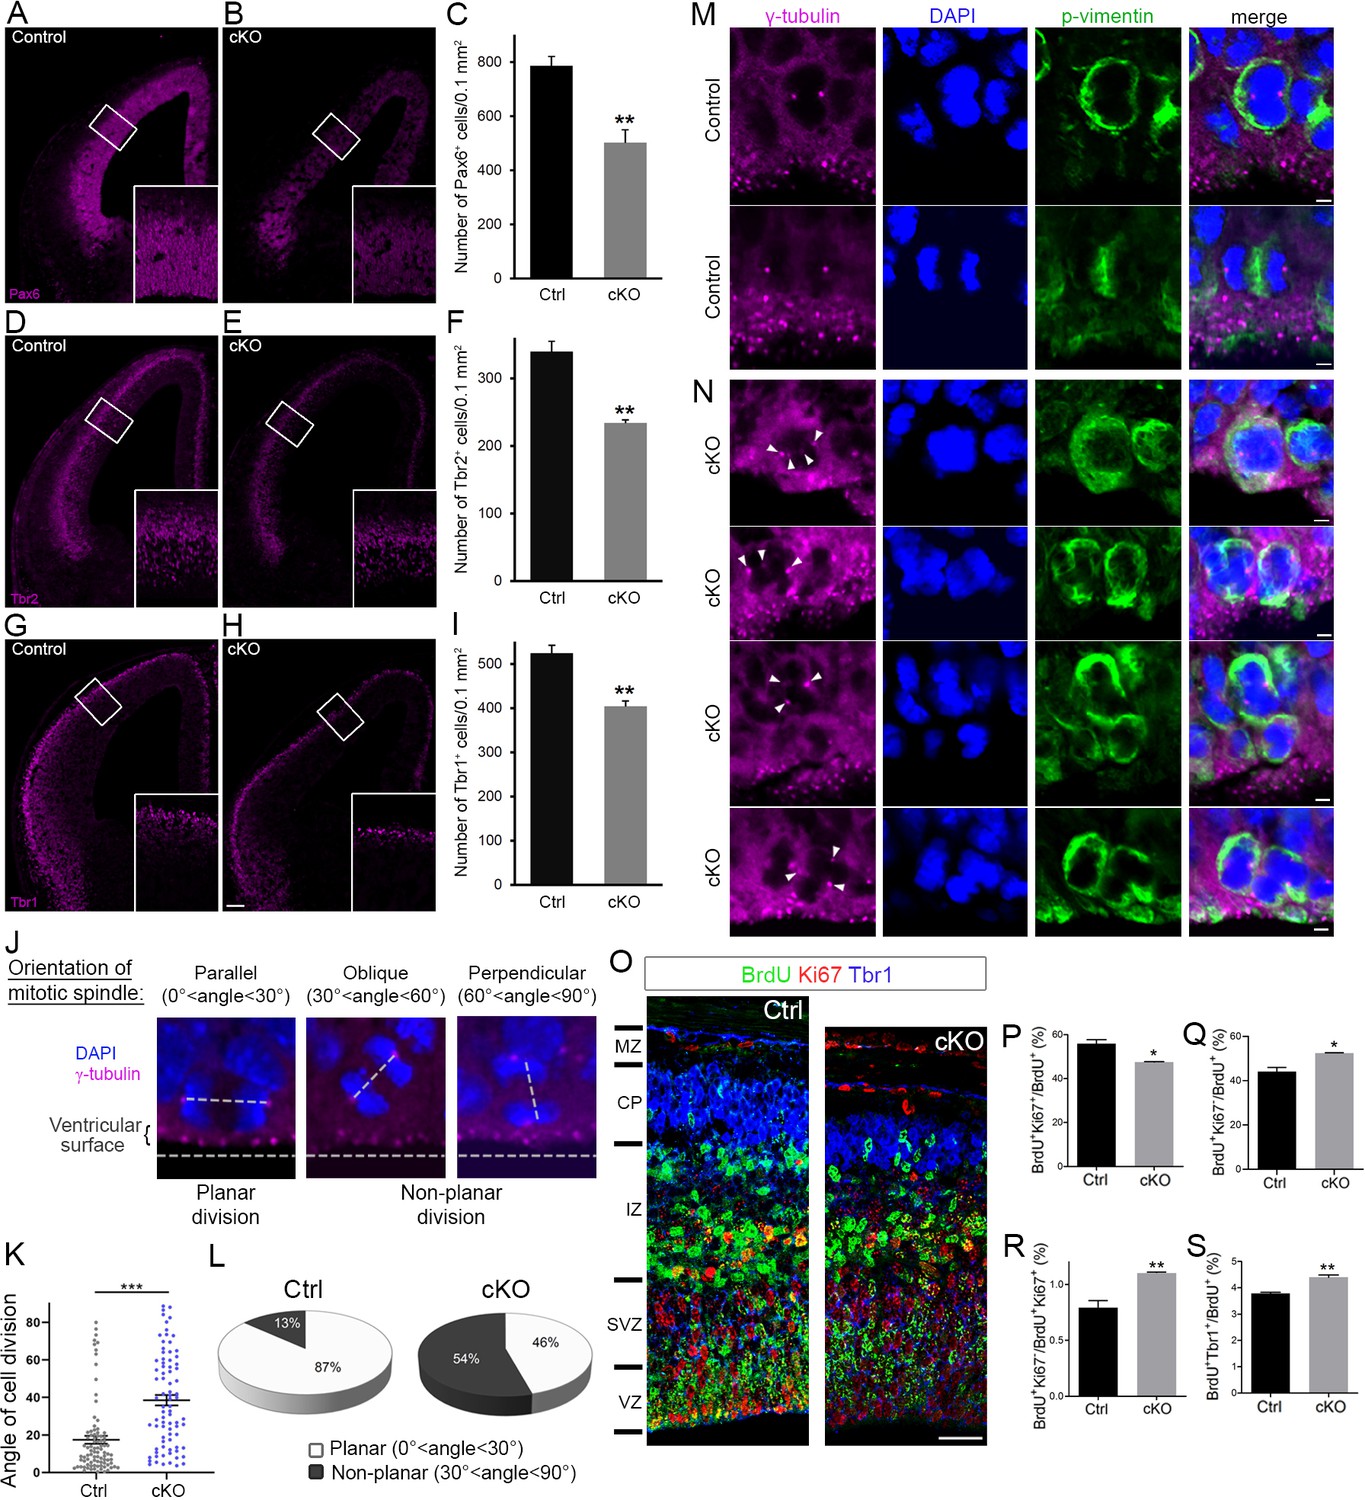
Cortex-specific inactivation of Diaph3 disrupts cortical neurogenesis.
(A, B, D, E, G, and H) Forebrain coronal sections from e13.5 stained with Pax6 (apical neural progenitor cells [aNPCs]; A, B), Tbr2 (basal progenitors; D, E), and Tbr1 (neurons; G, H) antibodies. Insets are enlargements of the boxed areas. Quantifications shown in (C, F, and I) emphasize reduction in the number of apical radial glia (aNPC, Pax6+, p=0.00853), basal progenitors (Tbr2+, p=0.00287), and neurons (Tbr1+, p=0.00535), respectively. Cells were counted in 0.1 mm2 cortical areas. n = 3 embryos per genotype. Student’s t-test; error bars represent s.e.m. Scale bar, 100 µm. (J) e12.5 cortical sections stained with anti-γ tubulin antibodies (magenta) and DAPI (blue) to label centrosomes and chromosomes, respectively, and ‘foresee’ the mitotic spindle. The orientation of the mitotic spindle with respect to the ventricular surface is categorized into three types: parallel (left), oblique (middle), or perpendicular (right). When the mitotic spindle is parallel to the ventricular surface (0°<angle<30°), the cell division is planar. When it is oblique (30°<angle<60°) or perpendicular (60°<angle<90°) to the ventricular surface, the division is non-planar. (K, L) Assessment of cell division modality at e12.5. Compared with control mice, there is a significant shift toward larger angles (p=5.9 × 10⁻⁹, n = 89 mitoses from three control embryos, 81 mitoses from three Diaph3 cKO embryos; Student’s t-test; error bars represent s.e.m.) (K) and an increase in the ratio of non-planar division in Diaph3 cKO (L). (M) Dividing aNPCs in control telencephalic VZ stained with anti-γ tubulin antibodies (magenta), anti-phospho vimentin antibodies (green), and DAPI (blue) to label centrosomes, dividing cells, and chromosomes, respectively. (N) Illustrations of supernumerary centrosomes (arrowheads) in Diaph3 cKO. Scale bar, 2 µm. (O) Assessment of proliferative versus neurogenic division (cell cycle exit) at e.14.5. Pregnant females were injected with BrdU at e.13.5 and embryos were collected after 24 hr. Forebrain coronal sections were processed for triple immunostaining using anti-BrdU (green), anti-Ki67 (red), and anti-Tbr1 (blue). BrdU+, Ki67+, and Tbr1+ cells were counted in 200-µm-wide cortical stripes. (P–S) Quantification of proliferating cells (P, BrdU+Ki67+/BrdU+) and non-proliferating cells (Q, BrdU+Ki67-/BrdU+) shows that cell proliferation is reduced, whereas cell cycle exit is enhanced in Diaph3 cKO compared to control. The ratio of noncycling to cycling cells (BrdU+Ki67-/BrdU+Ki67+) is also increased in Diaph3 cKO (R). The fraction of progenitors exiting the cell cycle and generating Tbr1+ neurons is increased in Diaph3 cKO. n = 3 embryos for each genotype; Student’s t test, p=0.011 for (P), p=0.011 for (Q), p=0.0078 for (R), p=0.0031 for (S); error bars represent s.e.m. Scale bar, 30 µm. CP, cortical plate; IZ, intermediate zone; MZ, marginal zone; SVZ, subventricular zone; VZ, ventricular zone.
-
Figure 4—source data 1
Quantification of cell division modalities.
- https://cdn.elifesciences.org/articles/61974/elife-61974-fig4-data1-v2.xlsx
Figure 4—figure supplement 1
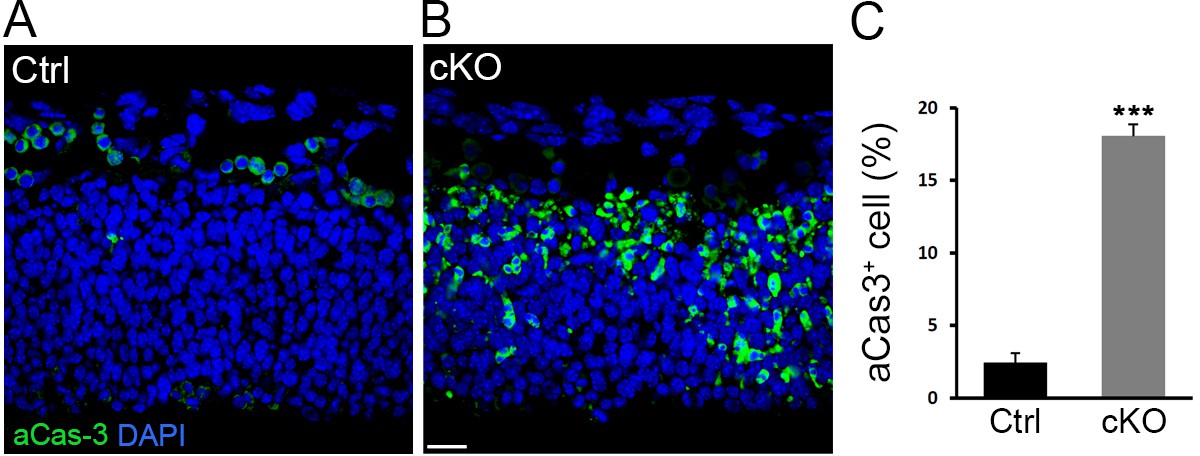
Cell apoptosis in Diaph3 cKO mice.
(A, B) Representative images of aCas3 immunostaining (green) on telencephalic sections at e11.5 from control (A) and Diaph3 cKO (B) mice illustrating cell death. (C) Quantification of apoptotic cells. 18 ± 0.83% of cells in Diaph3 cKO underwent apoptosis versus 2.4 ± 0.65% in control mice. Student’s t-test, p=0.00012. Error bars represent s.e.m. Scale bar, 20 µm. n = 9 embryos from six different litters.
-
Figure 4—figure supplement 1—source data 1
Quantification of cell death in the Diaph3 cKO cortex.
- https://cdn.elifesciences.org/articles/61974/elife-61974-fig4-figsupp1-data1-v2.xlsx
Figure 5 with 1 supplement

Diaph3 cKO mice display cortical hypoplasia and behavioral defects.
(A) Dark field micrograph of coronal sections of the forebrain from control (left) and Diaph3 cKO (right) mice, depicting a marked reduction in cortex thickness in Diaph3 cKO, quantified in (B) (1.3 ± 0.028 mm in Diaph3 cKO versus 1.5 ± 0.014 mm in control, p=0.00038). (C) Coronal sections stained with the upper layer marker Cux1. (D) Quantification of the number of Cux1+ cells (left) and thickness (right) in layers II-III (Cux1+ cells: 614 ± 20 cells in Diaph3 cKO versus 933 ± 73 in control, p=0.0056; thickness: 385 ± 15 μm in Diaph3 cKO versus 482 ± 13 μm in control, p=0.0025). (E) Coronal sections stained with deep layer marker Foxp2. (F) Quantification of the number of Foxp2+ cells (left) and thickness (right) in layer VI (Foxp2+ cells: 375 ± 22 cells in Diaph3 cKO versus 558 ± 32 in control, p=0.0033; thickness: 383 ± 20 μm in Diaph3 cKO versus 505 ± 8 μm in control, p=0.0012). Cux1+ and Foxp2+ cells were counted in 1 mm2 cortical area. n = 4 mice for each genotype, Student’s t-test; error bars represent s.e.m. Scale bar, 200 µm. (G) Distance moved by Diaph3 cKO and control mice in the open field. Student’s t test, p=0.0015. (H) Distance travelled by mice in elevated plus maze. Student’s t test, p=0.0043. (I) Social behavior in the ‘three-chamber’ test. One-way ANOVA test, p=8.4 × 10⁻⁷ for control, p=0.99 for Diaph3 cKO (stranger versus empty chamber). (J) Social novelty behavior in the ‘three-chamber’ test. One-way ANOVA test, p=0.00050 for control, p=0.16 for Diaph3 cKO (stranger 1 versus stranger 2 chamber). Compared with control, Diaph3 cKO mice have reduced locomotor activity and defective social interactions. n = 10 per genotype. Error bars represent s.e.m.
-
Figure 5—source data 1
Cortical histogenesis and behaviour.
- https://cdn.elifesciences.org/articles/61974/elife-61974-fig5-data1-v2.xlsx
Figure 5—figure supplement 1
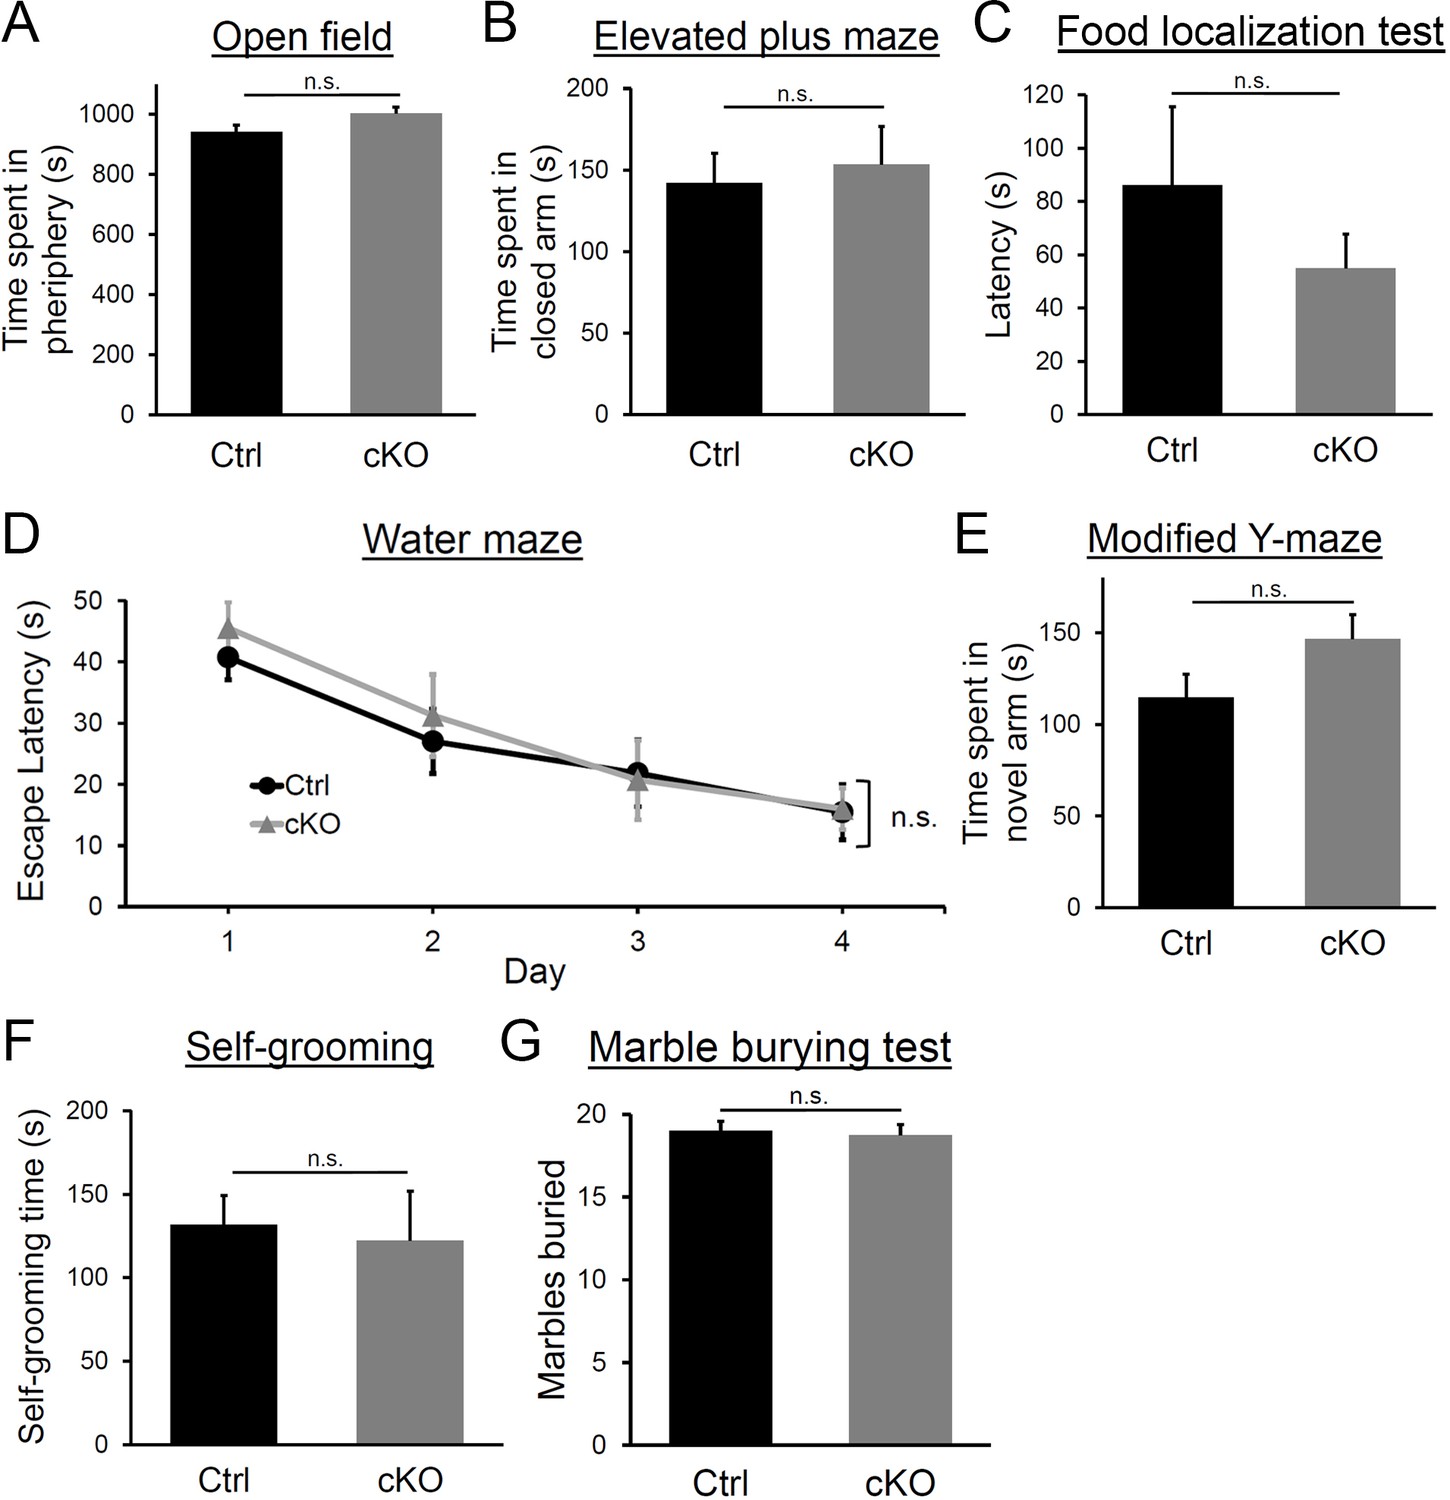
Behavior assessment of Diaph3 cKO mice.
(A) Time spent in the periphery of the open field. Student’s t test, p=0.14. (B) Time spent in the closed arm of the elevated plus maze. Student’s t test, p=0.75. (C) Time spent to find the buried pellet in food localization test. Student’s t test, p=0.15. (D) Escape latency in the Morris water maze test on the training day (day 1) and three consecutive days (days 2–4). Two-way ANOVA, p=0.79. (E) Time spent in the novel arm in modified Y-maze test. Student’s t test, p=0.055. (F) Time spent for self-grooming. Student’s t test, p=0.62. (G) Number of marbles buried. Student’s t test, p=0.68, n = 10 per genotype. Error bars represent s.e.m.
-
Figure 5—figure supplement 1—source data 1
Assessement of learning and memory, and olfactory behaviour.
- https://cdn.elifesciences.org/articles/61974/elife-61974-fig5-figsupp1-data1-v2.xlsx
Figure 6
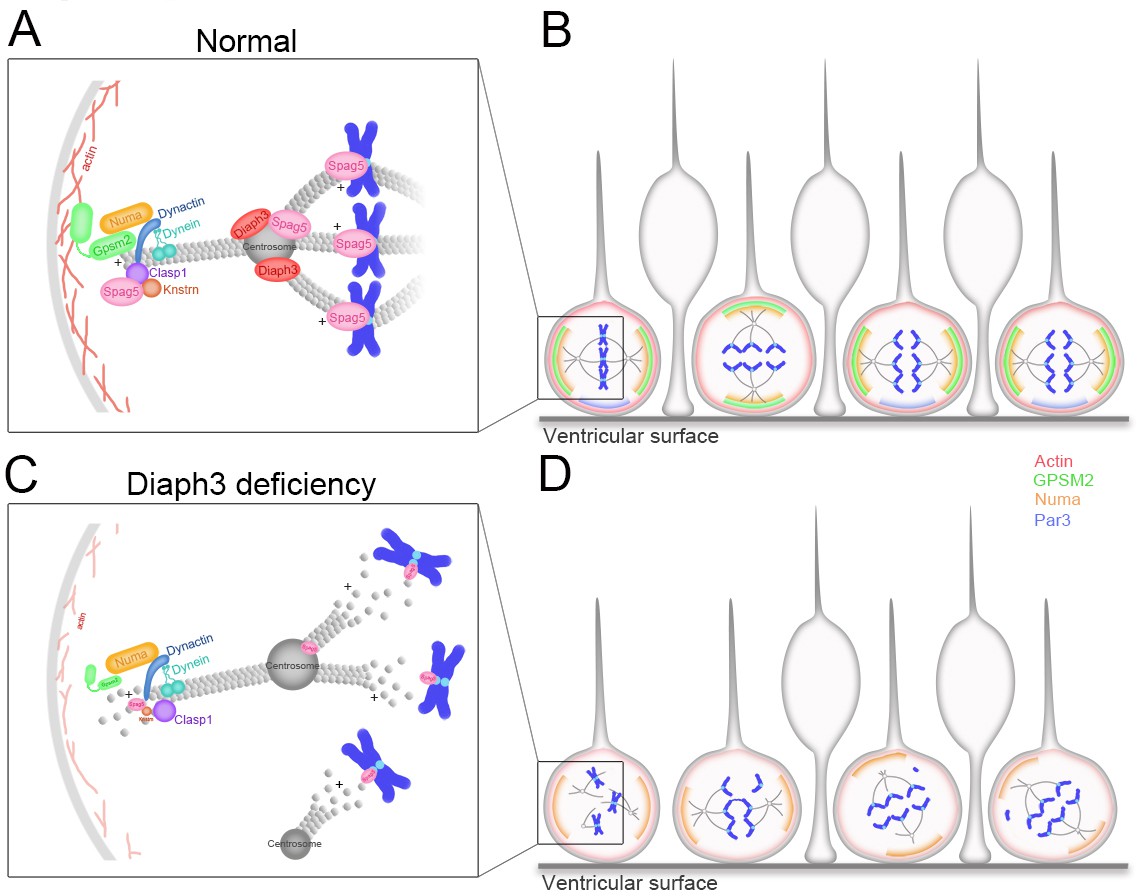
Working model of DIAPH3 function in aNPC.
(A) During mitosis, diaphanous three (DIAPH3) maintains the dynamics of cytoskeleton. Polarity proteins nuclear mitotic apparatus (NUMA) and G-protein signaling modulator 2 (GPSM2) assemble underneath cortical F-actin and recruit the dynein/dynactin motor protein complex. Dynein and dynactin interact with SPAG5/KNSTRN/CLASP1 located at the microtubule plus-end and attach astral microtubule (MT) to cell cortex, thus providing the pulling force for chromosome bipolar segregation (Okumura et al., 2018; Dunsch et al., 2011; Kern et al., 2016). (B) The position of polarity proteins NUMA/GPSM2 directs the orientation of the mitotic spindle and determines the type of division (proliferative versus neurogenic) of apical neural progenitor cells (aNPCs). (C, D) Absence of DIAPH3 destabilizes actin and MT and disrupts the expression of SPAG5, KNSTRN, GPSM2, PAR3, and NUMB, therefore weakening astral MT-cell cortex and spindle MT-kinetochore interactions. This causes spindle abnormalities, chromosome mis-alignment, and mis-segregation, and alters the fate decision of aNPCs.
Tables
Key resources table
| Reagent type (species) or resource | Designation | Source or reference | Identifiers | Additional information |
|---|---|---|---|---|
| Antibody | Anti-CDP/Cux1 (rabbit polyclonal) | Santa Cruz | Cat# SC-13024, RRID:AB_2261231 | IF (1:200) |
| Antibody | Anti-Foxp2 (rabbit polyclonal) | Abcam | Cat# ab16046, RRID:AB_2107107 | IF (1:500) |
| Antibody | Anti-Tbr1 (rabbit polyclonal) | Abcam | Cat# ab31940, RRID:AB_2200219 | IF (1:500) |
| Antibody | Anti-Tbr2 (rabbit polyclonal) | Abcam | Cat# ab23345, RRID:AB_778267 | IF (1:500) |
| Antibody | Anti-Pax6 (rabbit polyclonal) | Covance | Cat# PRB-278P, RRID:AB_291612 | IF (1:500) |
| Antibody | Anti-γ-tubulin (rabbit polyclonal) | Abcam | Cat# ab11317, RRID:AB_297921 | IF (1:500) |
| Antibody | Anti-Diaph3 (rabbit polyclonal) | Tominaga et al., 2000 | IF (1:500) WB (1:500) | |
| Antibody | Anti-Spag5 (rabbit polyclonal) | Proteintech | Cat# 14726–1-AP, RRID:AB_2194787 | IF (1:200) |
| Antibody | Anti-α-tubulin (mouse monoclonal) | Sigma | Cat# T6199, RRID:AB_477583 | IF (1:500) |
| Antibody | Anti-cleaved caspase-3 (Alexa Fluor 488conjugate) (rabbit monoclonal) | Cell Signaling | Cat# 9603, RRID:AB_11179205 | IF (1:100) |
| Antibody | Anti-Ki67 (mouse monoclonal) | BD phamingen | Cat# 556003, RRID:AB_396287 | IF (1:500) |
| Antibody | Anti-SPAG5 (rabbit polyclonal) | Sigma | Cat# HPA022008, RRID:AB_1853519 | WB (1:750) |
| Antibody | Anti-GAPDH (chicken polyclonal) | Millipore | Cat# AB2302, RRID:AB_10615768 | WB (1:2000) |
| Antibody | Anti-NUMA (mouse monoclonal) | BD Biosciences | Cat# 610561, RRID:AB_397913 | WB (1:500) |
| Antibody | Anti-PAR3 (rabbit polyclonal) | Millipore | Cat# 07–330, RRID:AB_2101325 | IF (1:500) WB (1:500) |
| Antibody | Anti-GPSM2 (rabbit polyclonal) | Ezan et al., 2013 | IF (1 :200) WB (1 :200) | |
| Antibody | Anti-CENPA (rabbit monoclonal) | Cell Signaling | Cat# 2048, RRID:AB_1147629 | WB (1 :500) |
| Antibody | Anti-Dynein IC1/2 (mouse monoclonal) | Santa Cruz | Cat# sc-13524, RRID:AB_668849 | WB (1:500) |
| Antibody | Anti-KNSTRN (rabbit polyclonal) | Sigma | Cat# HPA042027, RRID:AB_10797378 | IF (1:1000) WB (1:1000) |
| Antibody | Anti-INSC (rabbit polyclonal) | Abcam | Cat# ab102953, RRID:AB_10711784 | WB (1:1000) |
| Antibody | Anti-NUMB (goat polyclonal) | Abcam | Cat# ab4147, RRID:AB_304320 | IF (1:100) WB (1:100) |
| Antibody | Anti-p150Glued /dynactin (mouse polyclonal) | BD Biosciences | Cat# 610474, RRID:AB_397846 | WB (1:500) |
| Antibody | Anti-CLASP1 (rabbit monoclonal) | Abcam | Cat# ab108620, RRID:AB_10864427 | WB (1:5000) |
| Antibody | Anti-BrdU (rat monoclonal) | Serotec | Cat# MCA2060GA, RRID:AB_10545551 | IF (1:200) |
| Antibody | Anti-Ki67 (rabbit polyclonal) | Abcam | Cat# ab15580, RRID:AB_443209 | IF (1:250) |
| Antibody | Anti-Tbr1 (chicken polyclonal) | Millipore | Cat# AB2261, RRID:AB_10615497 | IF (1:100) |
| Antibody | Anti-SPAG5 (rabbit polyclonal) | NovusBio | Cat# NB100-74638, RRID:AB_2239831 | WB (1:1000) |
| Antibody | Alexa Fluor 488 anti-mouse IgG (goat polyclonal) | Invitrogen | Cat# A11017, RRID:AB_143160 | IF (1:800) |
| Antibody | Alexa Fluor 488 anti-rabbit IgG (goat polyclonal) | Invitrogen | Cat# A11034, RRID:AB_2576217 | IF (1:1000) |
| Antibody | Alexa Fluor 488 anti-chicken IgY (IgG) (goat polyclonal) | Jackson ImmunoResearch | Cat# 103-545-155, RRID:AB_2337390 | IF (1:1000) |
| Antibody | Alexa Fluor 568 anti-mouse IgG (goat polyclonal) | Invitrogen | Cat# A21124, RRID:AB_141611 | IF (1:1000) |
| Antibody | Alexa Fluor 568 anti-rabbit IgG (goat polyclonal) | Invitrogen | Cat# A11036, RRID:AB_10563566 | IF (1:1000) |
| Antibody | Anti-chicken IgY/HRP-linked (rabbit polyclonal) | Upstate Biotech | Cat# 12–341, RRID:AB_390189 | WB (1:1000) |
| Antibody | Anti-mouse IgG/HRP-linked (goat polyclonal) | Dako | Cat# P0447, RRID:AB_2617137 | WB (1:1000) |
| Antibody | Anti-rabbit IgG/HRP-linked (goat polyclonal) | Cell Signaling | Cat# 7074, RRID:AB_2099233 | WB (1:1000) |
| Cell line (Homo-sapiens) | U2OS cell (osteosarcoma) | ATCC | Cat# HTB-96, RRID:CVCL_0042 | |
| Cell line (Mus musculus) | NIH3T3 immortalized MEFs | ATCC | Cat# CRL-1658 RRID:CVCL_KS54 | |
| Strain, strain background | Mus musculus | Jackson Lab | Emx1tm1(cre)Krj/J RRID:IMSR_JAX:005628 | |
| Strain, strain background | Mus musculus | This paper | Diaph3Emx1-Cre cKO (Diaph3f/f; Emx1-Cre) | |
| Transfected construct (human) | Scrambled shRNA | Origene | Cat# TR30012 | Transfected construct |
| Transfected construct (human) | sh-Diaph3 | Origene | Cat# TR304992 | Transfected construct |
| Transfected construct (human) | sh-Spag5 | Origene | Cat# TR309161 | Transfected construct |
| Transfected construct (Mus musculus) | sh-Spag5 | Origene | Cat# TR509034 | Transfected construct |
| Commercial assay or kit | Mycoplasma PCR detection kit | Sigma | Cat#, MP0035 | |
| Commercial assay or kit | RNeasy Kit | Qiagen | Cat# 74004 | |
| Commercial assay or kit | RT cDNA synthesis Kit | Promega | Cat# A5003 | |
| Commercial assay or kit | SYBR Green SuperMix | Biorad | Cat# 170–8882 | |
| Commercial assay or kit | Lipofectamine LTX | Thermofisher Scientific | Cat# 15338030 | |
| Commercial assay or kit | RNAscope Probe-Mm-Spag5 | ACD | Cat# 505691 | |
| Commercial assay or kit | Pierce BCA protein assay kit | Thermofisher Scientific | Cat# 23225 | |
| Commercial assay or kit | Bolt 4–12% Bis-Tris Plus Gels | Thermofisher Scientific | Cat# NW04125 BOX | |
| Commercial assay or kit | StartingBlock T20 (TBS) blocking buffer | Thermofisher Scientific | Cat# 37543 | |
| Commercial assay or kit | 20x Bolt MOPS SDS running buffer | Thermofisher Scientific | Cat# B0001 | |
| Software, algorithm | Prism | GraphPad, USA | RRID:SCR_002798 | |
| Software, algorithm | Zen lite | Zeiss | ||
| Software, algorithm | Ethovision 6.1, Noldus | Wageningen, The Netherlands |
Additional files
-
Supplementary file 1
Cell division abnormalities in DIAPH3 knockdown cells.
Over 81% of DIAPH3 knockdown cells exhibited mitotic errors (4.2% in control cells). These errors were divided into five ‘non-exclusive’ categories: (1) defects in chromosome alignment (57.4%); (2) abnormal astral microtubule (MT) (52.2%); (3) abnormal number of centrosomes (40%); (4) abnormal mitotic spindle (53%); and (5) mis-localization of SPAG5 (60%). n = 118 cells transfected with scrambled shRNA and 115 with sh-DIAPH3 from five individual experiments.
- https://cdn.elifesciences.org/articles/61974/elife-61974-supp1-v2.docx
-
Supplementary file 2
Relative change in expression of proteins related to spindle orientation in Diaph3 cKO.
n = 4 embryos for each genotype. Student’s t-test, *p<0.05, **p<0.01.
- https://cdn.elifesciences.org/articles/61974/elife-61974-supp2-v2.docx
-
Transparent reporting form
- https://cdn.elifesciences.org/articles/61974/elife-61974-transrepform-v2.pdf
Download links
A two-part list of links to download the article, or parts of the article, in various formats.
Downloads (link to download the article as PDF)
Open citations (links to open the citations from this article in various online reference manager services)
Cite this article (links to download the citations from this article in formats compatible with various reference manager tools)
DIAPH3 deficiency links microtubules to mitotic errors, defective neurogenesis, and brain dysfunction
eLife 10:e61974.
https://doi.org/10.7554/eLife.61974


