Tumor-derived extracellular vesicles regulate tumor-infiltrating regulatory T cells via the inhibitory immunoreceptor CD300a
- Department of Immunology, Faculty of Medicine, University of Tsukuba, Japan
- Doctoral Program of Biomedical Sciences, Graduate School of Comprehensive Human Sciences, University of Tsukuba, Japan
- R&D Center for Innovative Drug Discovery, University of Tsukuba, Japan
- Life Science Center for Survival Dynamics, Tsukuba Advanced Research Alliance (TARA), University of Tsukuba, Japan
Figures
Figure 1
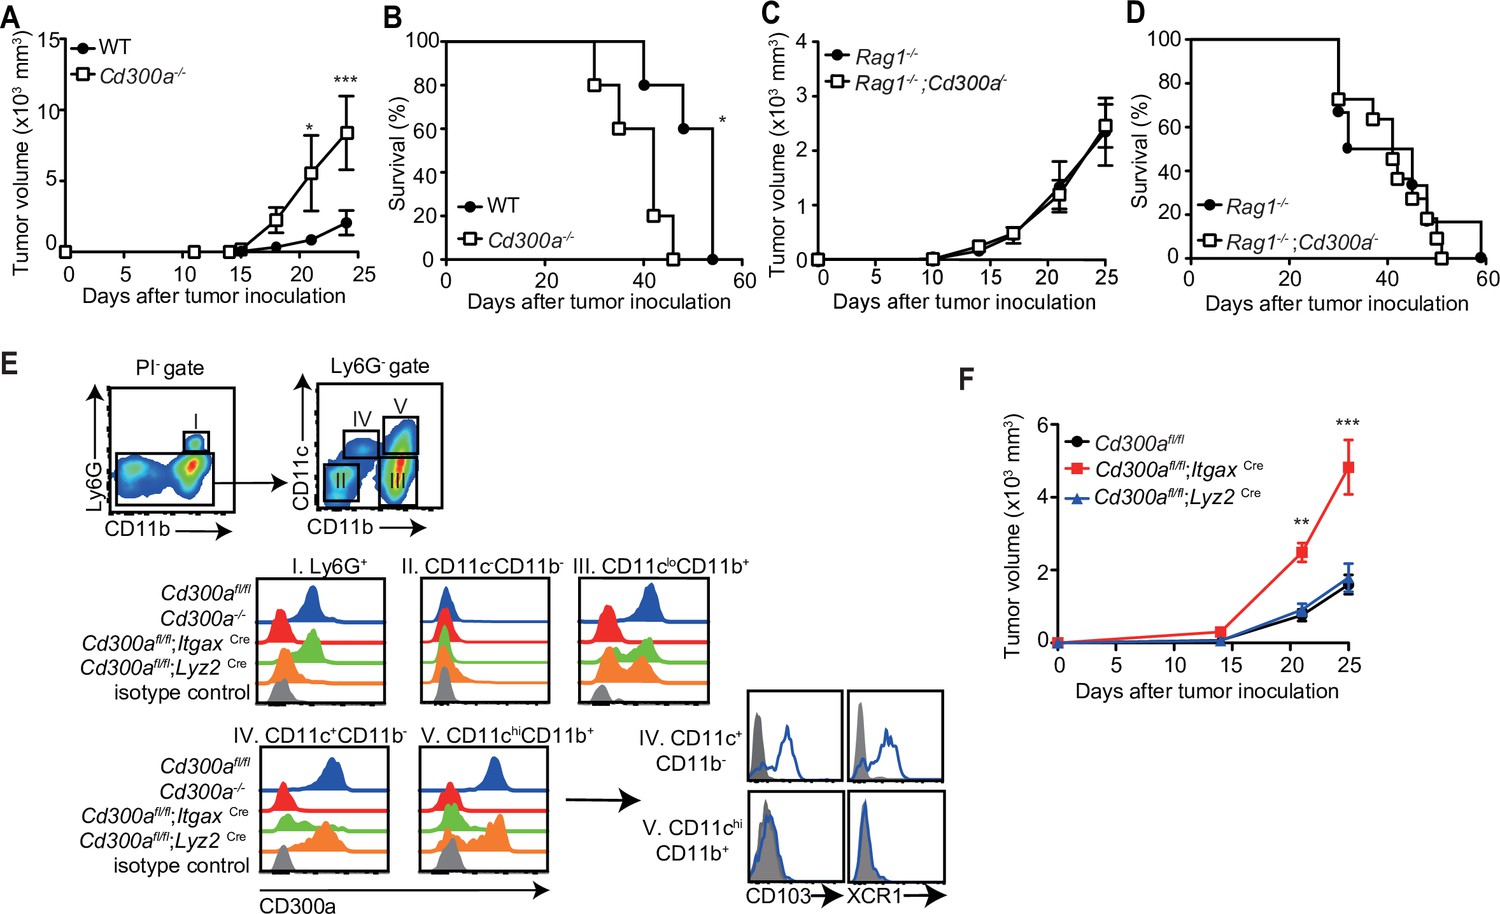
CD300a suppresses tumor growth.
(A–D) Tumor growth or survival curves of wild-type (WT, n = 5 in A and B), Cd300a−/− (n = 5 in A and B), Rag1−/− (n = 11 in C and n = 6 in D), and Rag1−/−;Cd300a−/− (n = 15 in C and n = 11 in D) that were inoculated with 1 × 10⁵ B16 melanoma cells on day 0. (E) CD300a expression on neutrophils (Ly6G+), macrophages (Ly6G−CD11cloCD11b+), conventional type-1 DC (cDC1; Ly6G−CD11c+CD11b−CD103+XCR1+), and cDC1 (Ly6G−CD11c+hiCD11b+CD103−XCR−) isolated from B16 melanoma tissues of Cd300afl/fl, Cd300a−/−, Cd300afl/fl;ItgaxCre, and Cd300afl/fl;Lys2Cre mice prepared 14 days after inoculation. Data are representative of three mice. (F) Tumor growth of Cd300afl/fl (n = 7), Cd300afl/fl;ItgaxCre (n = 13), and Cd300afl/fl;Lys2Cre mice (n = 15) that were inoculated with 1 × 10⁵ B16 melanoma cells on day 0. Data are given as means ± standard error of the means (SEMs). **p** < 0.01 and ***p < 0.001. p values were obtained by using a two-way analysis of variance (ANOVA) followed by Bonferroni’s post-test (A, C, and F) and the log-rank test (B and D). Data were pooled from two (A– C and E) or three (D and F) independent experiments.
-
Figure 1—source data 1
Source data for Figure 1A-D and F.
- https://cdn.elifesciences.org/articles/61999/elife-61999-fig1-data1-v1.xlsx
Figure 2 with 2 supplements
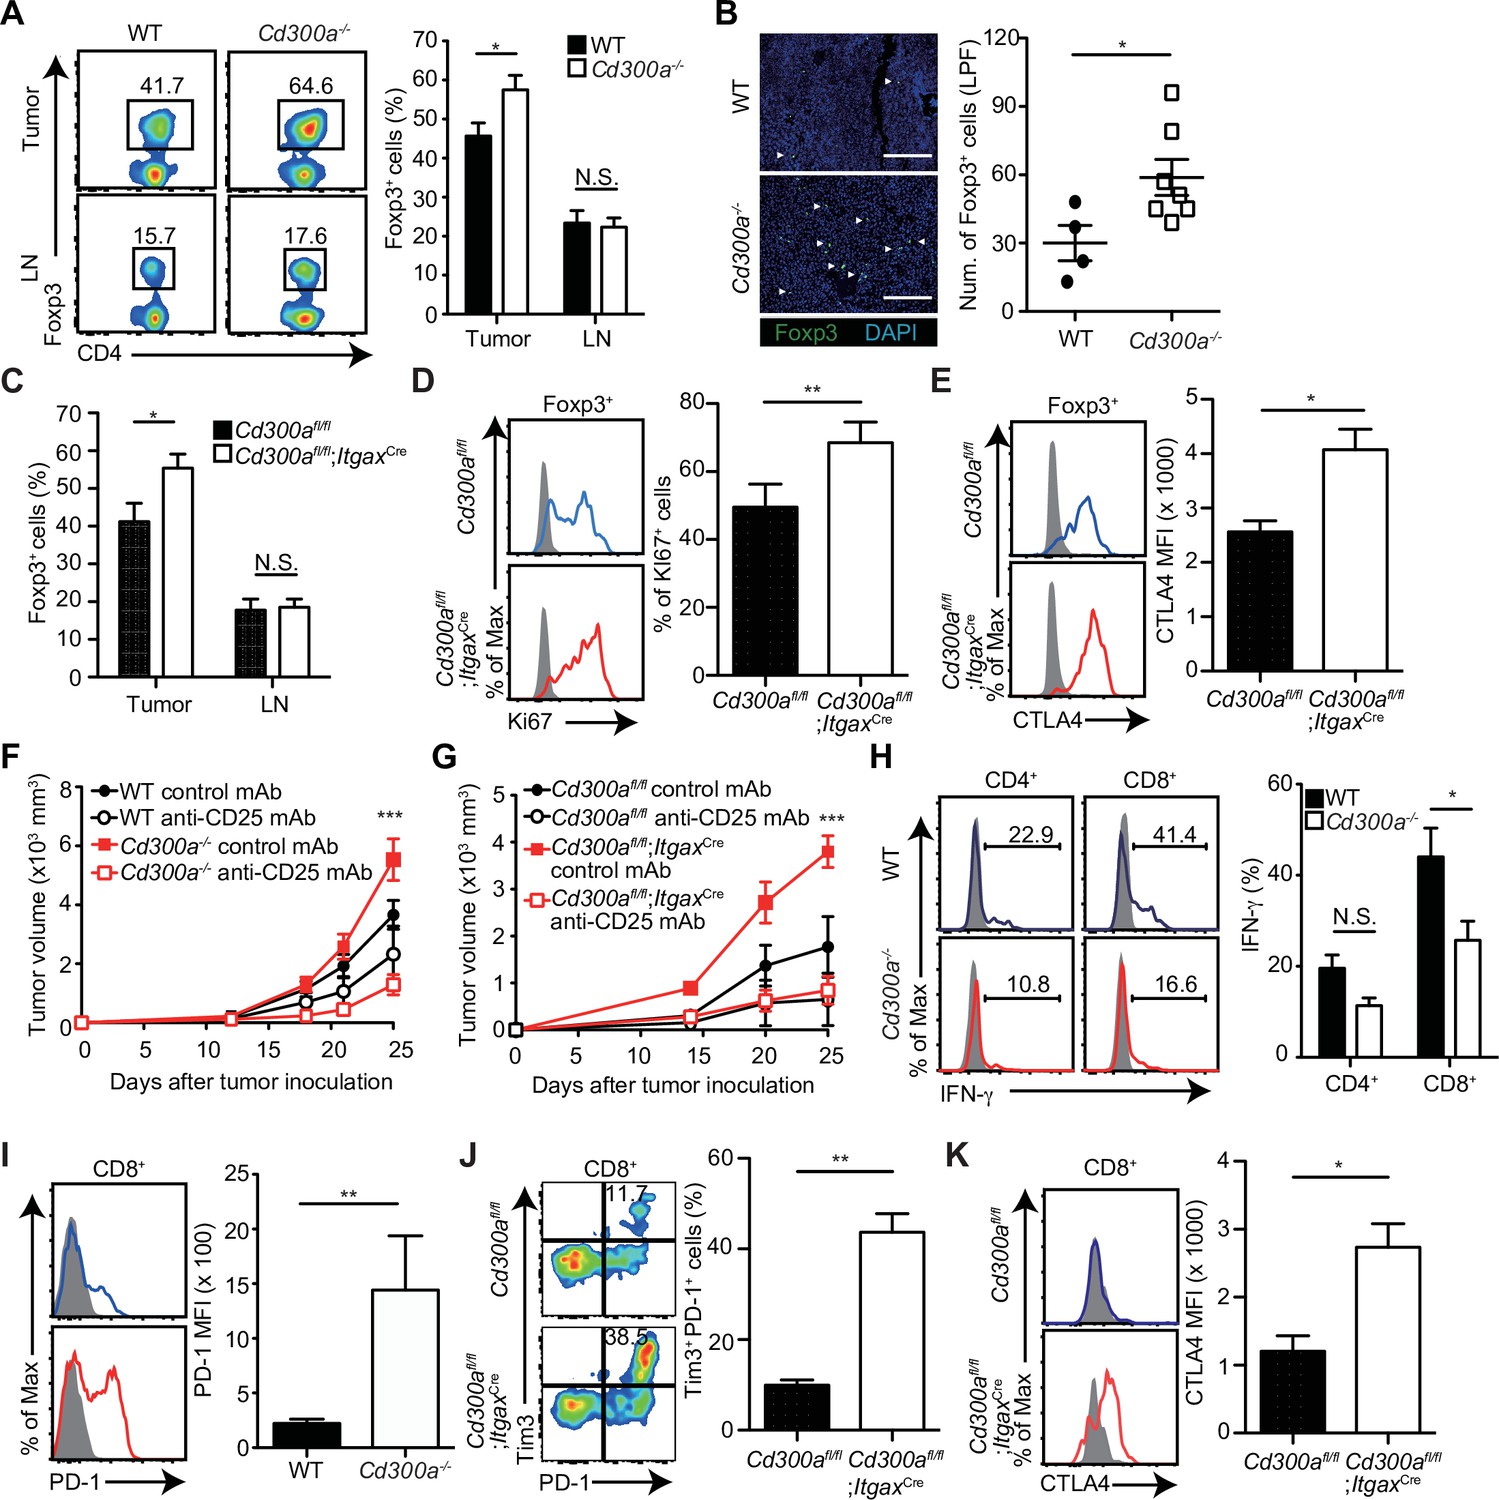
Tumor-infiltrating Treg cells are regulated by CD300a.
Tumor tissues were harvested 3 weeks after B16 melanoma inoculation. (A) Representative flow cytometry plots of Treg cells in the tumor and draining lymph node (LN) (left). Numbers adjacent to outlined areas indicate the percentage of Foxp3+ (Treg) CD4+ cells. The frequencies of Foxp3+ cells among CD4+ T cells in both wild-type (WT, n = 7) and Cd300a−/− mice (n = 8) are shown (right). (B) Fluorescence microscopy of tumor sections from Foxp3-eGFP WT (n = 4) and Cd300a−/− (n = 7) mice, stained with an anti-GFP monoclonal antibody (green) and the DNA-binding dye 4′,6-diamidino-2-phenylindole (DAPI; left). The number of Foxp3+ cells was quantified from for low-power fields (LPF) (right). White arrow shows Foxp3-positive cells. Scale bar, 200 μm. (C) Flow cytometric analysis of the frequencies of Foxp3+ cells among CD4+ T cells in the tumor (n = 11 in each group) and draining lymph node (n = 8 in each group) in Cd300afl/fl and Cd300afl/fl;ItgaxCre mice. Flow cytometric analysis of Ki67 (D) and CTLA-4 (E) expressions of Treg cells in the tumor in Cd300afl/fl (n = 9 in D, n = 3 in E) and Cd300afl/fl;ItgaxCre mice (n = 10 in D, n = 4 in E). Representative histogram (left), frequency (right), (D), and mean fluorescent intensity (MFI, right, E). (F and G) Tumor growth curve of WT (control mAb, n = 7; anti-CD25 mAb, n = 5), Cd300a−/− (control mAb, n = 8; anti-CD25 mAb, n = 6), Cd300afl/fl (control mAb, n = 4; anti-CD25 mAb, n = 3), and Cd300afl/fl;ItgaxCre (control mAb, n = 3; anti-CD25 mAb, n = 5) mice that were treated with an anti-CD25 mAb or a control antibody three times (days −6, −3, and 0) and then inoculated with B16 melanoma cells. (H) Representative histogram of IFN-γ production from tumor-infiltrating T cells after phorbol 12-myristate 13-acetate (PMA) and ionomycin stimulation (left). The proportion of IFN-γ+ cells is shown (right) (n = 6 in each group). (I–K) Flow cytometric analysis of the expressions of programmed cell death-1(PD-1) (I), PD-1 and Tim3 (J), and CTLA-4 (K) in CD8+ T cells in the tumor of Cd300afl/fl (n = 4 in I, n = 3 in J and K) and Cd300afl/fl;ItgaxCre (n = 6 in I, n = 5 in J, n = 4 in K) mice. Representative histogram (left, I and K) or dot plots (left, J) and MFI (I and K, right) or frequency (J, right). Data are given as means ± standard error of the means (SEMs). N.S.: not significant. *p < 0.05, **p < 0.01, and ***p < 0.001. p values were obtained by using a two-way analysis of variance (ANOVA) followed by Bonferroni’s post-test (A, C, and H) and the Student’s t-test (B, D, E, and I–K). Data were pooled from two (B, H, and F) or three (A, C–E, G, and I–K) independent experiments.
-
Figure 2—source data 1
Source data for Figure 2A-K.
- https://cdn.elifesciences.org/articles/61999/elife-61999-fig2-data1-v1.xlsx
Figure 2—figure supplement 1
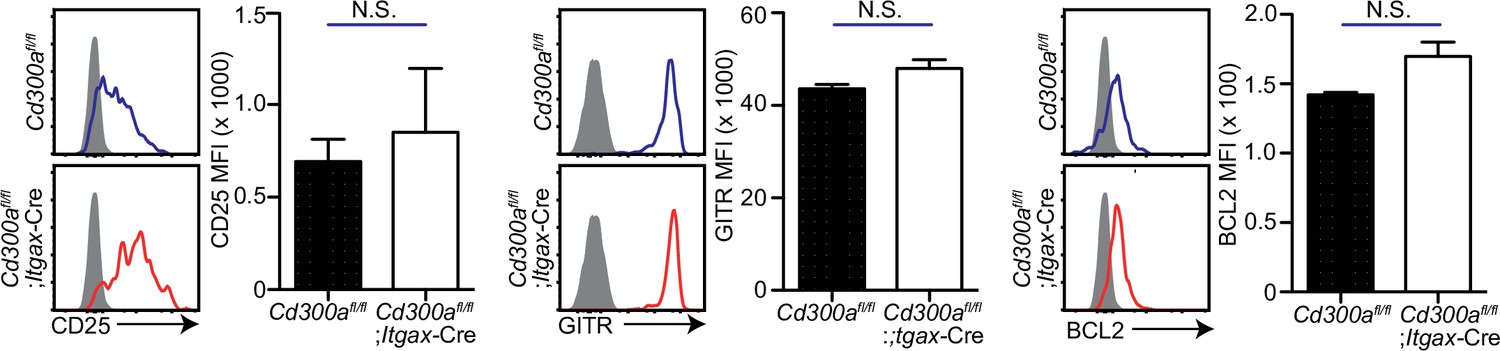
Expression of CD25, GITR, and BCL2 in tumor-infiltrating Treg cells is independent of CD300a.
Flow cytometric analysis of the expressions of CD25, GITR, and BCL2 in Treg cells in the tumor in Cd300afl/fl (n = 3) and Cd300afl/fl;ItgaxCre mice (n = 4). Representative histogram (left) and mean fluorescent intensity (MFI, right). Data are given as means ± standard error of the means (SEMs). N.S.: not significant.
-
Figure 2—figure supplement 1—source data 1
Source data for Figure 2—figure supplement 1.
- https://cdn.elifesciences.org/articles/61999/elife-61999-fig2-figsupp1-data1-v1.xlsx
Figure 2—figure supplement 2
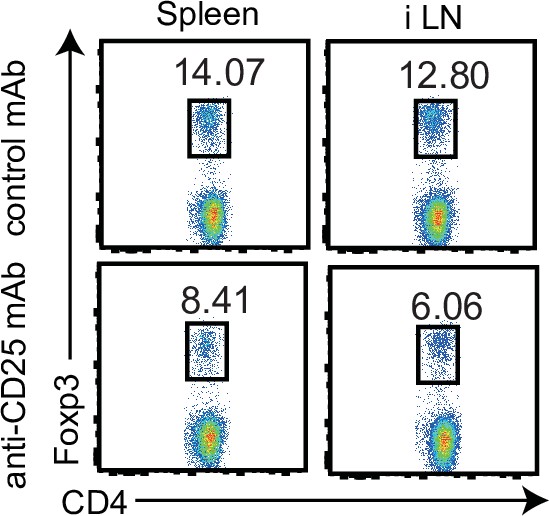
Anti-CD25 mAb reduces Treg cells.
Flow cytometric analysis of Foxp3+ cells in the spleen and inguinal lymph node (iLN) of mice injected with isotype mAb and 300 μg of anti-CD25 mAb on days −6 and −3 prior to analysis. Data are representative of two independent experiments with similar results. Data are representative of three mice.
Figure 3 with 1 supplement
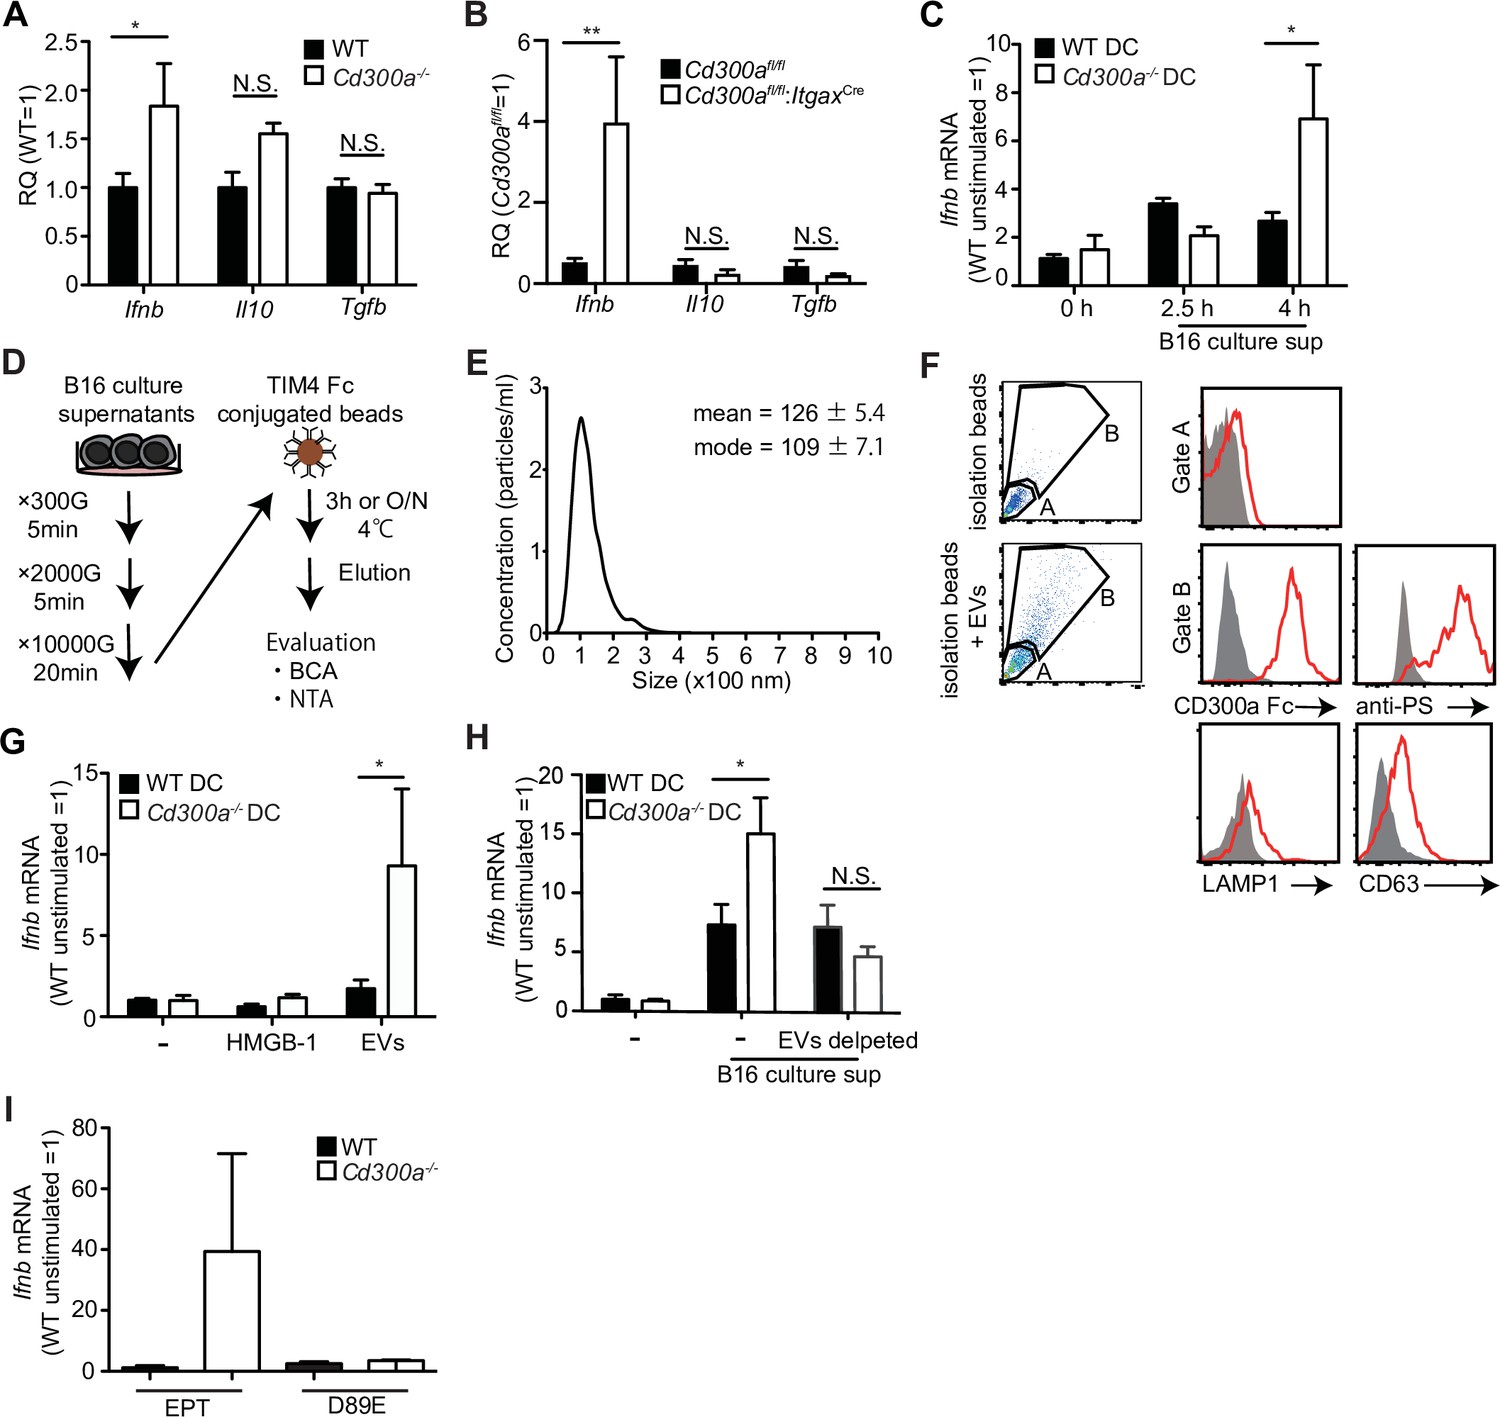
Tumor-derived extracellular vesicles (EVs) facilitate interferon-β (IFN-β) production from dendritic cells.
(A and B) Quantitative everse transcription PCR (RT-PCR) analysis of mRNA from CD11c+ cells sorted from B16 melanoma in wild-type (WT), Cd300afl/fl (n = 6), Cd300a−/− or Cd300afl/fl;ItgaxCre (n = 6) mice 2 weeks after tumor inoculation. Results are presented relative to those of the control gene encoding β-actin. (C) Quantitative RT-PCR analysis of Ifnb in WT- and Cd300a−/−-derived bone marrow-derived dendritic cells (BMDCs) that received no treatment (0 hr, n = 7) or B16 culture supernatants (2.5 hr, n = 5; 4.0 hr, n = 7). (D) A schematic illustration of EV isolation. (E) The size distribution of isolated B16-derived EVs was analyzed by NTA using NanoSight LM10. (F) Flow cytometric analysis of EVs isolated from B16 melanoma supernatants. Bead-conjugated EVs were analyzed by flow cytometry and characterized by the indicated antibody in the presence of 2 mM CaCl2. (G and H) Quantitative RT-PCR analysis of Ifnb in WT and Cd300a−/− BMDCs that received no treatment (–) (n = 6 in each group) and were treated with high-mobility group Box 1 protein (HMGB-1) (n = 3 in each group) or B16-derived EVs (n = 5 in each group) (G) or cocultured with B16 cultured supernatant with or without the depletion of EVs (n = 5 in each group) (H). (I) Quantitative RT-PCR analysis of Ifnb in WT and Cd300a−/− BMDCs that were treated with EPT (control protein; EPT-MFG-E8, n = 3 in each group) or D89E (D89E-MFG-E8, n = 3 in each group). Data are given as means ± standard error of the means (SEMs). RQ: relative quantification; N.S.: not significant. *p < 0.05 and **p < 0.01. p values were obtained by using a two-way analysis of variance (ANOVA) followed by Bonferroni’s post-test (A–C, G, and H). Data were pooled from three (A–C, G, and H) independent experiments.
-
Figure 3—source data 1
Source data for Figure 3A-C and G-I.
- https://cdn.elifesciences.org/articles/61999/elife-61999-fig3-data1-v1.xlsx
Figure 3—figure supplement 1
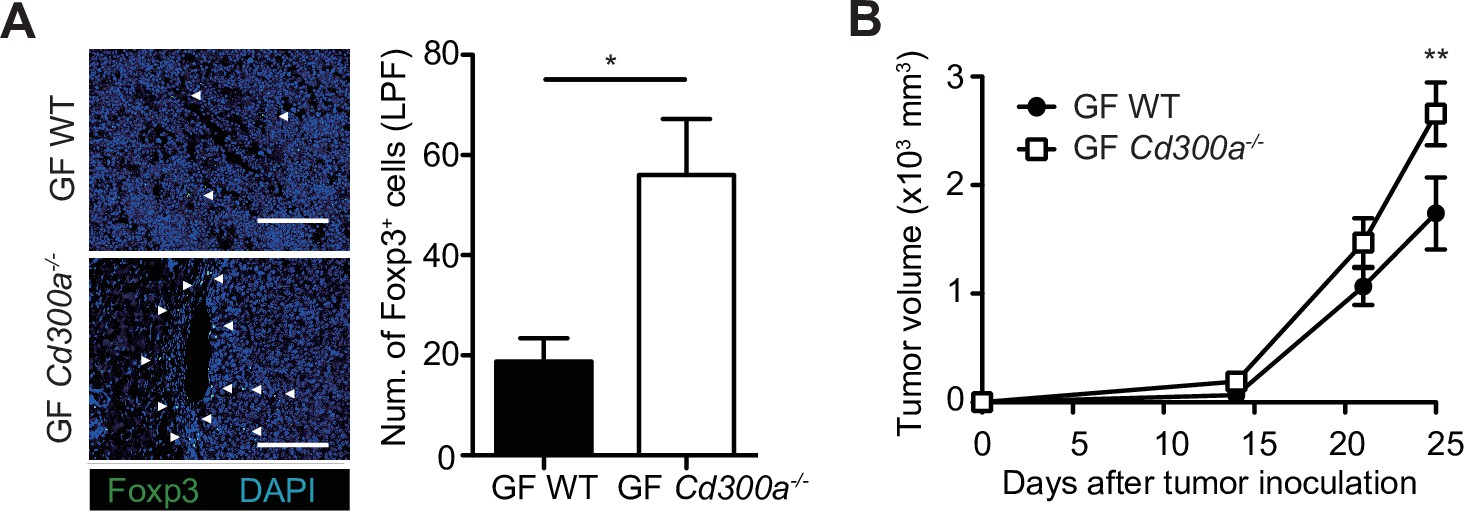
Tumor growth in Cd300a−/− mice is independent of the microbiota.
(A) Representative fluorescence micrographs of tumor sections from germ-free (GF) wild-type (WT) and Cd300a−/− mice and stained with an anti-Foxp3 monoclonal antibody (green) and the DNA-binding dye 4′,6-diamidino-2-phenylindole (DAPI; left). The number of Foxp3+ cells was quantified from four high-power fields (LPF) (right). White arrows show Foxp3-positive cells. Scale bar, 200 μm. (B) Comparison of tumor growth of B16 melanoma between GF WT (n = 5) and Cd300a−/− mice (n = 6). Data are given as means ± standard error of the means (SEMs). *p < 0.05 and **p < 0.01. p values were obtained by using the Student’s t-test (A) and a two-way analysis of variance (ANOVA) followed by Bonferroni’s post-test (B). Data were pooled from two independent experiments (A and B).
-
Figure 3—figure supplement 1—source data 1
Source data for Figure 3—figure supplement 1.
- https://cdn.elifesciences.org/articles/61999/elife-61999-fig3-figsupp1-data1-v1.xlsx
Figure 4 with 1 supplement
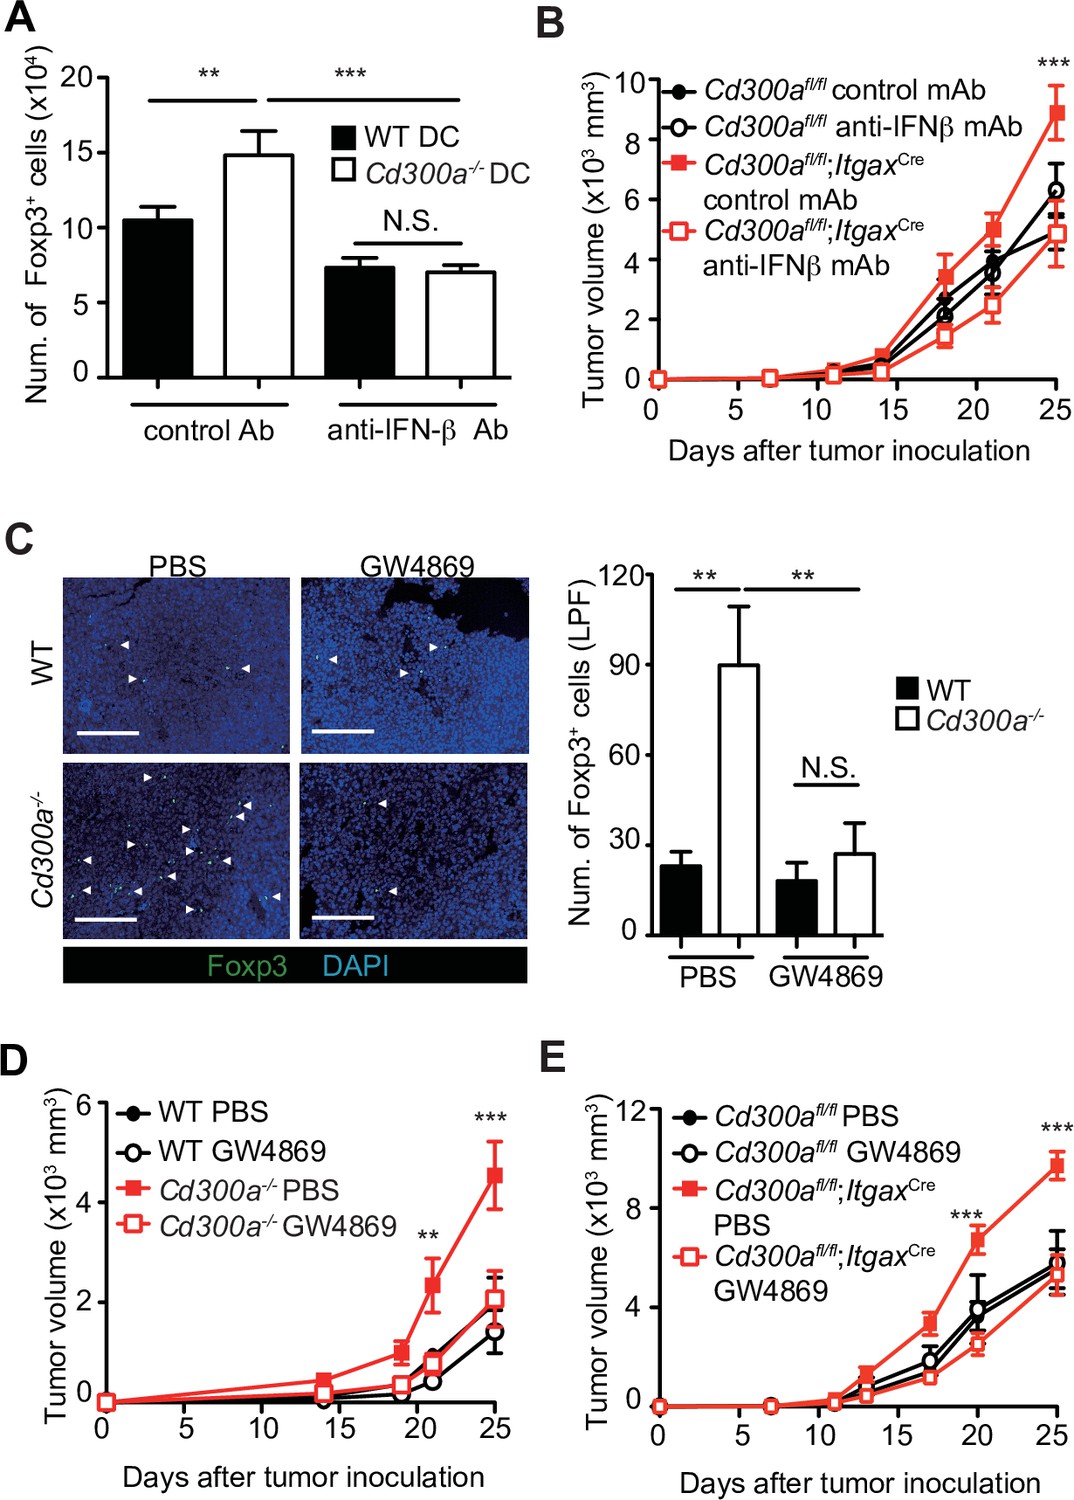
Tumor-derived extracellular vesicles (TEVs) promote tumor-infiltrating Treg cell accumulation.
(A) The number of induced Foxp3-eGFP+ cells (iTreg) generated from naive T cells by using anti-CD3, anti-CD28, Interleukin-2 (IL-2), and Transforming growth factor-β (TGF-β). These iTreg cells were cocultured with TEV-stimulated bone marrow-derived dendritic cells (BMDCs) in the presence of IL-2 and TGF-β for 5 days with a control mAb (n = 7) or an anti-interferon-β (IFN-β) mAb (n = 5). (B) Tumor growth curves of Cd300afl/fl and Cd300afl/fl;ItgaxCre mice treated with an anti-IFN-β mAb or a control mAb (control, n = 7; anti-IFN-β, n = 7 for each genotype mouse) three times (days 7, 11, and 14) and after inoculation of B16 melanoma cells. (C) Representative fluorescence micrographs of tumor sections from Foxp3-eGFP wild-type (WT) (phosphate-buffered saline (PBS), n = 4; GW4869, n = 6) and Foxp3-eGFP Cd300a−/−- mice (PBS, n = 5; GW4869, n = 6) in the absence or presence of GW4869, and stained with an anti-GFP mAb (green) and the DNA-binding dye 4′,6-diamidino-2-phenylindole (DAPI, left). The number of Foxp3+ cells was quantified from four high-power fields (LPF) (right). White arrow shows Foxp3-positive cells. Scale bar, 200 μm. Tumor growth curves of WT (PBS, n = 6; GW4869, n = 9) (D) or Cd300afl/fl (n = 4 each) (E) and Cd300a−/− mice (PBS, n = 7; GW4869, n = 9) (D) or Cd300afl/fl;Itgax-Cre (n = 6 each) (E) that were treated with GW4869 or PBS three times (days 14, 18, and 21). Data are given as means ± standard error of the means (SEMs). RQ: relative quantification; N.S.: not significant. **p < 0.01 and ***p < 0.001. p values were obtained by using a one-way analysis of variance (ANOVA) (A and C) and a two-way ANOVA followed by Bonferroni’s post-test (B, D, and E). Data were pooled from two (A and C) or three (B, D, and E) independent experiments.
-
Figure 4—source data 1
Source data for Figure 4A-E.
- https://cdn.elifesciences.org/articles/61999/elife-61999-fig4-data1-v1.xlsx
Figure 4—figure supplement 1
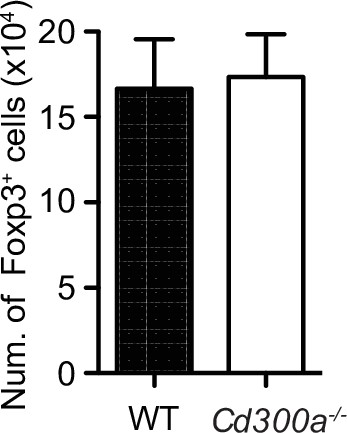
CD300a suppression of bone marrow-derived dendritic cells (BMDCs) does not affect the number of Foxp3+ splenic regulatory T (Treg) cells.
Flow cytometric data of the number of Treg cells. Foxp3-eGFP+ cells (nTreg) were isolated from spleen and cocultured with extracellular vesicle (EV)-stimulated BMDCs from wild-type (WT) and Cd300a−/− for 5 days.
-
Figure 4—figure supplement 1—source data 1
Source data for Figure 4—figure supplement 1.
- https://cdn.elifesciences.org/articles/61999/elife-61999-fig4-figsupp1-data1-v1.xlsx
Figure 5 with 2 supplements
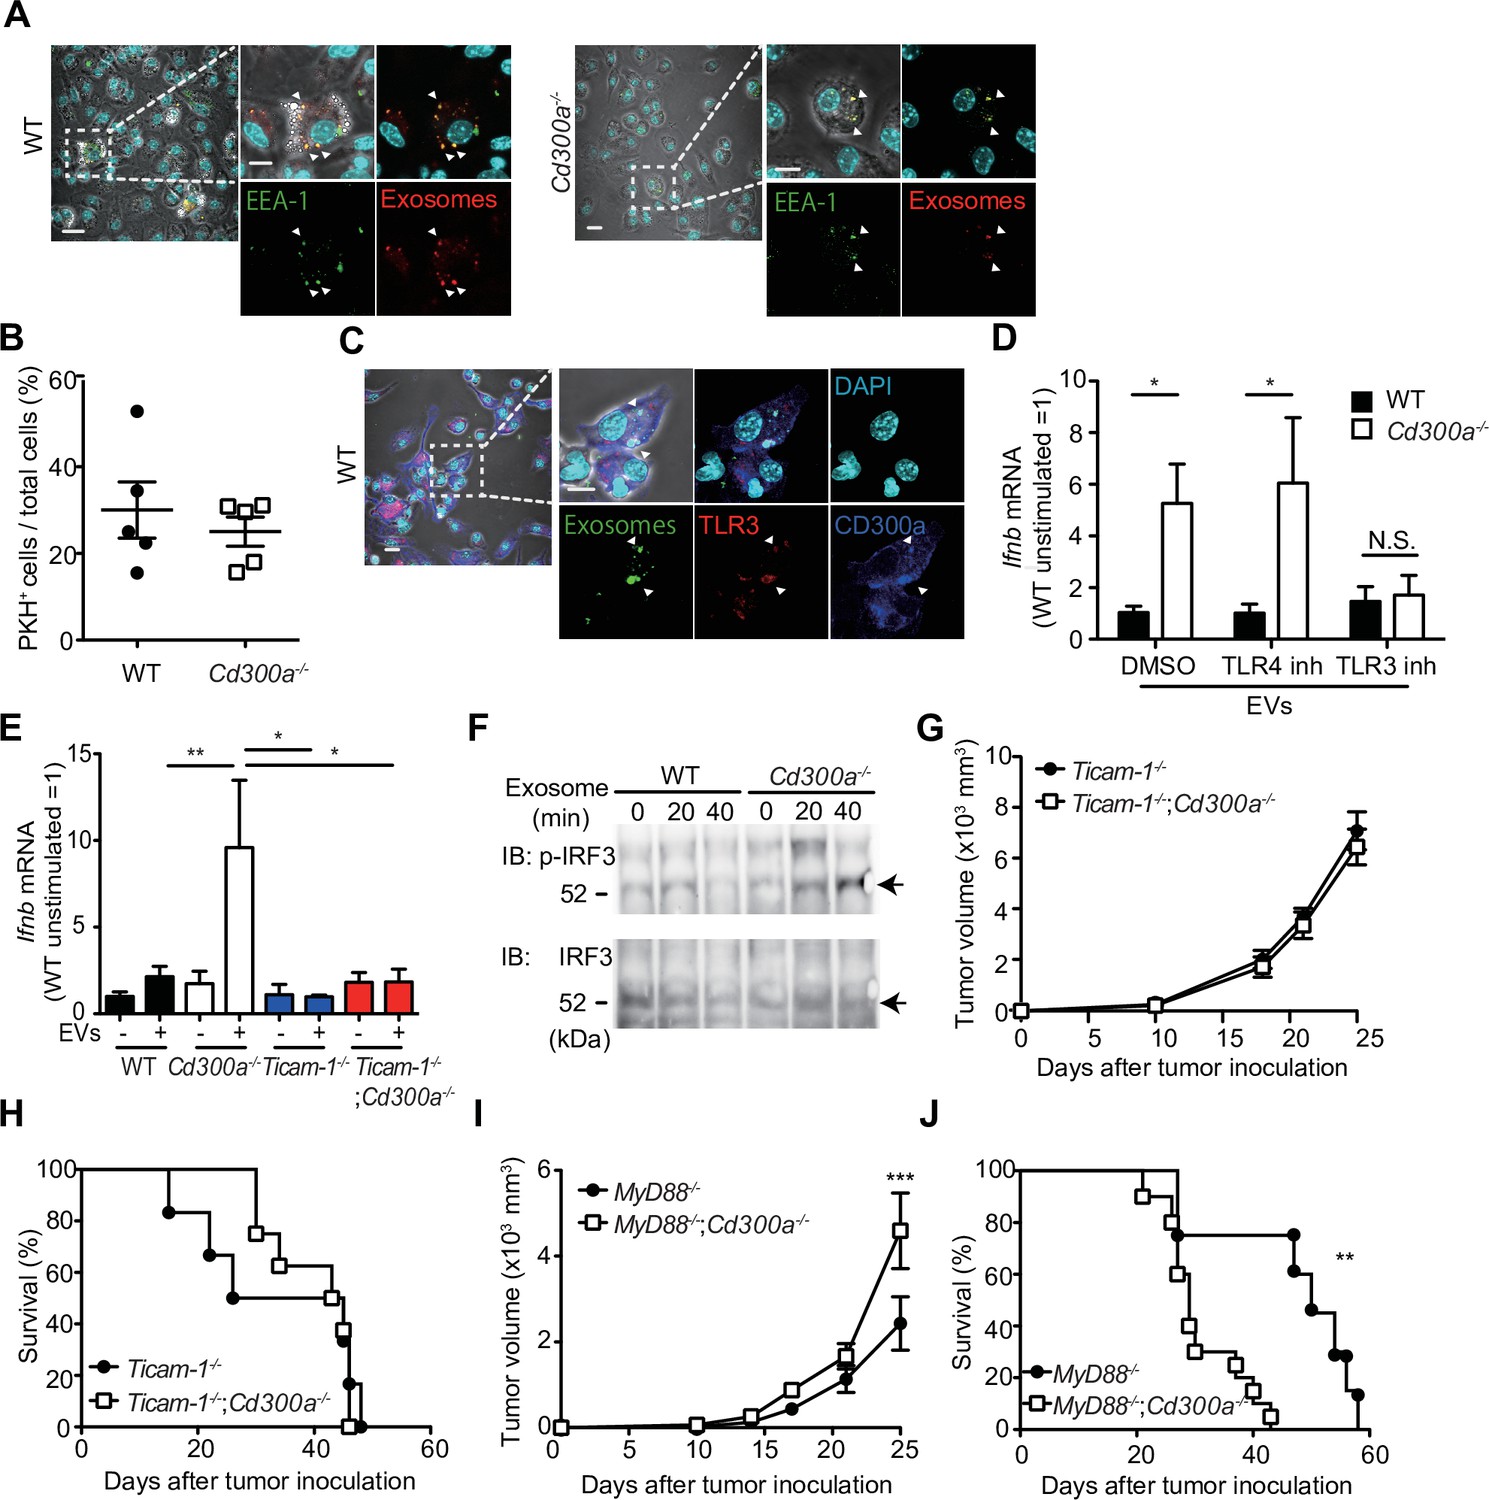
CD300a inhibits TLR3-mediated interferon-β (IFN-β) expression upon recognition of tumor-derived exosomes.
(A) Representative microscopy images of wild-type (WT) and Cd300a−/− bone marrow-derived dendritic cells (BMDCs) treated with pHrodo-labeled extracellular vesicles (EVs) to assess the localization of EVs (red) and early endosome antigen (EEA)-1 (green). Scale bar, 10 μm. Data are representative of two independent experiments. (B) Uptake of PKH-labeled tumor-derived EVs (TEVs) in WT (n = 5) and Cd300a−/− BMDCs (n = 5). (C) Representative microscopy images of WT and Cd300a−/− BMDCs treated with pHrodo-labeled exosomes to assess the localization of exosomes (green), TLR3 (red), and CD300a (blue). Scale bar, 10 μm. Data are representative of two independent experiments. (D) Quantitative RT-PCR analysis of Ifnb in WT and Cd300a−/− BMDCs treated with B16-derived exosomes in the presence of dimethyl sulfoxide (DMSO) (WT, n = 9; Cd300a−/−, n = 10), 100 nM TLR4 inhibitor (n = 7 in each group), and 50 μM TLR3 inhibitor (n = 6 in each group). (E) Quantitative RT-PCR analysis of Ifnb in WT, Cd300a−/−, ticam-1−/−, and ticam-1−/−;Cd300a−/− mice-derived BMDCs treated with B16-derived EVs (n = 5 in all group). (F) Representative immunoassay of WT and Cd300a−/− BMDCs left unstimulated (0 min) or stimulated for the indicated times with B16-derived exosomes, followed by immunoblot analysis of phosphorylated (p-) interferon regulatory factor 3 (IRF3) or total IRF3. Data are representative of two independent experiments. (G and H) Comparison of tumor growth and survival curves of B16 melanoma cells between ticam-1−/− (n = 6) and ticam-1−/−;Cd300a−/− ice (n = 9) after inoculation of B16 melanoma. (I and J) Comparison of tumor growth and survival curves of B16 melanoma between MyD8−/− (n = 9) and MyD88−/−;Cd300a−/− mice (n = 10) after inoculation of B16 melanoma. Data are given as means ± standard error of the means (SEMs). N.S.: not significant. *p < 0.05, **p < 0.01, and ***p < 0.001. p values were obtained by using the Student’s t-test (B), a two-way analysis of variance (ANOVA) followed by Bonferroni’s post-test (D, E, G, and I), and the log-rank test (H and J). Data were pooled from two (B, E, and H) or three (D, I, and J) independent experiments.
-
Figure 5—source data 1
Source data for Figure 5B, D, E, and G-J.
- https://cdn.elifesciences.org/articles/61999/elife-61999-fig5-data1-v1.xlsx
Figure 5—figure supplement 1
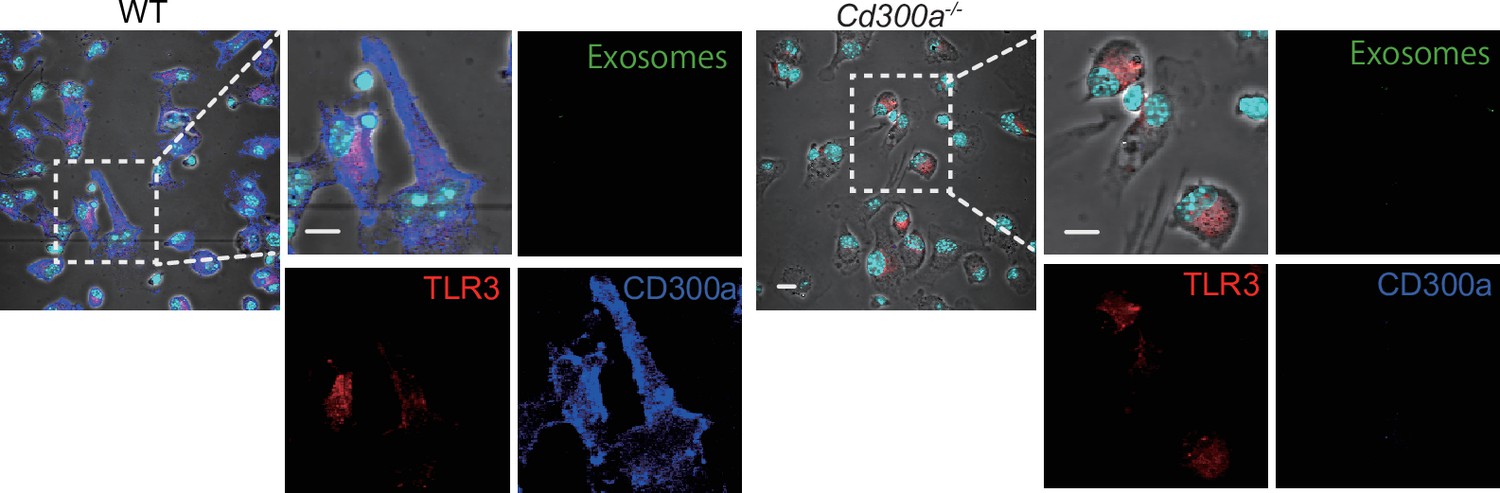
CD300a is localized on the surface of plasma membrane without stimulation.
Representative confocal microscopy images of bone marrow-derived dendritic cells (BMDCs) stained with anti-TLR3 and anti-CD300a mAbs. Data were pooled from two independent experiments.
Figure 5—figure supplement 2
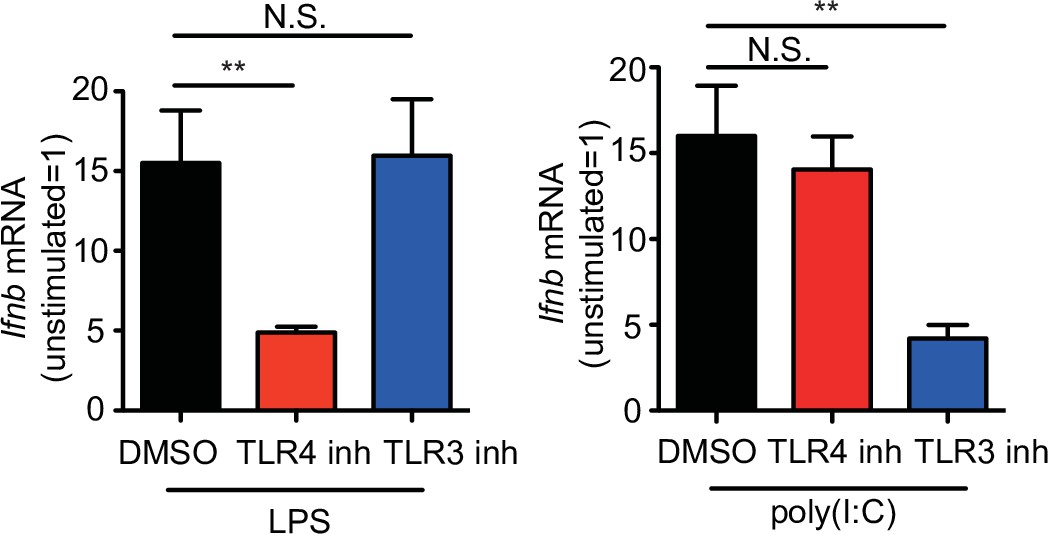
The inhibitors of TLR4 and TLR3 suppress the expression of Ifnb.
Quantitative RT-PCR analysis of Ifnb in bone marrow-derived dendritic cells (BMDCs) stimulated with LPS or poly(I:C) in the presence of TLR4 or TLR3 inhibitors (LPS and poly(I:C), n = 12 in each group; TLR4 and TLR3 inhibitors, n = 9 in each group). Data are given as means ± standard error of the means (SEMs). N.S.: not significant. **p < 0.01. p values were obtained by using a one-way analysis of variance (ANOVA) followed by Bonferroni’s post-test. Data were pooled from three independent experiments.
-
Figure 5—figure supplement 2—source data 1
Source data for Figure 5—figure supplement 2.
- https://cdn.elifesciences.org/articles/61999/elife-61999-fig5-figsupp2-data1-v1.xlsx
Figure 6 with 1 supplement
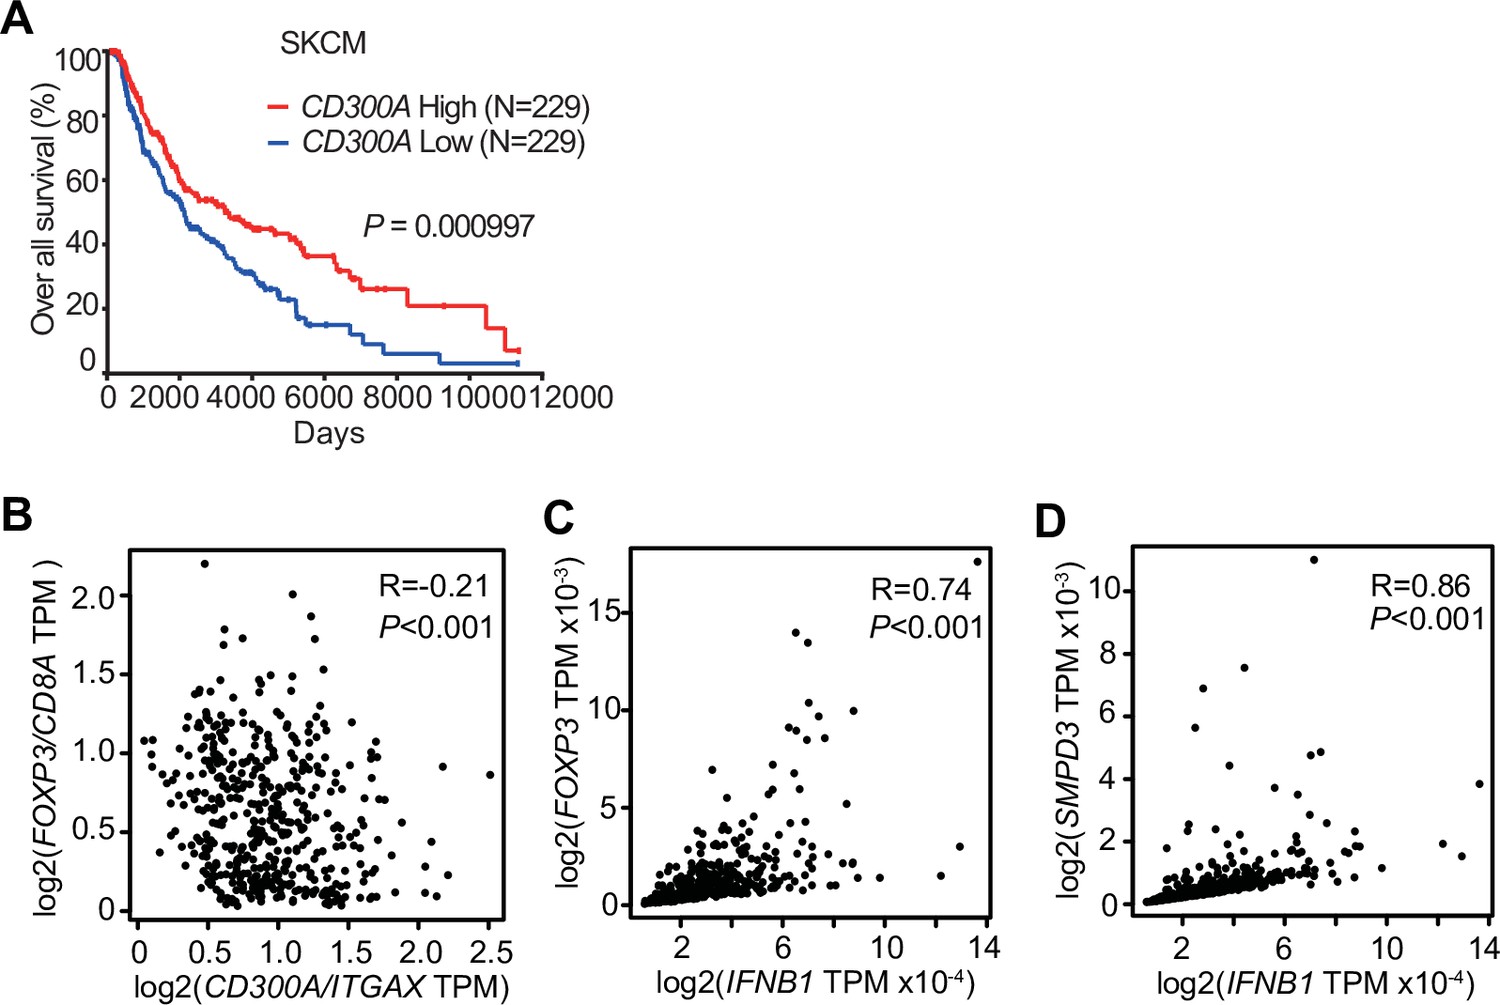
CD300A expression associates with survival of human melanoma patients.
(A) Kaplan plot showing low and high CD300A expressions in skin cutaneous melanoma (SKCM) patients obtained by performing a meta-analysis of The Cancer Genome Atlas (TCGA) database. Median values were used as thresholds (numbers of both low and high expression patients = 229). (B–D) Spearman correlation analysis of TCGA skin cutaneous melanoma database by using GEPIA2. FOXP3, IFNB1, and SMPD3 expression were normalized by GAPDH expression (C and D).
Figure 6—figure supplement 1
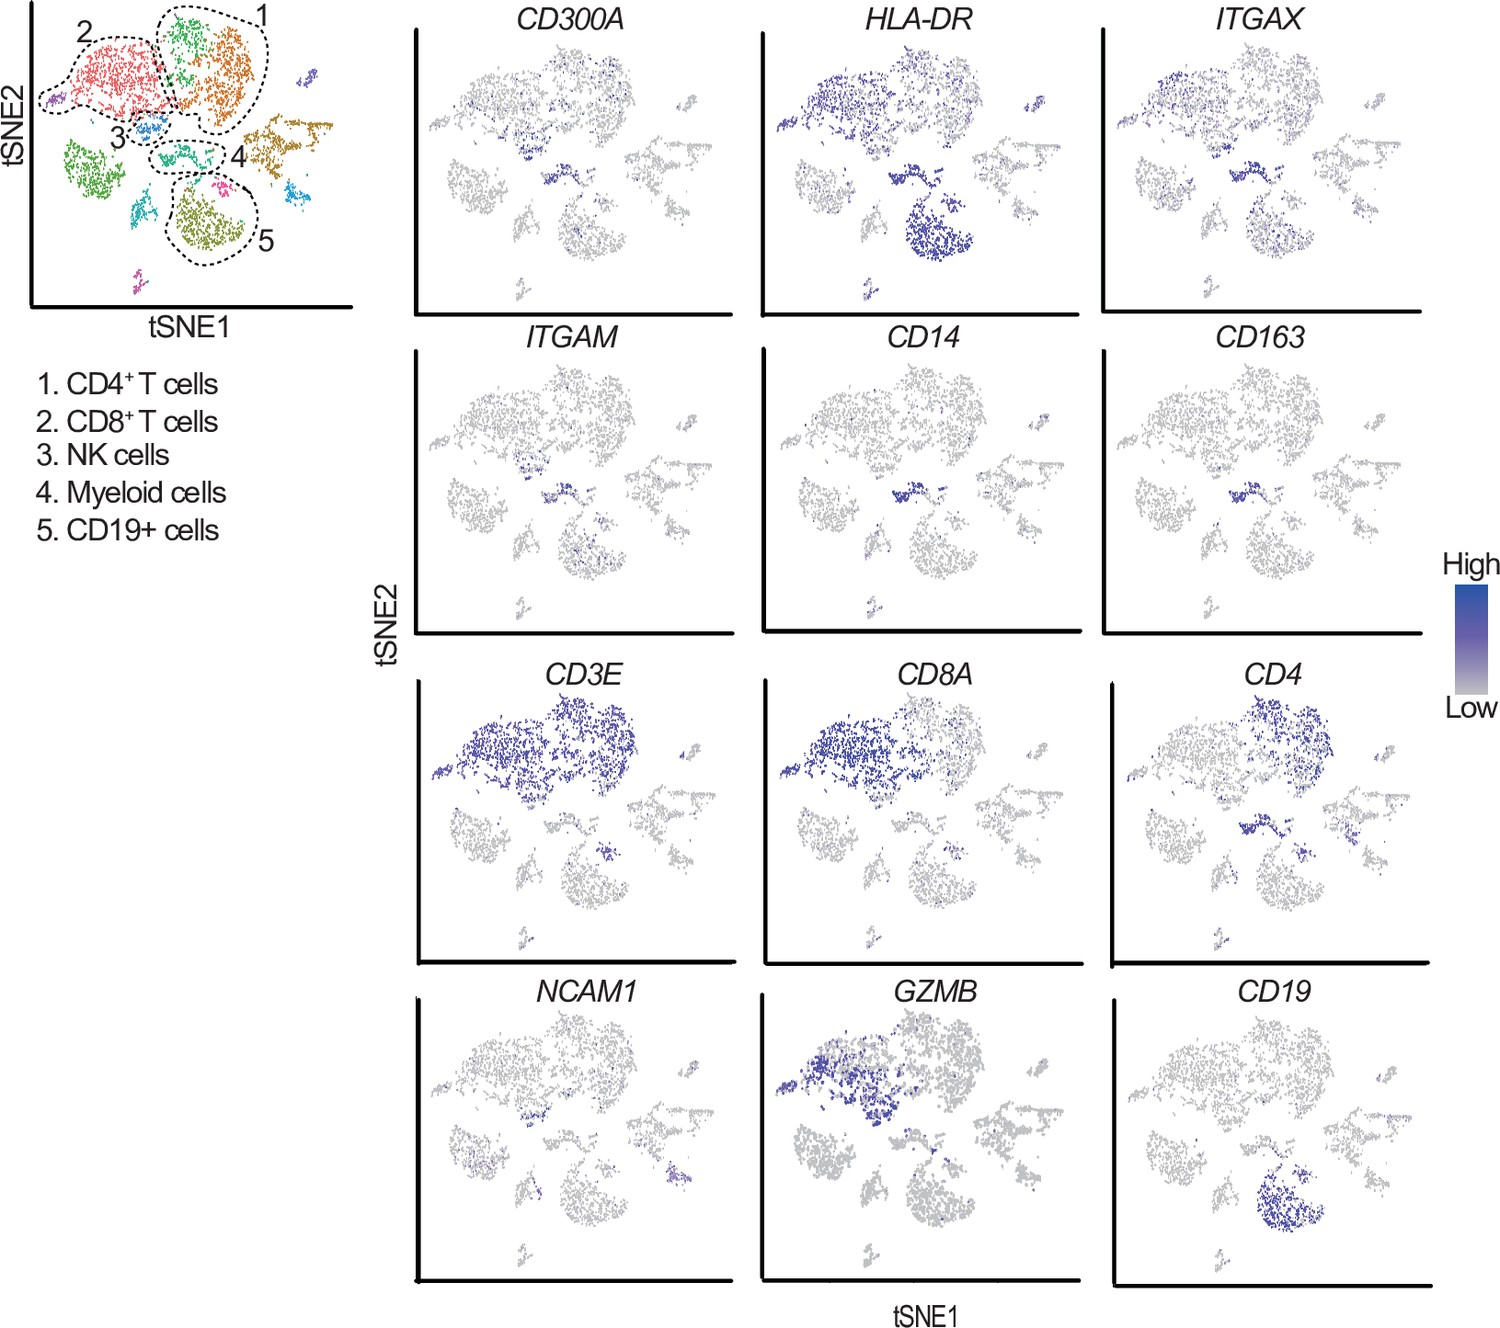
t-Distributed stochastic neighbor embedding (tSNE) plots of the immune cell landscape isolated from melanoma patients.
Indicated gene expressions were reanalyzed by using GSE76056. Cell clusters of CD4+ T cells, CD8+ T cells, NK cells, myeloid cells, and CD19+ cells were determined by CD4/CD3E, CD8A/CD3E, NCAM1(CD56)/GZMB, ITGAM(CD11B)/ITGAX(CD11C)/HLA-DR/CD14/CD163, and CD19 expression, respectively.
Figure 7

A schematic model of the role of tumor-derived extracellular vesicle (TEV) and CD300a in tumor immunity.
RNA-containing TEV is incorporated into the endosomes in dendritic cells (DCs), where phosphatidylserine (PS) on TEV binds to CD300a and inhibits the TLR3–TRIF–IRF3 signaling pathway initiated by TEV-derived RNA binding to TLR3, resulting in the decrease in interferon-β (IFN-β) production by DCs and the number of tumor-infiltrating Treg cells. The Treg cells regulate tumor development.
Tables
Key resources table
| Reagent type (species) or resource | Designation | Source or reference | Identifiers | Additional information |
|---|---|---|---|---|
| Genetic reagent (M. musculus) | Cd300a−/− | PMID:26855029 | ||
| Genetic reagent (M. musculus) | Cd300afl/fl | PMID:26855029 | ||
| Genetic reagent (M. musculus) | Cd300afl/fl;Lyz2Cre | PMID:26855029 | ||
| Genetic reagent (M. musculus) | Cd300afl/fl;ItgaxCre | PMID:26855029 | ||
| Genetic reagent (M. musculus) | Ticam1−/−;Cd300a−/− | PMID:26855029 | ||
| Genetic reagent (M. musculus) | MyD88−/−;Cd300a−/− | PMID:26855029 | ||
| Genetic reagent (M. musculus) | Rag1−/−;Cd300a−/− | PMID:26855029 | ||
| Genetic reagent (M. musculus) | Ticam1−/− | PMID:1285581 Oriental Bio Service | ||
| Genetic reagent (M. musculus) | MyD88−/− | PMID:9697844Oriental Bio Service | ||
| Genetic reagent (M. musculus) | Rag1−/− | Jackson Laboratory | ||
| Genetic reagent (M. musculus) | Foxp3eGFP | PMID:18209052 | Dr. B. Malissen (UM2 Aix-Marseille Université) | |
| Genetic reagent (M. musculus) | Foxp3eGFP;Cd300a−/− | PMID:26855029 | ||
| Cell line (M. musculus) | B16 | RIKEN Cell Bank | RCB1283RRID:CVCL_ F936 | |
| Antibody | Rat anti-CD8-PE-Cy7 (53–6.7, mouse monoclonal) | BD Bioscience | Cat# 552,877RRID:AB_ 394,506 | FACS (1:5) |
| Antibody | Rat anti-CD4-APC (RM4-5, mouse monoclonal) | BD Bioscience | Cat# 553,051RRID:AB_398528 | FACS (1:5) |
| Antibody | Rat anti-CD11b-APC-Cy7 (M1/70, monoclonal) | BD Bioscience | Cat# 557,657RRID:AB_396772 | FACS (1:5) |
| Antibody | Armenian hamster anti-CD11c FITC (HL3, monoclonal) | BD Bioscience | Cat# 553,801RRID:AB_553801 | FACS (1:5) |
| Antibody | Rat anti-I-A/I-E BV500 (M5/114.15.2, monoclonal) | BD Bioscience | Cat# 562,366RRID:AB_11153488 | FACS (1:5) |
| Antibody | Rat anti-Ly6G PE (1A8, monoclonal) | BD Bioscience | Cat# 551,461RRID:AB_394208 | FACS (1:5) |
| Antibody | Rat anti-CD62L PE (MEL-14, monoclonal) | BD Bioscience | Cat# 553151, RRID:AB_394666 | FACS (1:5) |
| Antibody | Rat anti-CD44 APC (IM7, monoclonal) | BD Bioscience | Cat# 559250, RRID:AB_398661 | FACS (1:5) |
| Antibody | Rat anti-CD25 PE (PC61, monoclonal) | BD Bioscience | Cat# 553866, RRID:AB_395101 | FACS (1:5) |
| Antibody | Mouse anti-Ki67 Alexa Fluor 647(B56, monoclonal) | BD Bioscience | Cat# 558615, RRID:AB_647130 | FACS (1:5) |
| Antibody | Rat anti-IFN-g Alexa Fluor 488 (XMG1.2, monoclonal) | BD Bioscience | Cat# 557724, RRID:AB_396832 | FACS (1:5) |
| Antibody | Rat anti-CD63 APC-Cy7 (NVG-2, monoclonal) | BioLegend | Cat# 143907, RRID:AB_2565497 | FACS (1:5) |
| Antibody | Armenian hamster anti-CD103 APC (2E7, monoclonal) | BioLegend | Cat# 121,414RRID:AB_1227502 | FACS (1:5) |
| Antibody | Mouse anti-XCR1 PE (ZET, monoclonal) | BioLegend | Cat# 148,204RRID:AB_2563843 | FACS (1:5) |
| Antibody | Mouse anti-Bcl-2 PE (BCL/10C4, monoclonal) | BioLegend | Cat# 633508, RRID:AB_2290367 | FACS (1:5) |
| Antibody | Rat anti-GITR PE-Cy7 (DTA-1, monoclonal) | BioLegend | Cat# 126317, RRID:AB_2563385 | FACS (1:5) |
| Antibody | Rat anti-PD-1 PE-Cy7 (RMP1-30, monoclonal) | BioLegend | Cat# 109,109RRID:AB_572016 | FACS (1:5) |
| Antibody | Rat anti-Tim3 PE (RMT3-23, monoclonal) | BioLegend | Cat# 119703, RRID:AB_345377 | FACS (1:5) |
| Antibody | Armenian hamster anti-CTLA-4 biotin (UC10-4B9, monoclonal) | BioLegend | Cat# 106303, RRID:AB_313252 | FACS (1:5) |
| Antibody | Mouse anti-Foxp3 Alexa Fluor 488 (150D, monoclonal) | BioLegend | Cat# 320012, RRID:AB_439748 | FACS (1:5) |
| Antibody | Mouse anti-CD45.2 APC (104, monoclonal) | BioLegend | Cat# 109814, RRID:AB_389211 | FACS (1:5) |
| Antibody | Rat anti-CD40 APC (3/23, monoclonal) | BioLegend | Cat# 124612, RRID:AB_1134072 | FACS (1:5) |
| Antibody | Rat anti-IFNβ (7F-D3, monoclonal) | Yamasa | Cat# 7,891 | Vivo(50 μg/mouse, three times) |
| Antibody | Mouse anti-PS FITC (1H6, monoclonal) | Merck Millipore | Cat# 16-256, RRID:AB_492616 | FACS (1:5) |
| Antibody | Rat anti-CD16/CD32 (2.4G2, monoclonal) | TONBO Bioscience | Cat# 70-0161, RRID:AB_2621487 | FACS (1:5) |
| Antibody | Mouse anti-CD300a (EX42, monoclonal) | PMID:31155312 | FACS (0.1 μg) | |
| Antibody | Rabbit anti-GFP (D5.1, monoclonal) | Cell signaling | Cat# 2956, RRID:AB_1196615 | IHC(1:200) |
| Antibody | Rat anti-Foxp3 (FJK-16s, monoclonal) | Thermo Fisher | Cat#14-5773-82RRID:AB_467576 | IHC(1:200) |
| Antibody | Mouse anti-EEA-1 (1G11, monoclonal) | eBioscience | Cat# 14-9114RRID:AB_2572929 | ICC(1:200) |
| Antibody | Rat anti-TLR3 (11F8, monoclonal) | Biolegend | Cat# 141902, RRID:AB_10901162 | ICC(1:200) |
| Antibody | Rabbit anti-phosphorylated IRF3 (4D4G, monoclonal) | Cell Signaling Technology | Cat# 4,947 | WB(1:1000) |
| Antibody | Rabbit anti-IRF3 (FL-425, polyclonal) | Santa Cruz Biotechnology | Cat# sc-9082, RRID:AB_2264929 | WB(1:1000) |
| Antibody | Hamster anti-CD3 purified (145–2C11, monoclonal) | TONBO Bioscience | Cat# 70-0031, RRID:AB_2621472 | Cell culture(0.33 μg/ml) |
| Antibody | Syrian hamster anti-CD28 purified (37.51, monoclonal) | Biolegend | Cat# 102101, RRID:AB_312866 | Cell culture(2 μg/ml) |
| Sequence-based reagent | Ifnb_F | This paper | PCR primers | CAGCTCCAAGAAAGGACGAAC |
| Sequence-based reagent | Ifnb_R | This paper | PCR primers | GGCAGTGTAACTCTTCTGCAT |
| Sequence-based reagent | Il10_F | This paper | PCR primers | GCTGGACAACATACTGCTAACC |
| Sequence-based reagent | Il10_R | This paper | PCR primers | ATTTCCGATAAGGCTTGGCAA |
| Sequence-based reagent | Tgfb_F | This paper | PCR primers | TGACGTCACTGGAGTTGTACGG |
| Sequence-based reagent | Tgfb_R | This paper | PCR primers | GGTTCATGTCATGGATGGTGC |
| Peptide, recombinant protein | Streptavidin | Thermo Fisher | Cat. #: 434,302 | |
| Peptide, recombinant protein | GM-CSF | WAKO | Cat. #: 434,302 | |
| Peptide, recombinant protein | IL-4 | WAKO | Cat. #: 434,302 | |
| Peptide, recombinant protein | IL-2 | BD Pharmingen | ||
| Peptide, recombinant protein | TGF-β | R&D system | ||
| Commercial assay or kit | Exosome Isolation Kit | WAKO | ||
| Commercial assay or kit | Tumor dissociation kit | Miltenyi Biotec | ||
| Commercial assay or kit | High-Capacity cDNA Reverse Transcription Kit | Applied Biosystems | ||
| Commercial assay or kit | Power SYBER Green PCR Master Mix | Applied Biosystems | ||
| Chemical compound, drug | GW4869 | Cayman Chemial | Cat. #: 13,127 | |
| Chemical compound, drug | TLR3/dsRNA complex inhibitor | Merck | Cat. #: 614,310 | |
| Chemical compound, drug | TLR4 inhibitor (TAK-242) | Merck | Cat. #: 614,316 | |
| Chemical compound, drug | pHrodo Red ester | Thermo Fisher | ||
| Chemical compound, drug | pHrodo STP Green | Thermo Fisher | ||
| Chemical compound, drug | HRP-conjugated dextran polymer | PerkinElmer | ||
| Software, algorithm | GraphPad Prism | GraphPad Prism | ||
| Software, algorithm | Hybrid cell counts software | Keyence | ||
| Software, algorithm | R Seurat | R: The R Project for Satistical Computing | ||
| Software, algorithm | FlowJo | TreeStar |
Additional files
Download links
A two-part list of links to download the article, or parts of the article, in various formats.
Downloads (link to download the article as PDF)
Open citations (links to open the citations from this article in various online reference manager services)
Cite this article (links to download the citations from this article in formats compatible with various reference manager tools)
Tumor-derived extracellular vesicles regulate tumor-infiltrating regulatory T cells via the inhibitory immunoreceptor CD300a
eLife 10:e61999.
https://doi.org/10.7554/eLife.61999


