Efficient mate finding in planktonic copepods swimming in turbulence
- Institute of Environmental Engineering, ETH Zürich, Switzerland
- Univ. Lille, CNRS, Univ. Littoral Côte d'Opale, UMR 8187 - LOG - Laboratoire d'Océanologie et de Géosciences, Station Marine de Wimereux, Université de Lille, France
- Swiss Federal Institute of Forest, Snow and Landscape Research, Switzerland
- Swiss Federal Institute of Aquatic Science and Technology, Switzerland
Figures
Figure 1
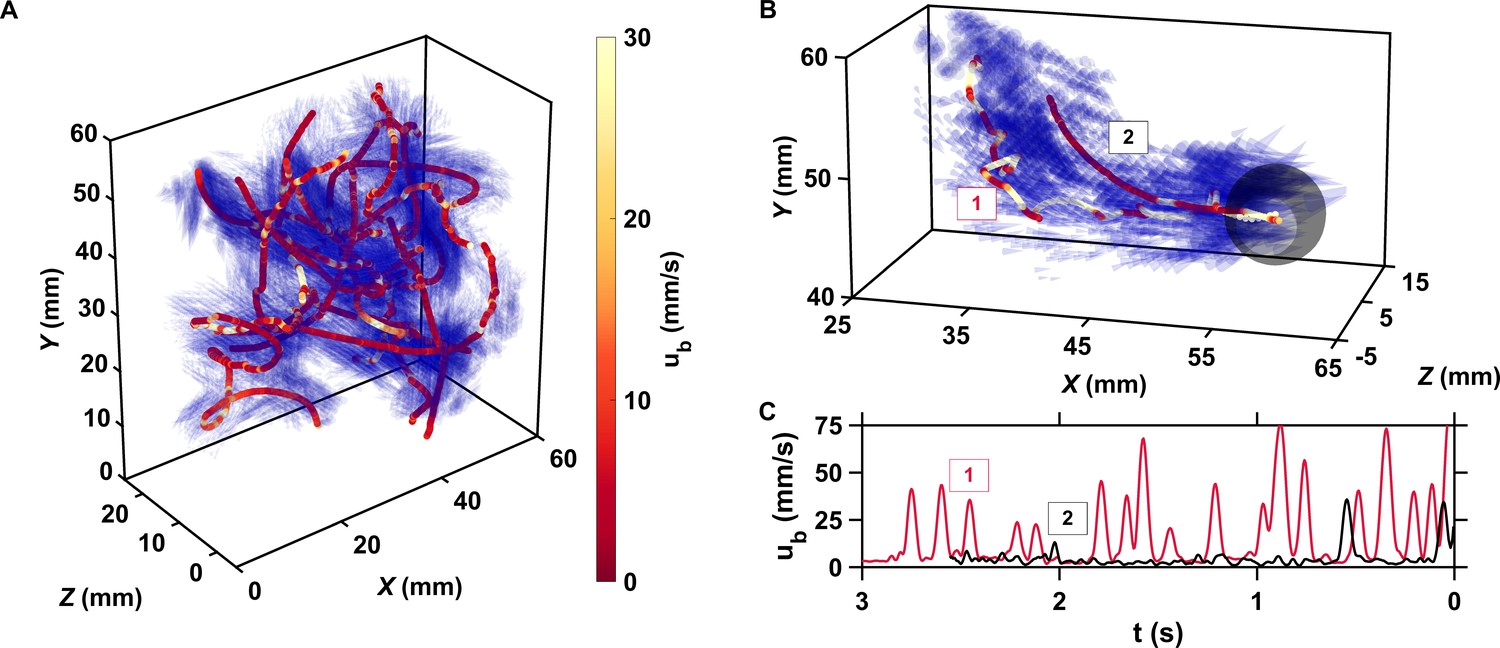
The motion of copepods in turbulence, and therefore their encounters, are governed by the coupling between active swimming and fluid motion.
(A) Examples of trajectories of copepods swimming in turbulence, color-coded with the magnitude of their velocity ub with respect to the flow to emphasize the contribution of motility, and instantaneous flow field along the trajectories. The length of the cones is proportional to the flow velocity. Simultaneous measurements of tracer and copepod trajectories allow retrieving the behavioral component of their motion. Because the cones are semi-transparent to allow visualizing the copepod trajectories, it may be necessary to zoom in to see them individually. (B) Trajectories of two copepods up to the time of encounter, showing periods of vigorous swimming where ub is large, and periods of more passive motion dominated by turbulent advection where ub is negligible compared to the flow velocity. The gray sphere shows the perception volume, within which hydrodynamic perturbations from nearby organisms can be detected. As described below, organisms within the perception volume tend to move toward each other. (C) ub versus time to encounter t for the two trajectories shown in panel B. Relocation jumps are clearly visible. They represent the active component of the motion and allow copepods to depart from the flow streamlines (Michalec et al., 2017).
Figure 2
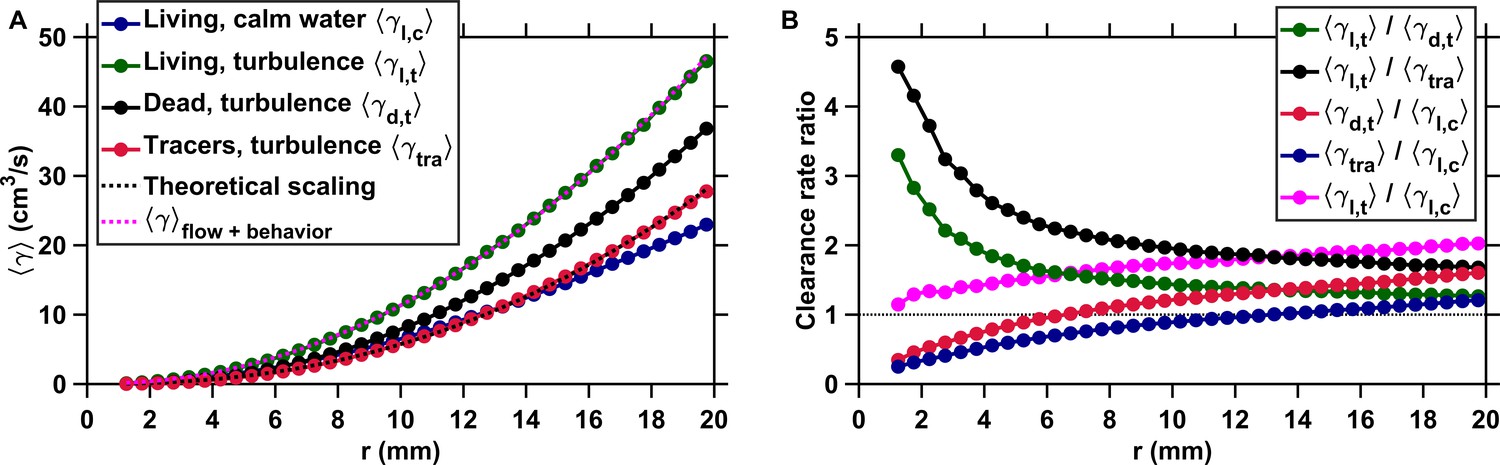
Active motion boosts encounter rates in turbulence.
(A) Mean clearance rate versus the radius of the perception volume r for tracers (, red), dead copepods passively transported by turbulence (, black), and living copepods in turbulence (, green) and in calm water (, blue). is directly obtained from measured for different values of the pairwise separation distance r. We verify the accuracy of our flow field measurements by plotting the theoretical prediction for the clearance rate of tracers, based on the (for the inertial subrange) and (for the viscous subrange) Kolmogorov scaling of the velocity differences (Saffman and Turner, 1956), using proportionality constants found empirically (Pécseli et al., 2014) (dashed line, black). The prediction agrees very well with our experimental data. We show that a very accurate estimation of down to the radius of hydrodynamic interactions can be achieved by considering the separate contributions of turbulent advection and the self-locomotion of two independent organisms. We compute for living copepods in turbulence, using where is randomly drawn from the probability density function of the pairwise radial relative velocity of tracers at a given separation distance r, and is the pairwise radial relative velocity of the copepods. is computed using randomly sampled values of the organism velocity with respect to the flow ub to isolate the behavioral part of their motion. agrees very well with the measurements for mm (dashed line, magenta). It deviates for shorter r because of behavioral interactions within the radius of hydrodynamic interactions: the ratio is approximately two at mm and one at mm. These interactions are studied in the next section. (B) Ratios of mean clearance rates. Active motion plays a preponderant role in enhancing encounter rates in turbulence, as evidenced by a ratio (green) larger than one, especially at short r comparable to or below the radius of hydrodynamic interactions. results from turbulent velocity differences, organism motion, and inertia, while results from turbulent velocity differences and inertia only. The contribution of inertia to is lower than that of self-locomotion but not negligible: the ratio (black), where is the mean clearance rate of small, neutrally buoyant flow tracers that have negligible inertia, is larger than . This indicates that the combination of turbulent velocity differences and effects due to inertia leads to a larger than turbulent velocity differences alone. We also note that while being passively transported by turbulence leads to a larger at large r compared to motility in still water, as evidenced by the ratios (red) and (blue) above one for large r, it provides less mating opportunities than self-locomotion in calm hydrodynamic conditions at shorter r. This indicates that being passively transported by the flow is not an efficient mechanism to encounter many mates within the perception radius. It requires active swimming in turbulence for copepods to achieve an encounter rate that is comparable or even larger than in calm hydrodynamic conditions (ratio , magenta).
-
Figure 2—source data 1
Source data for Figure 2.
- https://cdn.elifesciences.org/articles/62014/elife-62014-fig2-data1-v1.xlsx
Figure 3
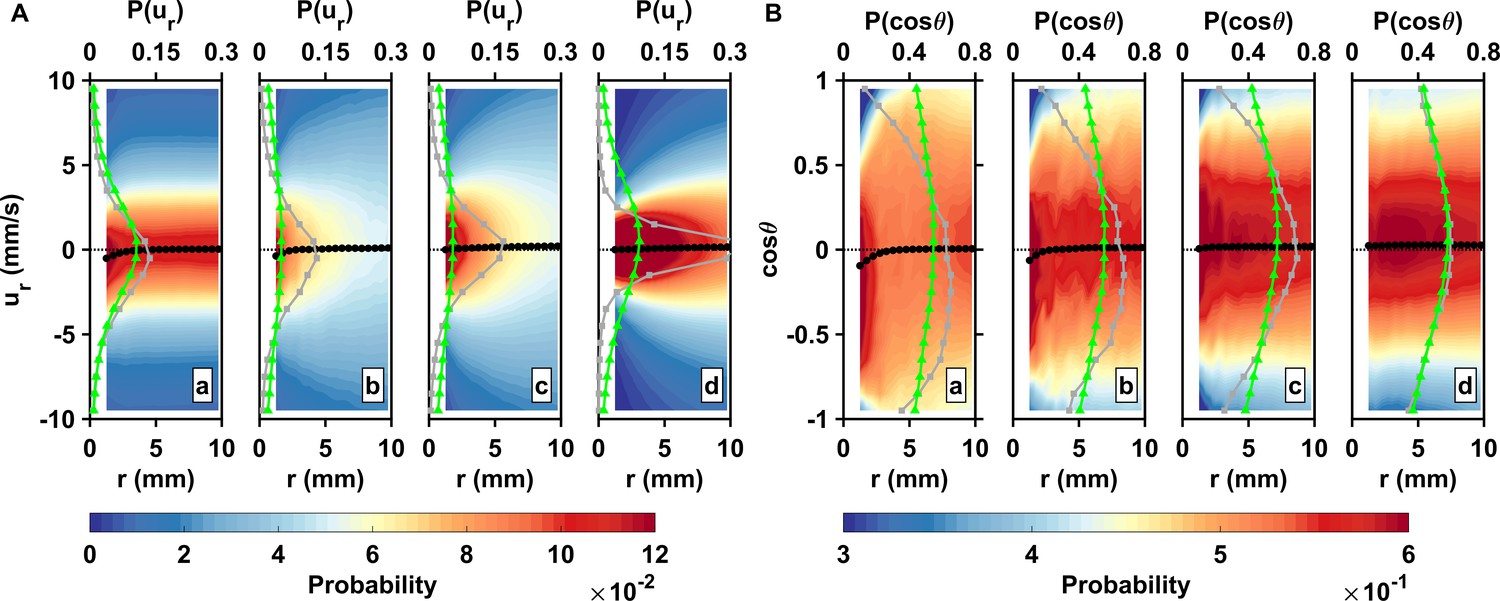
Inward motion within the perception distance converts high encounter rates brought by active motion into actual contact events.
(A) Probability density functions of the pairwise radial relative velocity ur versus the separation distance r for living copepods in calm water (a), living copepods in turbulence (b), inert carcasses in turbulence (c), and tracers in turbulence (d). The pairwise separation distance is along the horizontal axis, the velocity is along the vertical axis, and the probability is given by the color intensity. As an illustration for the shift in the distribution, the gray (squares) and green (triangles) curves show at mm and mm, respectively. The black curve (circles) indicates the mean value at each bin of r. ur is negative when two particles move toward each other. is negative at small r, indicating a net flux of organisms into the perception volume. (B) Probability density functions of the cosine of the approach angle versus the pairwise separation distance r, and mean values. is defined as the angle between the relative velocity vector and the particle separation vector. Negative values of indicate that the two particles of the pair move inward toward each other. Note that the color scale has been truncated for better visibility. The gray and green curves show at mm and mm, respectively.
-
Figure 3—source data 1
Source data for Figure 3.
- https://cdn.elifesciences.org/articles/62014/elife-62014-fig3-data1-v1.xlsx
Figure 4
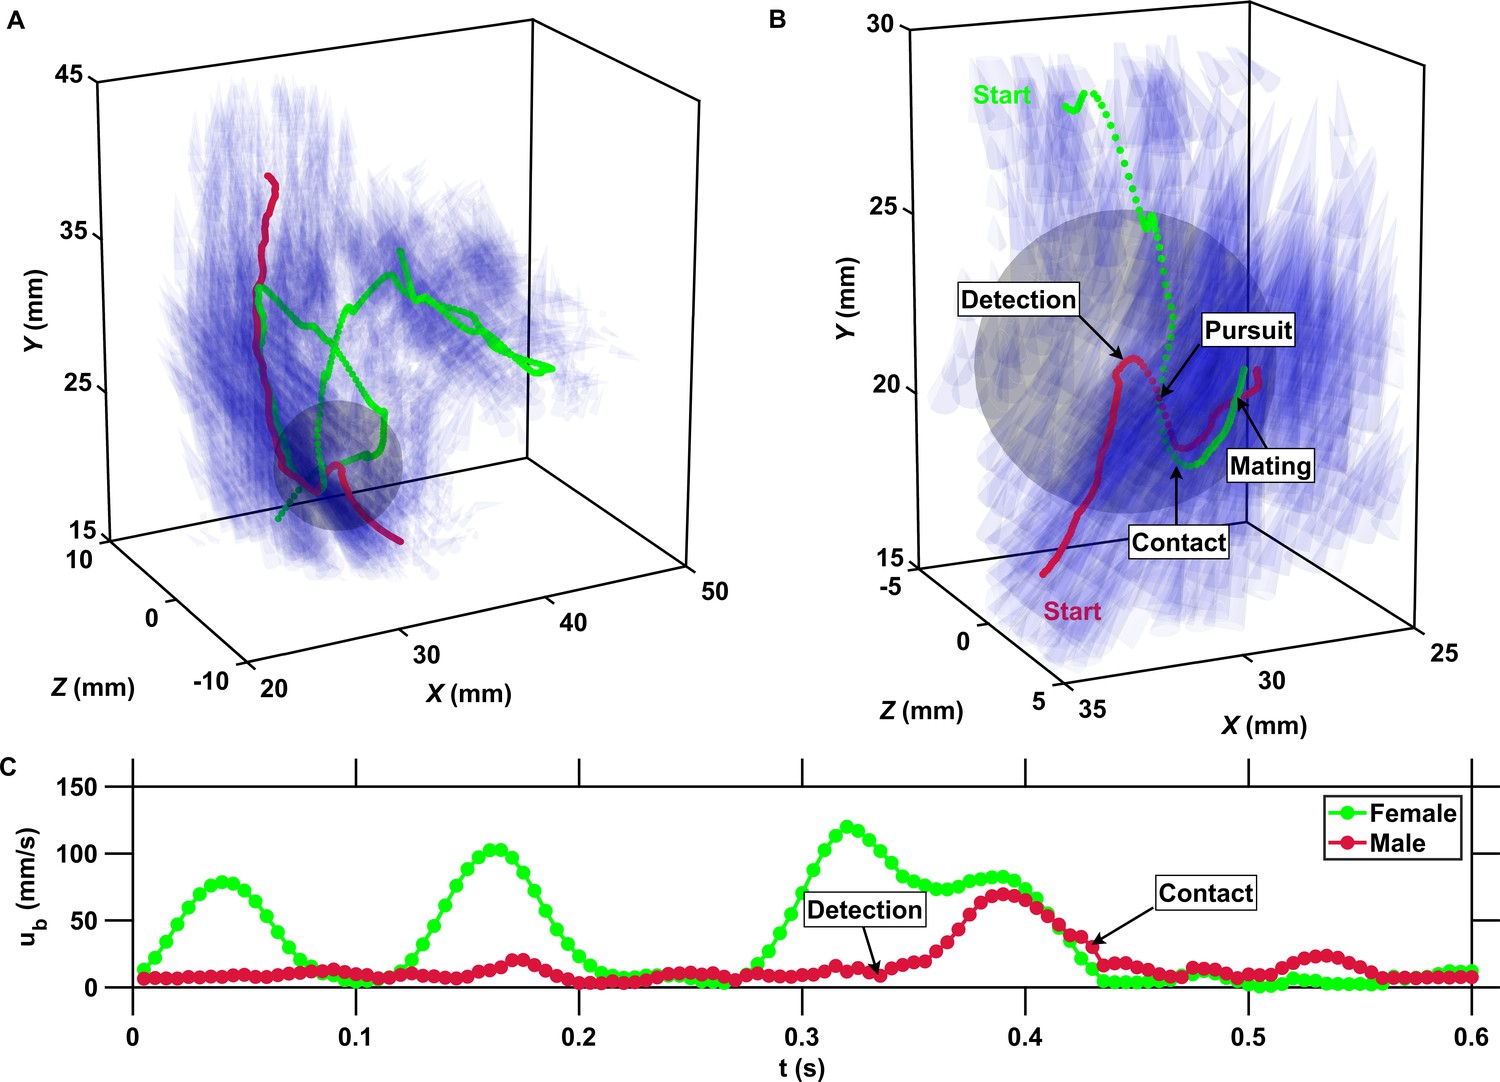
The inward motion of males within the perception radius leads to contact and mating.
(A) Trajectory of a male (red) and a female (green) mating in turbulence, and instantaneous flow field (blue cones) along their trajectories. The length of the cones is proportional to the flow velocity. The cones are semi-transparent to allow visualizing the copepod trajectories. The gray sphere shows the perception volume of the male at the time of detection. (B) Close-up look at the encounter event for the same two trajectories. The female swims actively against the flow streamlines (blue cones oriented against the direction of motion) while the male is passively advected. The male detects the female crossing its perception volume. Reorientation and inward motion of the male occur immediately and lead to contact. During the pursuit, the male swims toward the female and against the flow streamlines. The male successfully reaches the female, after which the two organisms tumble and are advected passively by the flow. (C) Time series of the magnitude of the velocity ub with respect to the flow for the same two trajectories. In this example, the male is passively transported by turbulence while the female swims vigorously via relocation jumps. Upon detection, the male performs one single jump to reach the female, while the female unsuccessfully attempts at escaping.
Figure 5

The lack of preferential concentration due to particle inertia reduces the geometric collision kernel to the clearance rate.
Correlation of the particle concentration versus the voxel separation distance r. The brackets denote both time and space (i.e., over ) averaging. The minimal separation distance between voxels corresponds to the size of a copepod. The correlation remains very close to one for uniformly distributed tracers (red). It is slightly higher than one at small separations for inert carcasses (black) because of the interactions between small-scale eddies and the density, finite size, and rather elongated shape of the copepods, but the increase in local concentration is negligible when compared to that observed with small and heavy or light particles in turbulence (Wang et al., 2000). As a consequence, inertial clustering does not contribute significantly to the encounter rate of copepods in turbulence at any r. Behavior results in clustering for living copepods in turbulence (green). This is in good agreement with the increase in at mm measured in this study, since this behavior increases the time spent by two copepods in close proximity. However, clustering due to behavior in turbulence is restricted to small r below the radius of hydrodynamic interactions, and therefore does not contribute to the geometric collision kernel for r above 4 mm. Clustering is more significant in copepods swimming in calm water (blue), presumably because of the contribution of chemical communication between adults (Appendix 1—figure 3).
-
Figure 5—source data 1
Source data for Figure 5.
- https://cdn.elifesciences.org/articles/62014/elife-62014-fig5-data1-v1.xlsx
Appendix 1—figure 1
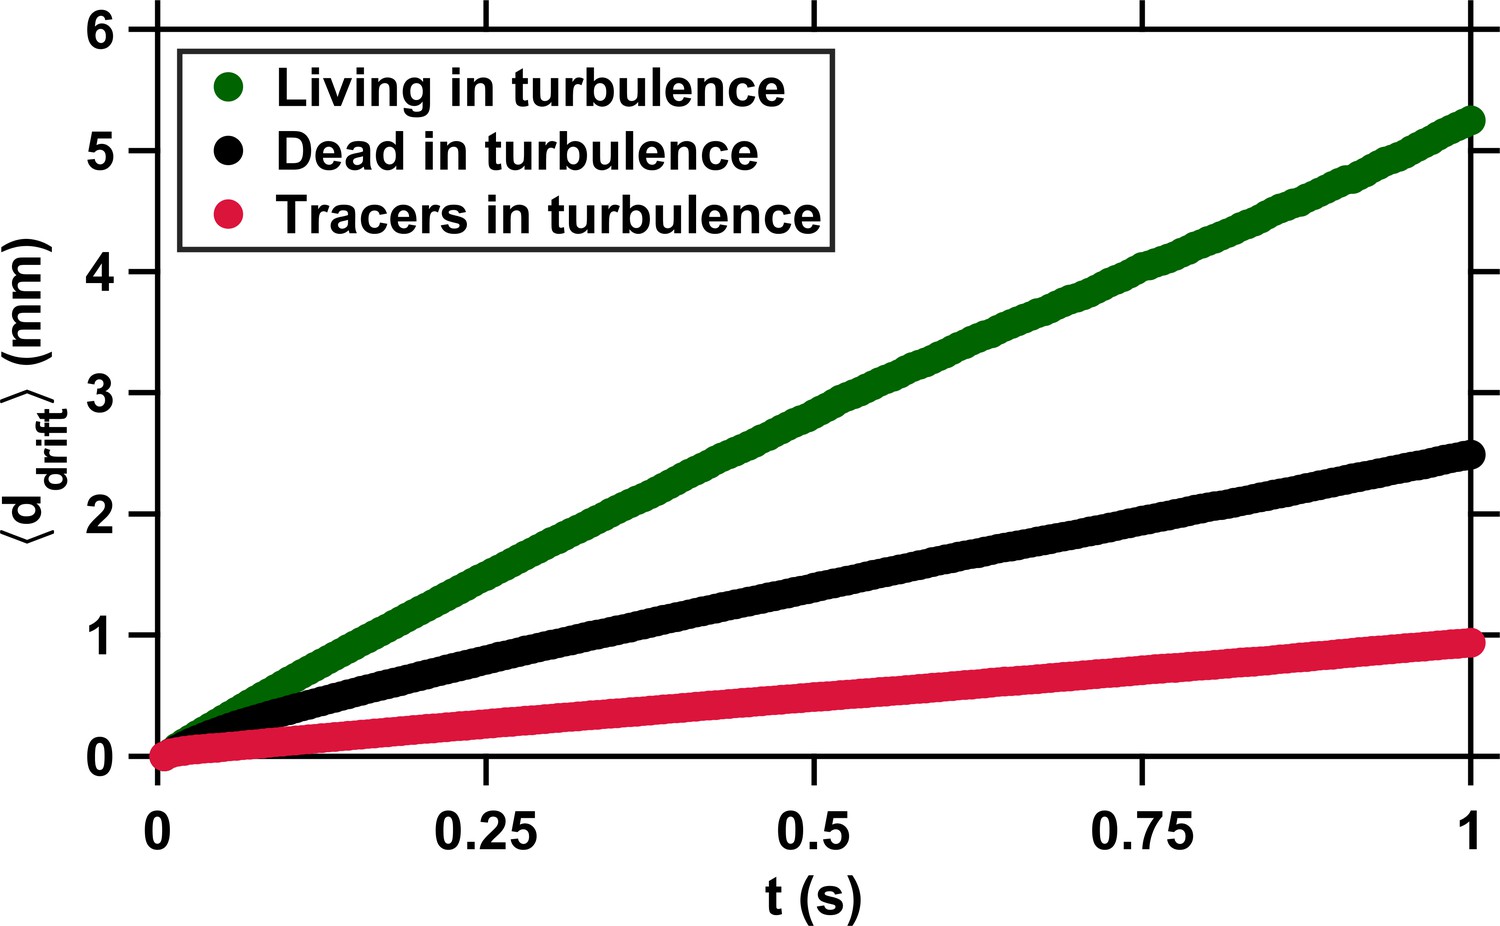
Copepods swimming in turbulence depart from the flow streamlines because of their slight inertia and active motion.
Average drift distance versus time to encounter t. The small drift of tracers (red) is due to the propagation in time of small uncertainties in the computation of the flow velocity at the particle location. These uncertainties have been estimated at approximately 8 % for the velocity gradient tensor, based on kinematic checks (Lüthi et al., 2005). The deviation of dead copepods (black) from the flow streamlines results from inertial effects caused by their finite size, elongated shape, and density slightly larger than that of the carrier fluid. The much larger deviation of living copepods (green) is caused by the cumulative effects of inertia and active motion via frequent relocation jumps (Michalec et al., 2017). has been computed from several hundreds of encounter events for each case (living copepods, inert carcasses, and tracers).
Appendix 1—figure 2
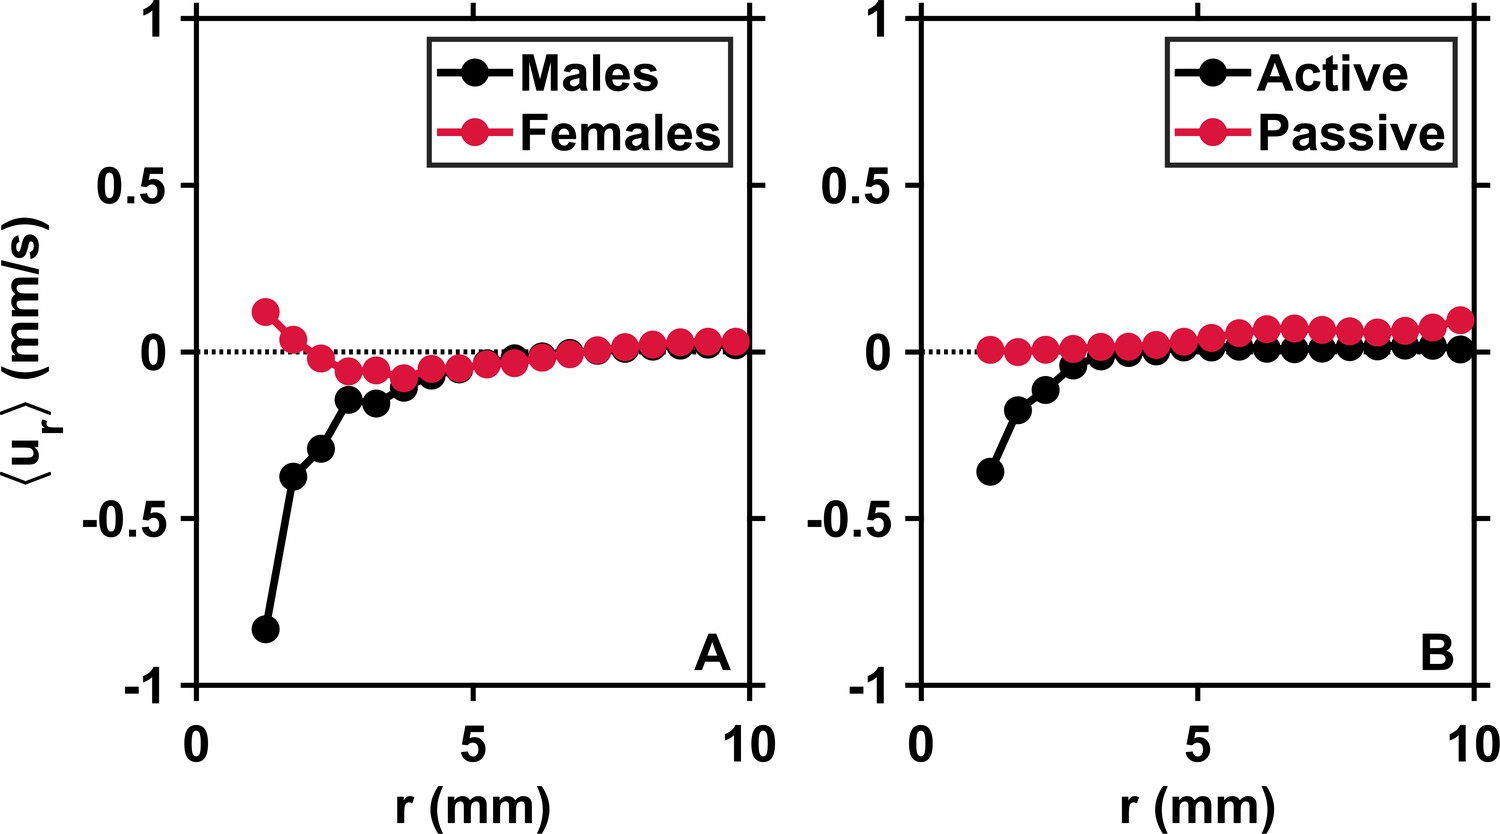
Males initiate inward motion at short separations.
(A) Mean pairwise radial relative velocity versus the pairwise separation distance r for males (black) and females (red) swimming separately in calm water. Negative values of at short r for males indicate attraction. Positive values of for females indicate repulsion. These results originate from complementary measurements conducted with single genders of adult copepods. (B) Mean radial relative velocity versus the pairwise separation distance r for males and females swimming together in turbulence in approximately equal proportions. is computed using the velocity of the organisms with respect to the flow. It quantifies the behavioral component of the motion. is computed using the instantaneous flow velocity at the location of the copepods. It quantifies the component of the motion that results from turbulent advection. The net inward flux is smaller in the mixed-gender measurements because of the contribution of females, but still clearly visible because at short r.
Appendix 1—figure 3

Pheromone trails facilitate mating encounters in calm water.
Two examples of mating interactions mediated by pheromones in the calanoid copepod Eurytemora affinis. This species is well known for using pheromones for mate location (Katona, 1973). A male (red) detects the pheromone trail released by a female (blue) and swims up the pheromone gradient with great accuracy until contact. The distance between the male and the female during the pursuit is larger than the radius of perception for hydrodynamic interactions (Bagøien and Kiørboe, 2005).
Appendix 1—figure 4
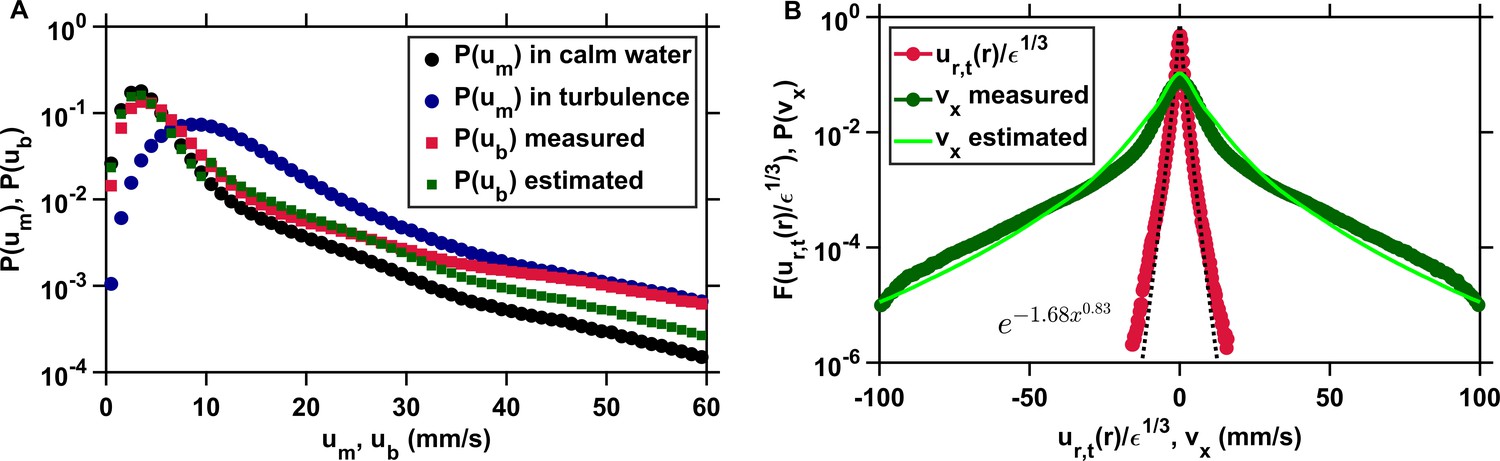
The clearance rate of copepods in turbulence, and therefore their encounter rate, can be estimated down to the radius of hydrodynamic interactions from the probability distributions of the pairwise radial relative velocity of turbulence and of the organism velocity.
(A) Probability density functions of the velocity of copepods swimming in calm water (black, circles) and in turbulence (blue, circles), and probability density functions of the velocity of copepods with respect to the turbulent flow from the experimental data (red, squares) and estimated from and in calm water (green, squares), using mm s−1 as the threshold, determined empirically from , that separates cruising velocities from jump velocities. in turbulence is approximated from in calm water, which is much simpler to obtain experimentally. (B) From it is possible to derive , the probability density function of one component of the velocity differences of two copepods, using their velocity with respect to the flow, which is not trivial to obtain empirically. The agreement between from the data (circles, dark green) and estimated from (solid line, light green) is good. The mean inward radial velocity of copepods in turbulence, and therefore , is then obtained by adding the contribution of flow motion, given by the probability density function (circles, red) where is the dissipation rate of the turbulent kinetic energy and is the pairwise radial relative velocity of tracers at separation mm corresponding to the radius of hydrodynamic interactions (Bagøien and Kiørboe, 2005). Stretched exponentials (dashed line, black) provide good approximation to .
Tables
Table 1
Relevant turbulence parameters in the investigation volume.
is the space- and time-averaged turbulent energy dissipation rate. and are the Kolmogorov time and length scales, respectively. is the root-mean-square of the velocity fluctuations. is the Taylor-scale Reynolds number, and L is the integral length scale.
| (m2 s−3) | (s) | (mm) | (mm s−1) | L (mm) | |
|---|---|---|---|---|---|
| 3 × 10⁻⁵ | 0.2 | 0.45 | 5.6 | 22 | 6 |
Additional files
Download links
A two-part list of links to download the article, or parts of the article, in various formats.
Downloads (link to download the article as PDF)
Open citations (links to open the citations from this article in various online reference manager services)
Cite this article (links to download the citations from this article in formats compatible with various reference manager tools)
Efficient mate finding in planktonic copepods swimming in turbulence
eLife 9:e62014.
https://doi.org/10.7554/eLife.62014


