Structural basis for SARM1 inhibition and activation under energetic stress
- The Mina & Everard Goodman Faculty of Life Sciences, Bar-Ilan University, Israel
- Department of Biomolecular Sciences, Weizmann Institute of Science, Israel
- Azrieli Faculty of Medicine, Bar Ilan University, Israel
- Department of Applied Mathematics, School of Mathematical Sciences, Tel-Aviv University, Israel
- Royal Technical Institute (KTH), Dept. For Biomedical Engineering and Health Systems, Sweden
- Biosciences, University of Exeter, United Kingdom
- National Institute for Biotechnology in the Negev, Ben-Gurion University of the Negev, Israel
- European Molecular Biology Laboratory, France
Figures
Figure 1 with 1 supplement
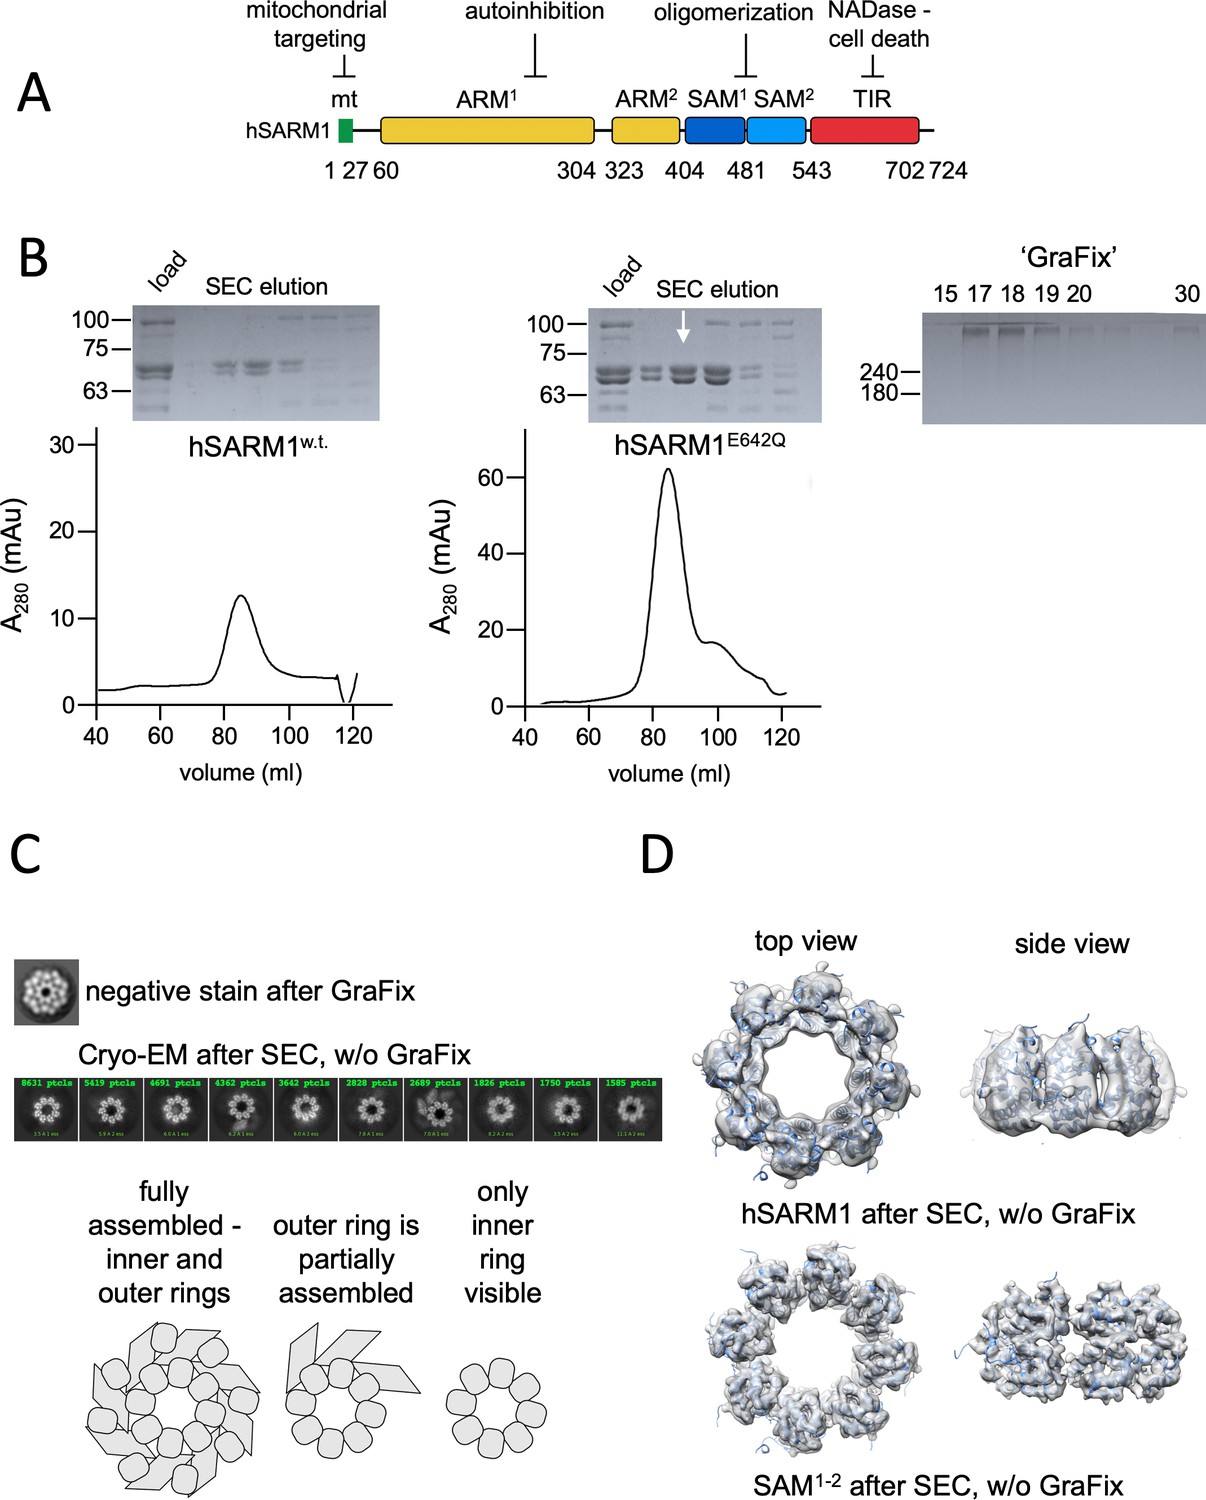
Domain organization and cryo-EM analysis of purified hSARM1.
(A) Color-coded organization and nomenclature of the SARM1 ARM, SAM, and TIR domains. The position of mitochondrial localization signal is presented at the N terminus of the protein. Two constructs are used in this study, both missing the mitochondrial N-terminal sequence. hSARM1E642Q is a NADase attenuated mutant that was used in all the structural and some of the biochemical experiments, while hSARM1w.t. was used in the NADase and cellular experiments. (B) hSARM1 protein preparations. Presented are SDS-PAGE analyses of size-exclusion chromatography fractions after the initial metal-chelate chromatography step. Note the higher yield of hSARM1E642Q compared to hSARM1w.t., and the doublet SARM1 bands, the result of a partial N-terminal his-tag digestion. The white arrow indicates the fraction used for the subsequent GraFix step shown at the right panel, where the approximate glycerol concentrations of each fraction are indicated. (C) Most-prevalent 2D class averages of hSARM1E642Q protein preparations. A dramatic difference can be seen between the previously conducted negative stain analysis (top panel, as in Sporny et al., 2019) and typical cryo-EM (middle panel). While the negative stain average clearly shows inner and peripheral rings (see illustration in the bottom panel), most cryo-EM classes depict only the inner ring, and some a partial outer ring assembly. Note that a gradient fixation (GraFix) protocol was applied before the negative stain but not the cryo-EM measurements. (D) 3D cryo-EM reconstructions of hSARM1E642Q (top panel) and SAM1–2 (bottom panel) and docking of the SAM1–2 crystal structure (PDB code 6QWV) into the density maps, further demonstrating that only the inner SAM1–2 ring is well ordered in cryo-EM of purified hSARM1E642Q.
Figure 1—figure supplement 1
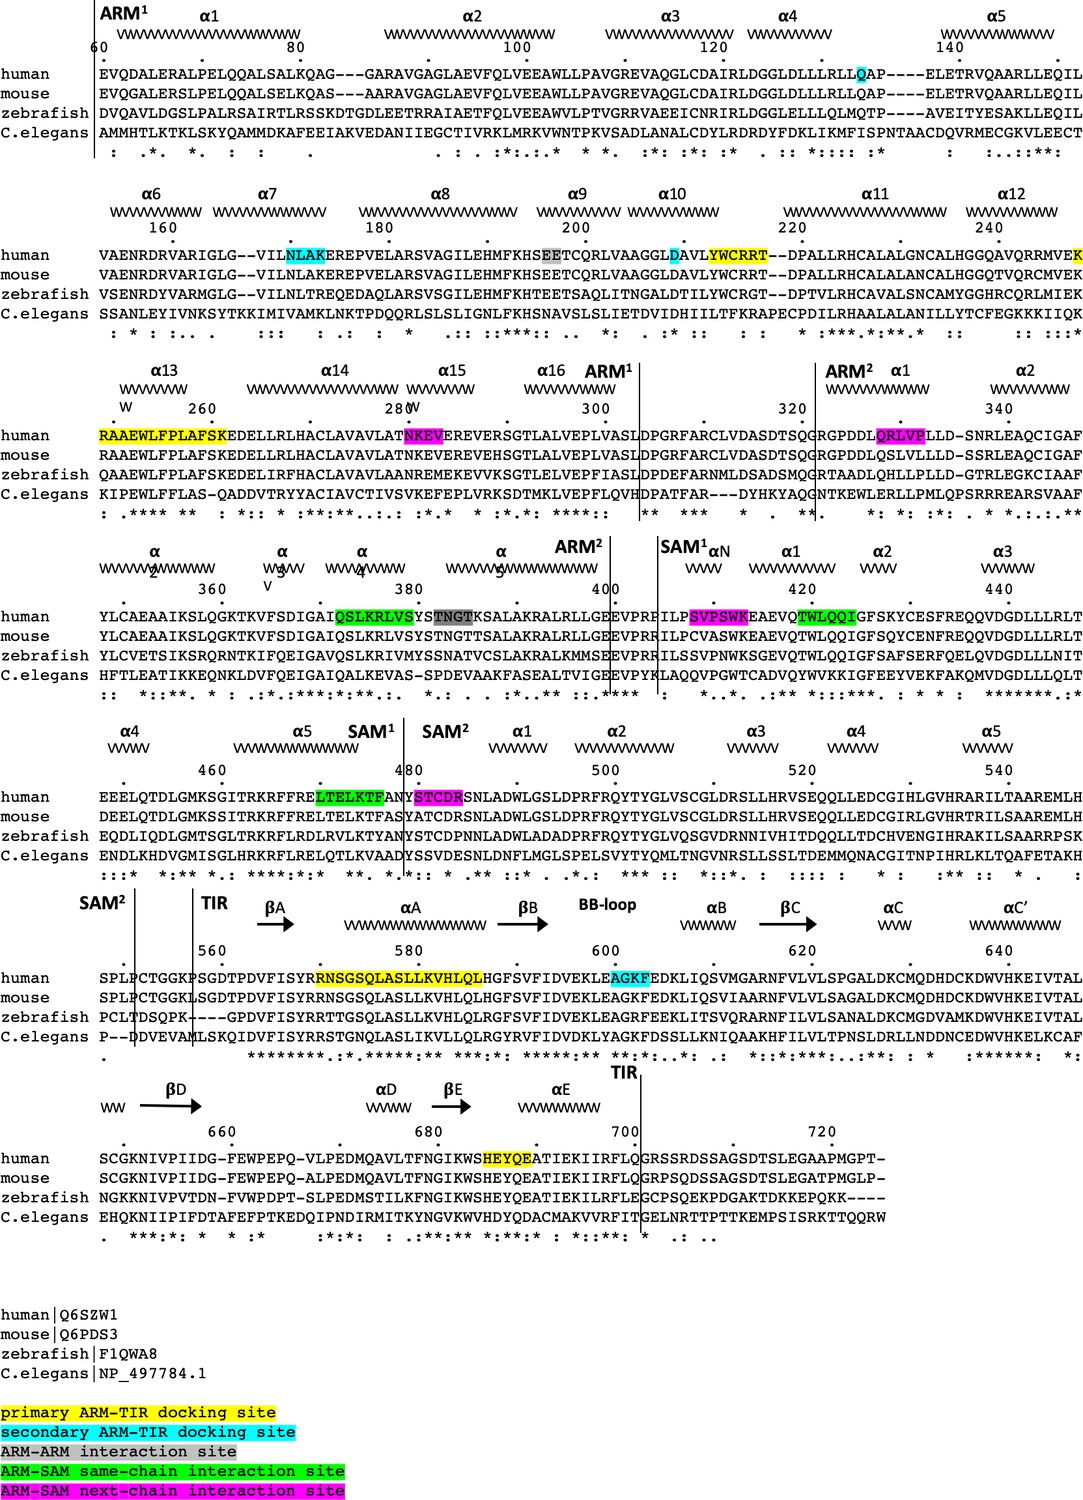
Structure-based sequence alignment of the SARM1 of human, mouse, zebrafish, and the Caenorhabditis elegans homolog TIR-1.
Color-coded highlights and Uniprot protein accession numbers are listed in the figure.
Figure 2 with 2 supplements
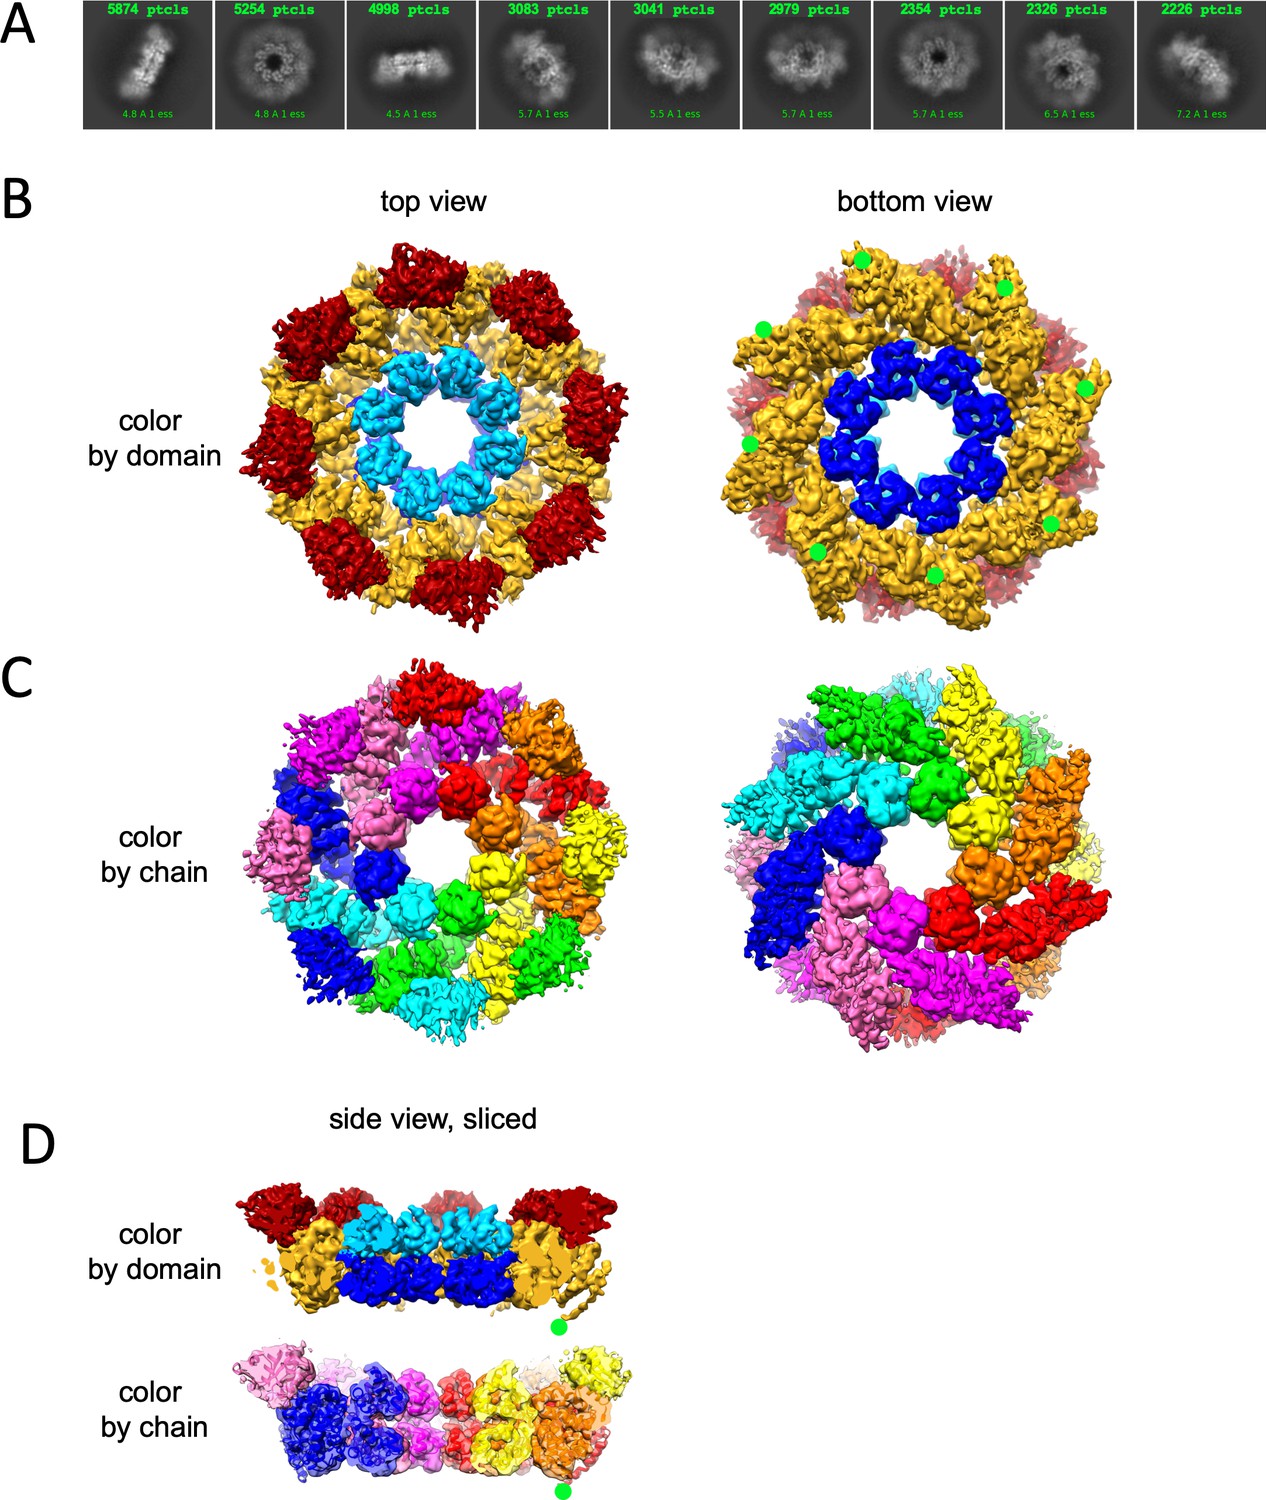
Cryo-EM structure of GraFix-ed hSARM1E642Q.
(A) Selected representation of 2D class averages used for the 3D reconstruction. The number of particles that were included in each average is indicated at the top of each class. (B–D) Cryo-EM density map color coded as in Figure 1A and by chain. ‘Top view’ refers to the aspect of the molecule showing the TIR (red) and SAM2 (cyan) domains closest to the viewer, while in the ‘bottom view’ the SAM1 (blue) domains and the illustrated mitochondrial N-terminal localization tag (green dot – was not included in the expression construct) are the closest. (D) Side view representation of the structure, sliced at the frontal plane of the aspect presented in (B) and (C). Note that while the GraFix-ed map has an overall lower resolution, it has a heterogenous distribution with distinctive differences between the SAM, ARM, and TIR regions. On the contrary, in the NAD+ supplemented map, resolution values are much more homogenous.
Figure 2—figure supplement 1
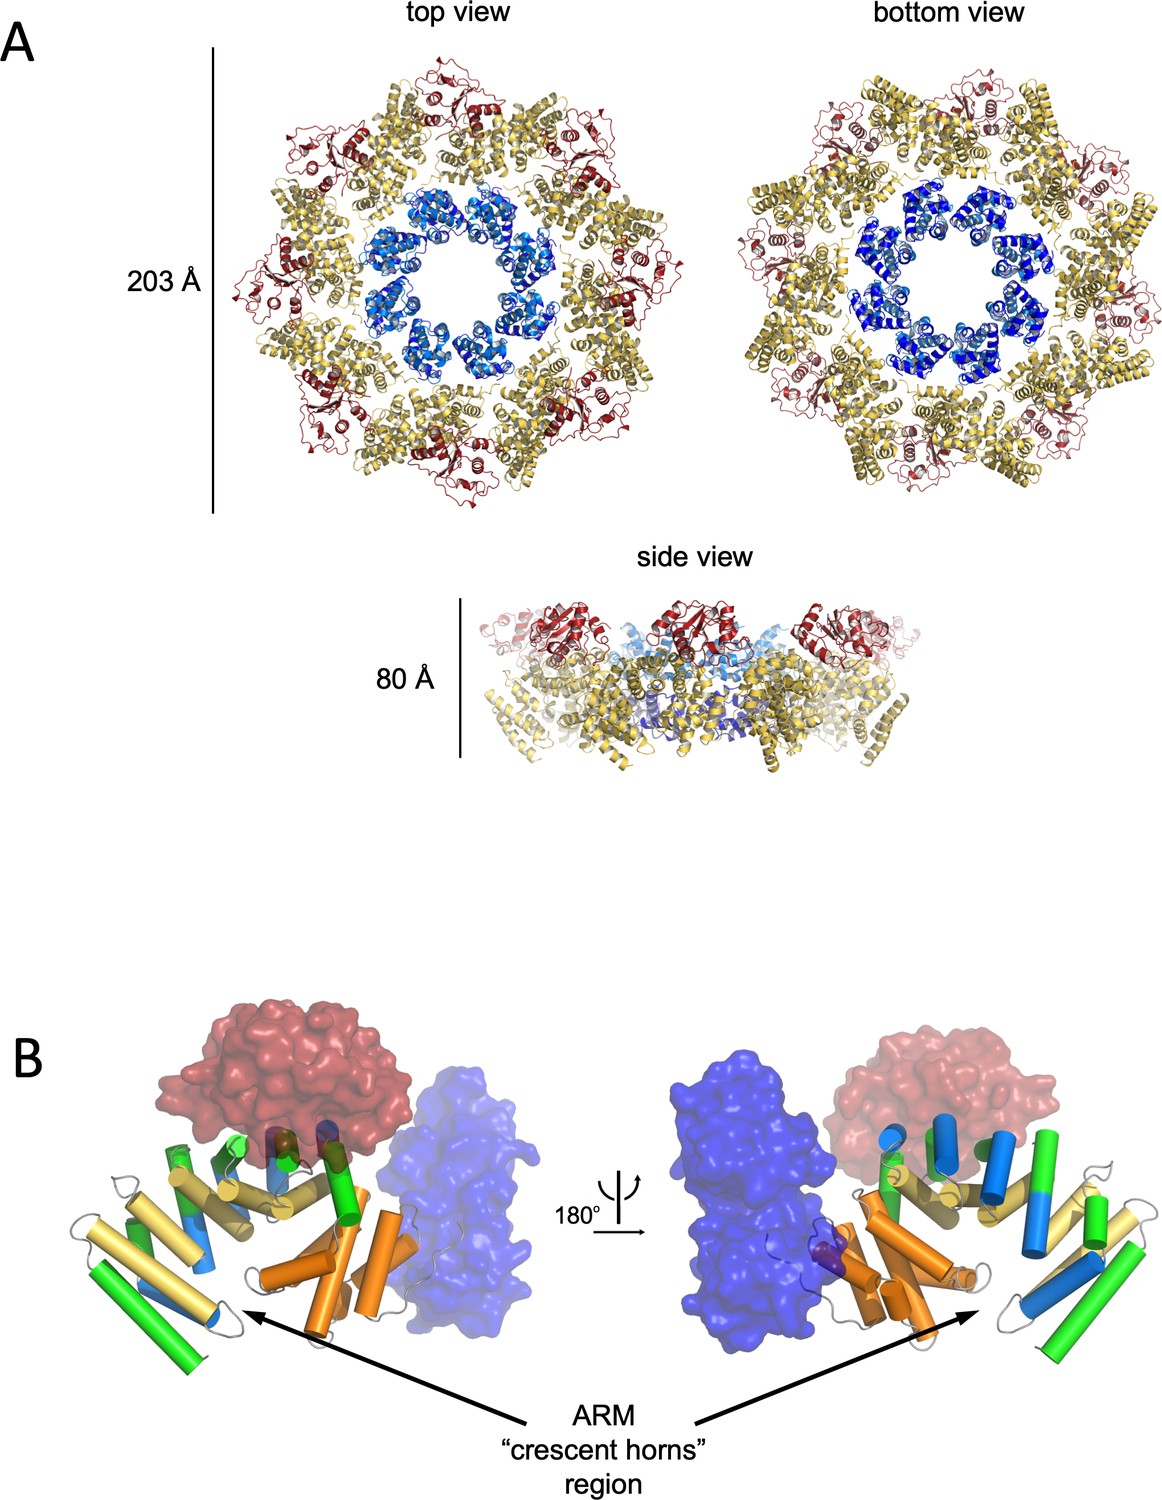
Structure and domain organisation of hSARM1.
(A) Cartoon model of hSARM1. Color code is as in Figure 1A. (B) Architecture of the crescent-shaped ARM domain. The structure reveals that there are two ARM subdomains, one spanning res. 60–303 with five 3-helix (depicted as green, yellow, and blue cylinders) ARM repeats, and the second (res. 322–400) with two repeats, all colored in orange. The SAM and TIR domains are represented as transparent blue and red surface, respectively.
Figure 2—figure supplement 2
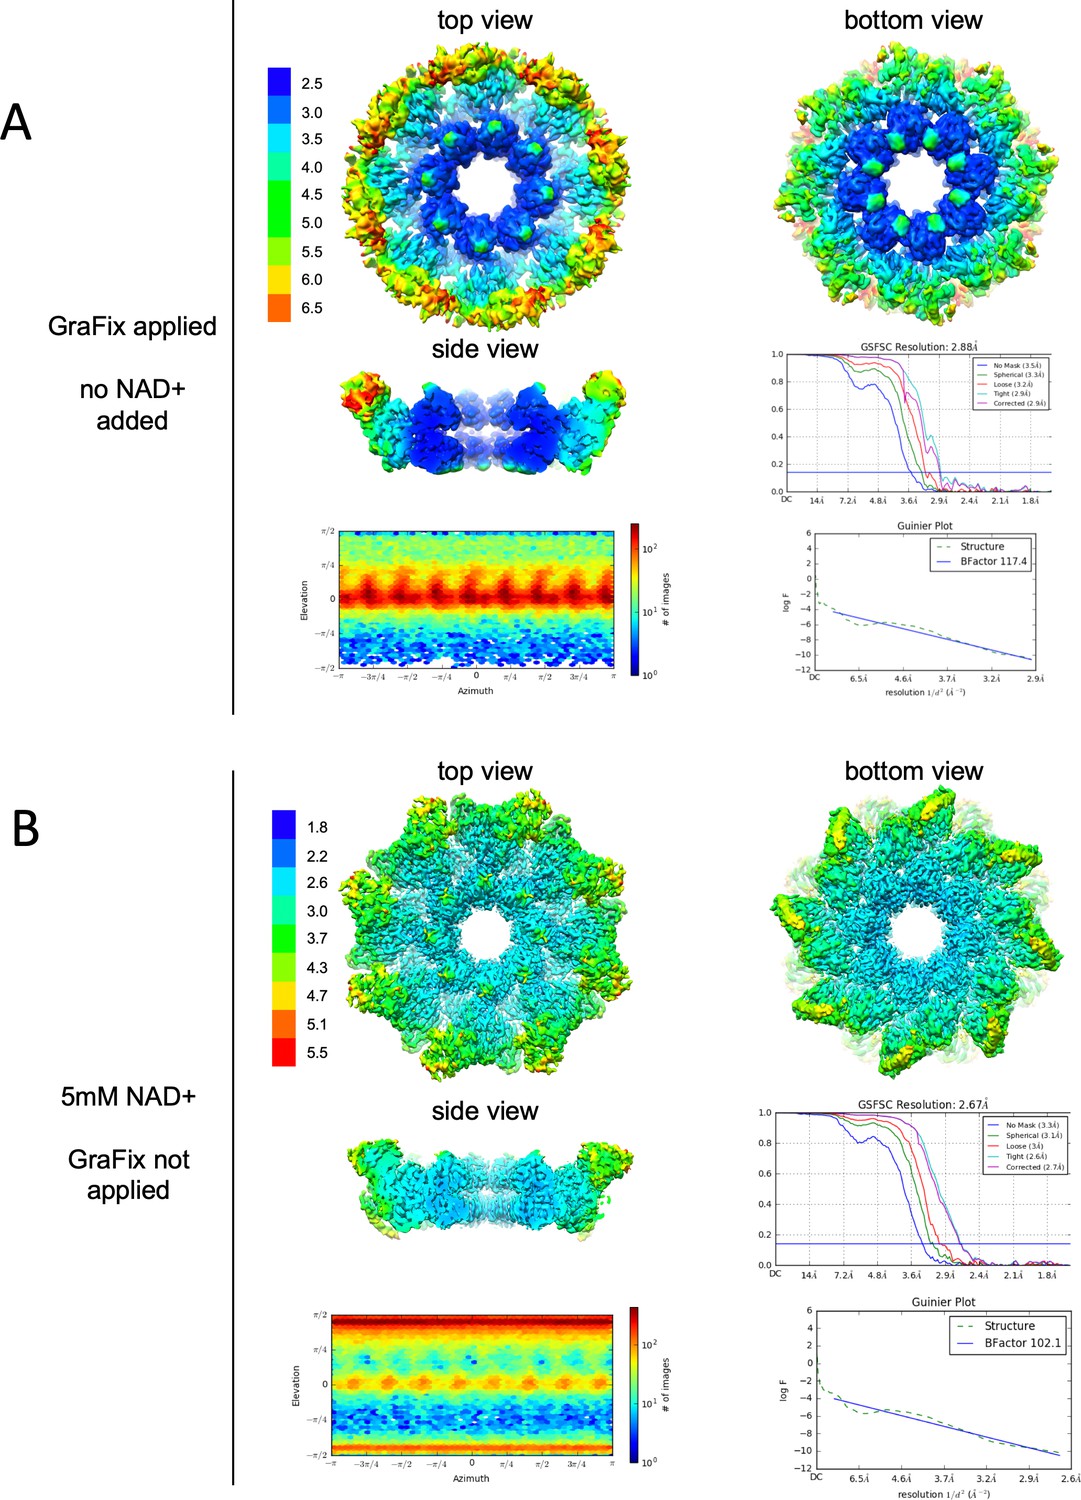
Resolution, angular distribution, and B-factor estimations of the Cryo-EM maps of GraFix-ed (upper panel) and NAD+ supplemented (bottom panel) hSARM1.
Note that while the GraFix-ed map has an overall lower resolution, it has a heterogenous distribution with distinctive differences between the SAM, ARM, and TIR regions. On the contrary, in the NAD+ supplemented map, resolution values are much more homogenous.
Figure 3
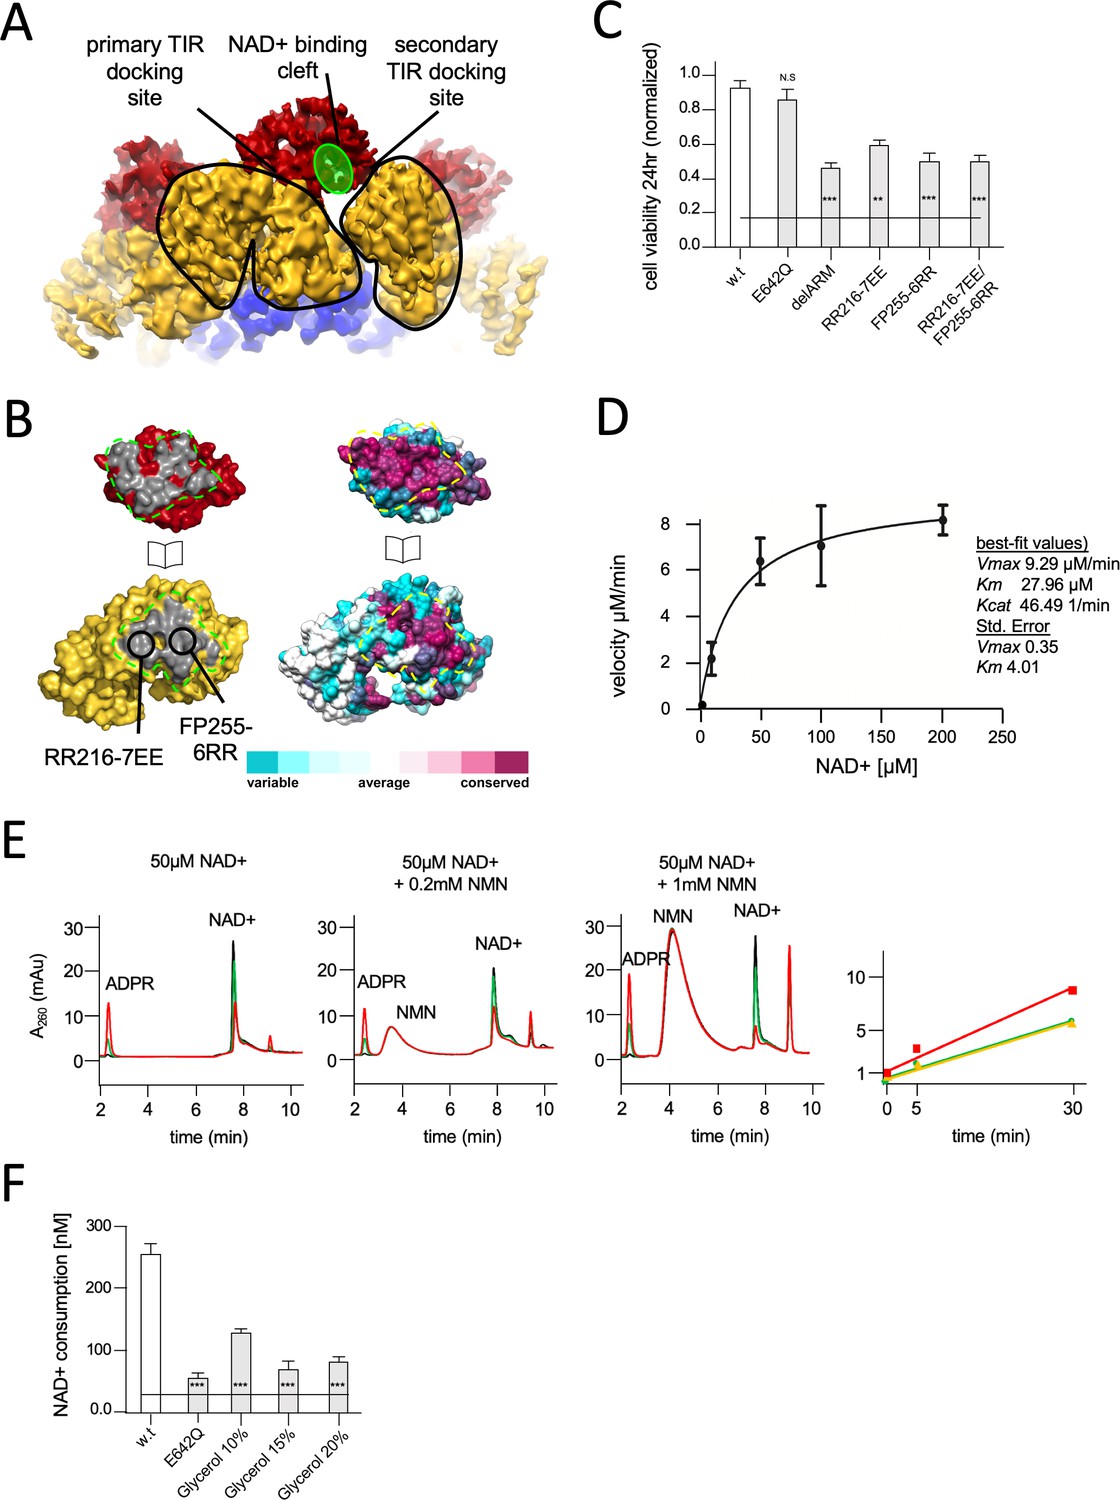
Structural basis for hSARM1 auto-inhibition.
(A) Close-up of a tilted side view of the GraFix-ed hSARM1E642Q map (colored as in Figure 2A). Two neighboring ARM domains (yellow) are outlined by a black line and the NAD+ binding cleft of a TIR domain that is bound to the two ARMs is highlighted in green. The interfaces formed between the TIR and ARMs are designated as the ‘primary TIR docking site’ and the ‘secondary TIR docking site’. (B) Two ‘open-book’ representations (in the same orientation) of the ‘primary TIR docking site’. Left – the TIR and ARM domains are colored as in (A), and the interface surfaces in gray are encircled by green dashed line. Site-directed mutagenesis sites are indicated. Right -– amino acid conservation at the ‘primary TIR docking site’. Cyan through maroon are used to indicate amino acids, from variable to conserved, demonstrating an overall high level of conservation in this interface. (C) Toxicity of the hSARM1 construct and mutants in HEK293T cells. The cells were transfected with hSARM1 expression vectors, as indicated. Cell viability was measured and quantified 24 hr post-transfection using the fluorescent resazurin assay. While cell viability is virtually unaffected after 24 hr by ectopic expression of hSARM1w.t. and hSARM1E642Q, deletion of the inhibiting ARM domain (which results in the SAM1–2–TIR construct) induces massive cell death. Mutations at the ‘primary TIR docking site’ of the ARM domain also induce cell death, similar to the ‘delARM’ construct (three biological repeats, Student’s t-test; ***p<0.001; *p<0.05; n.s: no significance). (D) Kinetic measurement of purified hSARM1 NADase activity. Km and Vmax were determined by fitting the data to the Michaelis–Menten equation and are presented as mean ± SEM for three independent measurements. (E) HPLC analysis of time-dependent NAD+ consumption (50 µM) by hSARM1, and further activation by nicotinamide mononucleotide (NMN) (0.2 and 1 mM). Time points 0 (black), 5 (green), and 30 (red) min. Right graph shows the rate of adenosine diphosphate ribose (ADPR) product generation: no NMN (green), 0.2 mM NMN (orange), and 1 mM NMN (red). While 0.2 mM NMN has no visible effect, 1 mM NMN increases hSARM1 activity by ~30%. (F) Glycerol inhibition of hSARM1 NADase in vitro activity was measured 20 min after adding 0.5 µM NAD+ to the reaction mixture. In the same way, hSARM1E642Q activity was measured and compared to that of hSARM1w.t., showing attenuated NADase activity of the former.
Figure 4
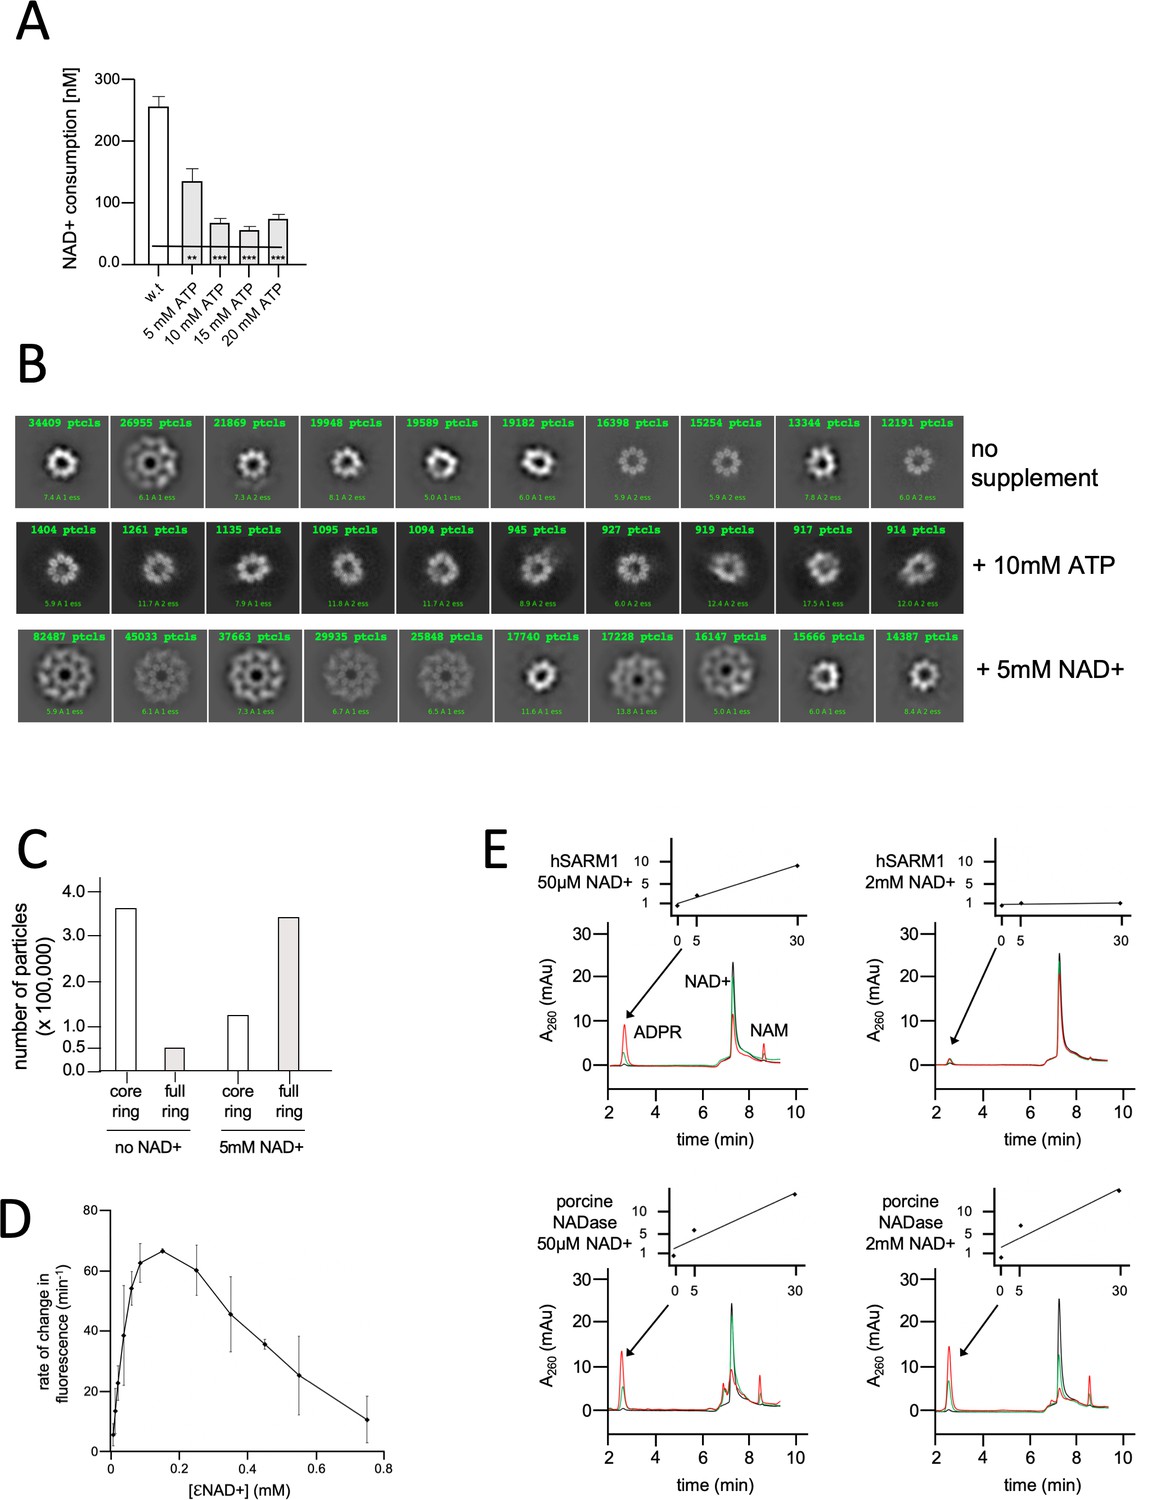
NAD+ induces structural and enzymatic inhibition of hSARM1.
(A) Inhibition of hSARM1 NADase activity by ATP was demonstrated and analyzed as in Figure 3F. (B) The structural effects of NAD+ and ATP were observed by cryo-EM based on appearance in 2D classification. Presented are the 10 most populated classes (those with the largest number of particles – numbers in green, first class is on the left) out of 50–100 from each data collection after the first round of particle picking and classification. By this analysis, the percentage of particles that present full, two-ring structure is 13% (no NAD+); 74% (5mM NAD+); and 4% (10mM ATP). (C) Total number of particles with full ring assembly vs. those where only the inner ring is visible. Conditions of sample preparation, freezing, collection, and processing were identical, except for the NAD+ supplement in one of the samples. (D) Rate of change in nucleotide fluorescence under steady-state conditions of eNAD hydrolysis by hSARM1. Reactions were initiated by mixing 400 nM enzyme with different concentrations of 1:10 eNAD+:NAD+ (mol/mol) mixtures. Three repeats, standard deviation error bars. (E) HPLC analysis of time-dependent NAD+ consumption by hSARM1 and porcine brain NADase control in 50 µM and 2 mM. Time points 0 (black), 5 (green), and 30 (red) min. Inset graph shows the rate of ADPR product generation. While the rate of NAD+ hydrolysis by porcine NADase is maintained through 50 µM and 2 mM NAD+, hSARM1 is tightly inhibited by 2 mM NAD+.
Figure 5 with 2 supplements
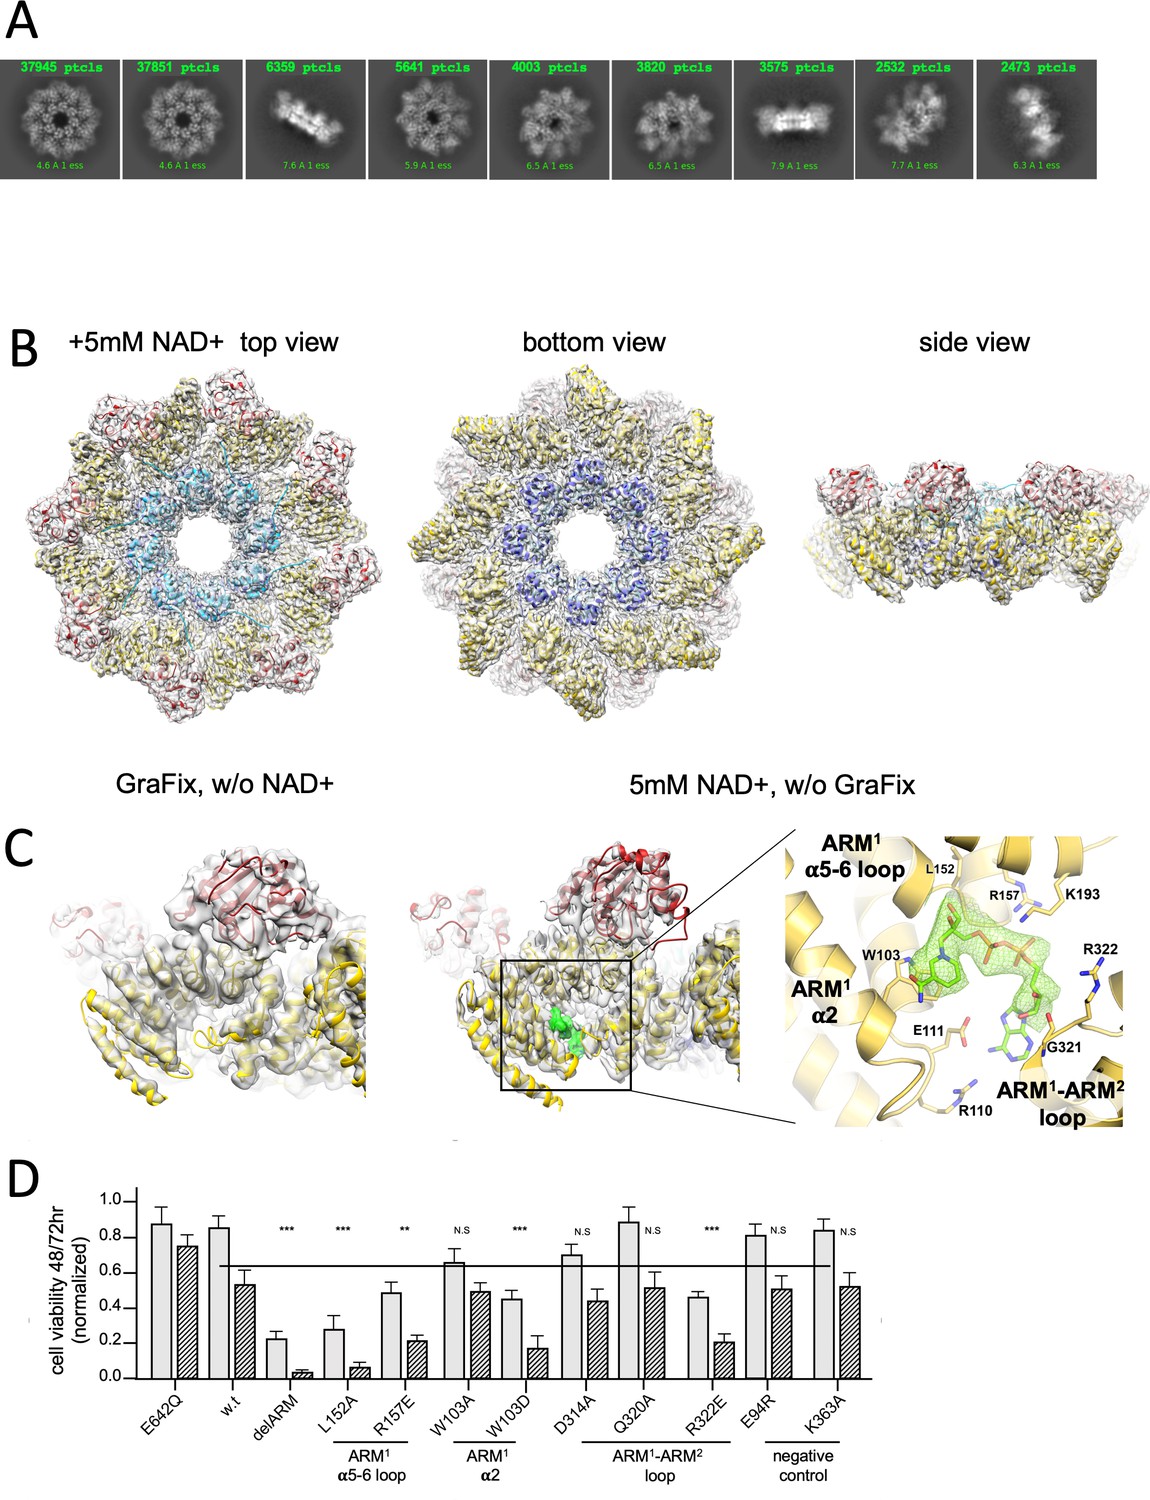
3D structure reveals an inhibitory ARM allosteric NAD+ binding site.
(A) Selected representation of 2D class averages used for the 3D reconstruction of hSARM1E642Q supplemented with 5 mM of NAD+. The number of particles that were included in each class average is indicated. (B) Color coded (as in Figure 1A) protein model docked in a transparent 2.7 Å cryo-EM density map (gray). (C) When compared to the GraFix-ed map, without NAD+ supplement (left), an extra density appears at the ‘ARM horns’ region in the NAD+ supplemented map (middle, right). The extra density is rendered in green and an NAD+ molecule is fitted to it. The NAD+ is surrounded by three structural elements, as indicated on the right panel. The NAD+ directly interacts with the surrounding residues: the nicotinamide moiety is stacked onto the W103 side chain rings; the following ribose with L152 and H190; R110 forms salt bridge with phosphate alpha (proximal to the nicotinamide), while the beta phosphate (distal to the nicotinamide) forms salt bridges with R110 and R157. The map density at the distal ribose and adenosine moieties is less sharp, but clearly involves interactions with the ARM2 R322, G323, and D326. In this way, activation by nicotinamide mononucleotide, that lacks the distal phosphate, ribose, and adenosine, can be explained by binding to ARM1 while preventing the bridging interactions with ARM2. (D) Toxicity of the hSARM1 construct and mutants in HEK293F cells. The cells were transfected with hSARM1 expression vectors, as indicated. Viable cells were counted 48 (bars in gray) and 72 (bars in black stripes) hr post-transfection. Moderate reduction in cell viability due to ectopic expression of hSARM1w.t. becomes apparent 72 hr after transfection, when compared with the NADase attenuated hSARM1E642Q, while the ‘delARM’ construct marks a constitutive activity that brings about almost complete cell death after 3 days. Mutations at the ARM1 α5–α6 and ARM1–ARM2 loops induce cell death at a similar level as the ‘delARM’ construct, while the control mutations and W103A did not show increased activity (three biological repeats, Student’s t-test; ***p<0.001; *p<0.05; n.s: no significance).
Figure 5—figure supplement 1
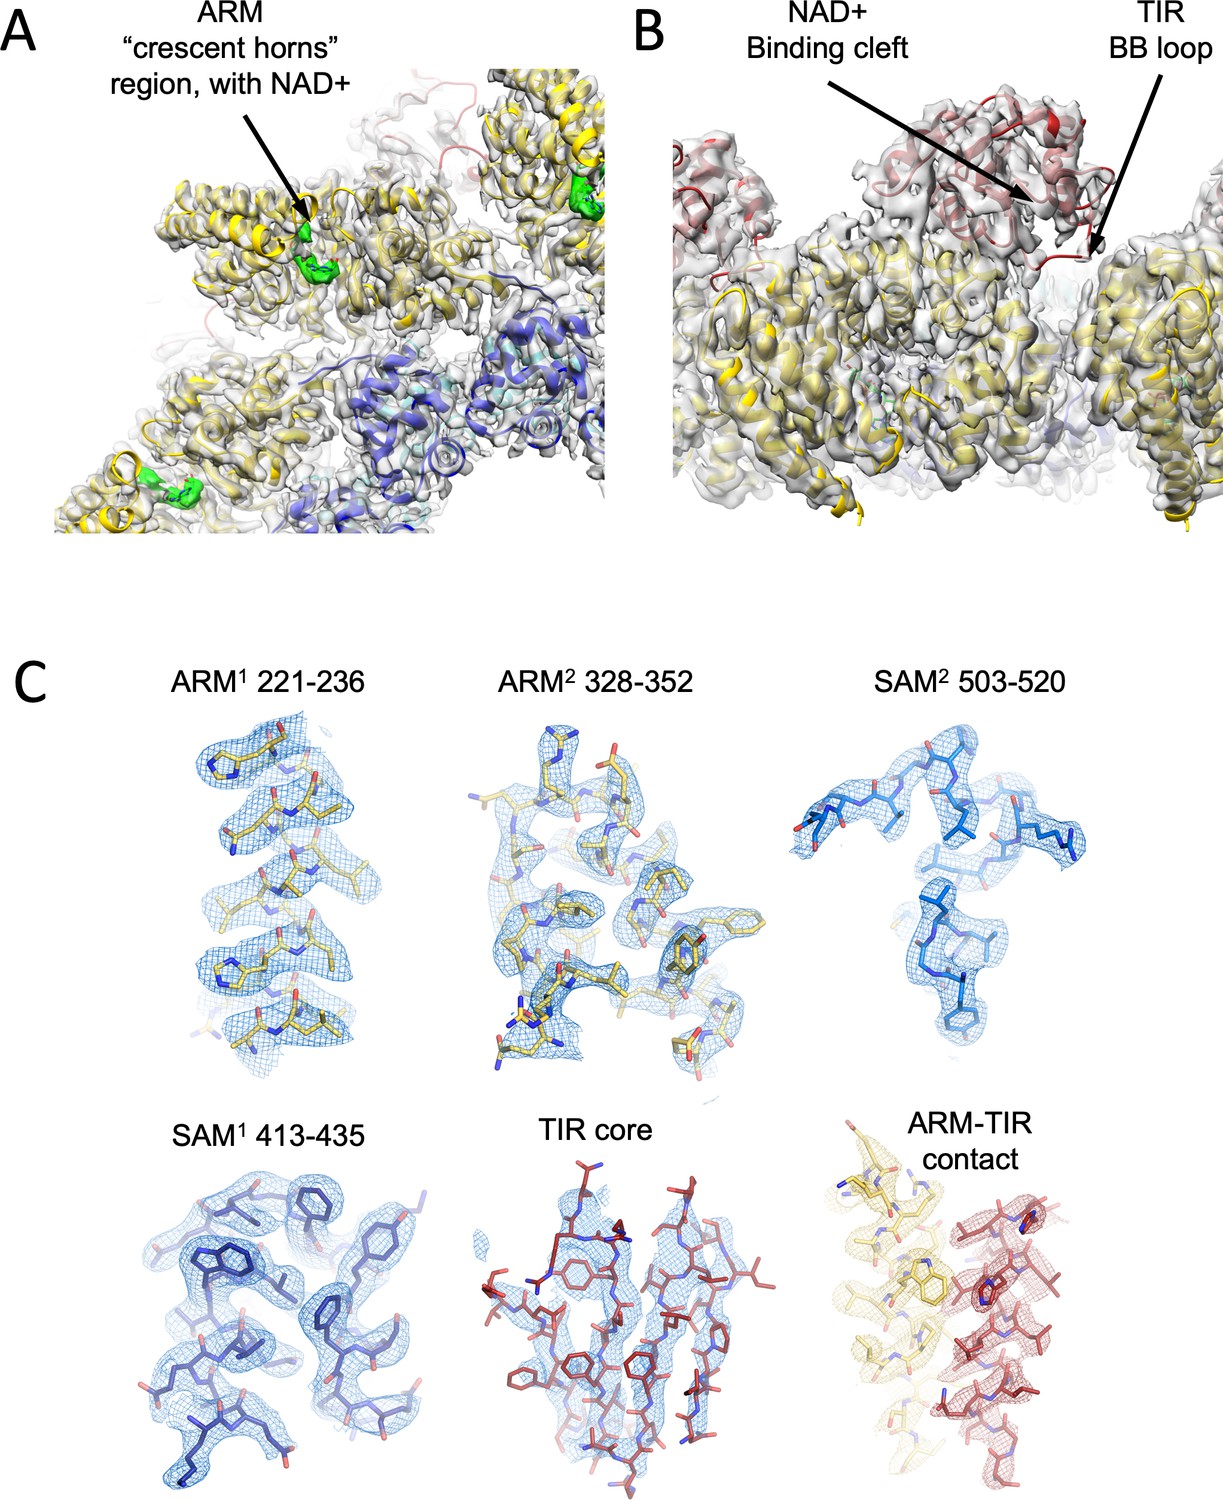
Cartoon model and density map (in transparent gray) of the NAD+ supplemented hSARM1.
Color code is as in Figure 1A. (A) A zoom-in bottom view with indication of the ‘ARM horns’ region. NAD+ densities are in green. Note the ARM domain interactions with neighboring SAM and ARM domains. (B) A zoom-in view of the TIR domain docking onto two neighboring ARM domains. The NAD+ binding cleft and BB loop are indicated. (C) Density map (in mesh) showing a close-up view of isolated segments of the ARM, SAM, and TIR sections. The backbone and side chains are represented as sticks and colored in yellow, blue, and red, respectively, as in Figure 1A.
Figure 5—figure supplement 2
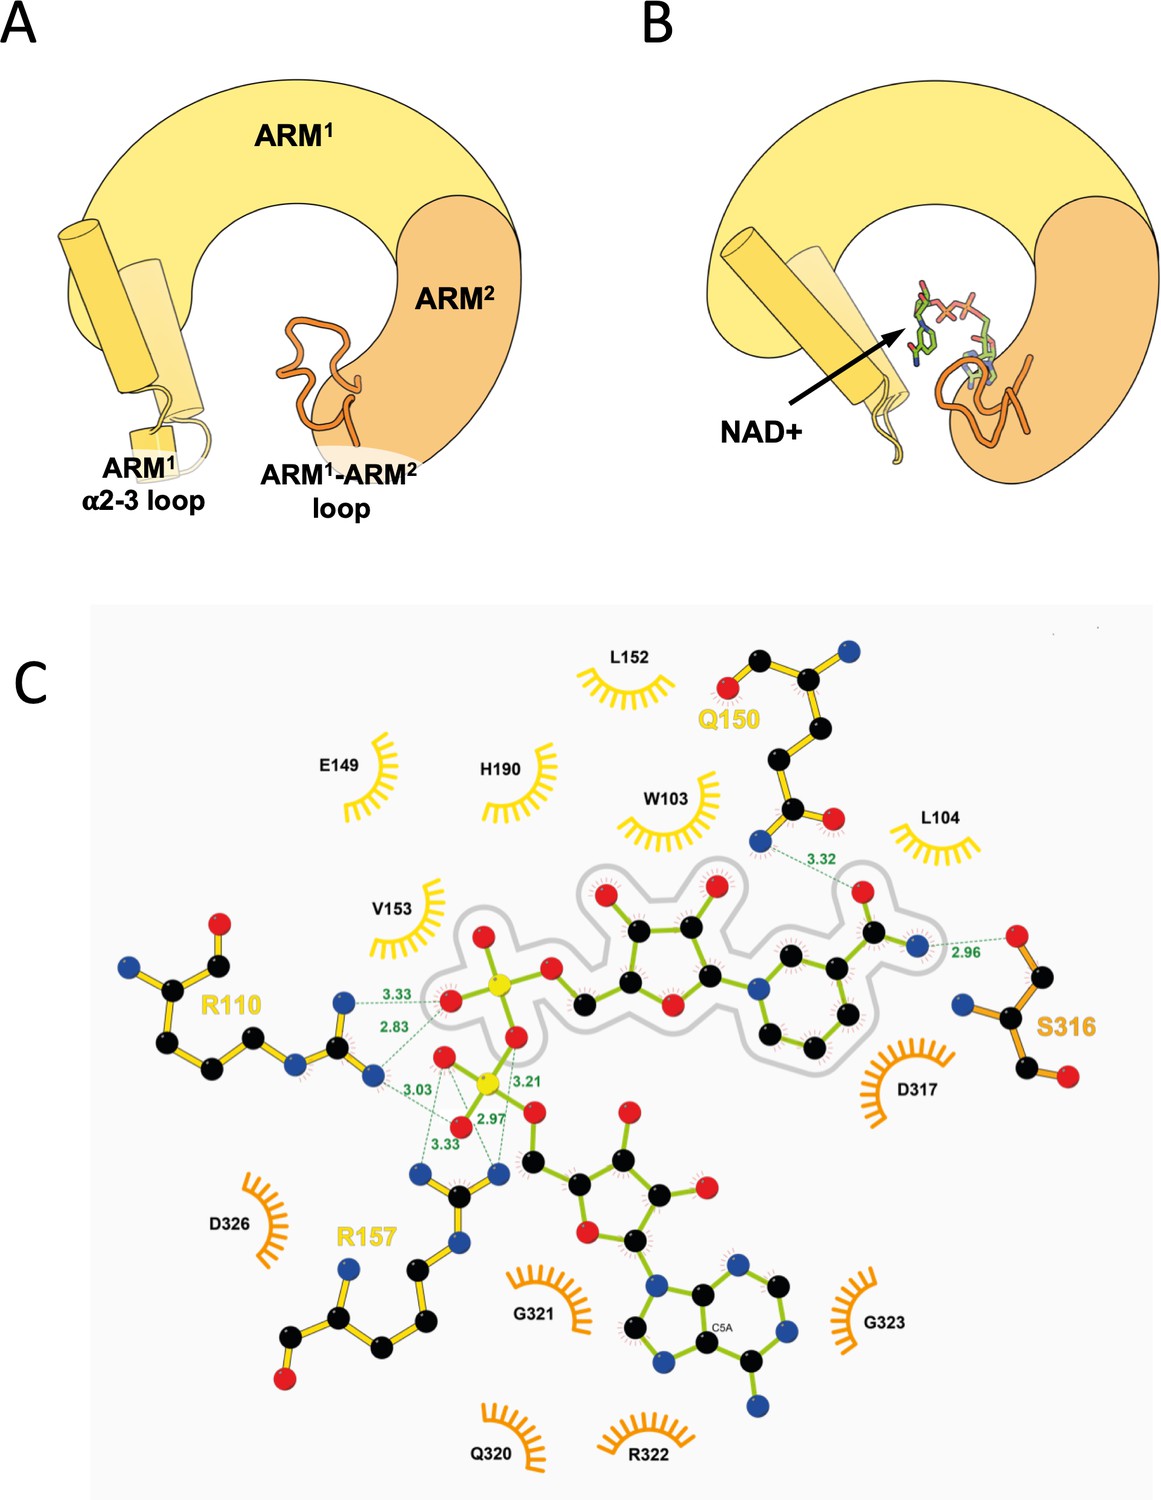
Zooming-in on the ARM allosteric NAD+ binding site.
(A, B) The principle structural rearrangements in the ARM domain are presented as simplified illustration based on a comparison between the GraFix-ed (A) and the NAD+ supplemented (B) SARM1 cryo-EM maps. The ARM1 and ARM2 subdomains are depicted in yellow and orange, respectively, and the ARM1 α2–α3 loop and ARM1 and ARM2 are highlighted. (C) 2D Ligplot (Wallace et al., 1995) diagram details the hydrogen bonds, salt bridges, and hydrophobic interactions between NAD+ and SARM1, where ARM1 residues are colored in yellow, and ARM2 residues in orange. The nicotinamide mononucleotide (NMN) moiety of NAD+ is outlined by a gray line drawing. According to this analysis, the NMN moiety mostly interacts (but not only) with ARM1 residues: W103, L104, E149, Q150, L152, V153, H190, and has a partial interaction with R110. S316 and D317 of ARM2 also interact with the NMN moiety. The adenosine half of NAD+ mostly interacts (but not only) with ARM2 residues: Q320, G321, R322, G323, and D326. R110 and R157 of ARM1 also interact with the adenosine half.
Figure 6
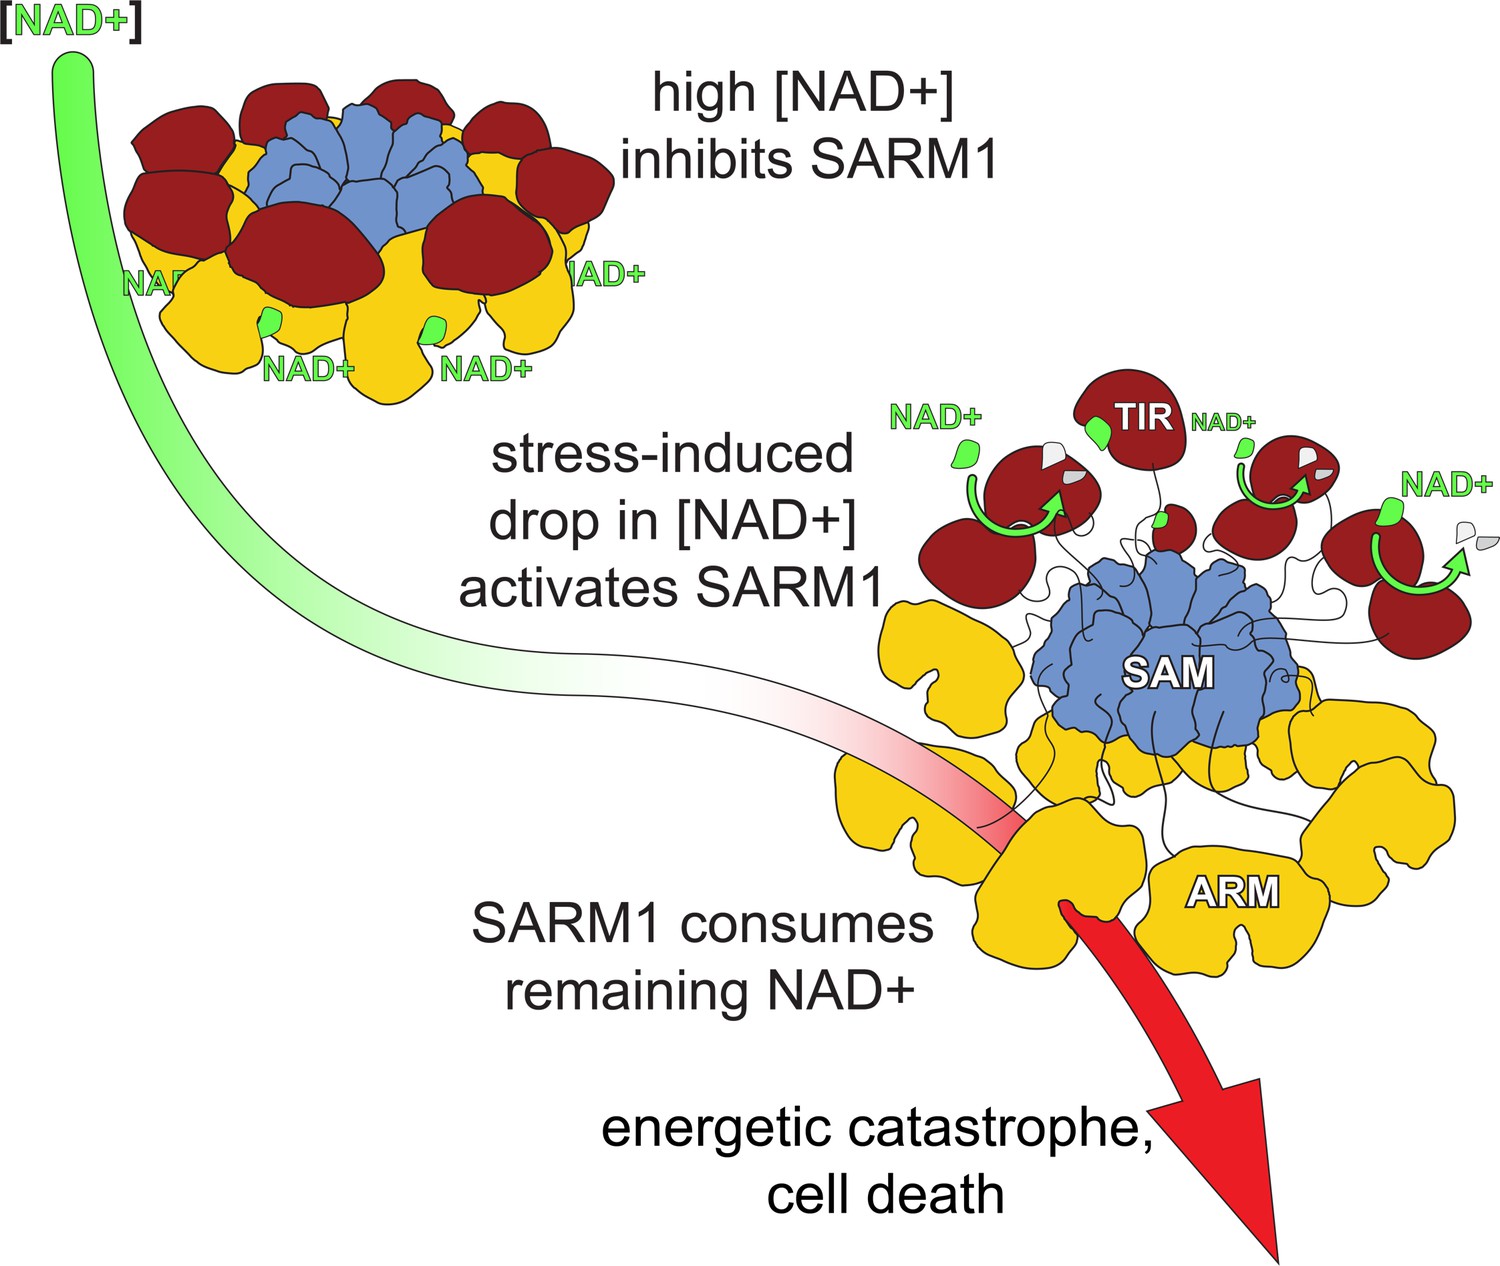
A model for hSARM1 inhibition and activation.
In homeostasis, the cellular NAD+ concentration is high enough and binds to an allosteric site that drives hSARM1 compact conformation. In this conformation, the catalytic TIR domains (red) are docked on ARM domains (yellow) apart from each other and unable to form close dimers required for NAD+ catalysis. When cellular NAD+ levels drop as a result of reduced NAD+ synthesis (e.g. inhibition of NMNAT1/2) or increased NAD+ consumption, the inhibiting NAD+ molecules fall off hSARM1, leading to the disintegration of the ARM-TIR outer ring assembly. Still held by the constitutively assembled SAM inner ring, the now-released TIR domains are at a high local concentration that facilitates their dimerization and ensued NADase activity. When released from allosteric inhibition, hSARM1 is only subjected to competitive inhibition such as by its products ADPR and NAM, which are not found in high enough concentrations to block its activity entirely. This leads to an almost complete consumption of the NAD+ cellular pool and to an energetic catastrophe from which there may be no return.
Tables
Table 1
Cryo-EM data acquisition, reconstruction, and model refinement statistics.
| hSARM1 construct and pretreatment | hSARM1 GraFix-ed | hSARM1 +5 mM NAD+ | hSARM1 no treatment | SAM1–2 |
|---|---|---|---|---|
| Electron microscope | Titan Krios | Titan Krios | F30 Polara | F30 Polara |
| Cryo-EM acquisition and processing | ||||
| EMDB accession # | 11187 | 11834 | 11190 | 11191 |
| Magnification | 165,000x | 165,000x | 200,000 | 200,000 |
| Voltage (kV) | 300 | 300 | 300 | 300 |
| Total electron exposure (e−/Å2) | 50 | 40 | 80 | 80 |
| Defocus range (µM) | −0.8 to −2.8 | −0.8 to −2.8 | −1.0 to −2.5 | −1.0 to −2.5 |
| Pixel size (Å) | 0.827 | 0.827 | 1.1 | 1.1 |
| Symmetry imposed | C8 | C8 | C8 | C8 |
| Initial particles | 658,575 | 335,526 | 26,496 | 416,980 |
| Final particles | 147,232 | 159,340 | 5410 | 43,868 |
| Resolution (masked FSC = 0.143 Å) | 2.88 | 2.7 | 7.7 | 3.77 |
| Model refinement | ||||
| PDB ID | 6ZFX | 7ANW | 6ZG0 | 6ZG1 |
| Model resolution (FSC = 0.50/0.143 Å) | 3.6/2.9 | 2.9/2.7 | ||
| Model refinement resolution | 2.88 | 2.70 | ||
| Non-hydrogen atoms | 39,856 | 40,560 | ||
| Residues | 5080 | 5176 | ||
| RMS deviations | ||||
| Bond length (Å) | 0.008 | 0.009 | ||
| Bond angle (°) | 1.84 | 1.84 | ||
| Ramachandran plot | ||||
| Favored (%) | 89.05 | 91.68 | ||
| Allowed (%) | 10.95 | 8.32 | ||
| Disallowed (%) | 0 | 0 | ||
| Rotamer outliers (%) | 5.73 | 6.64 | ||
| Validation | ||||
| MolProbity score | 2.68 | 2.49 | ||
| Clash score | 10.08 | 6.66 | ||
Key resources table
| Reagent type (species) or resource | Designation | Source or reference | Identifiers | Additional information |
|---|---|---|---|---|
| Gene (Homo sapiens) | SARM1 | Imagene | uniprot Q6SZW1 | |
| Cell line (Homo sapiens) | HEK293F | Thermo Fisher Scientific | Cat#R79007 | |
| Cell line (Homo sapiens) | HEK293T | ATCC | CRL-11268 | |
| Transfected construct (mammalian vector) | pEGFP-N1 | Clontech | modified | |
| Chemical compound, drug | Polyethyleneimine 40 kDa | Polysciences | PEI-MAX | |
| Chemical compound, drug | Resazurin sodium salt | SIGMA | R7017 | |
| Chemical compound, drug | NAD+ | SIGMA | NAD100-RO | |
| Chemical compound, drug | FMN | SIGMA | F8399 | |
| Chemical compound, drug | ADH | SIGMA | A3263 | |
| Chemical compound, drug | Diaphorase | SIGMA | D5540 | |
| Chemical compound, drug | BSA | ORNAT | B9001S | |
| Chemical compound, drug | eNAD | SIGMA | N2630 | |
| Software, algorithm | MotionCorr2 | Li et al., 2013 | ||
| Software, algorithm | Gctf | Zhang, 2016 | ||
| Software, algorithm | Cryosparc V2 | Punjani et al., 2017 | ||
| Software, algorithm | SCIPION wrapper | Martínez et al., 2020 | ||
| Software, algorithm | Warp | Tegunov and Cramer, 2019 | ||
| Software, algorithm | CCP4 | Winn et al., 2011 | ||
| Software, algorithm | GESAMT | Krissinel, 2012 | ||
| Software, algorithm | MOLREP | Vagin and Teplyakov, 2010 | ||
| Software, algorithm | Coot | Emsley et al., 2010 | ||
| Software, algorithm | REFMAC5 | Murshudov et al., 2011 | ||
| Software, algorithm | JLIGAND | Lebedev et al., 2012 |
Additional files
Download links
A two-part list of links to download the article, or parts of the article, in various formats.
Downloads (link to download the article as PDF)
Open citations (links to open the citations from this article in various online reference manager services)
Cite this article (links to download the citations from this article in formats compatible with various reference manager tools)
Structural basis for SARM1 inhibition and activation under energetic stress
eLife 9:e62021.
https://doi.org/10.7554/eLife.62021


