New capsaicin analogs as molecular rulers to define the permissive conformation of the mouse TRPV1 ligand-binding pocket
- Department of Physiology and Membrane Biology, University of California Davis, School of Medicine, United States
- Department of Pharmacology, University of California Davis, School of Medicine, United States
Figures
Figure 1
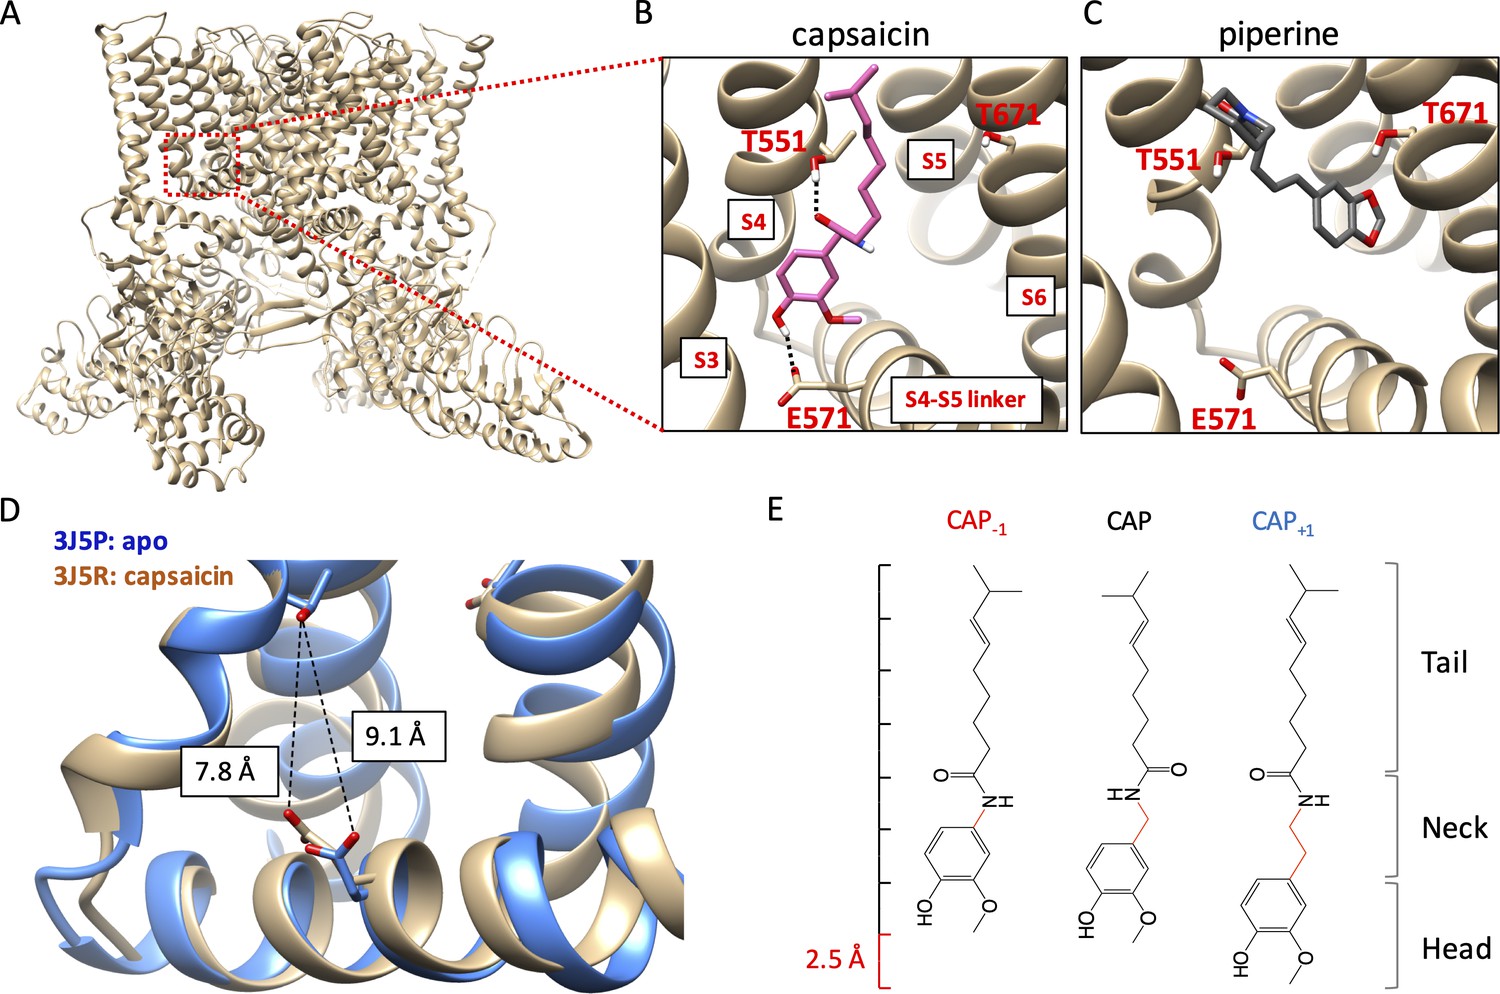
Novel capsaicin analogs for the study of TRPV1 ligand-binding pocket.
(A–C) Characteristics of the ligand-binding pocket with distinct vanilloid binding poses. (D) Distance between the two capsaicin hydrogen bonding residues T551 and E571 in the apo state (blue, PDB: 3J5P) and the capsaicin-bound state (brown, PDB: 3J5R). (E) Molecular structure of capsaicin and its analogs, with differences in the neck highlighted in red. A rough scale bar is shown to the left.
Figure 2
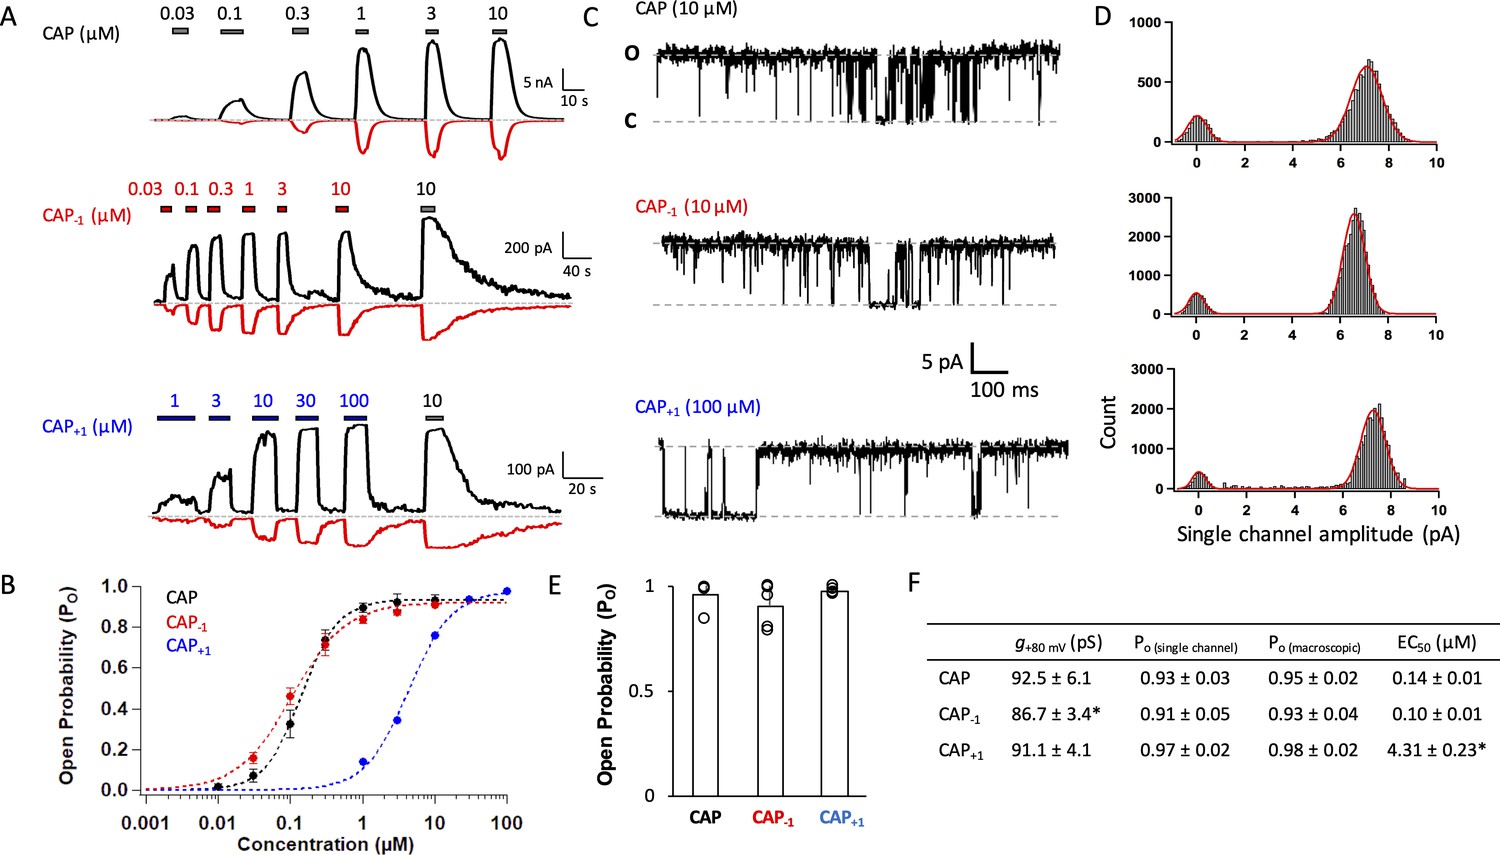
Capsaicin analogs with a shorter or longer neck can fully activate TRPV1.
(A) Representative current traces induced by capsaicin or its analogs recorded at +80 mV (black) and −80 mV (red). (B) Concentration-response curves (n = 5–8 cells). (C) Representative single-channel traces in the presence of a saturating concentration of capsaicin or its analogs at +80 mV. Upward deflection represents the channel in the open state. (D) All-point histogram of single-channel events induced by respective agonists. n = 3–4 cells. (E) Comparison of the open probability. (F) Conductance, Po determined from single-channel and macroscopic recordings, and EC50 values at +80 mV in the presence of a saturating concentration of each agonist (Cap, 10 µM; Cap-1, 10 µM; Cap+1, 100 µM; n = 3–5 cells). *, p<0.05.
Figure 3 with 3 supplements

Docking of Cap-1 (A–C) and Cap+1 (D–F) reveals interacting channel residues and binding poses of agonists.
(A) Representative binding poses of CAP-1 inside the ligand-binding pocket. (B) Energy of predicted VDW and hydrogen bond for each ligand-binding pocket residues. (C) Concentration-response curves of WT and mutant channels in the presence of CAP-1. (D) Representative binding poses of CAP+1. (E) Energy of predicted VDW and hydrogen bond for each ligand-binding pocket residues. (F) Concentration-response curves of WT and mutant channels in the presence of CAP+1. Units of energy are R.E.U. (Rosetta Energy Unit). n = 3–5 cells.
Figure 3—figure supplement 1
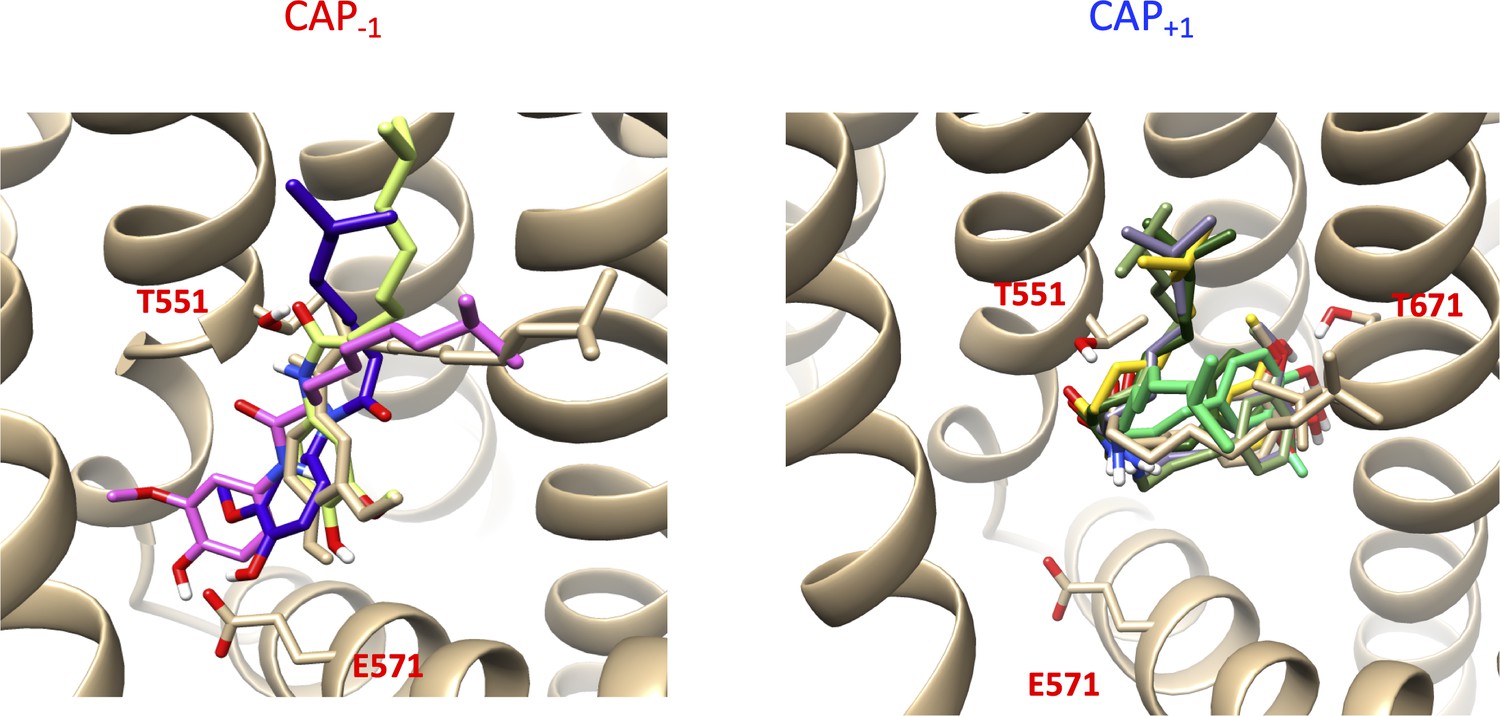
Representatives of the vertical binding poses for Cap-1 (left) and the horizontal binding poses for Cap+1 (right) among the 30 top models.
Figure 3—figure supplement 2

Representative whole-cell patch-clamp recordings of TRPV1 T671S mutant activated by capsaicin (top left), Cap-1 (top right), and Cap+1 (bottom left), and the concentration-response curves (bottom right).
Figure 3—figure supplement 3
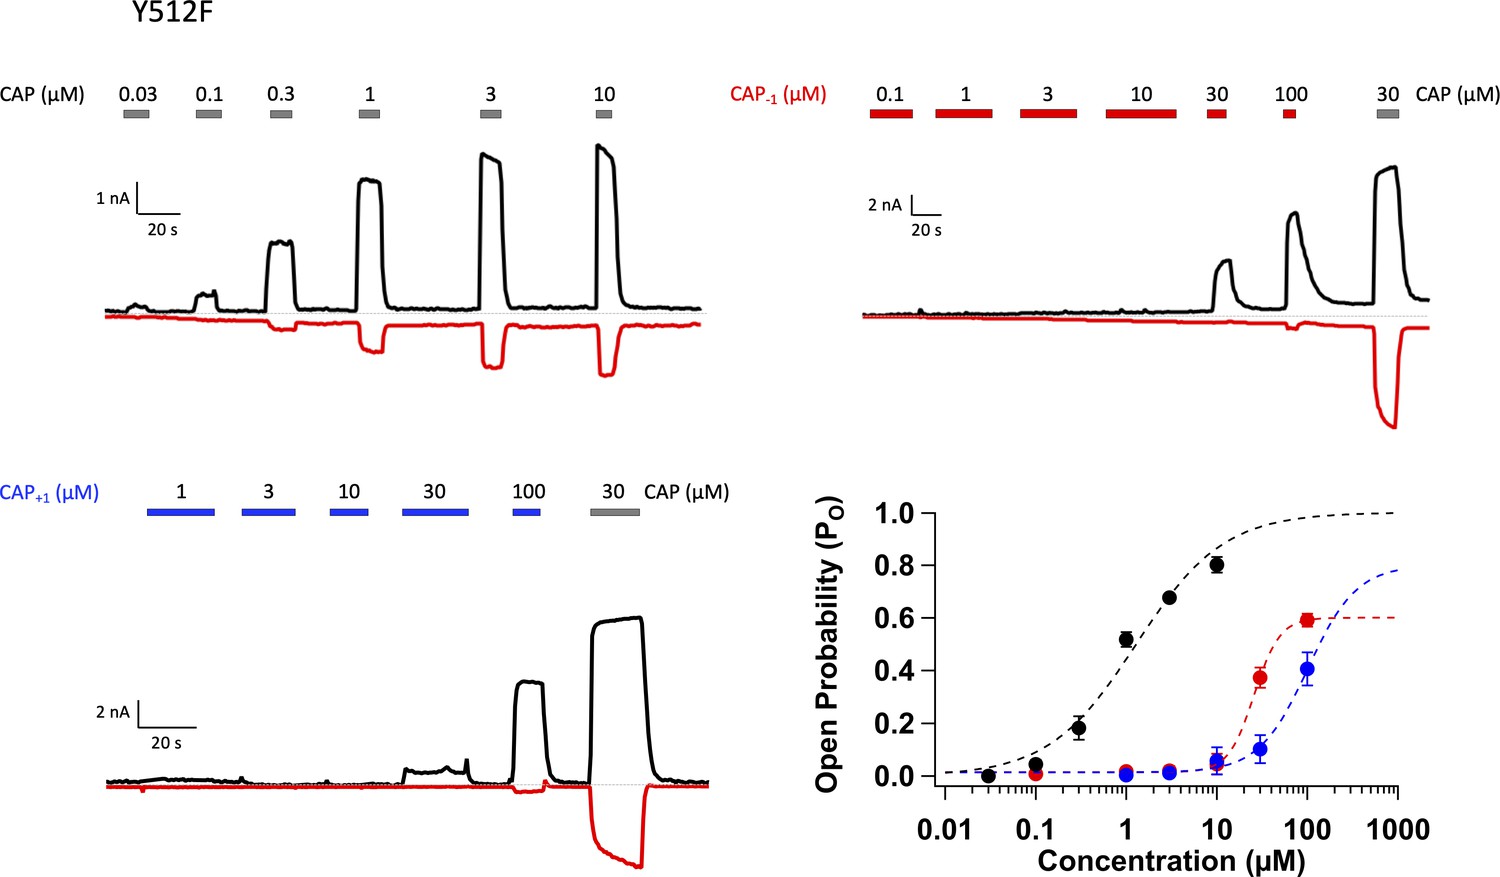
Representative whole-cell patch-clamp recordings of TRPV1 Y512F mutant activated by capsaicin (top left) and Cap-1 (top right), and the concentration-response curves (bottom).
Figure 4 with 3 supplements
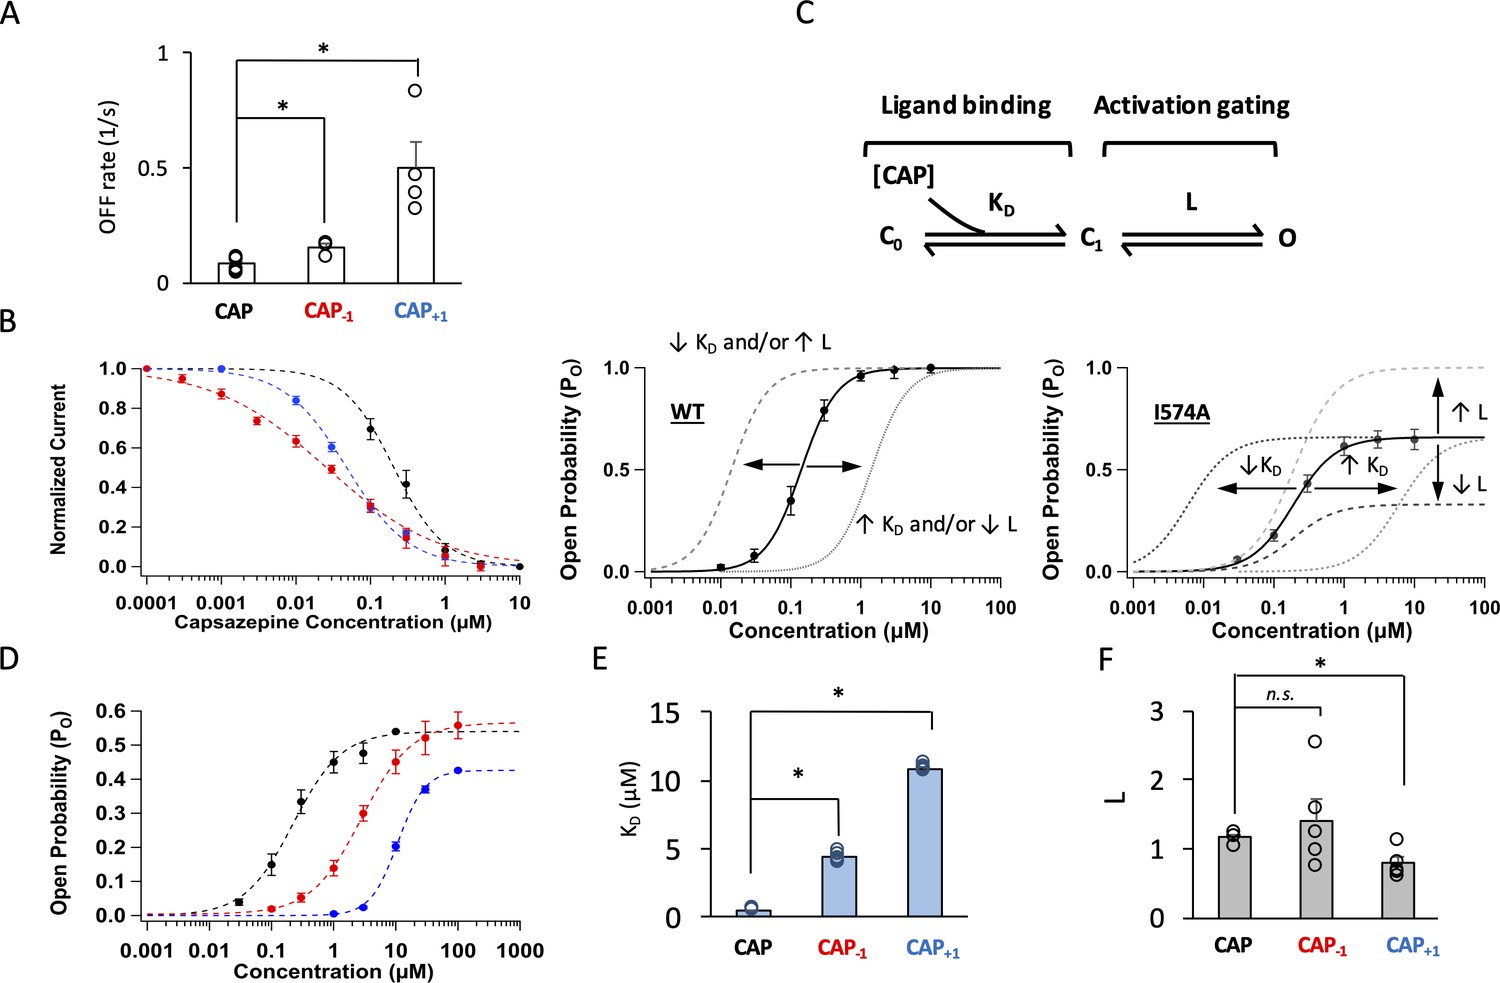
Modifying the neck of capsaicin lowers the binding affinity and allosteric constant for gating.
(A) Comparison of the OFF rates. (B) Concentration-response curves of capsazepine inhibition, with a Hill function fit superimposed. n = 3–5 cells. (C) Gating scheme of capsaicin ligand binding to TRPV1 and activation gating, with corresponding equilibrium constant K and L, respectively. Graphical representation of the challenge for interpretation of changes in EC50 of the WT channels when Po is high (bottom left). The I574A mutation reduces the maximal Po, allowing for the differentiation between changes in K and L. (D) Concentration-response curves of TRPV1 I574A in the presence of capsaicin or its analogs. n = 4–6 cells. (E) Comparison of K and (F) L values for capsaicin and its analogs.
Figure 4—figure supplement 1
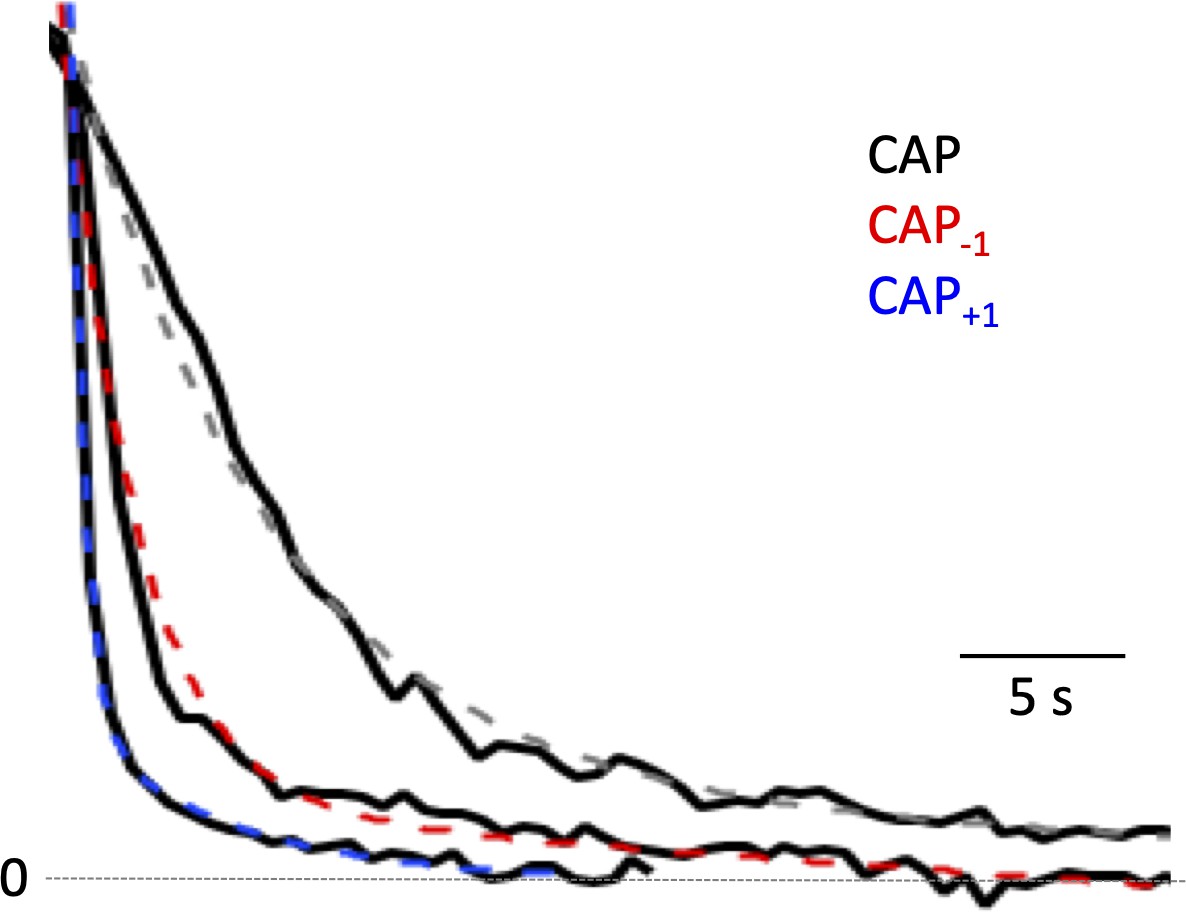
Capsaicin analogs exhibited a more rapid off rate.
Representative normalized tail current traces of TRPV1. Dotted curves represent a single-exponential fit to the tail currents.
Figure 4—figure supplement 2
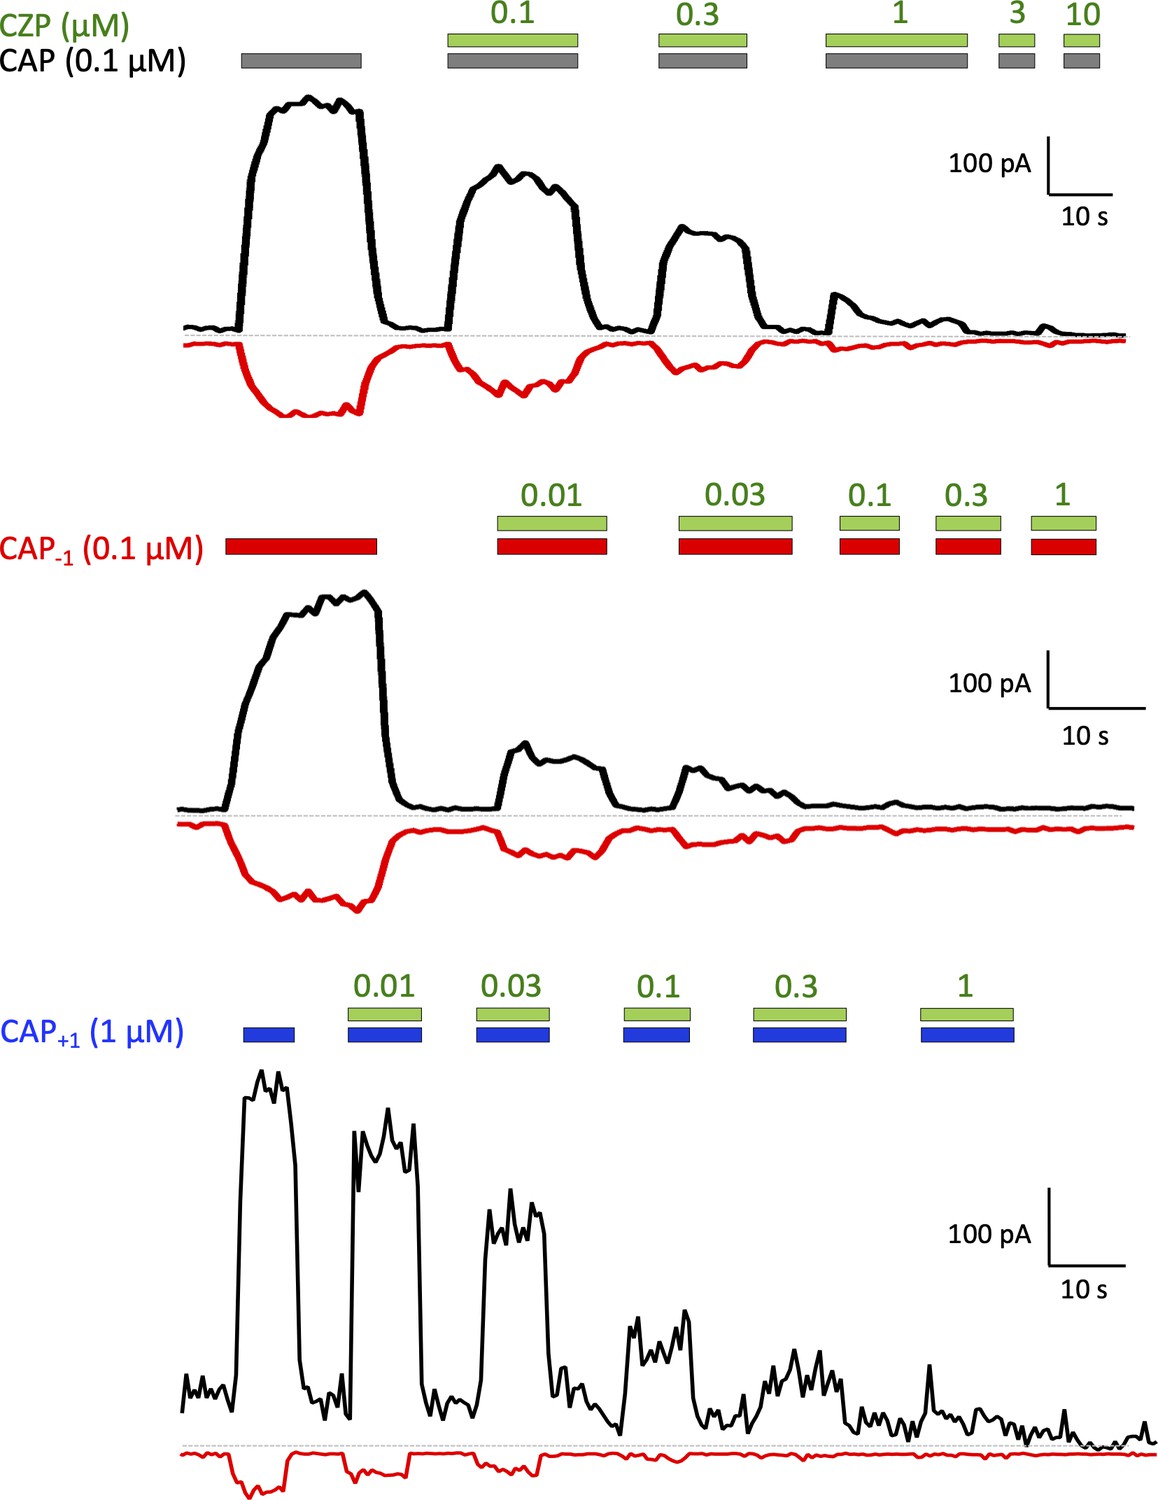
Capsaicin analogs display a reduced binding affinity.
Current traces of capsazepine (CZP) competitively antagonized channel activation induced by capsaicin or its analogs.
Figure 4—figure supplement 3
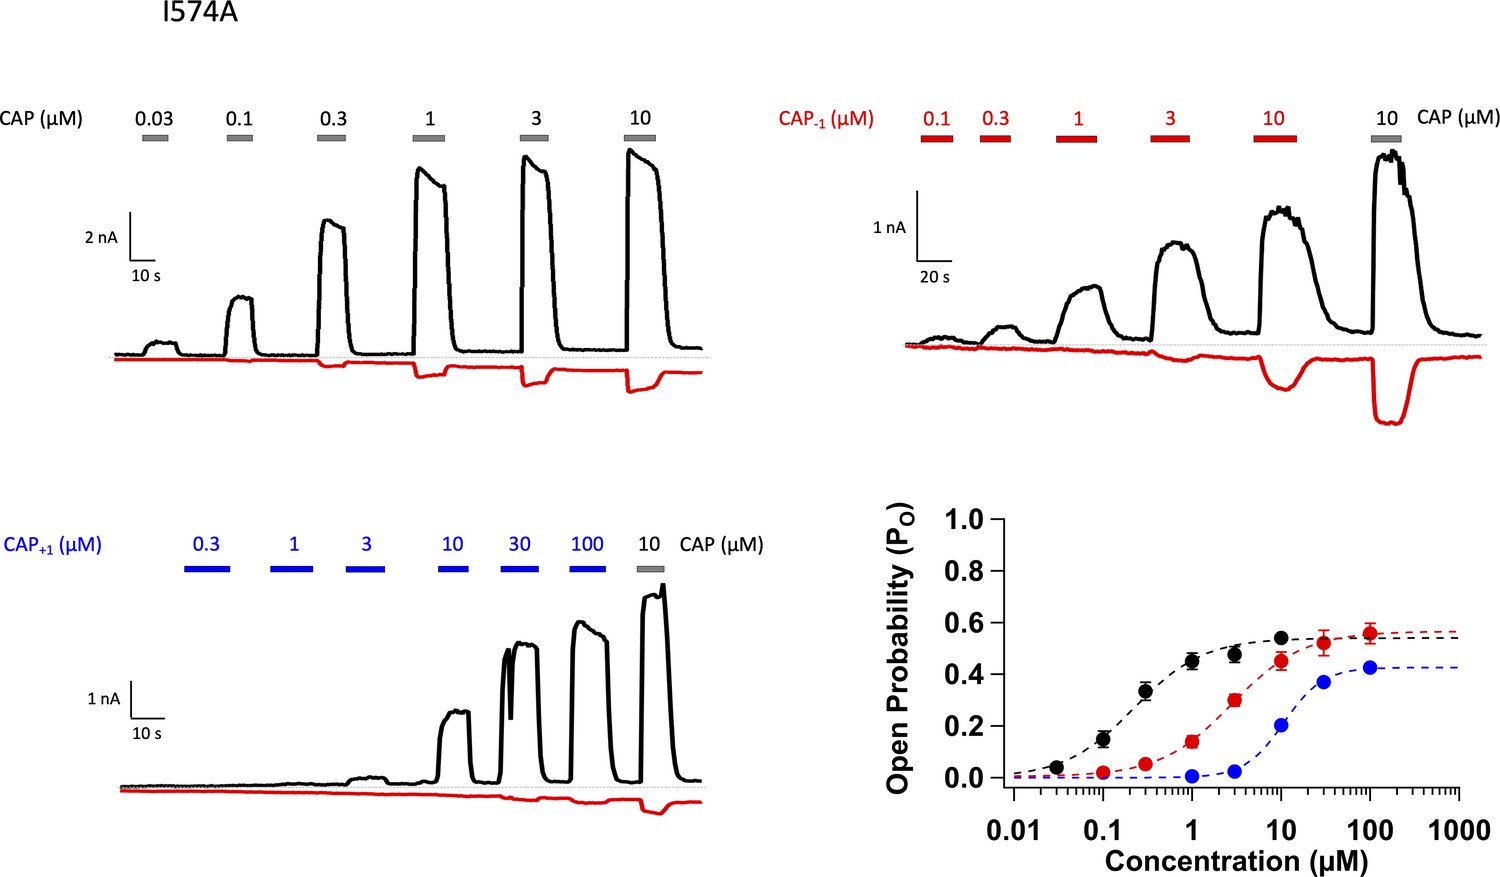
Activation of TRPV1 I574A mutant by capsaicin and its analogs.
Representative whole-cell patch-clamp recordings of TRPV1 I574A mutant with Cap (top left), Cap-1 (top right), and Cap+1 (bottom left), and the concentration response curves. n = 4–6 cells.
Figure 5 with 6 supplements
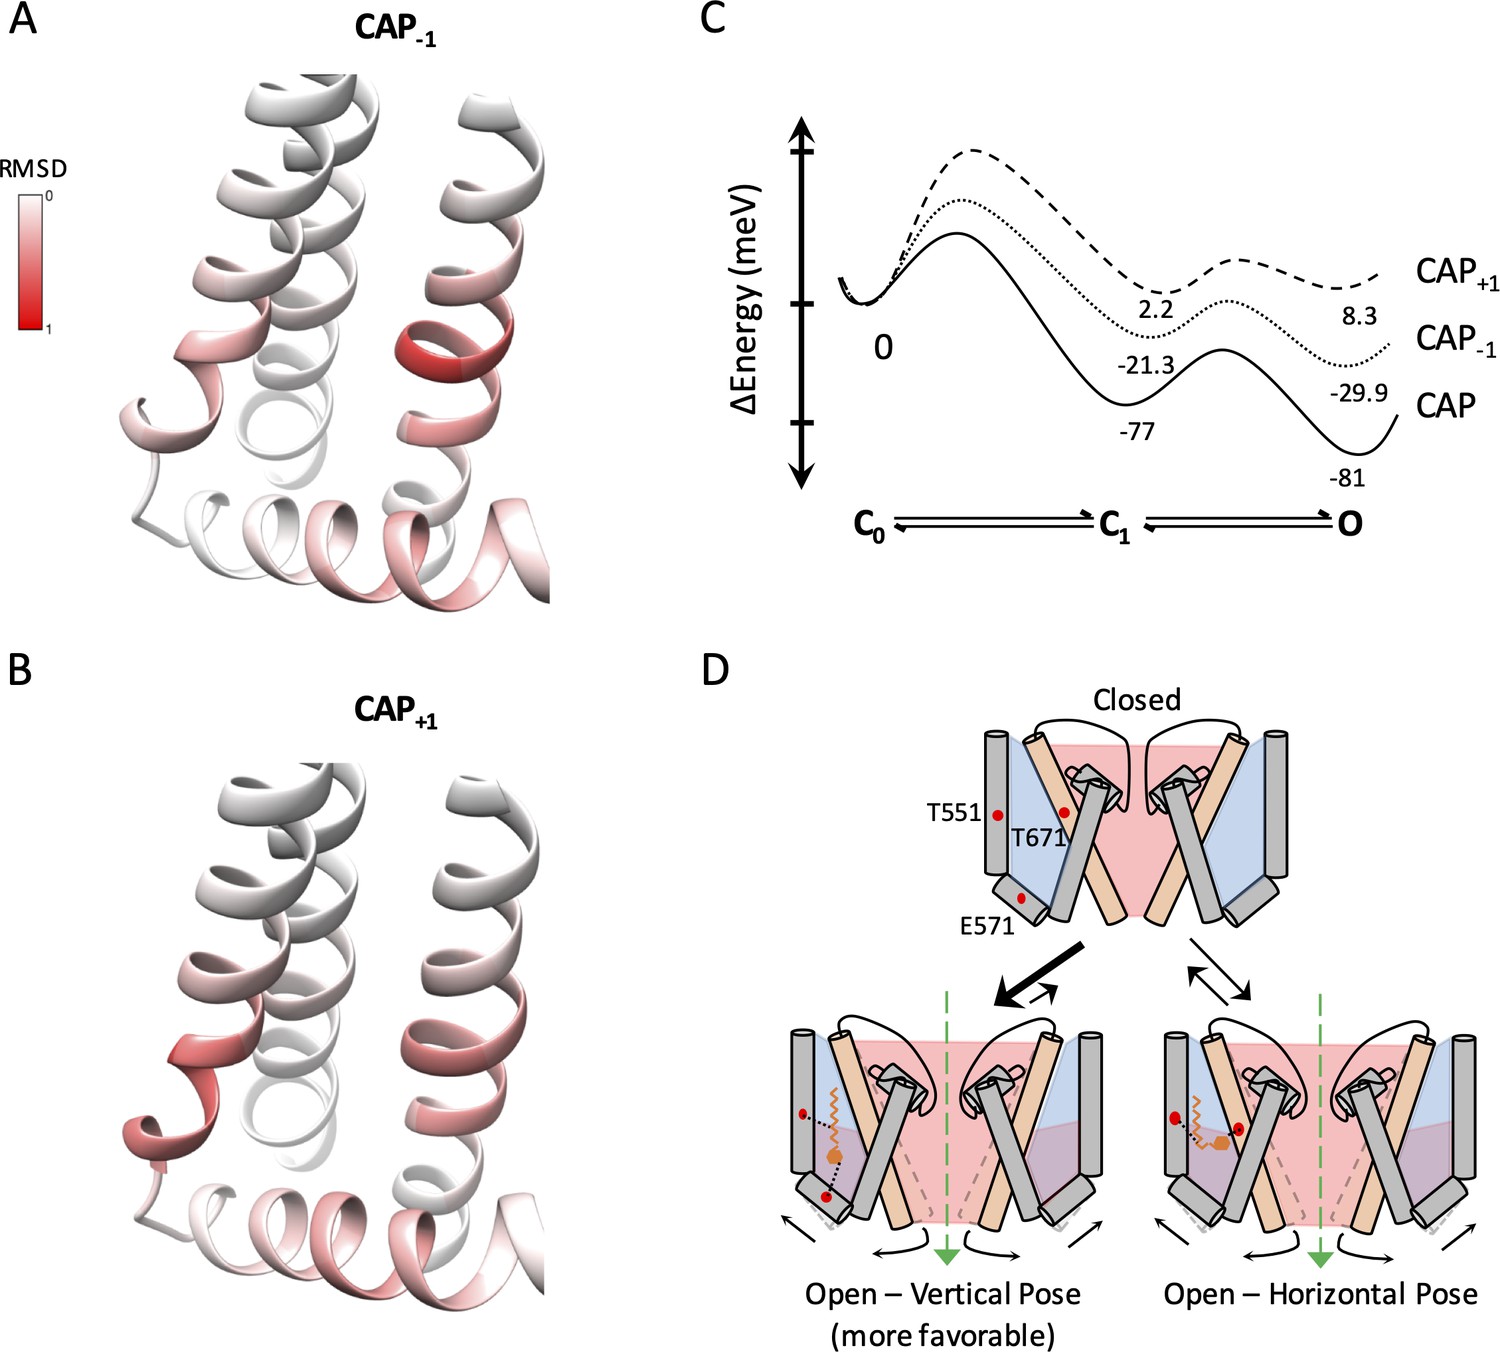
Capsaicin analogs elicit a structurally similar permissive state of the TRPV1 ligand-binding pocket.
(A and B) Comparisons of the ligand-binding pocket permissive conformations induced by CAP-1 (A) or CAP+1 (B) to the cryo-EM structure of capsaicin-bound state (3J5R). The backbone RMSD of the top 30 models are presented. (C) Eyring energy profiles of capsaicin and its analogs. The concentration of each ligand was taken as 10 µM. (D) Cartoon summary of TRPV1 activation by capsaicin and its analogs. Blue represents electropositive areas and red represents electronegative areas.
Figure 5—figure supplement 1
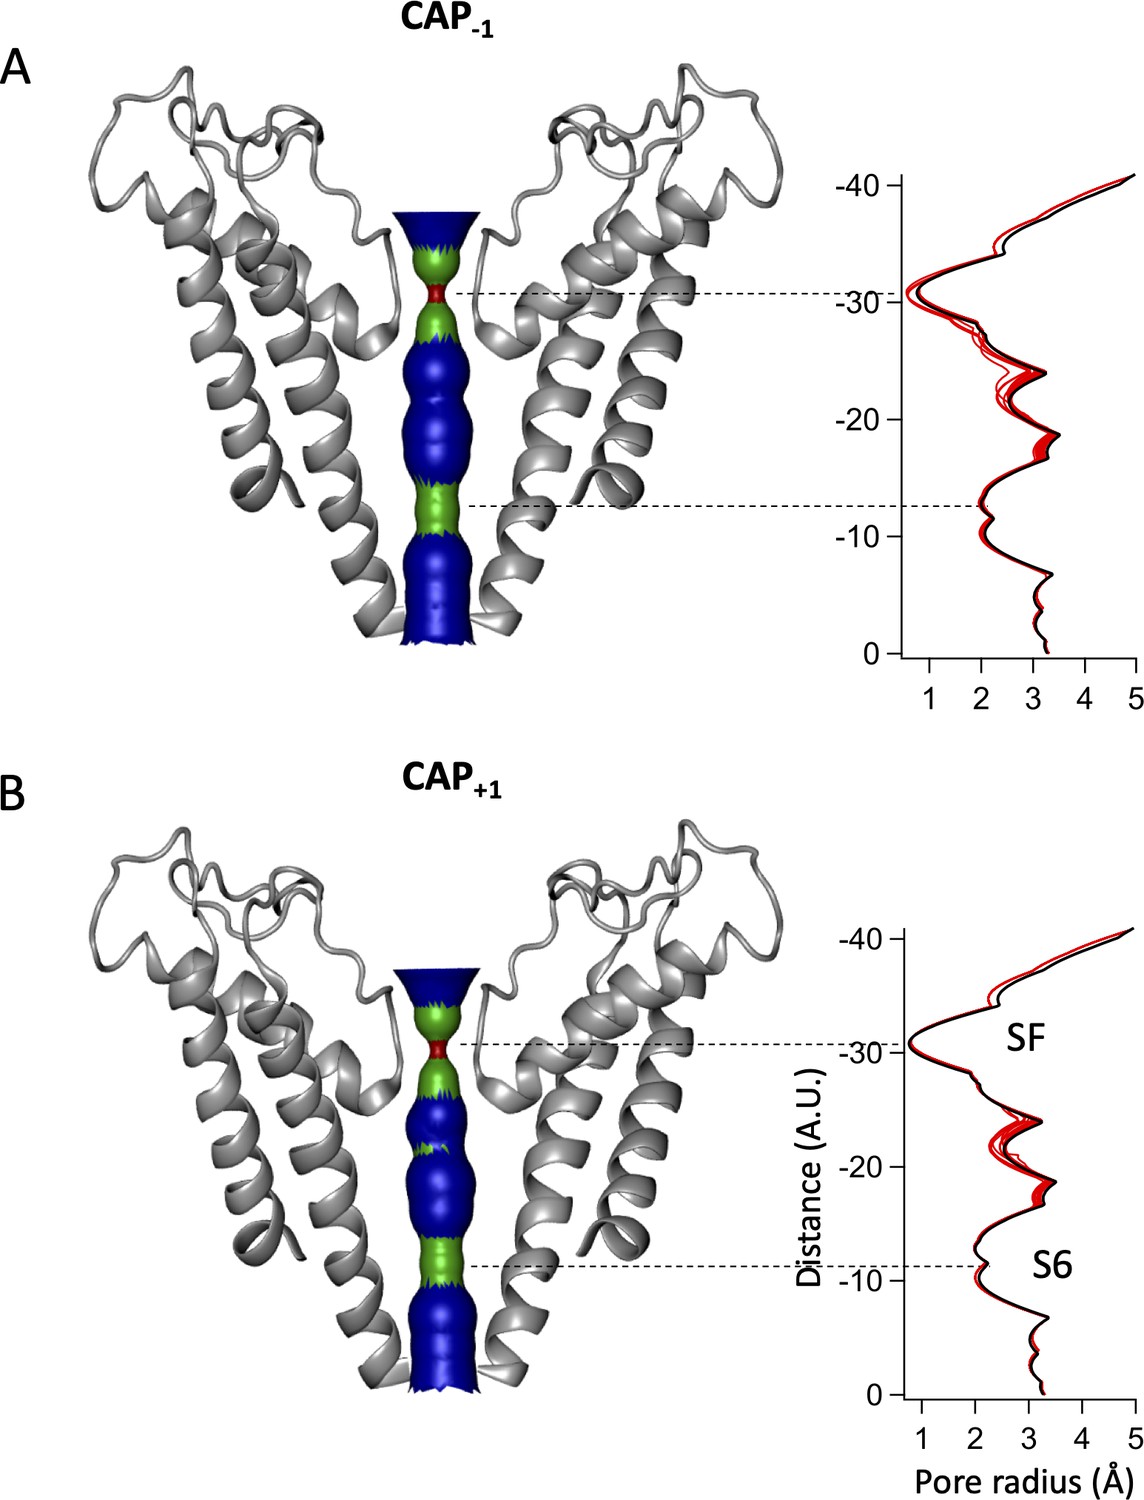
Pore radii of Cap-1 (A) and Cap+1 (B) models (left) with its distribution plot (right).
Red lines represent the top 30 models from docking simulations from each analog. Black line represents the pore radii distribution of 3J5R. SF, selectivity filter. A.U., arbitrary units.
Figure 5—figure supplement 2
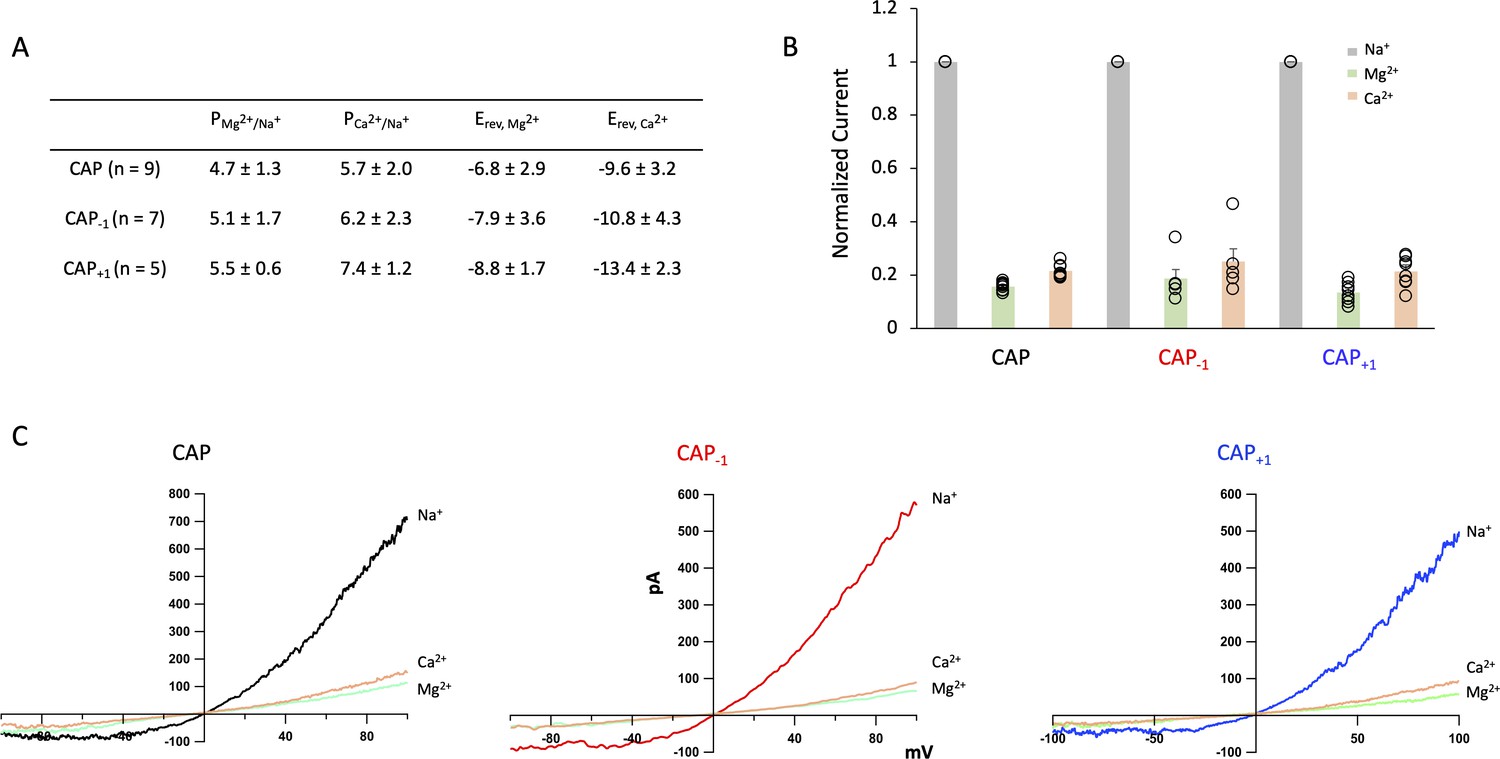
TRPV1 currents induced by Cap and its analogs exhibit similar ion permeation properties.
(A) Summary table of Cap and its analogs. Px/Na+ - permeability ratio of cation x relative to 140 mM Na+. Erev – reversal potential. Permeability ratios were calculated using the Goldman-Hodgkin-Katz equation. (B) Normalized current from inside-out patches measured at +80 mV with 140 mM Na+ in the pipette and test cations (Mg2+ or Ca2+) in the bath. (C) Representative IV curves for Cap, Cap-1, and Cap+1 with same conditions as (B) using a ramp protocol from −100 mV to +100 mV.
Figure 5—figure supplement 3
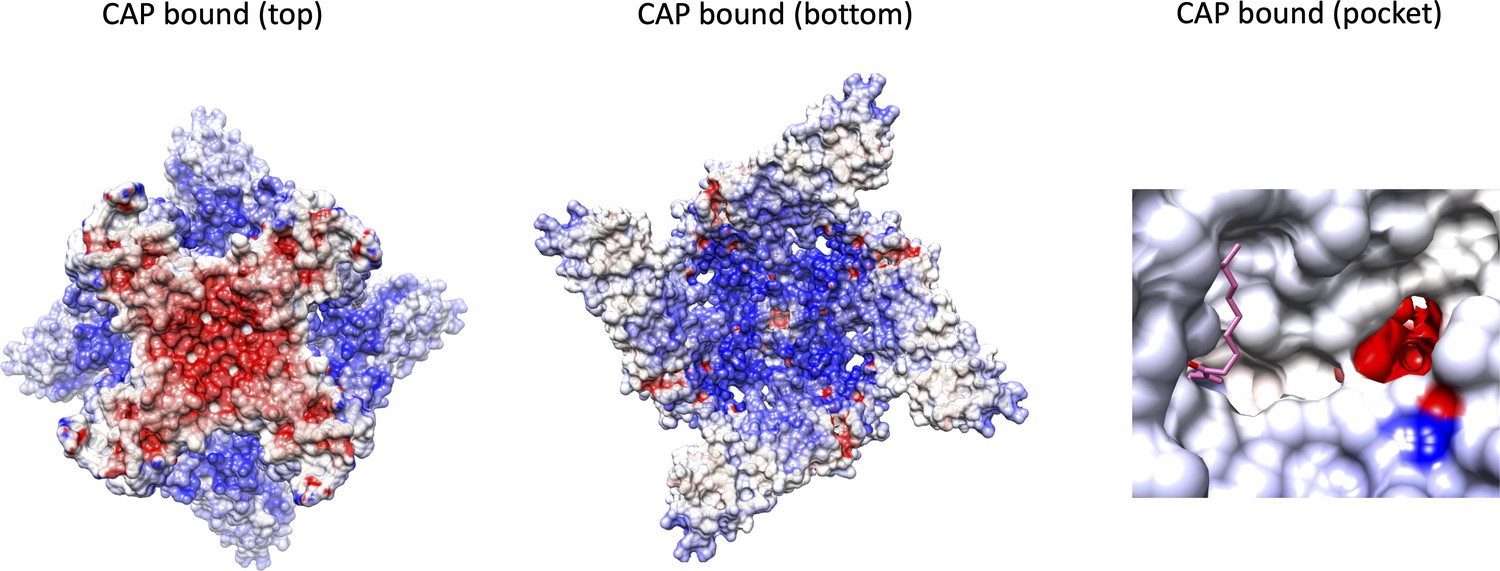
Electrostatic potential distribution of TRPV1 in the capsaicin-bound state, with top and bottom views.
The ion permeation pathway can also be viewed from a side view of the vanilloid-binding pocket with a capsaicin molecule in pink. Blue represents more electropositive regions with red representing electronegative regions.
Figure 5—figure supplement 4

Electrostatic potential of TRPV1 ligand-binding pocket.
Side view of the electrostatic potential of TRPV1 (PDB: 5IRZ) with a lipid bound (top left) and a zoomed in view of the ligand-binding pocket (bottom left). Side view of the electrostatic potential of TRPV1 in the capsaicin bound state (top right; PDB: 3J5R) and a zoomed in view of the ligand-binding pocket (bottom right). Scale bar represents the electrostatic potential with blue being positive and red being negative.
Figure 5—figure supplement 5
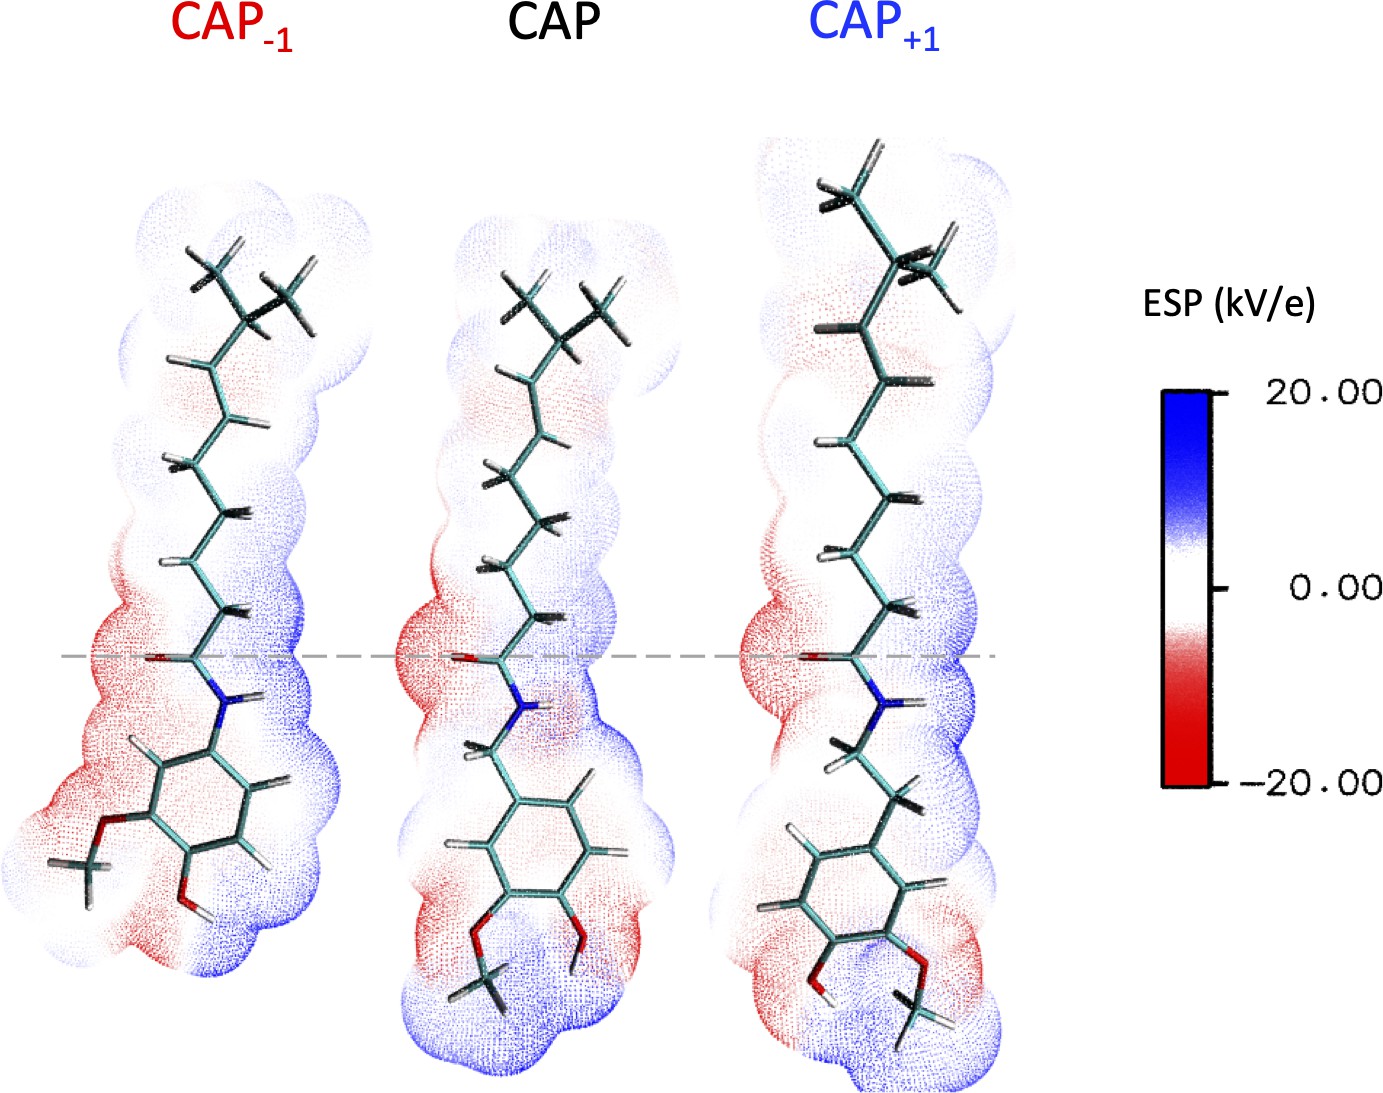
Electrostatic potential of capsaicin and its analogs.
Dashed line marks the position of the carbonyl oxygen on the neck of the compounds. Scale bar represents the electrostatic potentials with blue being electropositive and red being electronegative.
Figure 5—figure supplement 6
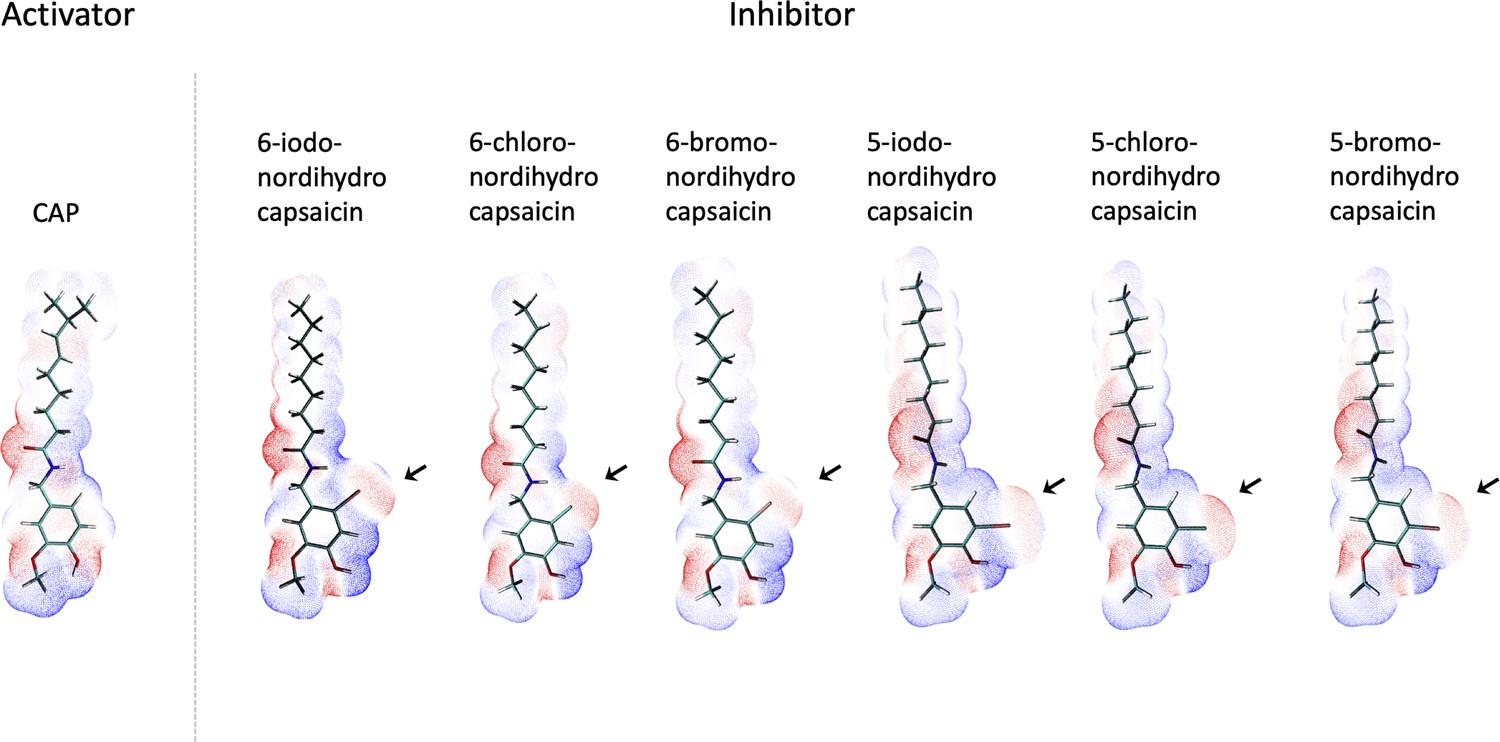
Electrostatic potential maps of capsaicin and halogenated capsaicin analogs.
Electrostatic potential maps of capsaicin and halogenated capsaicin analogs (Br, Cl, I – at either five or six position) were generated using MultiWFN. Red represents more electronegative regions and blue represents more electropositive.
Author response image 1
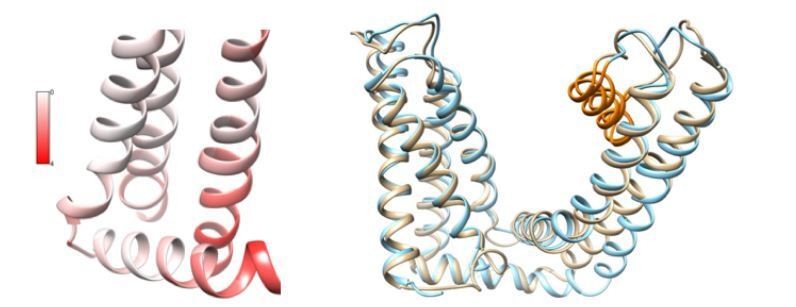
Comparisons between 3J5R and 5IRX.
(Left) Per-residue structural deviation is plotted for the RMSD in Å between these two structures in the ligand-binding pocket. (Right) Structural overlay of 3J5R (cyan) and 5IRX (brown) between S1 and TRP helix.
Tables
Table 1
Comparison of ligand activation of wildtype and mutant mTRPV1 channels by capaicin analogs.
| Cap | Cap-1 | Cap+1 | ||||||||
|---|---|---|---|---|---|---|---|---|---|---|
| EC50 (µM) | K | N | EC50 (µM) | K | N | EC50 (µM) | K | N | ||
| WT | 0.14 ± 0.01 | 1.82 ± 0.22 | 4 | 0.10 ± 0.01 | 1.20 ± 0.05 | 3 | 4.31 ± 0.23* | 1.44 ± 0.11 | 4 | |
| T551V | 1.56 ± 0.20† | 1.74 ± 0.13 | 5 | 9.13 ± 1.10*‡ | 1.83 ± 0.31 | 5 | 70.12 ± 7.74*§ | 1.71 ± 0.10 | 8 | |
| E571A | 1.53 ± 0.10† | 1.86 ± 0.07 | 4 | 19.31 ± 0.22*‡ | 2.01 ± 0.02 | 6 | 31.43 ± 0.02*§ | 1.84 ± 0.11 | 6 | |
| I574A | 0.22 ± 0.02† | 1.41 ± 0.12 | 3 | 2.80 ± 0.11*‡ | 1.35 ± 0.23 | 7 | 10.73 ± 0.33*§ | 1.98 ± 0.12 | 5 | |
| T671S | 0.05 ± 0.06 | 0.87 ± 0.11 | 3 | 22.80 ± 0.40*‡ | 4.94 ± 0.30 | 3 | 35.29 ± 1.19*§ | 3.16 ± 0.45 | 3 | |
| Y512F | 1.12 ± 0.17† | 1.35 ± 0.08 | 4 | 25.18 ± 1.18*‡ | 2.68 ± 0.34 | 3 | 99.48 ± 6.82*§ | 1.46 ± 0.17 | 3 | |
-
* Compared to Capsaicin (Cap).
†Compared to WT Cap.
-
‡Compared to WT Cap-1.
§Compared to WT Cap+1.
-
EC50, half maximal effective concentration; K, Hill coefficient; N, number of patches.
Key resources table
| Reagent type (species) or resource | Designation | Source or reference | Identifiers | Additional information |
|---|---|---|---|---|
| Cell line (Homo sapiens) | HEK 293 | ATCC | Cat #: CRL-1573 | |
| Chemical compound, drug | Capsaicin | Sigma | Cat #: M2028 | |
| Chemical compound | (E)−8-methylnon-6-enoyl chloride | TCI America | Cat #: 95636-02-5 Product: M1826 | |
| Chemical compound | 4-(2-aminoethyl)−2-methoxyphenol | TCI America | Cat #: 7149-10-2 Product: A2330 | |
| Chemical compound | 4-amino-2-methoxyphenol | TCI America | Cat #: 52200-90-5 Product: A2883 | |
| Software, algorithm | IgorPro | IgorPro (https://www.wavemetrics.com/) | Version 8 | |
| Software, algorithm | Rosetta | Rosetta (https://www.rosettacommons.org/) | Version 3.10 | |
| Software, algorithm | Chimera | UCSF Chimera (https://www.cgl.ucsf.edu/chimera/) | Version 1.14 | |
| Software, algorithm | VMD | VMD (https://www.ks.uiuc.edu/Research/vmd/) | Version 1.9.3 | |
| Software, algorithm | GAMESS | GAMESS (https://www.msg.chem.iastate.edu/GAMESS/) | Version Sept. 30,2018 R3 | |
| Software, algorithm | MultiWFN | MultiWFN (http://sobereva.com/multiwfn/) | Version 3.6 | |
| Software, algorithm | Avogadro | Avogadro (https://avogadro.cc/) | Version 1.2.0 | |
| Software, algorithm | OpenEye OMEGA | OpenEye OMEGA (https://www.eyesopen.com/omega) | Version 2.4.3 | |
| Software, algorithm | QuB | QuB (https://www.qub.buffalo.edu/) | Version 2.0.0.30 |
Additional files
-
Supplementary file 1
Description of synthesis, 1H NMR, and 13C NMR of capsaicin analogs.
Rosetta commands and scripts for docking.
- https://cdn.elifesciences.org/articles/62039/elife-62039-supp1-v2.docx
-
Transparent reporting form
- https://cdn.elifesciences.org/articles/62039/elife-62039-transrepform-v2.pdf
Download links
A two-part list of links to download the article, or parts of the article, in various formats.
Downloads (link to download the article as PDF)
Open citations (links to open the citations from this article in various online reference manager services)
Cite this article (links to download the citations from this article in formats compatible with various reference manager tools)
New capsaicin analogs as molecular rulers to define the permissive conformation of the mouse TRPV1 ligand-binding pocket
eLife 9:e62039.
https://doi.org/10.7554/eLife.62039


