Atomic structures of respiratory complex III2, complex IV, and supercomplex III2-IV from vascular plants
- Department of Molecular and Cellular Biology, University of California Davis, United States
- BIOEM Facility, University of California Davis, United States
Figures
Figure 1 with 4 supplements
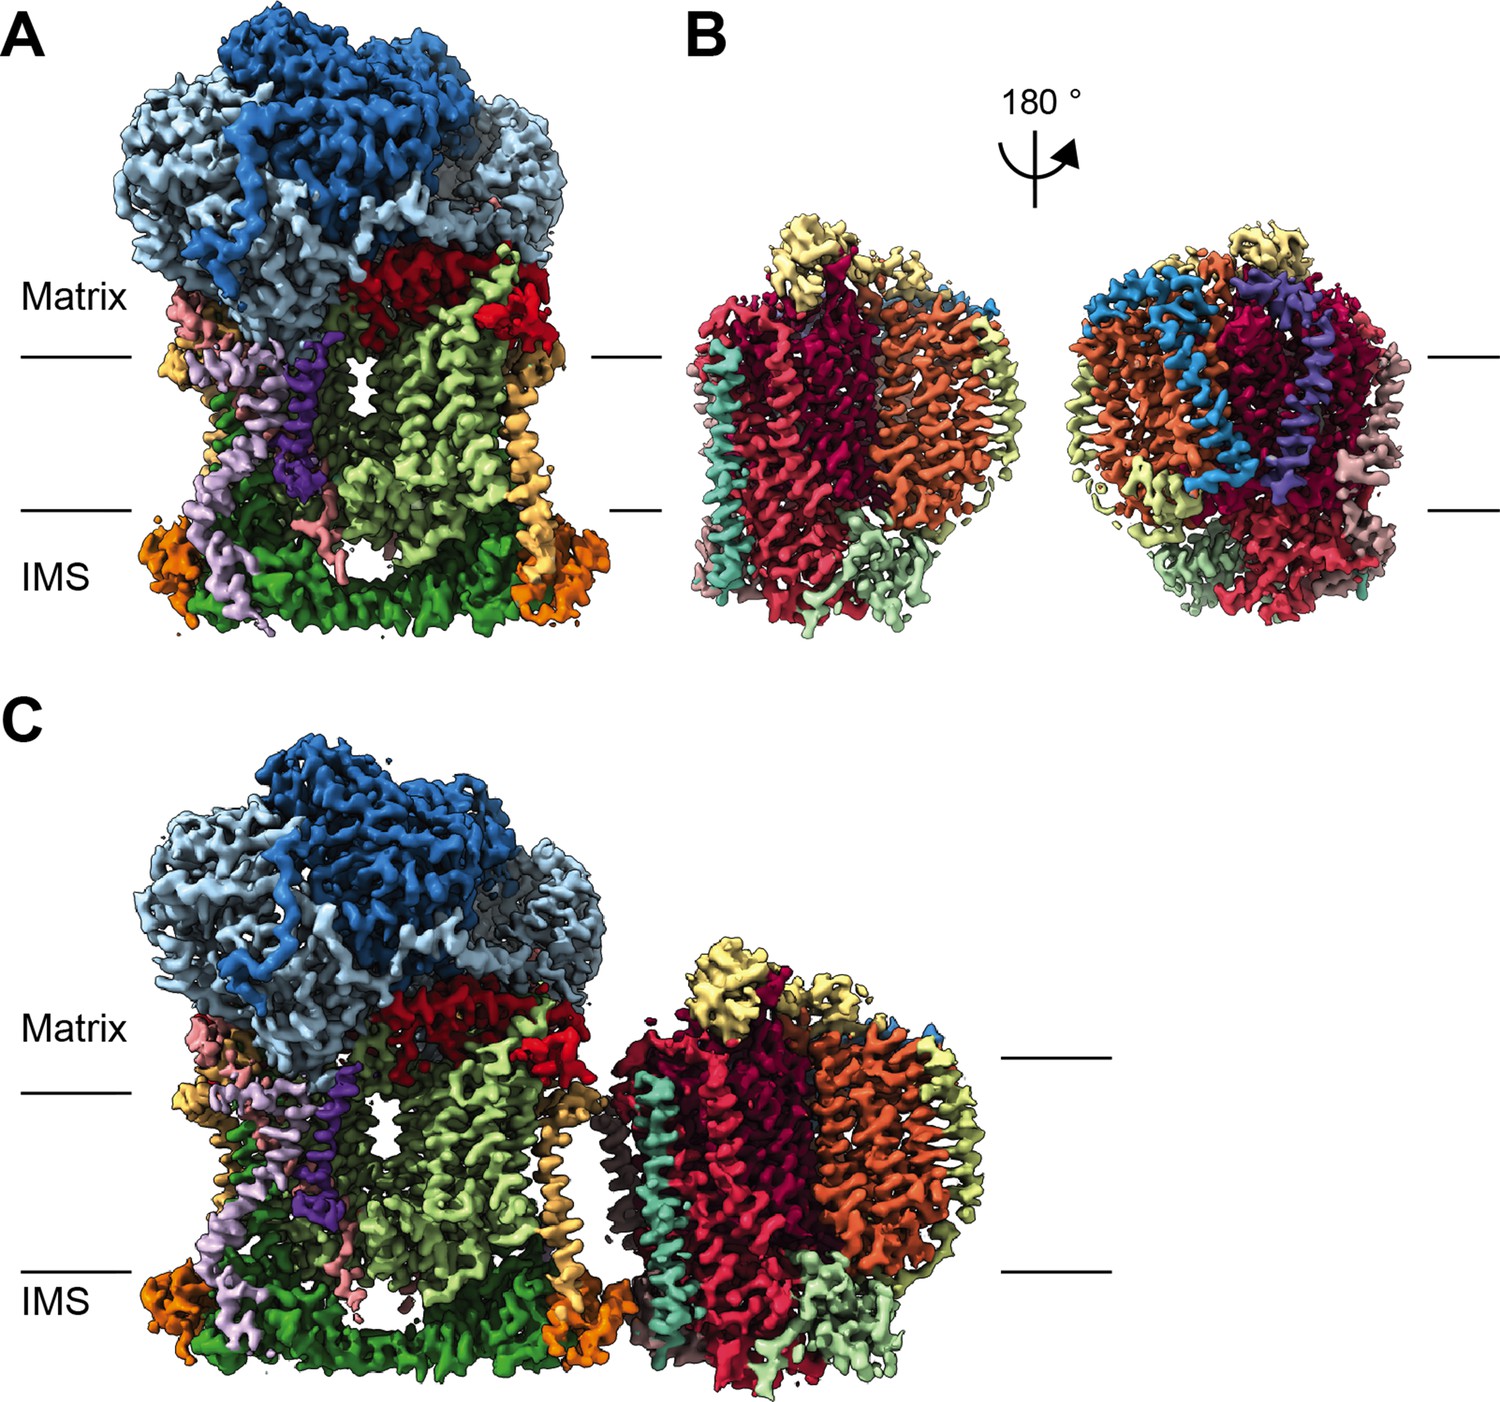
CryoEM reconstructions for V. radiata mitochondrial CIII2, CIV and SCIII2+IV.
(A) CryoEM density map for CIII2 in isolation (not assembled into a supercomplex; see also Figure 1—figure supplement 1 and Video 1). (B) Density map for CIV, obtained from re-centered focused refinements of CIV in the supercomplex (see also Figure 1—figure supplement 2 and Video 2). (C) Composite map of SC III2+IV, assembled by combining CIII2 and CIV-focused refinements from the SC particles (see also Figure 1—figure supplements 1 and 2 and Video 3). Volume surfaces are colored by subunit (see also Videos 1–3 and Figures 2 and 5). The approximate position of the matrix and IMS sides of the membrane are shown with black lines.
Figure 1—figure supplement 1
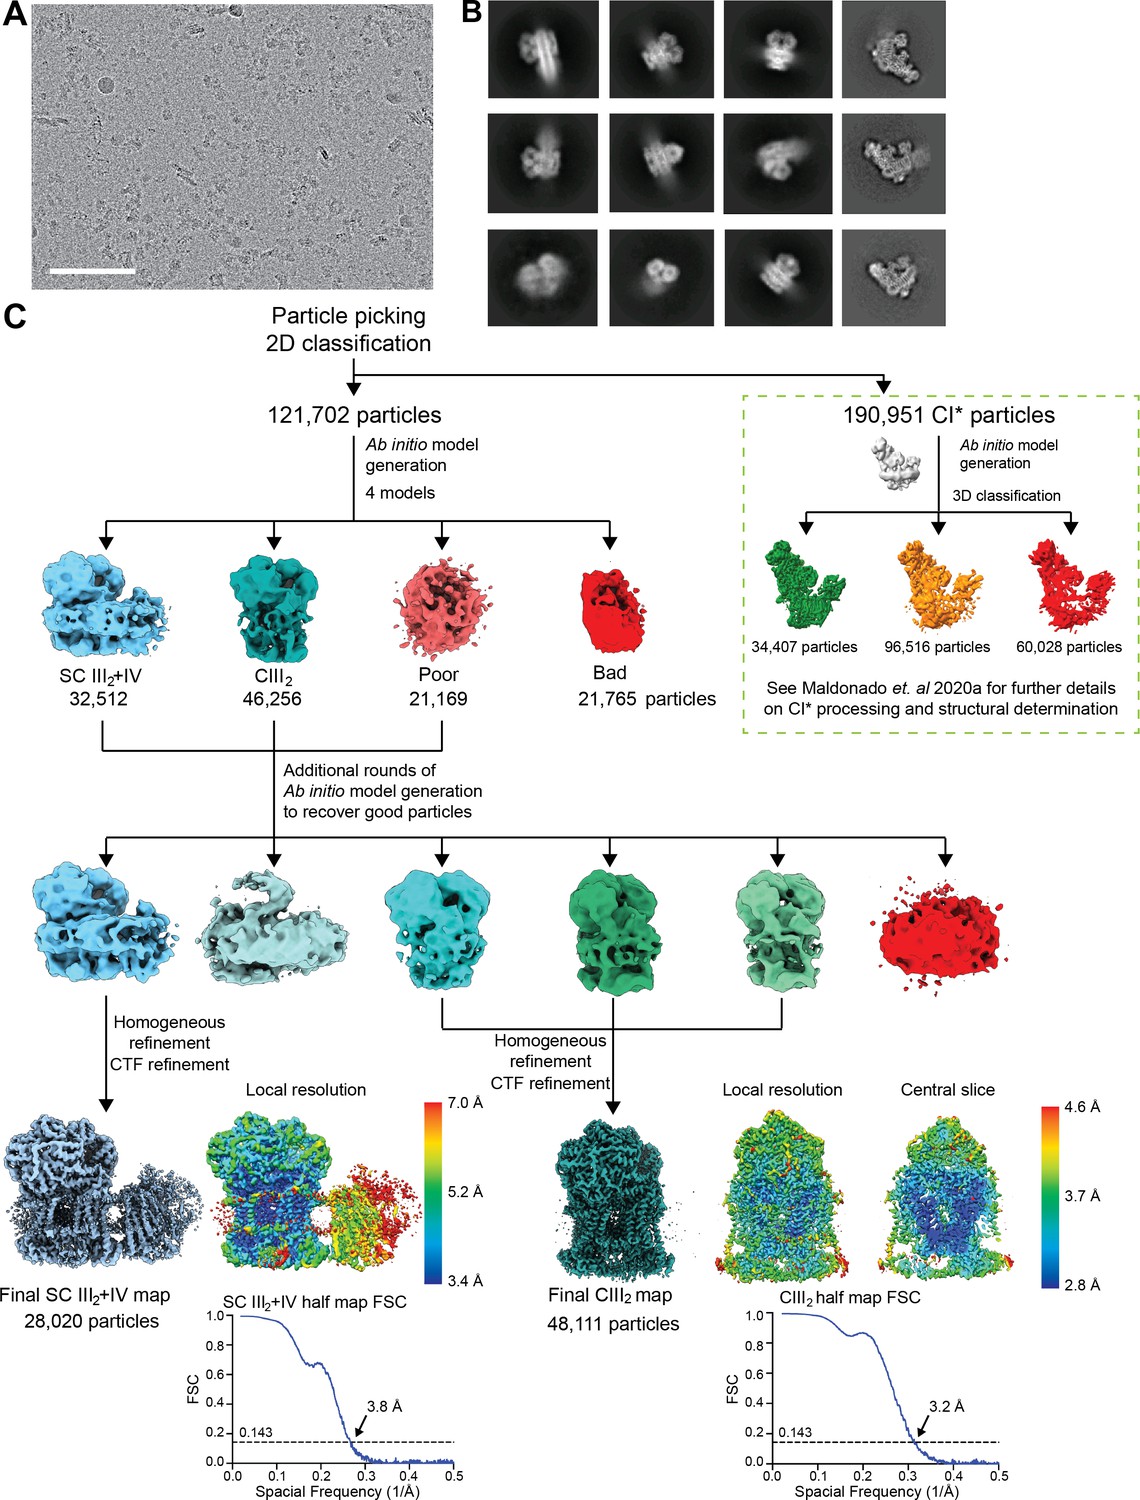
Initial processing and reconstructions using cryoSPARC.
(A) A representative micrograph of the 8541 used for further processing (9816 collected). Scale bar, 100 nm. (B) Representative 2D class averages from reference-free classification of CIII2, SC III2+IV and CI* (last column). (C) Classification and refinement procedures used. Note that the same micrographs were used for the structural determination of V. radiata CIII2, CIV, SC III2+IV (this paper) and CI* (Maldonado et al., 2020) (green dashed box). The local resolution map and the half map gold-standard FSC curves are shown next to their respective final reconstructions.
Figure 1—figure supplement 2
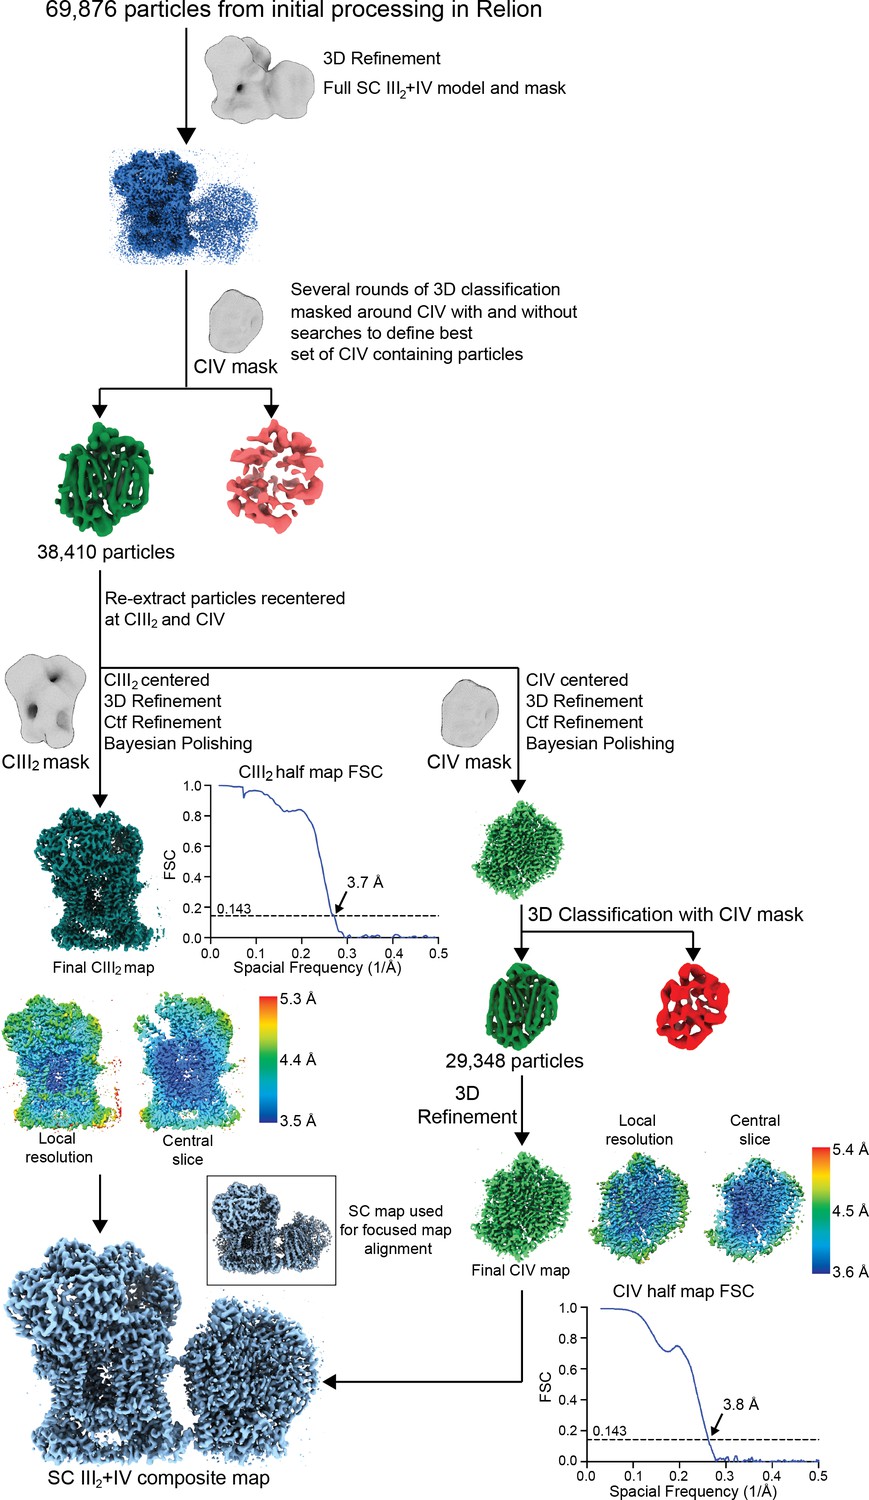
Supercomplex focused classification and 3D refinement using Relion.
SC III2+IV particles selected from 2D classification were first aligned using a SC III2+IV model. These aligned particles were sorted by several rounds of 3D classification using a CIV-only mask (see Materials and methods). Results from the 3D classifications were pooled and duplicate particles were removed. Particles from this set were re-extracted centered at CIII2 and CIV, generating two sets of re-centered particles. These were 3D-refined, CTF-refined and polished independently using a CIII2 and CIV mask/model, respectively. For the CIV-centered particles, an additional round of 3D classification was performed on the shiny particles. The local resolution map, a slice through the local resolution map and the half map gold-standard FSC curves are shown next to their respective final reconstructions. The locally refined maps were combined in Phenix to generate a composite map based on the best SC III2+IV reconstruction (bottom left inset; see also Figure 1—figure supplement 1).
Figure 1—figure supplement 3

Map-Model FSCs are shown for (A) CIII2 alone (see also Figure 1—figure supplement 1), (B) CIV-focused map from the supercomplex particles (see also Figure 1—figure supplement 2) and (C) the SC III2+IV composite map (see also Figure 1—figure supplement 2).
See also Supplementary file 1b.
Figure 1—figure supplement 4
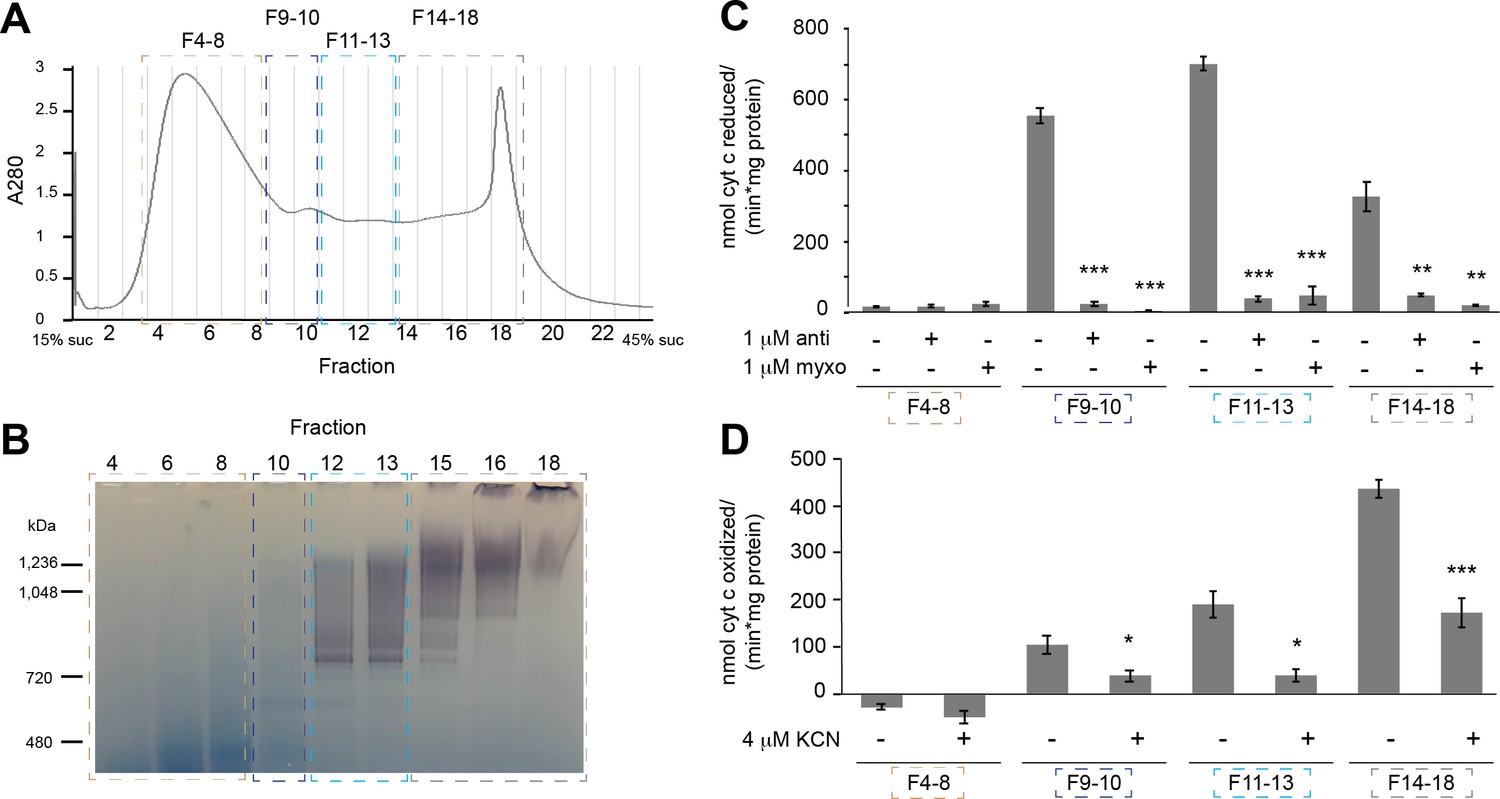
Fractionation and activity of extracted mitochondrial membranes.
(A) Digitonin-extracted, amphipol-stabilized V. radiata mitochondrial membrane sample was separated by a 15–45% (w:v) linear sucrose (suc) gradient and fractionated. Relevant fractions were pooled and concentrated as indicated by dashed boxes and labels (fractions 4–8, 9–10, 11–13, 14–18) after the in-gel activity assay in (B). (B) Select fractions of the sucrose gradient fractions from (A) were run on a BN-PAGE gel and subjected to in-gel NADH-dehydrogenase activity assay. Note that not all fractions were loaded on the gel, and that the peak on fraction 18 corresponds to aggregation, likely due to the use of old mitochondrial samples due to COVID-19-related research restrictions. (C) The activity of the pooled samples from (A) was tested with a spectroscopic activity assay from reduced-decylubiquinone to cytochrome c, in the presence or absence of 2 µM antimycin (anti) or myxothiazol (myxo). Three to five independent repeat measurements were done for each sample. The background-corrected average of the repeats is shown, together with the standard error from the mean (S.E.M., error bars). Significance (**, p<0.01; ***, p<0.001) was tested with two-tailed t-tests for each inhibitor-exposed sample with respect to the control. p-values from left to right: 0.97, 0.32, 8.0 × 10⁻⁵, 1.5 × 10⁻⁴, 4.7 × 10⁻⁶, 2.8 × 10⁻⁵, 0.0064, 0.0051. (D) The activity of the pooled samples from (A) was tested with a spectroscopic activity assay to follow the oxidation of reduced cytochrome c, in the presence or absence of 4 µM potassium cyanide (KCN). Three to four independent repeat measurements were done for each sample. The background-corrected average of the repeats is shown, together with the standard error from the mean (S.E.M., error bars). Significance (*, p<0.05; ***, p<0.001) was tested with two-tailed t-tests for each inhibitor-exposed sample with respect to the control. p-values from left to right: 0.25, 0.0398, 0.0199, 7.9 × 10⁻⁴.
Figure 2 with 3 supplements
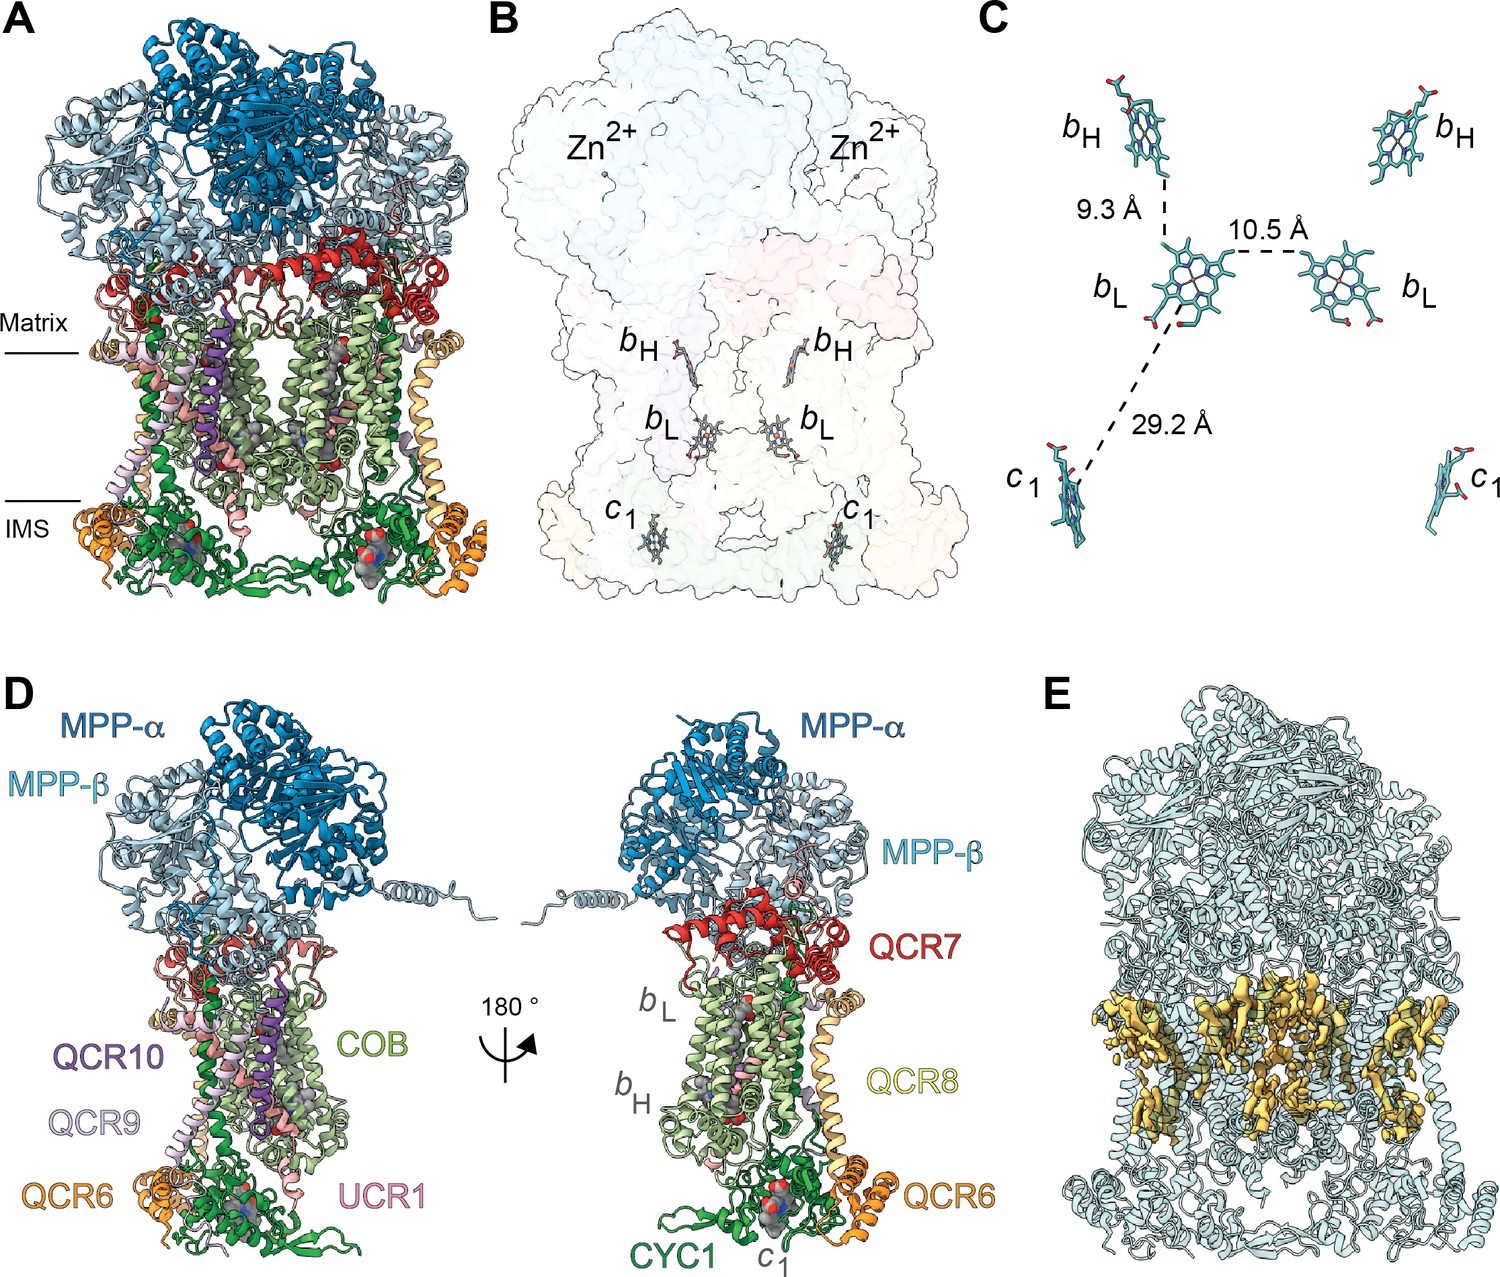
Overview of plant CIII2 atomic model.
(A) CIII2 in cartoon representation with co-factors in sphere representation. The approximate position of the inner mitochondrial membrane is shown with black lines, and the matrix and inter-membrane space (IMS) sides are labeled. (B) Position of the observed CIII2 co-factors. Note that the iron-sulfur groups are not shown because the flexible head domain of the iron-sulfur protein is disordered in our cryoEM density. CIII2 shown in transparent surface representation, cofactors in stick representation. (C) Distances between the heme groups are shown, calculated edge-to-edge to the macrocyclic conjugated system. (D) Each CIII and co-factor are shown as in (A) with subunits labeled. The CIII monomers are separated for clarity and the two-fold symmetry axis is indicated. (E) Density consistent with lipids (yellow) is shown overlaid on the CIII2 cartoon model (transparent teal). bH, high-potential heme b; bL, low potential heme b; c1, heme c1; IMS, intermembrane space.
Figure 2—figure supplement 1
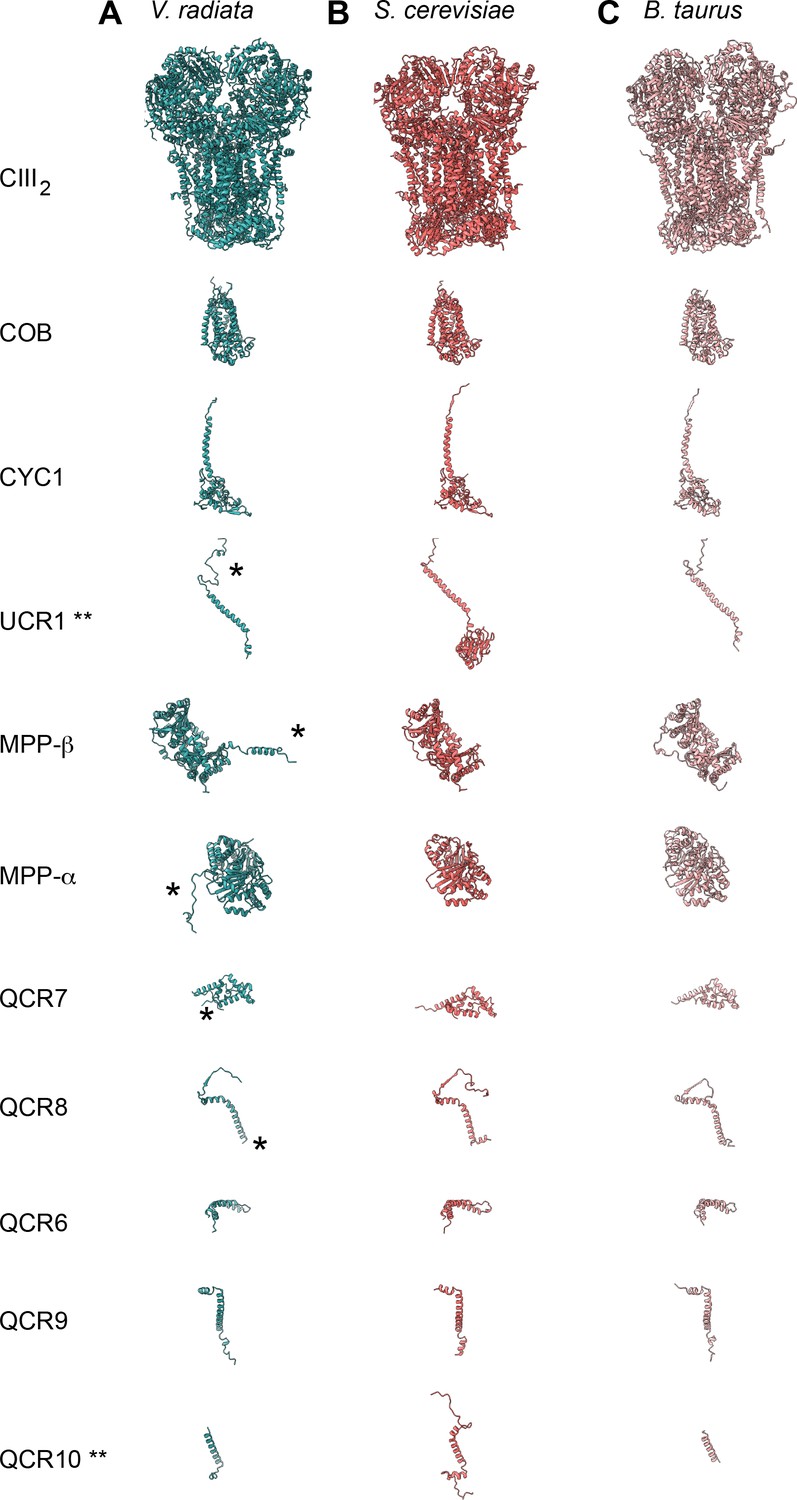
CIII subunit comparison.
(A-C) CIII subunits are shown for (A) V. radiata (this work), (B) S. cerevisiae (PDB: 6HU9) and (C) B. taurus (PDB: 1BGY). Yeast and bovine subunits were independently aligned with the corresponding V. radiata subunit. The orientation of each subunit corresponds to the orientation on CIII2 in the top row. Note that only the atomically modelled residues are shown. Hence, the Rieske head domain of V. radiata and B. taurus (UCR1), as well as the N- and C-termini of V. radiata QCR10 are missing (labeled with **). Differences discussed in the text are labeled with an asterisk (*).
Figure 2—figure supplement 2
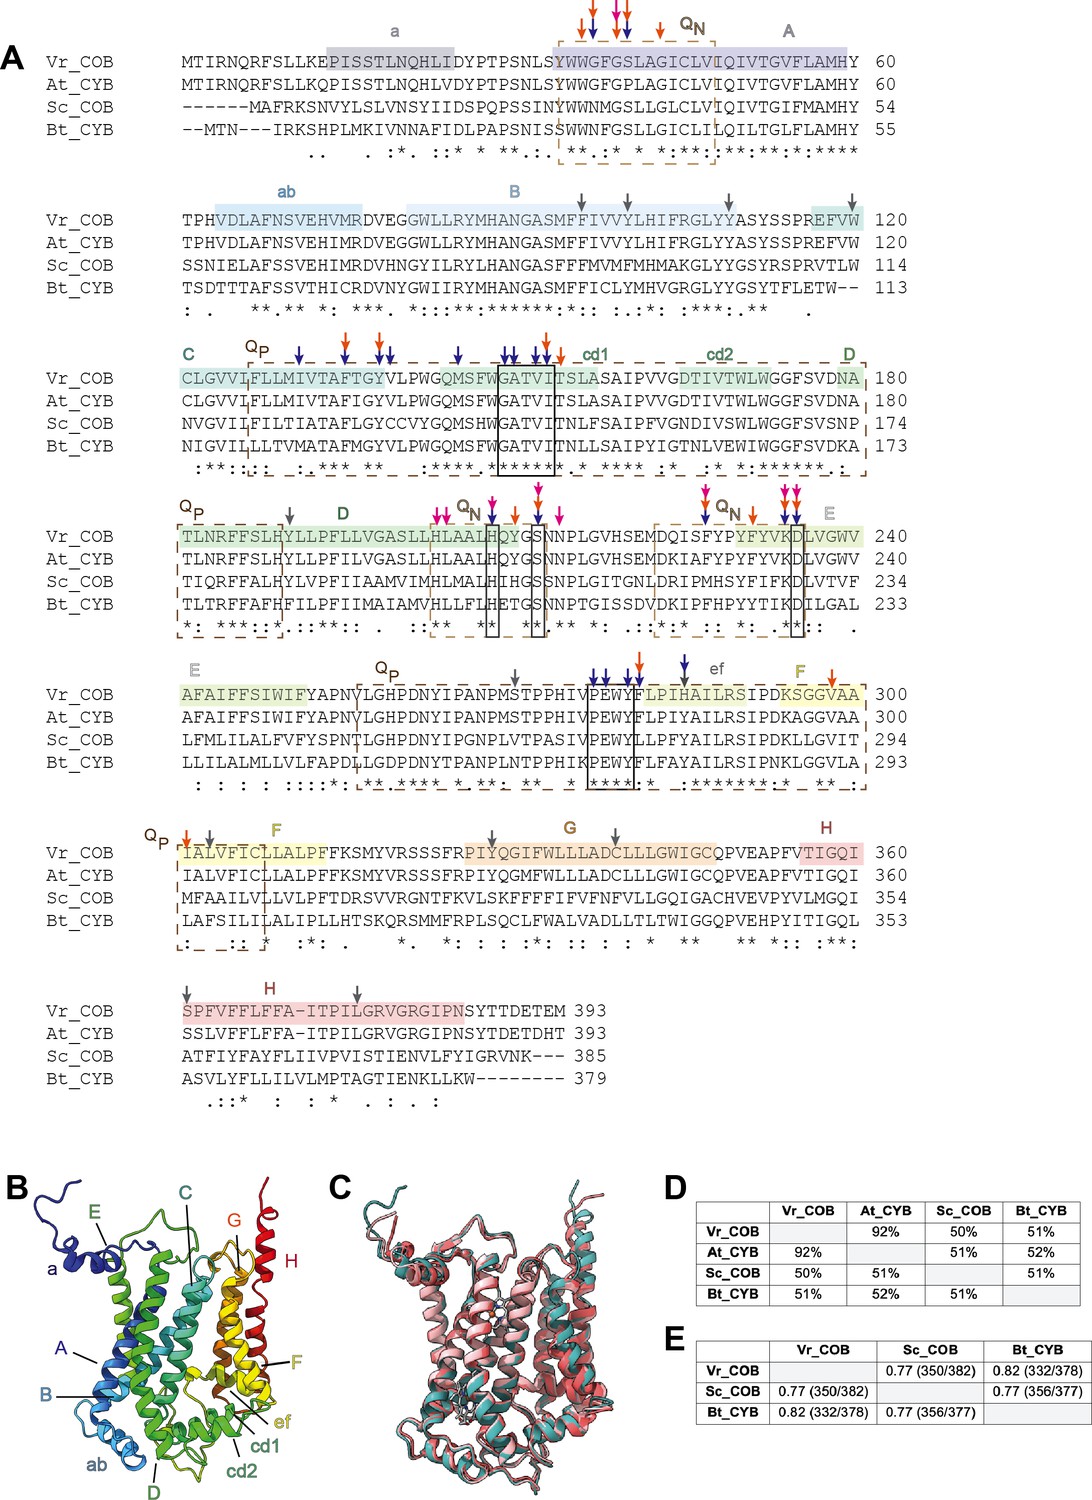
Comparison of the cyt b conserved subunit (COB) in V. radiata (Vr), S. cerevisiae (Sc), Arabidopsis thaliana (At) and B. taurus (Bt).
(A) Sequence alignment of COB performed in Clustal Omega. Secondary-structure elements are highlighted in a rainbow pattern (starting with dark blue in the N-terminus to red in the C-terminus) and labeled a-F. The general locations of the residues that compose the QN site (dashed tan lines) and QP site (dashed brown lines) are labeled. Residues that directly hydrogen-bond with ubiquinone in the bovine QN site, as well as the key residues in the cd1 helix and the PEWY motif, are marked in boxes (solid lines). Other key residues, as per their role in CIII2 of other organisms (Xia et al., 2013; Esser et al., 2004; Gao et al., 2003), are marked with arrows: blue for residues that establish H-bonds with inhibitors; orange for residues whose mutation confers resistance to inhibitors; magenta for residues whose mutation affects COB assembly or the re-oxidation of bh heme. V. radiata residues edited in our atomic model are marked with gray arrows. See also Supplementary file 1d for further detail on the RNA edits. Symbols underneath aligned residues: * fully conserved, : conservation between group of strongly similar properties, . conservation between group of weakly similar properties. (B) VrCOB shown in cartoon representation, colored in rainbow pattern with the secondary-structure elements labeled. (C) Superposition of COB subunits from V. radiata (teal), S. cerevisiae (dark pink, PDB 6HU9), B. taurus (light pink, PDB 1BGY) shown in cartoon representation. (D) Sequence identity percentages between COB subunits of the above organisms, calculated with the Clustal Omega alignment tool in Geneious. (E) Root mean square difference (RMSD) between pruned COB subunits of the above organisms, calculated in ChimeraX and shown in Å. Parentheses indicate the number of pruned atom pairs considered over the total number of atom pairs.
Figure 2—figure supplement 3
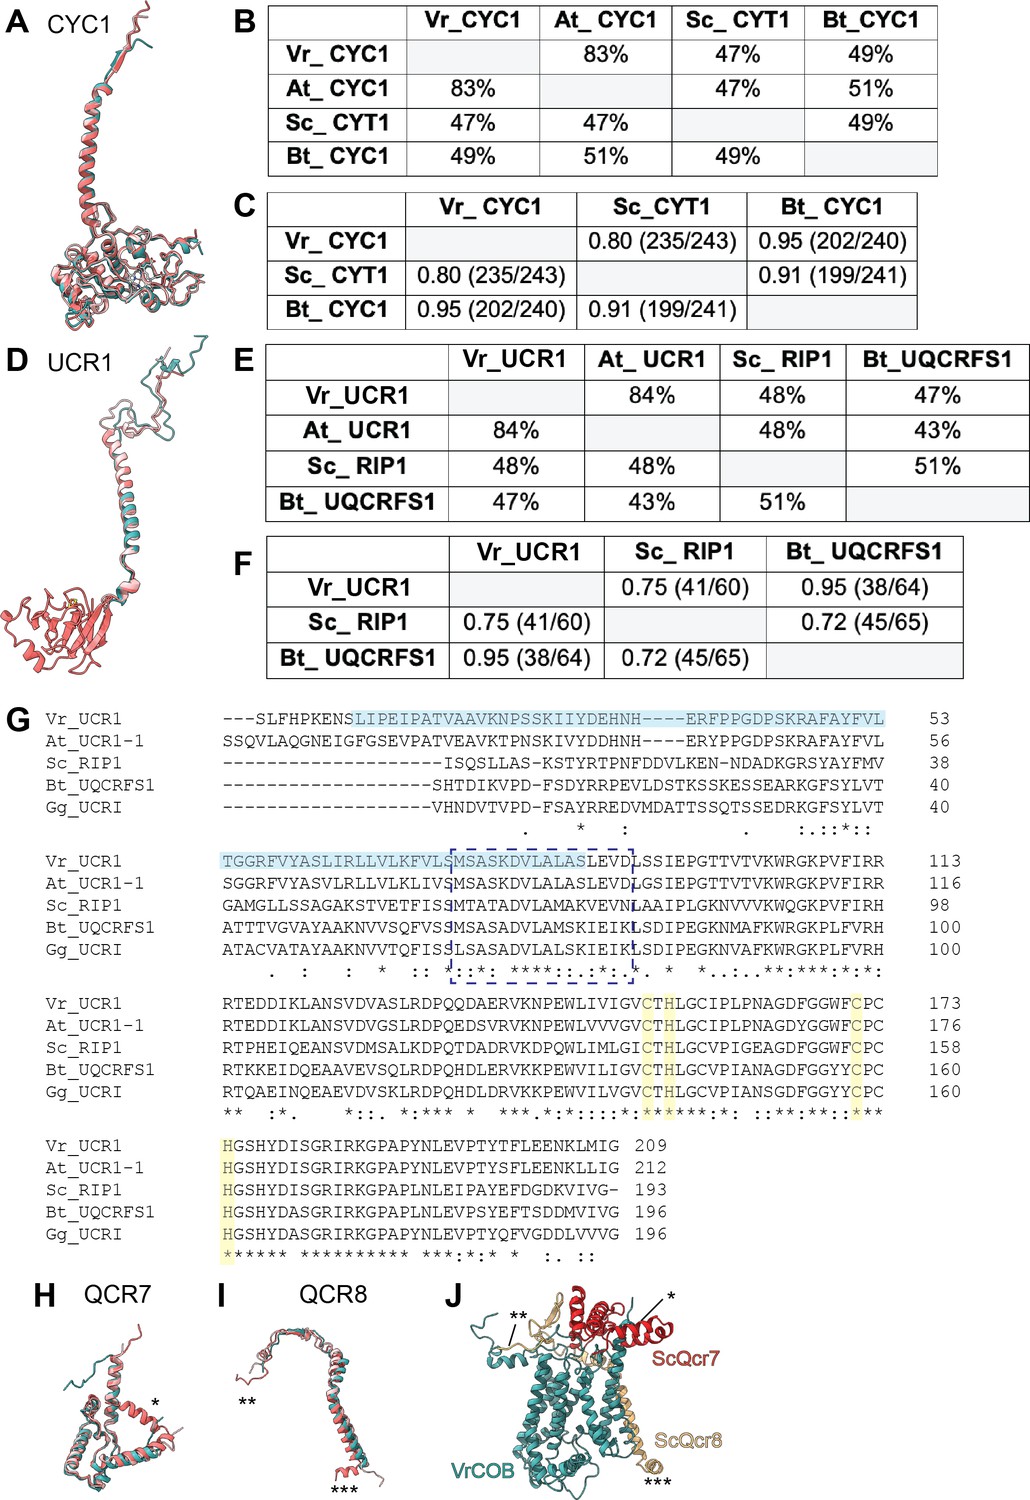
Comparison of select conserved and accessory subunits of CIII2 of V. radiata (Vr), S. cerevisiae (Sc), A. thaliana (At) and B. taurus (Bt).
(A,D) Superposition of cyt c1 (CYC1) (A) and Rieske iron-sulfur protein (UCR1) (D) subunits from V. radiata (teal), S. cerevisiae (dark pink, PDB 6HU9), B. taurus (light pink, PDB 1BGY). (B,E) Sequence identity percentages between CYC1 (B) and UCR1 (E) subunits of the above organisms, calculated with the Clustal Omega alignment tool in Geneious. Mitochondrial import pre-sequences were not taken into account for the calculation. (C,F) Root mean square difference (RMSD) between pruned CYC1 (C) and UCR1 (F) subunits of the above organisms, calculated in ChimeraX and shown in Å. Parentheses indicate the number of pruned atom pairs considered over the total number of atom pairs. Note that the RMSD calculations in (F) do not include the head domain of VrUCR1 or Bt_UQCRFS1, as these structures do not contain atomic models for this domain. (G) Sequence alignment of UCR1 subunit (without cleaved pre-sequences) of the above organisms, with the addition of Gallus gallus (Gg), performed with Clustal Omega. Solid light blue box highlights the V. radiata residues in our atomic model. Dashed blue rectangle indicates the hinge region. The rest of the sequence corresponds to the head domain. Residues that coordinate the FeS cluster are highlighted in yellow. Symbols underneath aligned residues: * fully conserved,: conservation between group of strongly similar properties,. conservation between group of weakly similar properties. (H-I) Superposition of QCR7 (H) and QCR8 (I) from V. radiata (teal), S. cerevisiae (dark pink; PDB: 6HU9) and B. taurus (light pink; PDB: 5B1A). Subunits were aligned with the corresponding Vigna radiata subunit. Subunit names correspond to V. radiata (see also Supplementary file 1c). Asterisks (*) mark the structural features present in ScQcr7 and ScQcr8 that are missing in the V. radiata and B. taurus, as discussed in the text. (J) Superposition of VrCOB (teal) with QCR7 (red) and QCR8 (yellow) from S. cerevisiae, aligned by the COB subunits. Asterisks correspond to the features in (I).
Figure 3 with 2 supplements

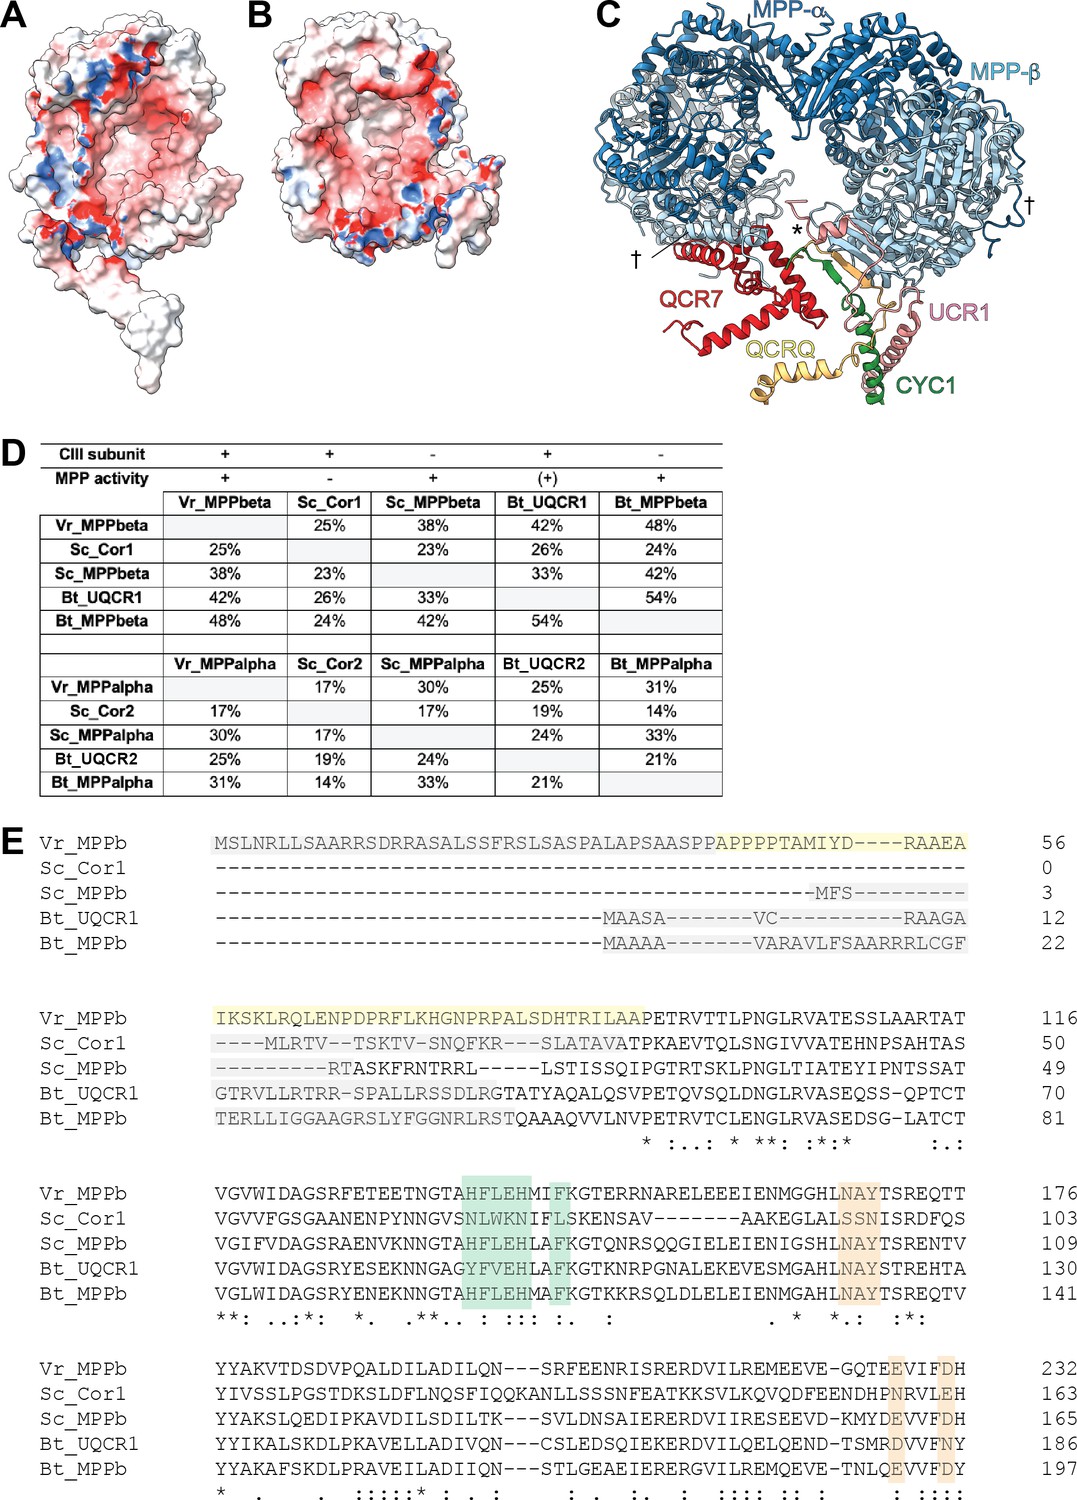
V. radiata’s CIII2 mitochondrial processing peptidase (MPP) domain has a conserved architecture and active site but contains plant-specific secondary-structure elements not seen in other CIII-MPP subunits or in soluble MPP.
(A) Ribbon representation of the VrMPP-α (blue) and VrMPP-β (light blue) looking into the central cavity. Dashed rectangle indicates the location of the active site, detailed in (B). (B) MPP-β active site [rotated 90° about vertical axis with respect to (A)]. Shown in stick representation are the Zn-coordinating residues (His137, His141, Glu217), the catalytic water-activating residue (Glu140) and conserved, putative substrate-recognition residues (Phe144, Glu227, Asp231, Asn167, Tyr169). Residue Ala168 is also conserved, but not visible in this orientation. (C–D) Superposition of V. radiata and S. cerevisiae CIII2 MPP domain subunits. VrMPP-α and -β’s structural elements not present in ScCor2 and ScCor1 are marked. Structural elements that are additionally not present in yeast soluble MPP, i.e. plant-specific features, are marked with a cross (†). (D) VrMPP-α (blue) and ScCor2 (dark pink). (D) VrMPP-β (light blue) and ScCor1 (dark pink). β, β−strand; α, α-helix; N-ter, N-terminus. See also Figure 3—figure supplements 1–2 for further details. S. cerevisiae structures from PDB: 6HU9.
Figure 3—figure supplement 1
Further characterization of VrMPP subunits and their homologs.
(A-B) Electrostatic potential of surface of VrMPP-β (A) and VrMPP-α (B). Electrostatic potential was calculated using Delphi (Li et al., 2012; Li et al., 2019), with standard parameters. Red, negative; white, neutral; blue, positive. (C) VrMPP-β-anchoring interactions. The main anchor is marked with an asterisk (*) and comprises the β-sheet with strands from VrMPP-β, VrCYC1 and VrQCRC, as well as further interactions with the VrUCR1 N-terminus and helix from VrQCR7. The plant-specific interactions joining one MPPα/β dimer to the other (N-termini of VrMPP-α and VrMPP-β) are marked with a cross (†). (D) Sequence identity percentages between MPP-β and MPP-α homologs both CIII2 subunits and soluble MPP in V. radiata (Vr), S. cerevisiae (Sc) and B. taurus (Bt). MPP subunits that are part of CIII and that possess expected MPP enzymatic activity are marked with a plus symbol (MPP activity could not be confirmed for our isolated sample—see main text). A plus symbol in parenthesis indicates that BtUQCR1/2 only have known enzymatic MPP activity towards one substrate. Sequence identity percentages were calculated using the Clustal Omega multiple alignment tool in Geneious. (E) Protein sequence alignment of VrMPP-β subunit (VrMPPb) and its CIII2 and soluble MPP homologs from (D) were aligned with Clustal Omega. For space, only the first ~200 residues of each sequence are shown. Key residues and sequences are highlighted as follows. Green: catalytic residues; orange: substrate-recognition residues; gray: cleaved import sequence (as per Uniprot entry and/or existing structure); yellow: VrMPP-β’s N terminal extension. Symbols underneath aligned residues: * fully conserved, : conservation between group of strongly similar properties, . conservation between group of weakly similar properties.
Figure 3—figure supplement 2

Alignment of MPP-α homologs.
(A) Protein sequences of V. radiata‘s MPP-α subunit (VrMPPa), S. cerevisiae (Sc) and B. taurus (Bt) CIII2 (Cor2, UQCR2) and soluble MPP (MPPa) subunits were aligned with Clustal Omega. Key residues and sequences are highlighted as follows: gray for cleaved import pre-sequence (as per Uniprot entry and/or existing structure); yellow for VrMPP-α’s N terminal extension; green for substrate binding/release glycine-rich loop; blue for elements missing in ScCor2; orange for VrMPP-α’s plant-specific additional secondary-structure elements. Symbols underneath aligned residues: * fully conserved, : conservation between group of strongly similar properties, . conservation between group of weakly similar properties. (B) Summary of differences in structural features of VrMPP-α and its homologs from (A), with the same color coding. Plus symbols (+) indicate the presence of the structural element (residue numbers in parenthesis), obtained from inspection of the structures. MPP subunits that are part of CIII and that possess expected MPP enzymatic activity are marked with a plus symbol (MPP activity could not be confirmed for our isolated sample—see main text). PDB codes of structures used: 1HR6 (ScMPP-α), 6HU9 (ScCor2), 1BGY (BtUQCR2). N.a. indicates that the BtMPP-α structure is not available and thus the comparison could not be made.
Figure 4
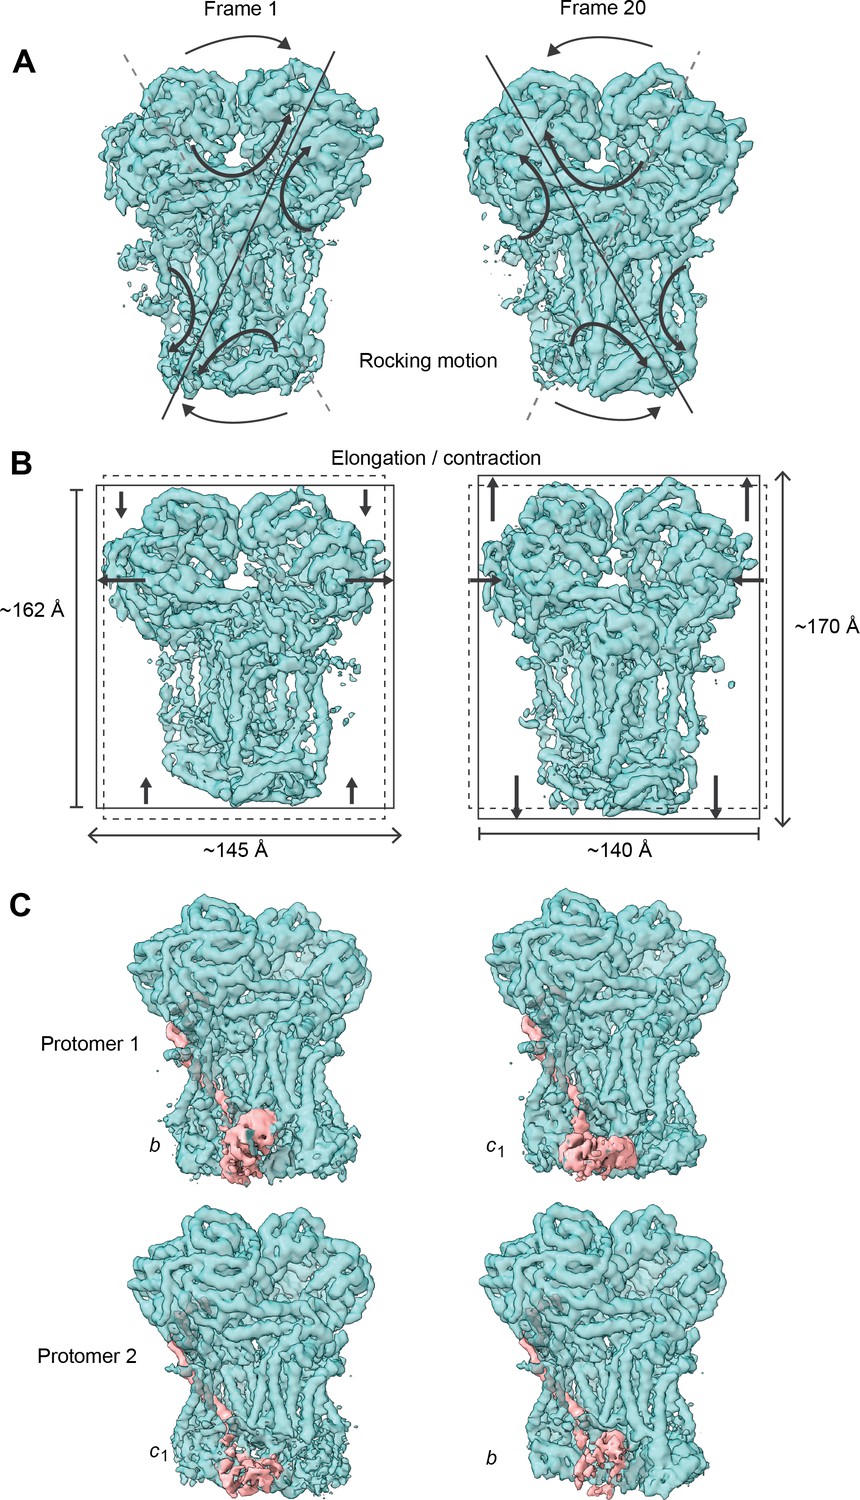
Conformational heterogeneity analysis of V. radiata CIII2 reveals complex-wide, coordinated movements and shows the swinging motion of UCR1 in the absence of substrates or inhibitors.
(A–B) CIII2-wide motions revealed by principal component 2 (A) and 3 (B). Frame 1 (left) and frame 20 (right) of the continuous motion of CIII2 (teal surface) are shown. Black arrows indicate the motion. (A) Rocking motion of CIII2. Solid lines indicate the main axis of the rocking. Dashed lines indicate the axis of the other frame for comparison. (B) Elongation and contraction of CIII2 in the vertical and horizontal directions. Solid rectangles indicate the edges of the complex in that frame. Dashed rectangles indicate the edges of the complex in the other frame, for comparison. The dimensions of the rectangle sides are given in Å. (C) Frame 1 (left) and frame 20 (right) of the continuous motion of the UCR1 head domain shown for CIII2 protomer 1 (top) and protomer 2 (bottom). The density corresponding to UCR1 is shown in pink. The position of the UCR1 head domain is indicated by b (proximal) or c1 (distal). Note that, when protomer one is in the b position, protomer two is in the c1 position and vice versa. See Videos 6–9 for the motion of all components.
Figure 5 with 1 supplement
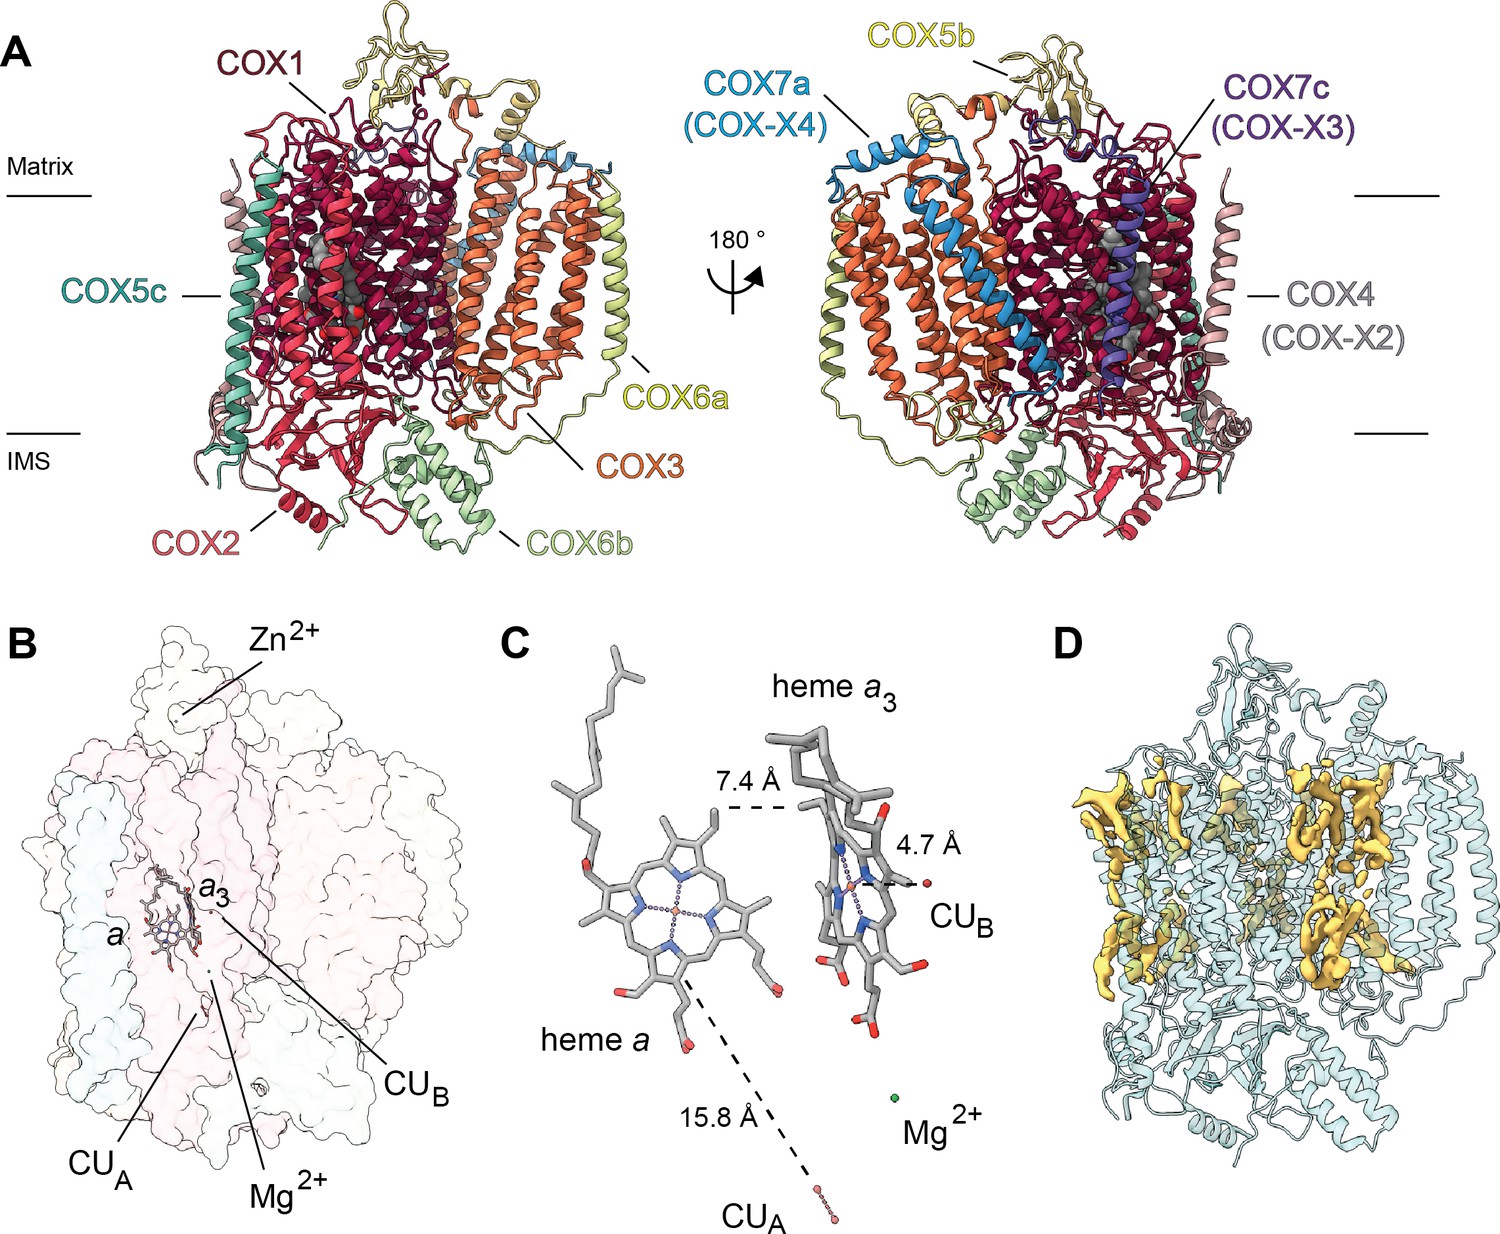
Overview of V. radiata CIV and its co-factors.
(A) CIV in cartoon representation colored by subunit with co-factors in sphere representation colored by atom. The position of the inner mitochondrial membrane is indicated with black lines, and matrix and inter-membrane space (IMS) are labeled. Names of the subunits previously believed to be plant-specific are given in parentheses. (B) Position of the observed CIV co-factors. CIV shown in transparent surface representation, cofactors in stick representation. (C) Edge-to-edge distances between the heme groups and the copper co-factors are shown. The co-factors are rotated 20 degrees relative to (B) for clarity. (E) Density consistent with lipids (yellow) is shown overlaid on the CIV cartoon model (transparent teal). a, heme a; a3, heme a3.
Figure 5—figure supplement 1
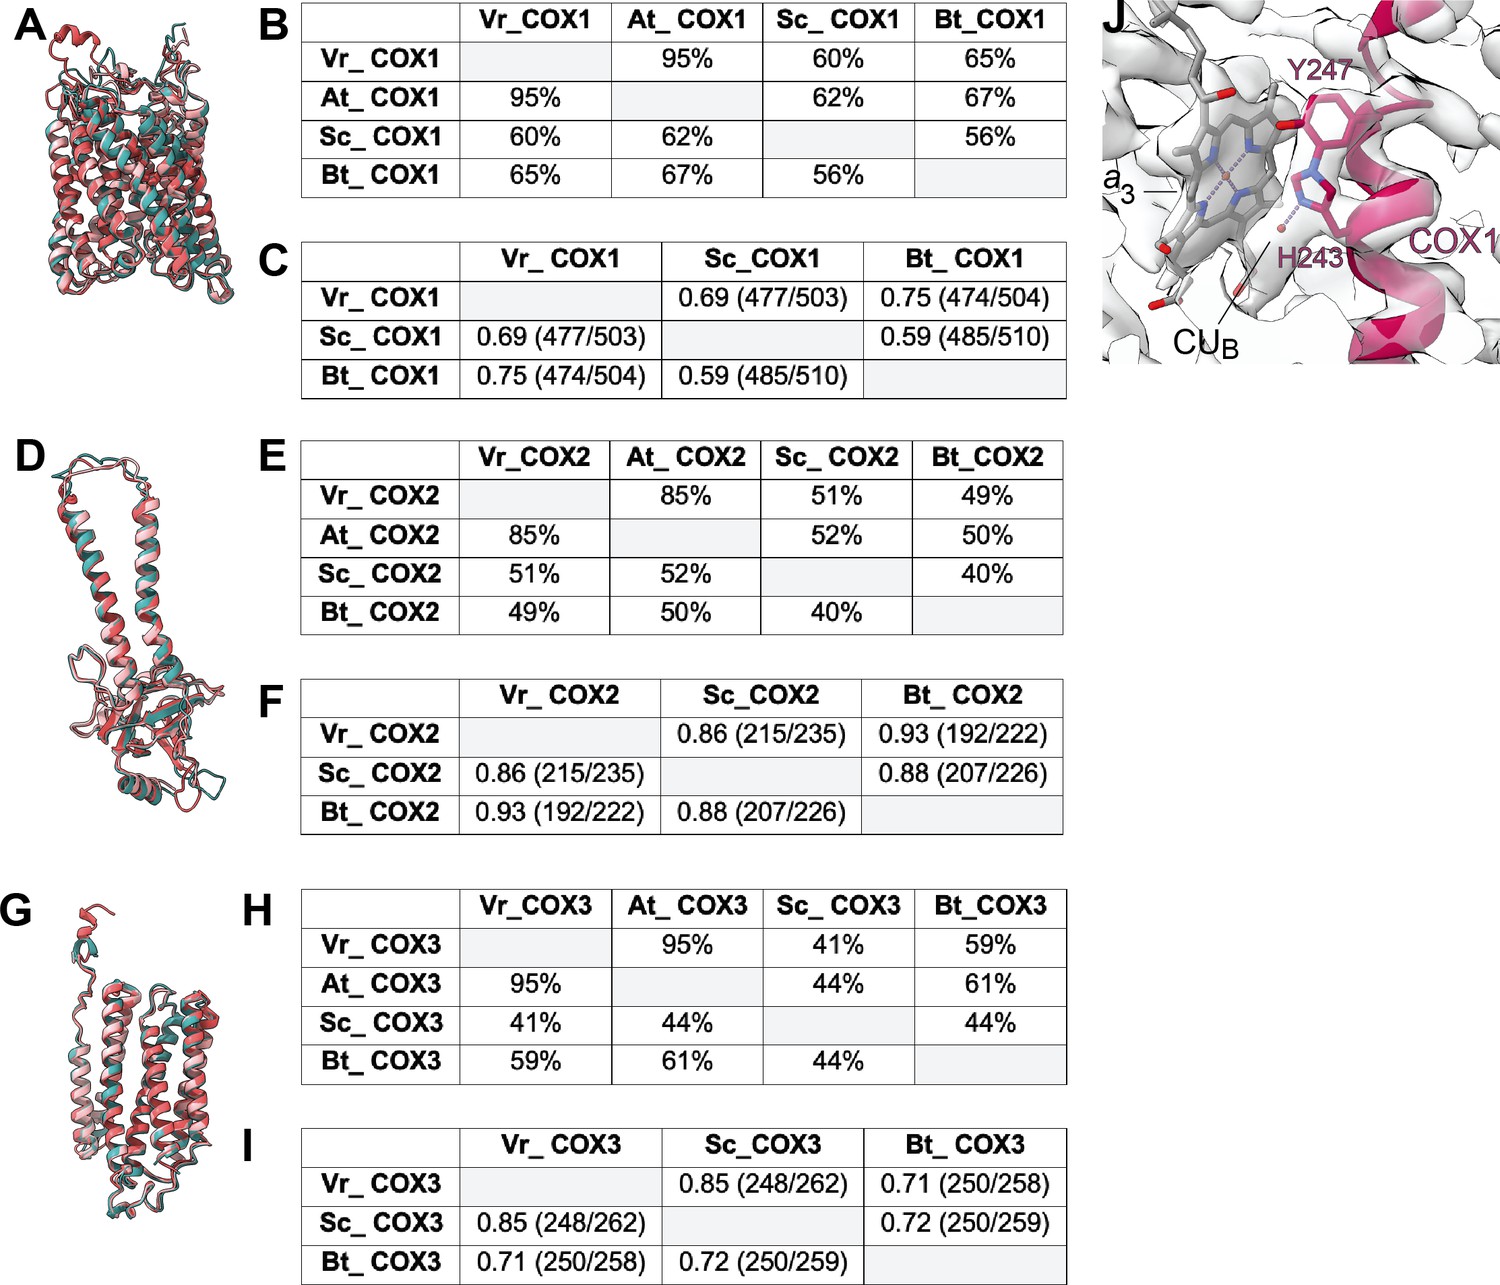
Comparison of the COX1-3 subunits in V. radiata (Vr), S. cerevisiae (Sc), A. thaliana (At) and B. taurus (Bt).
(A,D,G) Superposition of COX1 (A), COX2 (D) and COX3 (G) subunits from V. radiata (teal), S. cerevisiae (dark pink, PDB 6HU9), B. taurus (light pink, PDB 5B1A). (B,E,H) Sequence identity percentages between COX1 (B), COX2 (E) and COX3 (H) subunits of the above organisms, calculated with the Clustal Omega alignment tool in Geneious software. (C,F,I) Root mean square difference (RMSD) between pruned COX1 (C), COX2 (F) and COX3 (I) subunits of the above organisms, calculated in ChimeraX and shown in Å. Parentheses indicate the number of pruned atom pairs considered over the total number of atom pairs. (J) HPEVY ring of VrCOX1. VrCOX1 helix shown in cartoon representation, with the covalent ring between Nε-His243 and Cε-Tyr247 shown in stick. Density shown as transparent surface. Heme a3 (a3) and CUB of the dinuclear center shown as stick.
Figure 6 with 1 supplement
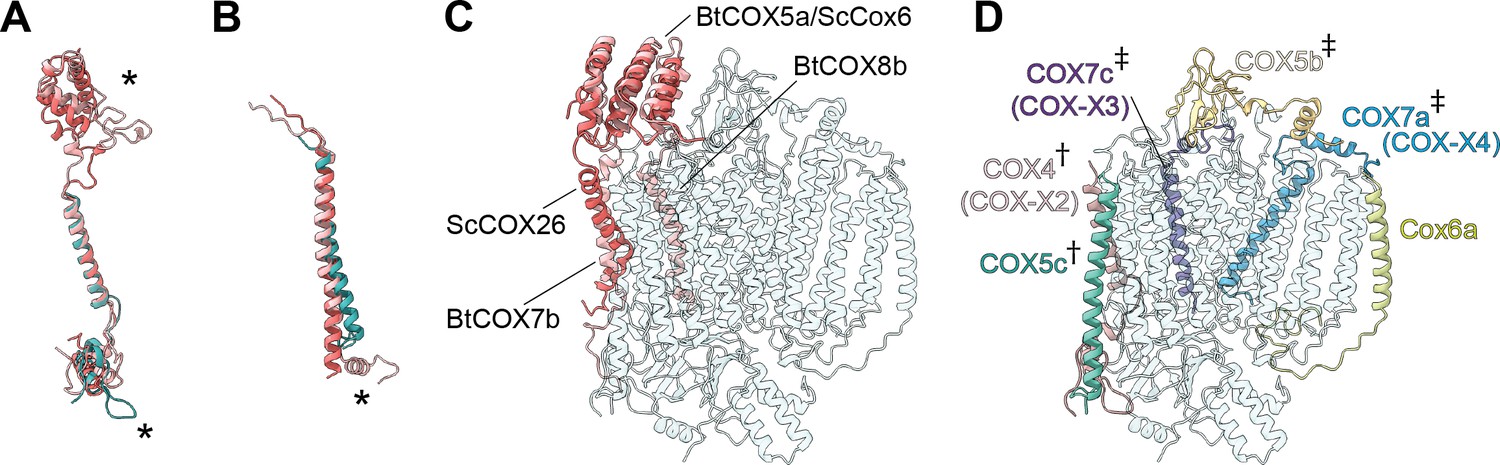
Subunit differences in V. radiata CIV.
(A–C) Superposition of subunits of V. radiata (Vr, teal), S. cerevisiae (Sc, dark pink; PDB: 6HU9) and B. taurus (Bt, light pink; PDB: 5B1A) CIV. Subunits were aligned with the corresponding V. radiata subunit. Asterisks mark the differences discussed in the text. Names of the subunits previously believed to be plant-specific are given in parentheses. (A) Superposition of VrCOX4 (COX-X2), ScCox5a, BtCOX4. (B) Superposition of VrCOX5c, ScCox9, BtCOX6c. (C) Superposition of the yeast and bovine CIV subunits that do not have homologs in V. radiata, onto the V. radiata CIV model (transparent teal). Alignment by COX1 subunits. (D) Location of the V. radiata accessory subunits that show notable differences with their yeast/bovine homologs. Subunits that form the supercomplex interface in V. radiata are marked with (†). Subunits whose homologs form the supercomplex interface in the B. taurus respirasome are marked with (‡).
Figure 6—figure supplement 1
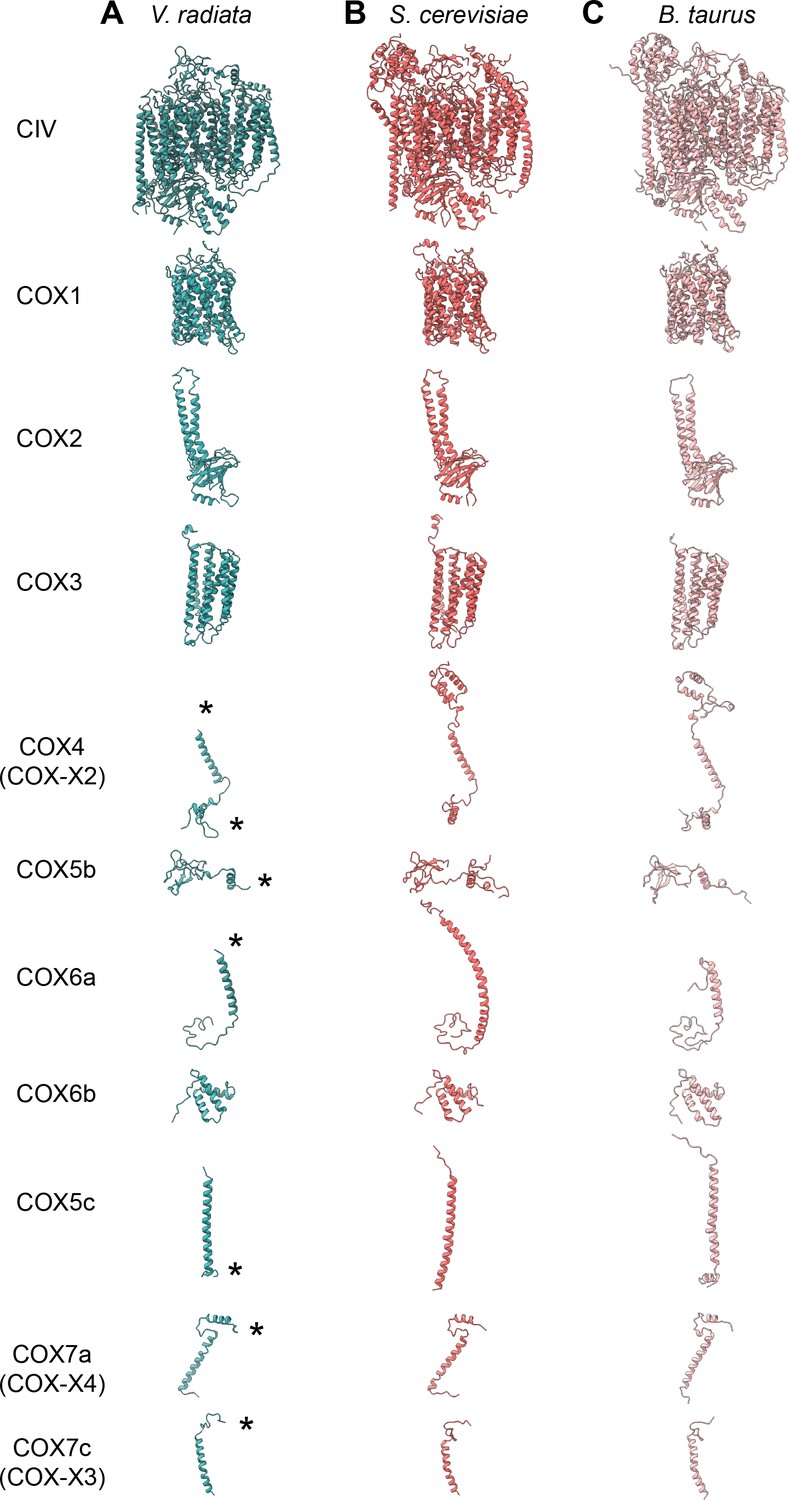
CIV subunit comparison.
(A-C) CIV subunits are shown for (A) V. radiata (this work), (B) S. cerevisiae (PDB: 6HU9) and (C) B. taurus (PDB: 5B1A). Yeast and bovine subunits were independently aligned with the corresponding V. radiata subunit. The orientation of each subunit corresponds to the orientation on CIV in the top row. Only the modelled residues are shown. Differences discussed in the text are labeled with an asterisk (*).
Figure 7 with 1 supplement
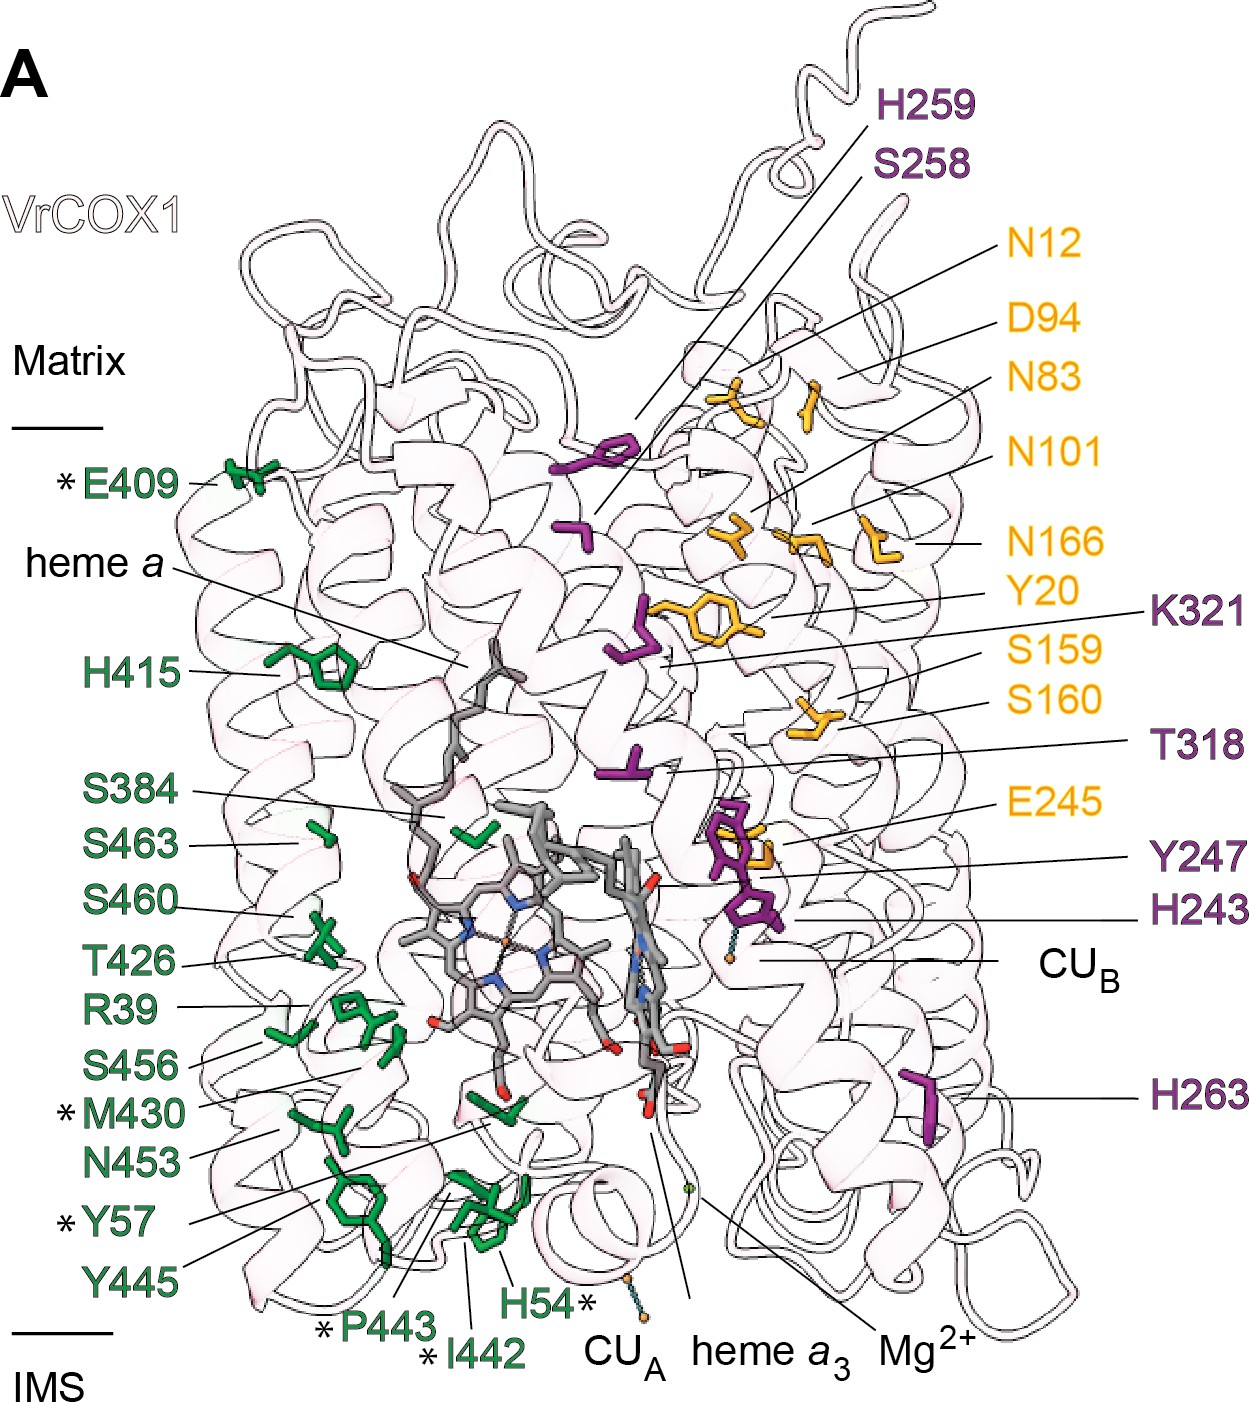
Proton transfer pathways of V. radiata CIV.
VrCOX1 (transparent ribbon), co-factors (stick) and key residues (colored stick) are shown for the D channel (yellow), K channel (purple) and H channel (green). Proton-channel residues that are mutated in V. radiata with respect to B. taurus are marked with an asterisk (*). Approximate position of matrix and IMS ends of the transmembrane region are shown.
Figure 7—figure supplement 1
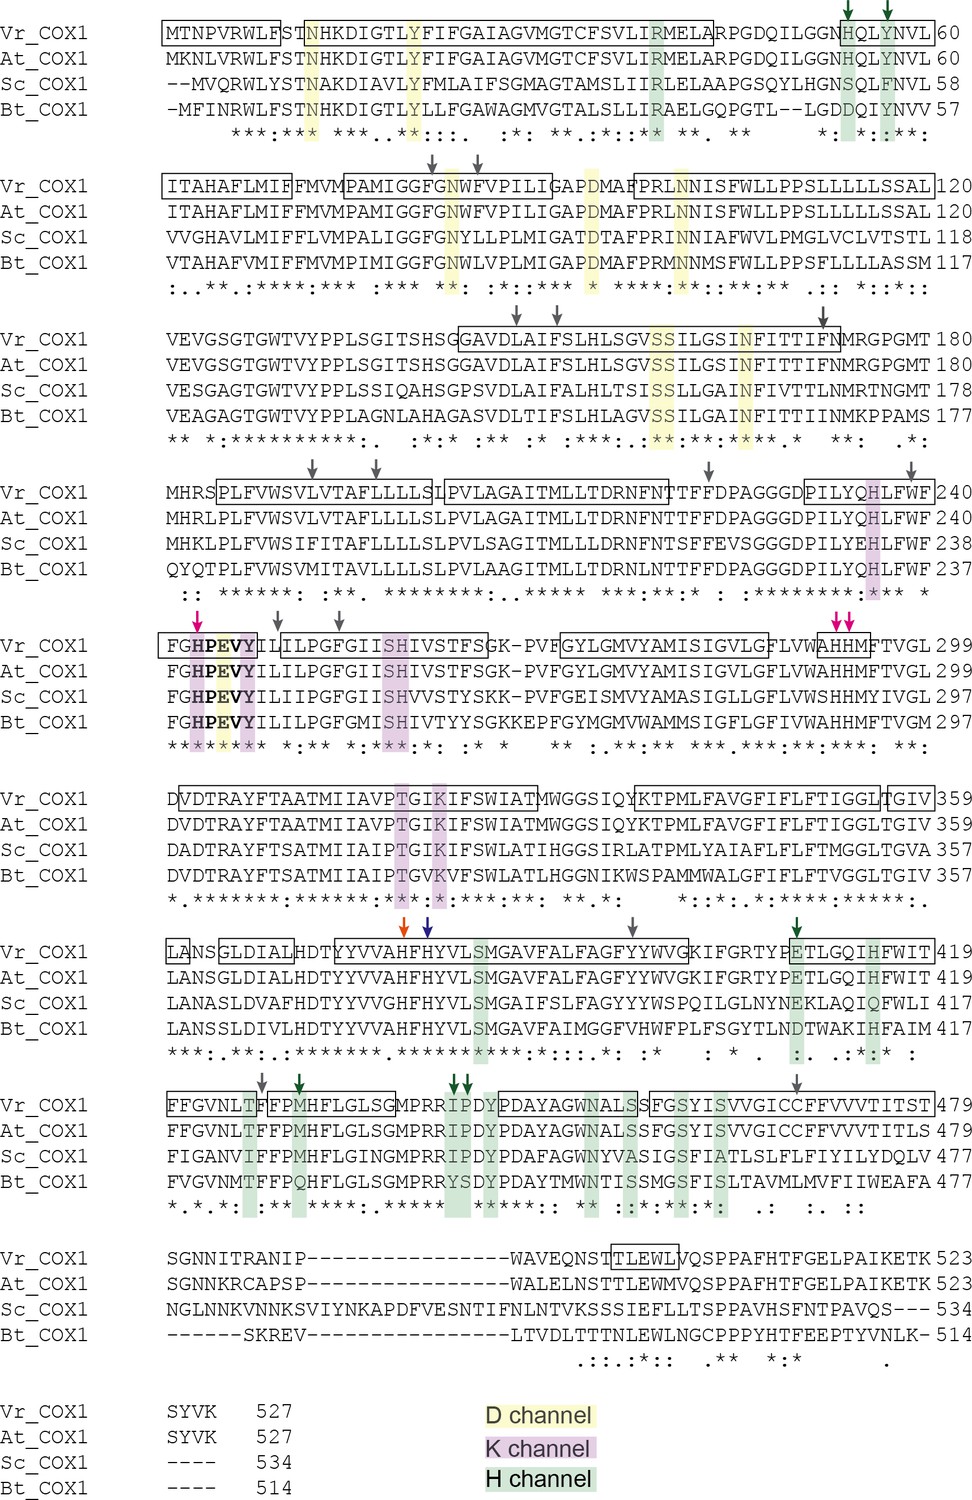
Sequence alignment of COX1 highlighting the H, D and K channels.
COX1 sequences from V. radiata (Vr), Arabidopsis thaliana (At), S. cerevisiae (Sc), and B. taurus (Bt) were aligned with Clustal Omega. Proton pathway residues are highlighted: D channel in yellow, H channel in green and K channel in purple. Proton-channel residues that differ between V. radiata and B. taurus are marked with an arrow of the same color as the channel to which the residue belongs. Boxes indicate α-helices in the VrCOX1 atomic model. Key residues are marked with arrows: heme a-coordinating residues in blue, heme a3-coordinating residues in orange, CUB-coordinating residues in magenta. RNA-editing sites are marked with gray arrows, see also Supplementary file 1d. The HPEVY ring is bolded. Symbols underneath aligned residues: * fully conserved, : conservation between group of strongly similar properties, . conservation between group of weakly similar properties.
Figure 8 with 1 supplement
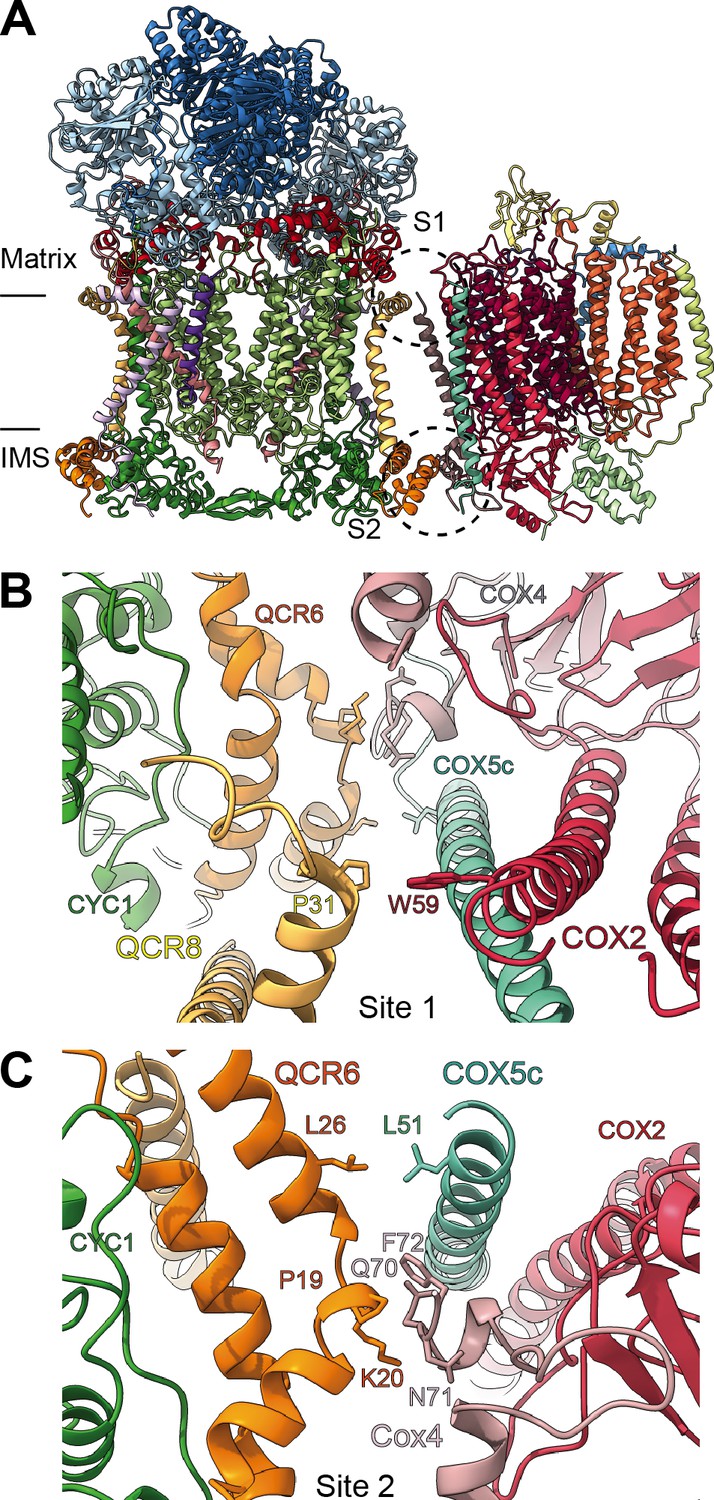
SCIII2+IV interface in V. radiata.
(A) General orientation of SC III2+IV in ribbon representation viewed from the membrane. Approximate position of the inner mitochondrial membrane is shown. Sites 1 (S1) and 2 (site 2) of the supercomplex interface are marked in dashed circles. (B) Detailed view of the protein-protein interaction in site 1 (Pro31 of VrQCR8 and Trp59 of VrCOX2) with the interacting atoms shown in stick representation. Note that interacting residues of site two appear in stick in the background. (C) Detailed view of the protein-protein interaction in site 2 (Pro19-Lys20 of QCR6, Gln70-Phe72 of COX4, Leu26 of QCR6, Leu51 of COX5c) with the interacting atoms shown in stick representation.
Figure 8—figure supplement 1
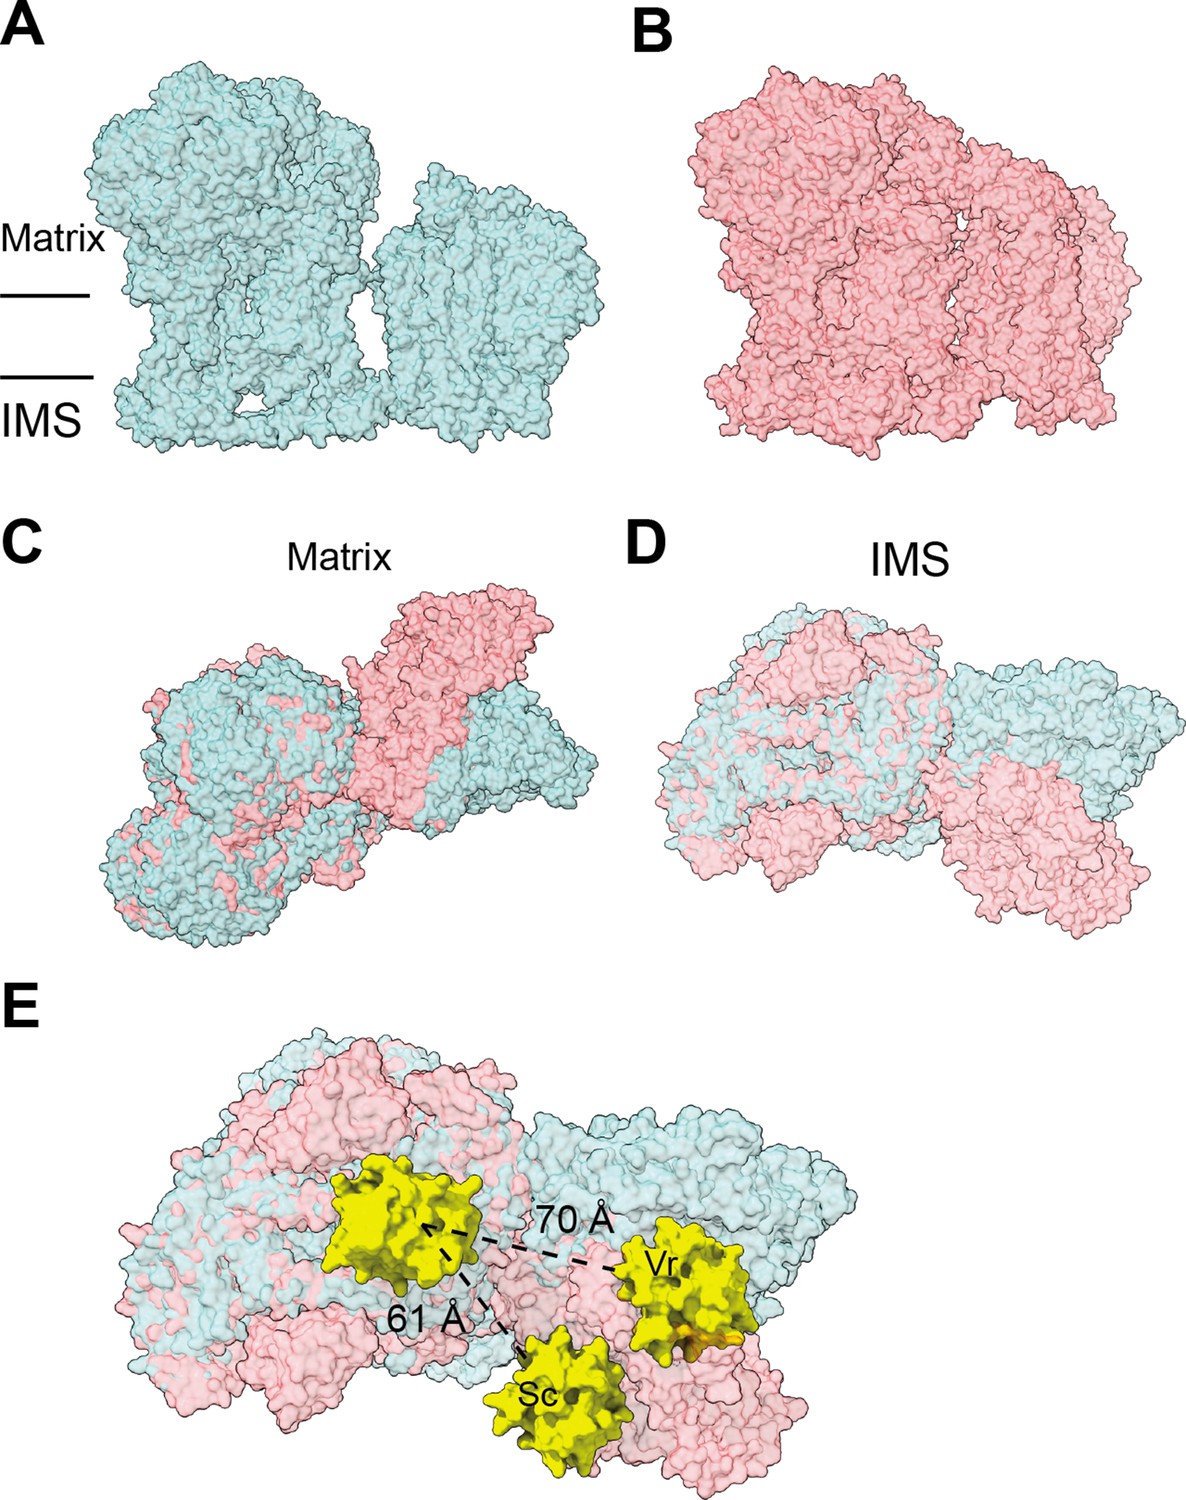
Differences in SC III2+IV interactions between V. radiata and S. cerevisiae (PDB: 6HU9).
The supercomplexes are aligned by V. radiata’s COB and CYC1 and shown in surface representation. (A-B) V. radiata (A) and S. cerevisiae (B) SC III2+IV viewed from the membrane. (C-D) Superposed V. radiata (green) and S. cerevisiae (pink) viewed from the matrix (C) or the intermembrane space, IMS (D). (E) Cyt c (yellow) docked onto CIII2 and CIV in superposed V. radiata (green) or S. cerevisiae (pink) SC III2+IV viewed from the IMS. Distance between the CIII2- and CIV-bound cyt c in the V. radiata (Vr) and S. cerevisiae (Sc) supercomplexes shown. Cyt c was docked based on the S. cerevisiae CIII2-bound cyt c (1KYO) and the bovine CIV-bound cyt c (5IY5). CIII2-bound cyt c was docked onto V. radiata CIII2 by aligning CYC1. CIV-bound cyt c was docked onto V. radiata and S. cerevisiae CIV by aligning COX2. Distance was measured edge-to-edge of the heme conjugated ring systems.
Videos
Video 1
CryoEM density map and model for V. radiata CIII2.
Video 2
CryoEM density map and model for V. radiata CIV.
Video 3
CryoEM density map and model for V. radiata SC III2+IV.
Video 4
Superposition of V. radiata MPP-β with S. cerevisiae Cor1 (6HU9) and soluble MPP-β (1HR6).
Video 5
Superposition of V. radiata MPP-α with S. cerevisiae Cor2 (6HU9) and soluble MPP-α (1HR6).
Video 6
3D variability analysis of V. radiata CIII2, component 0.
The 3DVA volumes are shown as a continuous movie. CIII2 in teal, QCR10 in dark purple.
Video 7
3D variability analysis of V. radiata CIII2, component 1.
The 3DVA volumes are shown as a continuous movie. CIII2 in teal, QCR9 in lilac, QCR10 in dark purple.
Video 8
3D variability analysis of V. radiata CIII2, component 2.
The 3DVA volumes are shown as a continuous movie. CIII2 in teal.
Video 9
3D variability analysis of V. radiata CIII2, component 3.
The 3DVA volumes are shown as a continuous movie. CIII2 in teal.
Video 10
Swinging motion of the V. radiata UCR1 head domains.
The 3DVA volumes are shown as a continuous movie. A V. radiata UCR1 head-domain homology model was rigid-body fit into the 3DVA volume.
Tables
Table 1
Cryo-EM data collection, reconstruction, model refinement and validation statistics.
| Data Collection and processing | ||||||||
|---|---|---|---|---|---|---|---|---|
| Microscope | Titan krios (UCSF) | |||||||
| Camera | K3 detector equipped with GIF | |||||||
| Magnification | 60,010 | |||||||
| Voltage (kV) | 300 kV | |||||||
| Electron exposure (e-/Å2) | 51 | |||||||
| Defocus range (µm) | −0.5 to −2.0 | |||||||
| Pixel size (Å) | 0.8332 | |||||||
| Software | SerialEM | |||||||
| Reconstruction | CIII2 | SCIII2+IV | CIII2 focused | CIV-focused | SC Composite | |||
| Software | cryoSPARC | cryoSPARC | Relion | Relion | Phenix | |||
| Number of particles | 48,111 | 28,020 | 38,410 | 29,348 | --- | |||
| Box size (pixels) | 512 | 512 | 512 | 512 | 512 | |||
| Final resolution (Å) | 3.2 | 3.8 | 3.7 | 3.8 | --- | |||
| Map sharpening B factor (Å2) | 67 | 61 | 83 | 77 | --- | |||
| EMDB ID | 22445 | 22449 | 22450 | 22447 | 22448 | |||
| Model | CIII2 | CIV | SC composite | |||||
| Software | Phenix | |||||||
| Initial model (PDB code) | 6Q9E, 6HU9 | 6HU9, 5B1A | 6Q9E, 6HU9, 5B1A | |||||
| Map/model correlation | ||||||||
| Model resolution (Å) | 3.3 | 3.9 | 3.9 | |||||
| d99 (Å) | 3.5 | 3.9 | 3.9 | |||||
| FSC model 0.5 (Å) | 3.3 | 3.8 | 3.8 | |||||
| Map CC (around atoms) | 0.88 | 0.85 | 0.84 | |||||
| Model composition | ||||||||
| Non-hydrogen atoms | 32,931 | 12,772 | 45,164 | |||||
| Protein residues | 3983 | 1497 | 5472 | |||||
| Number of chains | 20 | 10 | 30 | |||||
| Number of ligands and cofactors | 8 | 6 | 14 | |||||
| Number of lipids | 29 | 20 | 43 | |||||
| Atomic Displacement Parameters (ADP) | ||||||||
| Protein average (Å2) | 114.37 | 38.28 | 53.17 | |||||
| Ligand average (Å2) | 79.11 | 50.71 | 66.25 | |||||
| R.m.s. deviations | ||||||||
| Bond lengths (Å) | 0.005 | 0.006 | 0.007 | |||||
| Bond angles (°) | 0.704 | 0.853 | 1.107 | |||||
| Ramachandran Plot | ||||||||
| Favored (%) | 93.13 | 90.75 | 92.55 | |||||
| Allowed (%) | 6.82 | 9.18 | 7.40 | |||||
| Disallowed (%) | 0.05 | 0.07 | 0.06 | |||||
| Validation | ||||||||
| MolProbity score | 1.97 | 2.19 | 2.04 | |||||
| Clash score | 10.03 | 14.21 | 11.51 | |||||
| Rotamer outliers (%) | 0.03 | 0.08 | 0.04 | |||||
| EMRinger score | 2.80 | 2.32 | 2.01 | |||||
| PDB ID | 7JRG | 7JRO | 7JRP | |||||
Key resources table
| Reagent type (species) or resource | Designation | Source or reference | Identifiers | Additional information |
|---|---|---|---|---|
| Biological sample (Vigna radiata) | V. radiata seeds | Todd’s Tactical Group | TS-229 | Lot SMU2-8HR; DOB 2/25/2019 |
| Chemical compound, drug | Digitonin, high purity | EMD Millipore | 300410 | |
| Chemical compound, drug | A8-35 | Anatrace | A835 | |
| Chemical compound, drug | Gamma-cyclodextrin | EMD Millipore | C4892 | |
| Chemical compound, drug | Decylubiquinone | Santa Cruz Biotechnology | sc-358659 | |
| Chemical compound, drug | Equine cytochrome c | Sigma Aldrich | C2506 | |
| Software, algorithm | Clustal Omega | Madeira et al., 2019 | RRID:SCR_001591 | |
| Software, algorithm | Geneious | Kearse et al., 2012 | RRID:SCR_010519 | |
| Software, algorithm | SerialEM | University of Colorado, Schorb et al., 2019 | RRID:SCR_017293 | |
| Software, algorithm | RELION 3.0 | Zivanov et al., 2018 | RRID:SCR_016274 | |
| Software, algorithm | Motioncor2 | Zheng et al., 2017 | ||
| Software, algorithm | Ctffind4 | Rohou and Grigorieff, 2015 | RRID:SCR_016732 | |
| Software, algorithm | crYOLO | Wagner et al., 2019; Wagner and Raunser, 2020 | RRID:SCR_016732 | |
| Software, algorithm | Phyre2 | Kelley et al., 2015 | ||
| Software, algorithm | Coot | Emsley and Cowtan, 2004 | RRID:SCR_014222 | |
| Software, algorithm | PHENIX | Liebschner et al., 2019; Goddard et al., 2018; Pettersen et al., 2004 | RRID:SCR_014224 | |
| Software, algorithm | UCSF Chimera | Resource for Biocomputing, Visualization, and Informatics at the University of California, San Francisco, Pettersen et al., 2004 | RRID:SCR_004097 | |
| Software, algorithm | UCSF ChimeraX | Resource for Biocomputing, Visualization, and Informatics at the University of California, San Francisco, Goddard et al., 2018 | RRID:SCR_015872 | |
| Software, algorithm | PyMOL Molecular Graphics System | Schrödinger, LLC | RRID:SCR_000305 | Version 2.0 |
| Software, algorithm | Scaffold Proteome Software | Proteome Software Inc | RRID:SCR_014345 | Version 4.8.4 |
| Software, algorithm | X! Tandem | The GPM | Version Alanine (2017.2.1.4) | |
| Other | Holey carbon grids | Quantifoil | Q310CR1.3 | 1.2/1.3 300 mesh |
Additional files
-
Supplementary file 1
(a) Mass spectrometry identification of V. radiata CIII2 and CIV subunits. (b) Model-building statistics by subunit. (c) CIII2 and CIV subunit homologs in plants, yeast and mammals. V. radiata homologs were obtained by performing BLASTp searches of the Arabidopsis thaliana genes (Meyer et al., 2019). Mammalian and yeast homologs were obtained from Hartley et al., 2019; Maréchal et al., 2012. Additional BLASTp searches were performed as needed. (d) RNA edits identified in V. radiata CIII2 and CIV subunits. RNA-editing sites were initially identified by an unambiguous mismatch in the cryoEM density and the expected density for the mitochondrial-DNA-encoded residue. The existence of the RNA-editing site in other plants, or the implied restoration of the consensus sequence was then inspected. Amino-acid changes to the atomic model (with respect to the mt-DNA sequence) were only made for amino-acid positions that had unambiguous cryoEM density evidence and whose editing is conserved or would restore the conserved sequence.
- https://cdn.elifesciences.org/articles/62047/elife-62047-supp1-v1.docx
-
Transparent reporting form
- https://cdn.elifesciences.org/articles/62047/elife-62047-transrepform-v1.docx
Download links
A two-part list of links to download the article, or parts of the article, in various formats.
Downloads (link to download the article as PDF)
Open citations (links to open the citations from this article in various online reference manager services)
Cite this article (links to download the citations from this article in formats compatible with various reference manager tools)
Atomic structures of respiratory complex III2, complex IV, and supercomplex III2-IV from vascular plants
eLife 10:e62047.
https://doi.org/10.7554/eLife.62047


