Epidermal PAR-6 and PKC-3 are essential for larval development of C. elegans and organize non-centrosomal microtubules
- Division of Developmental Biology, Institute of Biodynamics and Biocomplexity, Department of Biology, Faculty of Science, Utrecht University, Netherlands
Figures
Figure 1 with 1 supplement
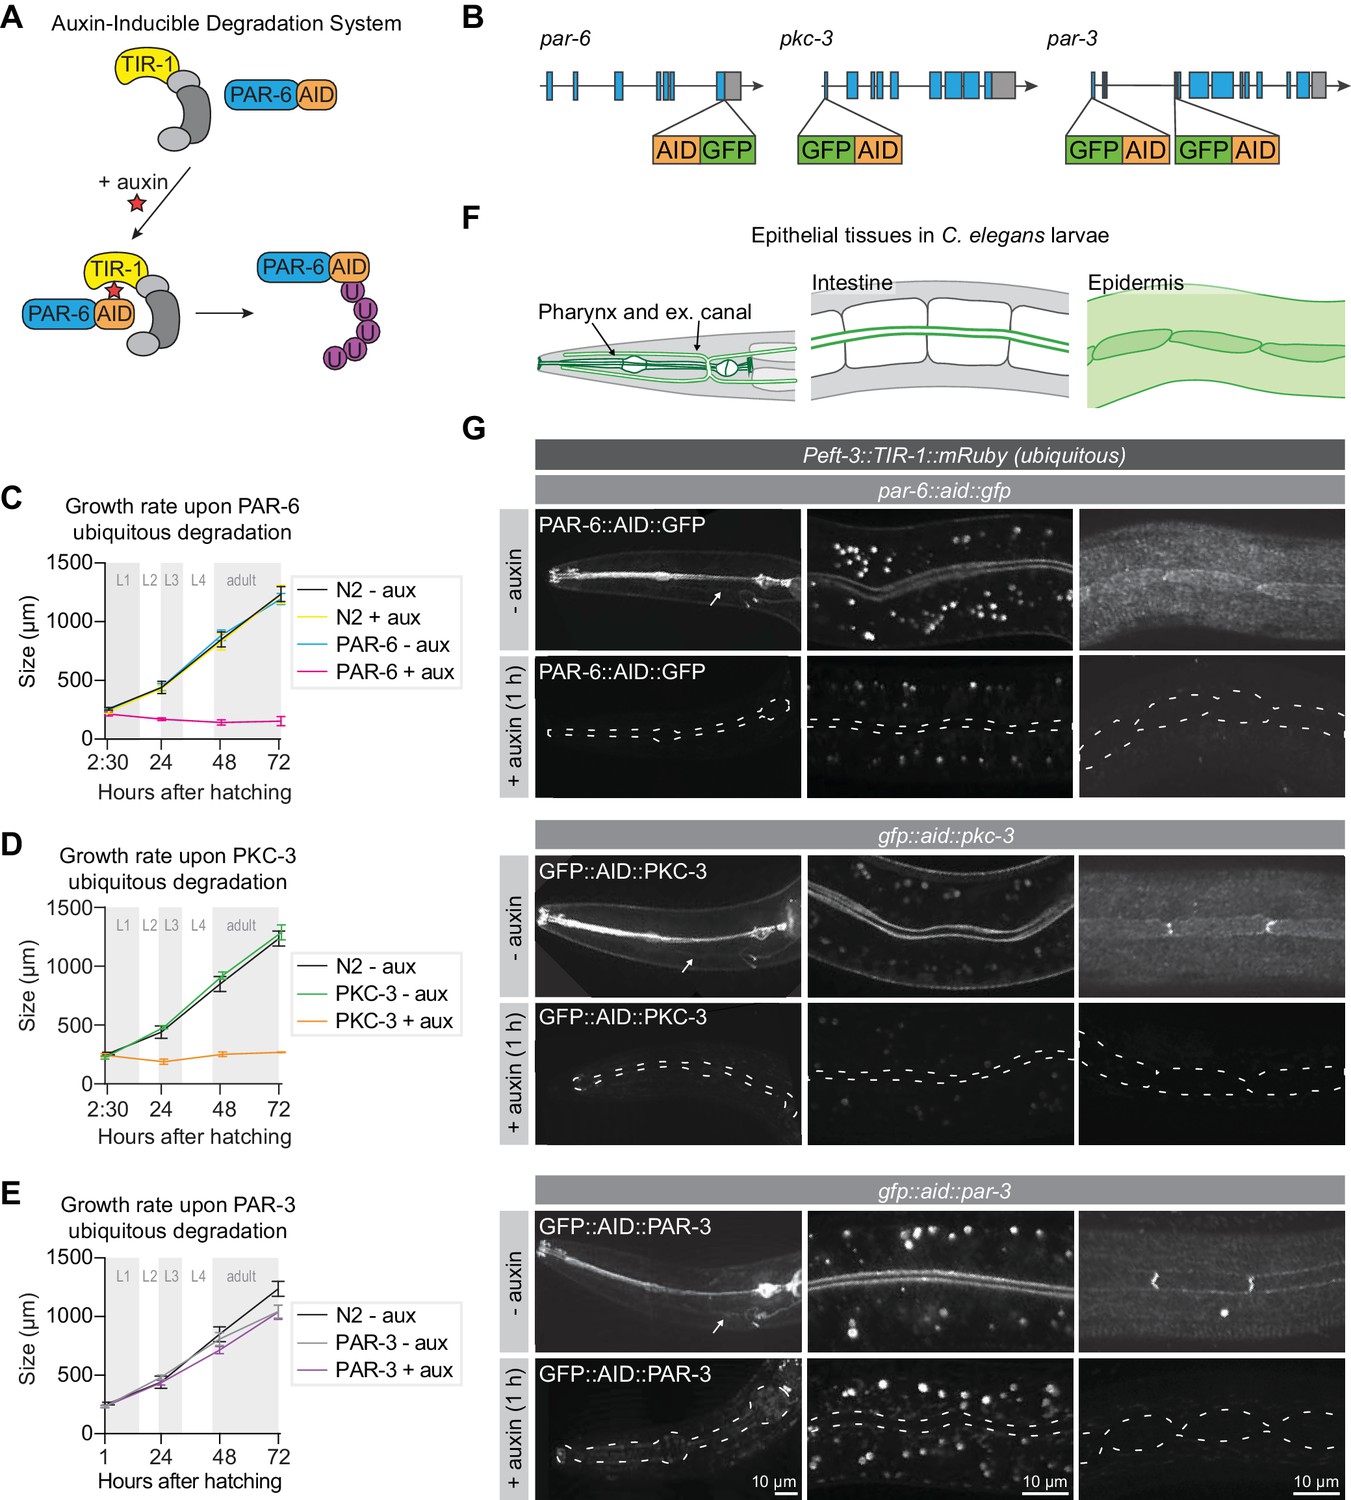
PAR-6 and PKC-3 are essential for larval development.
(A) Overview of the AID system, which enables targeted degradation of AID-tagged proteins by the plant-derived E3 ubiquitin ligase specificity factor TIR1 upon addition of auxin. (B) Schematic representation of endogenous tagging of par-6, pkc-3, and par-3 loci with sequences encoding a green fluorescent protein (GFP) and auxin-inducible degradation degron (AID) tag. (C–E) Growth curves of N2, par-6::aid::gfp, gfp::aid::pkc-3, and gfp::aid::par-3 animals in absence (- aux) or presence (+ aux) of 4 mM auxin from hatching. Data show mean ± SD. Shading indicates the developmental stage of control animals. n = 6, 7, 8, and 8 for N2 - aux; 6, 7, 9, and 9 for N2 + aux; 7, 6, 9, and 9 for PAR-6 - aux; 8, 6, 7, and 9 for PAR-6 + aux; 22, 11, 10, and 14 for PKC-3 - aux; 19, 14, 9, and 10 for PKC-3 + aux; 10, 10, 10, and 10 for PAR-3 - aux, and 10, 10, 10, and 10 for PAR-3 + aux. (F) Graphical representation of larval epithelial tissues in C. elegans. Green indicates localization of PAR-6, PKC-3, and PAR-3. (G) Distribution of GFP::AID-tagged PAR-6, PKC-3, and PAR-3 in different larval tissues in absence (- auxin) or presence (+ auxin) of 4 mM auxin for 1 hr. Images are maximum intensity projections, and images of the pharynx are stitched montages. Dashed lines in - auxin panels outline pharynx (left panel), intestinal lumen (middle panel) or seam cells (right panel). White arrows point to the excretory canals.
-
Figure 1—source data 1
Source data for Figure 1.
This zip archive contains the data graphed in panels C–E, and the microscopy images shown in panel G. The raw graph data are in Microsoft Excel format, and the summary data and actual graph in Graphpad Prism format. The images are in TIFF and Adobe Photoshop format. The TIFF file is the unadjusted grayscale maximum intensity projection image generated in ImageJ from an image stack. The Photoshop file contains the original image with the adjustment layers used to arrive at the final image displayed in the main figure.
- https://cdn.elifesciences.org/articles/62067/elife-62067-fig1-data1-v2.zip
Figure 1—figure supplement 1
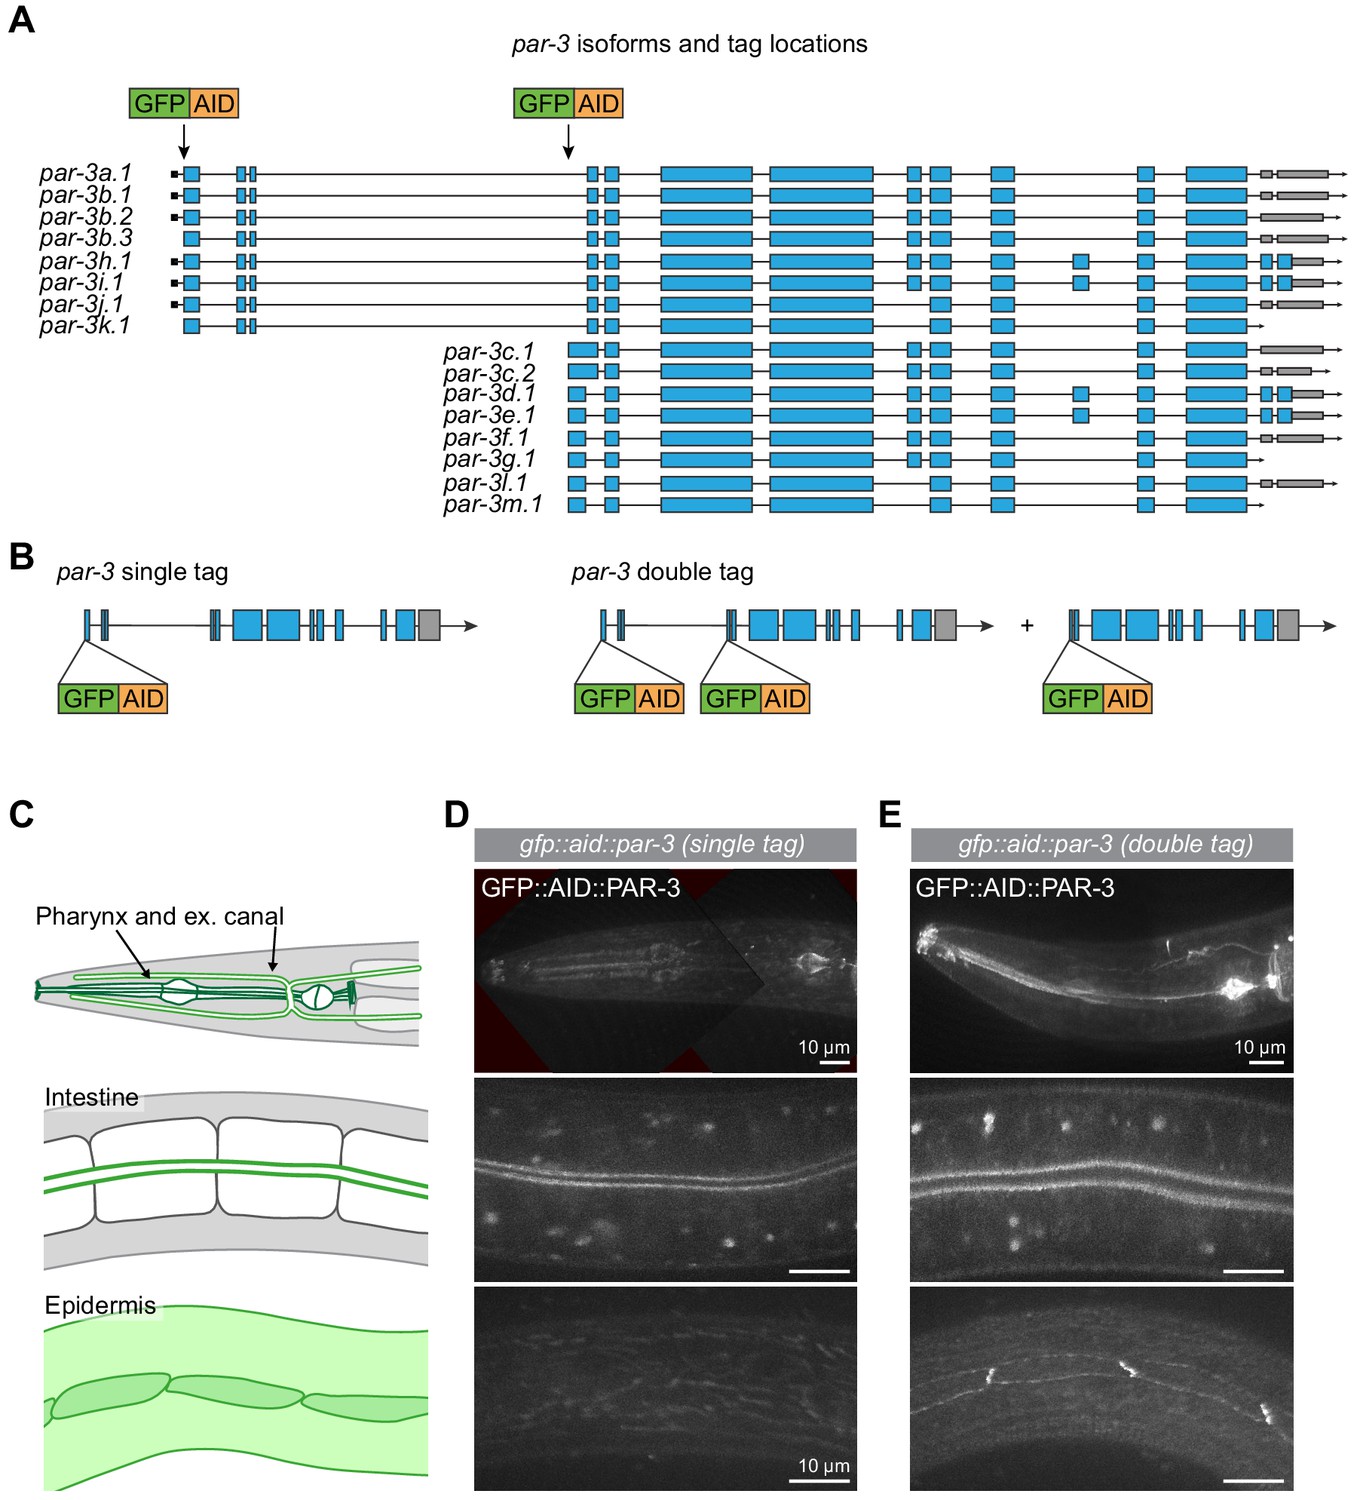
Isoform-specific expression pattern of PAR-3.
(A, B) Schematic representation of endogenous tagging of par-3 isoforms with sequences encoding a green fluorescent protein (GFP) and auxin-inducible degradation degron (AID) tag. (C) Graphical representation of larval epithelial tissues in C. elegans. Green indicates localization of PAR-3 (all isoforms combined). (D) Distribution of the long isoforms of PAR-3 tagged with GFP::AID. (E) Distribution of all PAR-3 isoforms tagged with GFP::AID. Images of the pharynx are stitched montages.
-
Figure 1—figure supplement 1—source data 1
Source data for Figure 1—figure supplement 1.
This zip archive contains the microscopy images shown in panels D and E. The images are in TIFF and Adobe Photoshop format. The TIFF file is the unadjusted grayscale maximum intensity projection image generated in ImageJ from an image stack. The Photoshop file contains the original image with the adjustment layers used to arrive at the final image displayed in the main figure.
- https://cdn.elifesciences.org/articles/62067/elife-62067-fig1-figsupp1-data1-v2.zip
Figure 2 with 1 supplement
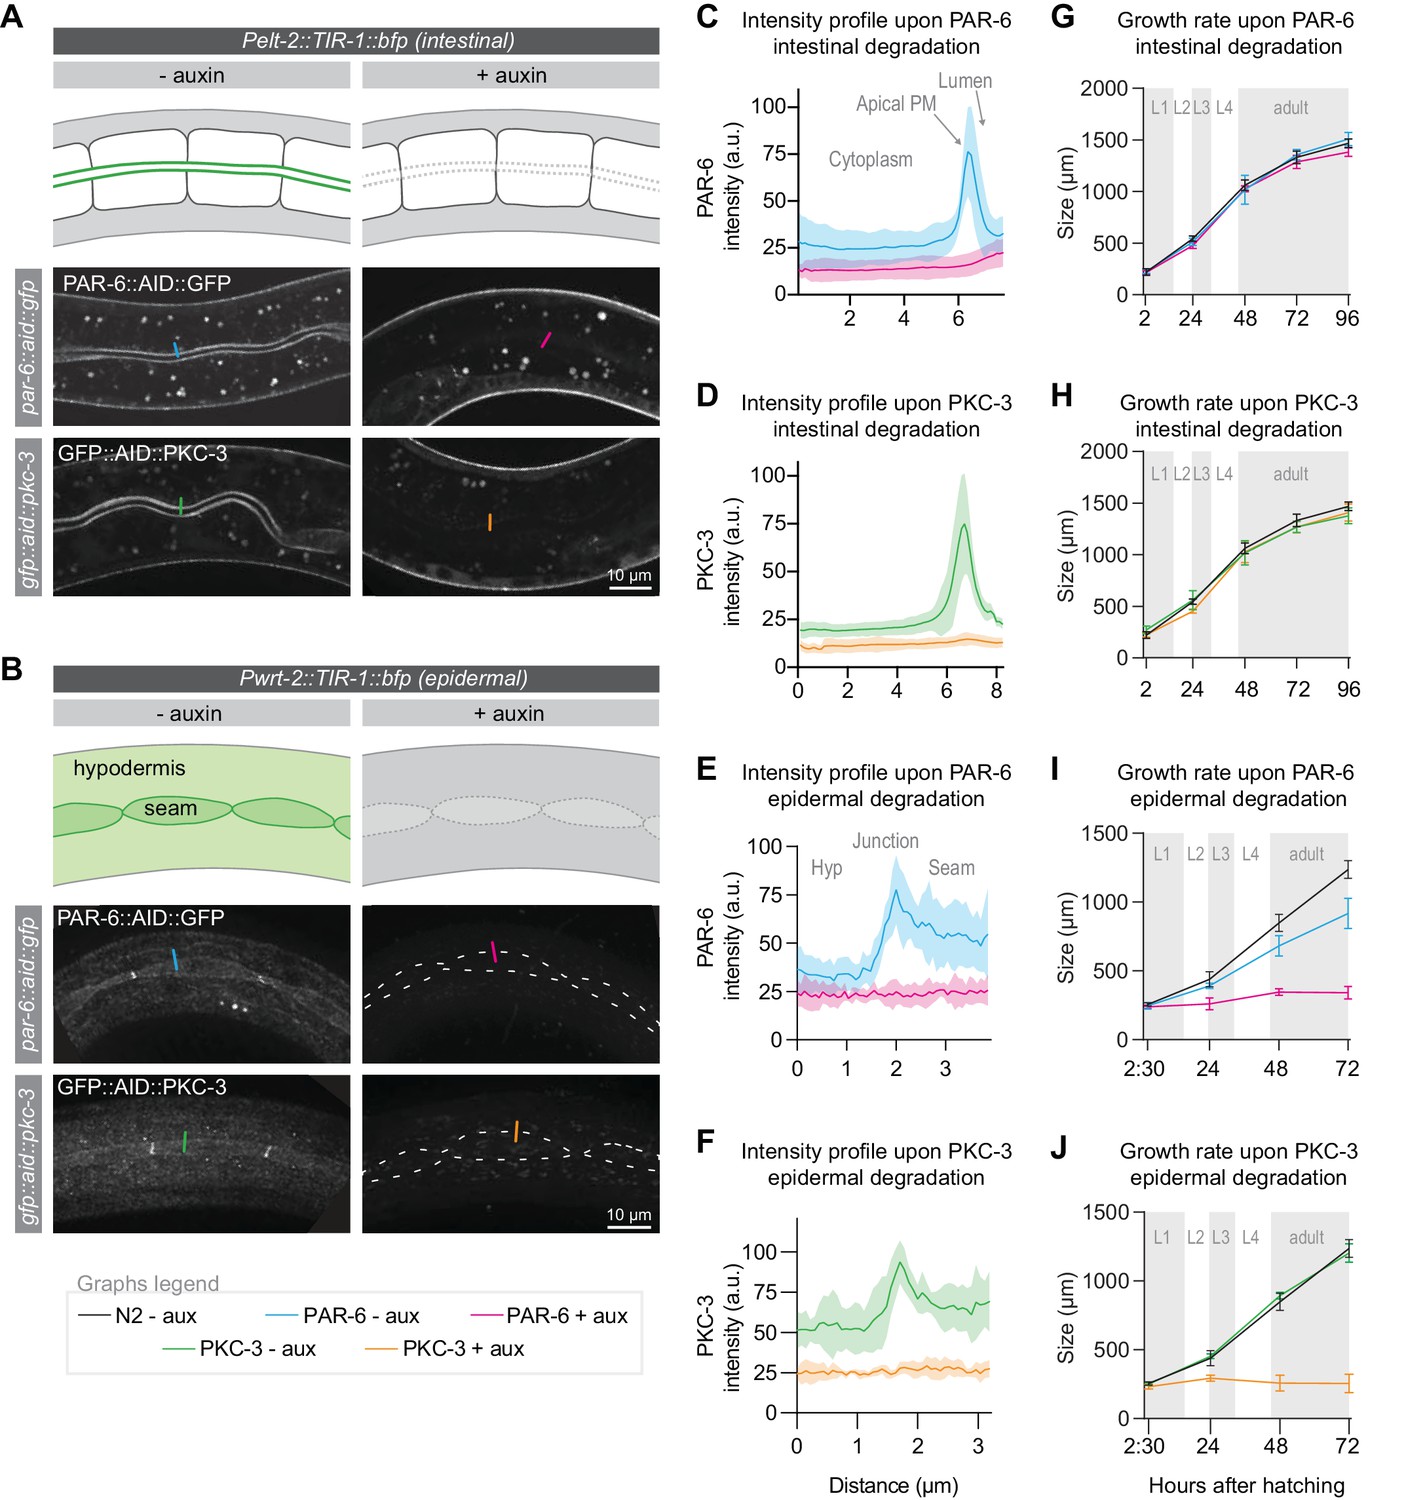
PAR-6 and PKC-3 are essential in the epidermis to support larval growth.
(A, B) Distribution of PAR-6::AID::GFP and GFP::AID::PKC-3 in the intestine (A) and epidermis (B) in absence (- auxin) or presence (+ auxin) of 1 mM auxin for 1 hr. Images are maximum intensity projections of the luminal domain for the intestine, and the apical domain for the epidermis. Drawings are schematic representation of the area imaged, with the localization of PAR-6 and PKC-3 indicated in green shades. Gray indicates absence of PAR-6 and PKC-3. Short colored lines indicate the area quantified in C–F. (C–F) Quantification of apical GFP fluorescence intensity at the intestinal lumen and the hyp7–seam-cell junction in par-6::aid::gfp and gfp::aid::pkc-3 animals in the absence (- aux) or presence (+ aux) of 1 mM auxin for 1 hr. Solid lines and shading represent mean ± SD. For the intestine, n = 10 animals for PAR-6 - aux, PAR-6 + aux, PKC-3 - aux, and PKC-3 + aux. For the epidermis, n = 8 animals for PAR-6 - aux, 6 for PAR-6 + aux, 5 for PKC-3 + aux, and 5 for PKC-3 - aux. (G–J) Growth curves of N2, par-6::aid::gfp, and gfp::aid::pkc-3 animals in absence (- aux) or presence (+ aux) of 4 mM auxin from hatching. Solid lines and shading represent mean ± SD. In G and H, degradation was induced in the intestine, and in I and J in the epidermis. In the intestine, n = 13, 10, 13, 14, and 12 for N2 - aux; 7, 7, 7, 5, and 9 for PAR-6 - aux; 6, 6, 6, 5, and 7 for PAR-6 + aux; 8, 7, 8, 4, and 9 for PKC-3 - aux; and 8, 7, 8, 8, and 8 for PKC-3 + aux. In the epidermis, n = 6, 7, 8, and 8 for N2 - aux; 6, 5, 11, and 8 for PAR-6 - aux; 5, 10, 8, and 9 for PAR-6 + aux; 7, 7, 10, and 8 for PKC-3 - aux; and 8, 7, 12, and 13 for PKC-3 + aux.
-
Figure 2—source data 1
Source data for Figure 2.
This zip archive contains the microscopy images shown in panel A and B, and the data graphed in panels C–J. The images are in TIFF and Adobe Photoshop format. The TIFF file is the unadjusted grayscale maximum intensity projection image generated in ImageJ from an image stack. The Photoshop file contains the original image with the adjustment layers used to arrive at the final image displayed in the main figure. The raw graph data are in Microsoft Excel format, and the summary data and actual graph in Graphpad Prism format.
- https://cdn.elifesciences.org/articles/62067/elife-62067-fig2-data1-v2.zip
Figure 2—figure supplement 1
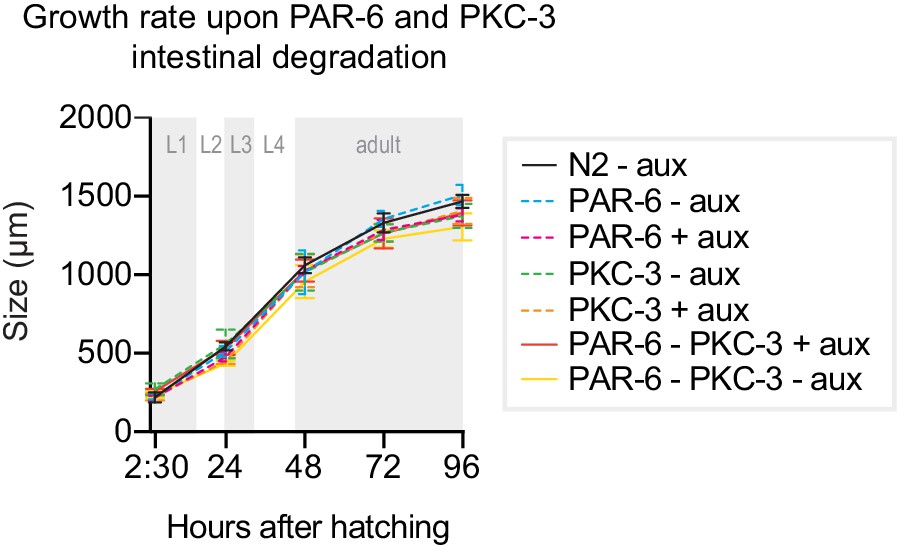
PKC-3 does not act redundantly with PAR-6 in the C. elegans intestine.
Growth curves of N2, par-6::aid::gfp, gfp::aid::pkc-3, and par-6::aid::gfp; gfp::aid::pkc-3 (double depletion) animals in absence (- aux) or presence (+ aux) of 4 mM auxin from hatching. Data of single PAR-6 and PKC-3 depletions (dashed lines) are repeated from Figure 1 for comparison. Data show mean ± SD. n = 13, 10, 13, 14, and 12 for N2 - aux; 7, 7, 7, 5, and 9 for PAR-6 - aux; 6, 6, 6, 5, and 7 for PAR-6 + aux; 8, 7, 8, 4, and 9 for PKC-3 – aux; 8, 7, 8, 8, and 8 for PKC-3 + aux; 5, 8, 6, 8, and 7 for PAR-6–PKC-3 – aux; and 11, 7, 10, 7, and 8 for PAR-6–PKC-3 + aux. Data show mean ± SD. n = 13, 10, 13, 14, and 12 for Control – empty vector; 8, 7, 8, 4, and 9 for PKC-3 – aux and 8, 7, 8, 8, and 8 for PKC-3 + aux.
-
Figure 2—figure supplement 1—source data 1
Source data for Figure 2—figure supplement 1.
This zip archive contains the data graphed in the figure. The raw graph data is in Microsoft Excel format, and the summary data and actual graph in Graphpad Prism format.
- https://cdn.elifesciences.org/articles/62067/elife-62067-fig2-figsupp1-data1-v2.zip
Figure 3 with 2 supplements
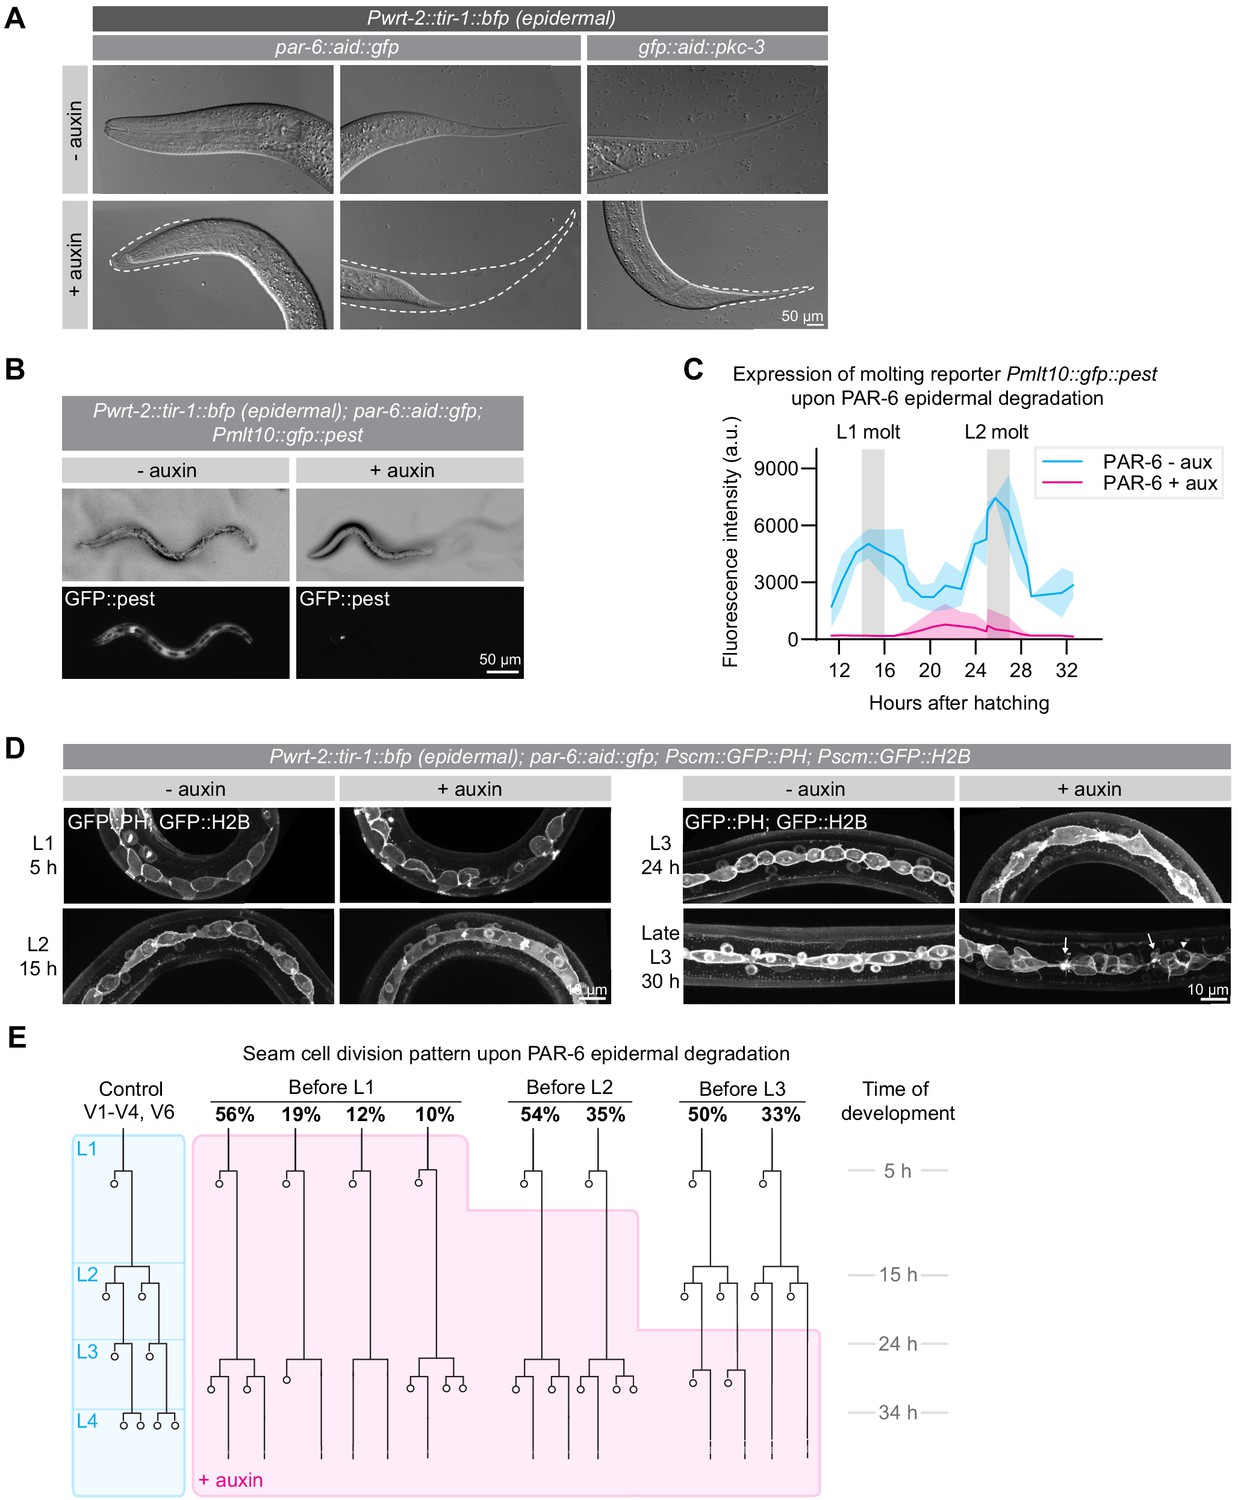
PAR-6 and PKC-3 are required in the epidermis for molting and seam-cell development.
(A) DIC microscopy images of molting defects upon epidermal depletion of PAR-6 or PKC-3. Animals were grown in absence (-auxin) or presence (+auxin) of 1 mM auxin from hatching, and images were taken 30 hr after hatching. Dotted lines outline detached but unreleased cuticle in the pharynx and in the tail. Defects are observed in ~50% of the animals. Images are stitched montages. (B) Expression of the molting reporter Pmlt-10::gfp::pest in par-6::aid::gfp animals in the absence (- auxin) or presence (+ auxin) of 1 mM auxin from hatching. Images were taken at 22 hr of post-embryonic development. (C) Quantification of Pmlt-10::gfp::pest expression from 11 hr to 32 hr of post-embryonic development (mean fluorescence intensity ± SD) in par-6::aid::gfp animals in absence (- aux) or presence from hatching (+ aux) of 1 mM auxin from hatching. Measurements were done every hour. Each data point is an average of 3–12 measurements, with an average of 8 measurements per data point. (D) Examples of seam-cell division and morphology defects observed upon depletion of PAR-6::GFP::AID from hatching. Seam cells are visualized by expression of nuclear H2B::GFP and membrane-bound PH::GFP markers (Wildwater et al., 2011). Arrows indicate membrane protrusions and arrowhead indicates abnormal division plane orientation. Images are maximum intensity projections. (E) Seam-cell division pattern in par-6::aid::gfp animals in absence (control, blue) or presence (+ auxin, magenta) of 1 mM auxin. Auxin was added after hatching, before L2 divisions or before L3 divisions. For the control, n = 14, 75, 40, and 28 animals for the L1, L2, L3 and L4 divisions. For before L1, n = 17 animals for the L1 and 143 animals for the delayed L2 divisions. For before L2, n = 91 animals. For before L3, n = 40 animals.
-
Figure 3—source data 1
Source data for Figure 3.
This zip archive contains the microscopy images shown in panels A, B, and D, and the data graphed in panel C. The images are in Adobe Photoshop format. The Photoshop file contains the original unadjusted image with the adjustment layers used to arrive at the final image displayed in the main figure. The raw graph data are in Microsoft Excel format, and the summary data and actual graph in Graphpad Prism format.
- https://cdn.elifesciences.org/articles/62067/elife-62067-fig3-data1-v2.zip
Figure 3—figure supplement 1
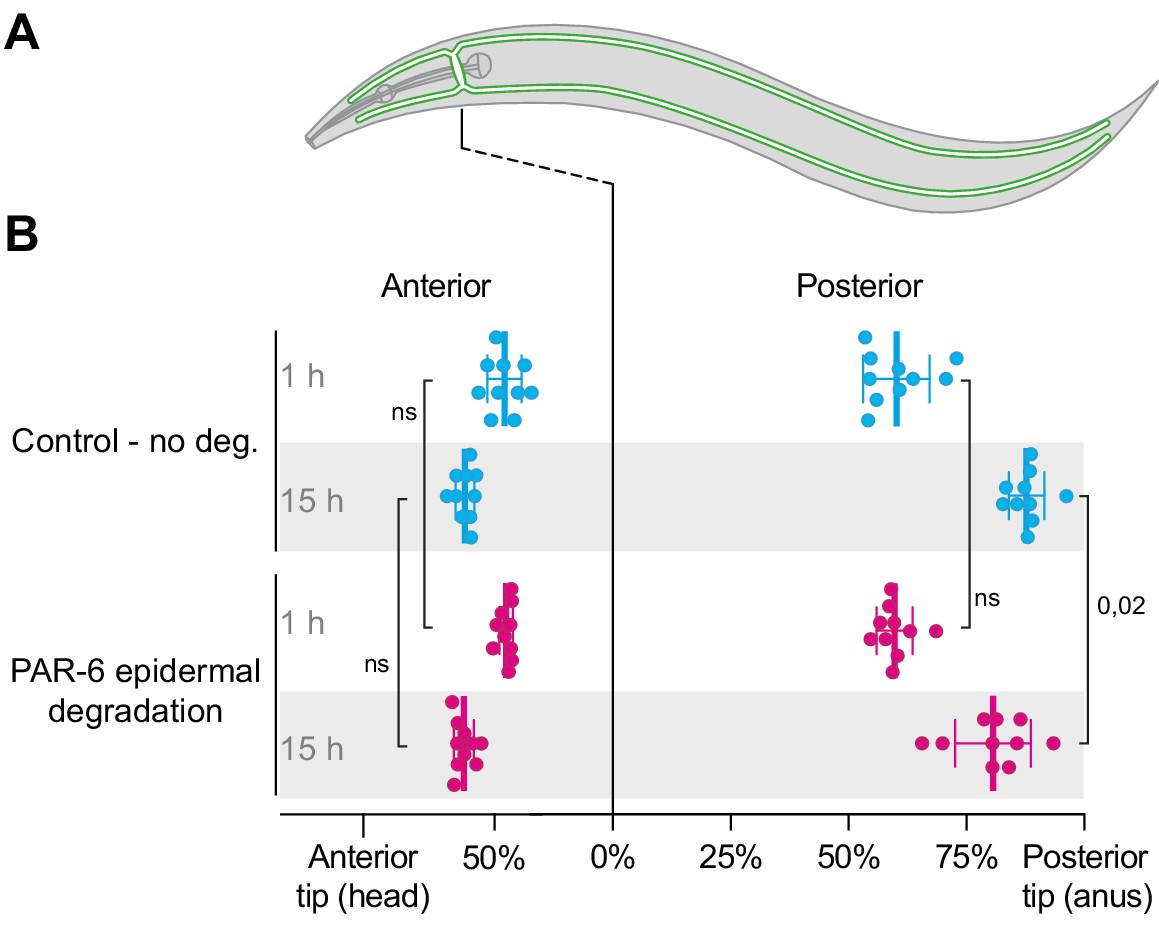
Effect of PAR-6 epidermal degradation on canal outgrowth.
(A) Schematic drawing of the excretory canal system in an L2 animal. Green indicates localization of PAR-6. (B) Quantification of excretory canal outgrowth in L1 and L2 animals. One anterior and one posterior branch were measured per animal. n = 10 animals per condition. Bars represent mean ± SD. Test of significance: two-sided student's T-test. ns = not significant.
-
Figure 3—figure supplement 1—source data 1
Source data for Figure 3—figure supplement 1.
This zip archive contains the data graphed in B. The raw graph data are in Microsoft Excel format, and the summary data and actual graph in Graphpad Prism format.
- https://cdn.elifesciences.org/articles/62067/elife-62067-fig3-figsupp1-data1-v2.zip
Figure 3—figure supplement 2
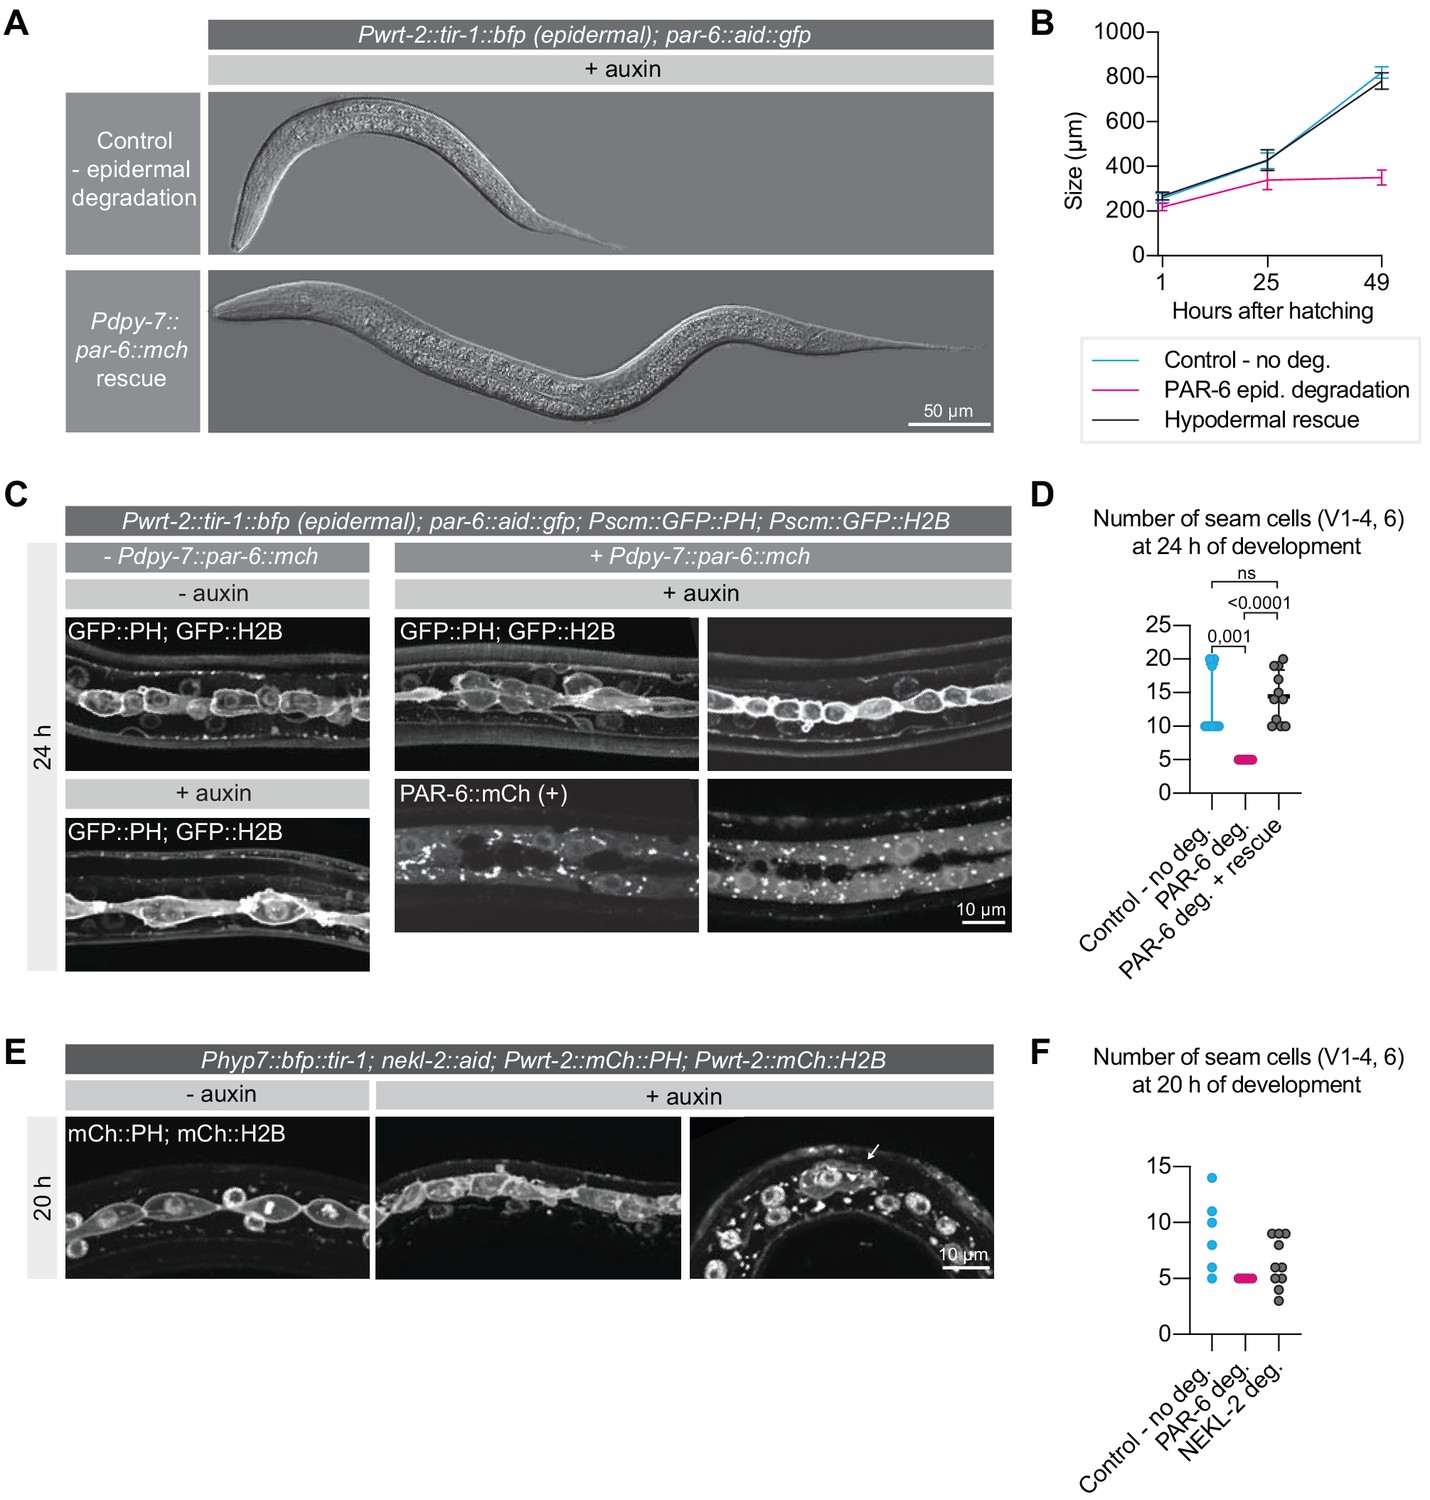
Hypodermal expression of PAR-6 is necessary for larval development.
(A) DIC microscopy images of par-6::aid::gfp; Pwrt-2::tir-1::bfp animals carrying (Pdpy-7::par-6::mCherry) or lacking (Control) an extrachromosomal array expressing PAR-6 in the hypodermis. Worms were grown in presence (+ auxin) of 4 mM auxin from hatching. Images taken 30 hr after hatching. Images are stitched montages. (B) Growth curves of animals treated as in (A). Lengths were measured at 1, 25, and 49 hr after hatching. n = 5 animals per condition and data point. Data shows mean ± SD. (C) Seam cells visualized by nuclear H2B::GFP and membrane-bound PH::GFP at 24 hr of post-embryonic development in par-6::aid::gfp animals carrying (Pdpy-7::par-6::mCherry) or lacking (Controls) an extrachromosomal array expressing PAR-6 in the hypodermis. Worms were grown in absence (- auxin) or presence (+ auxin) of 4 mM auxin from hatching. Images are maximum intensity projections. (D) Number of seam cells (V1–4, 6) at 24 hr of post-embryonic development in absence (- auxin) or presence (+ auxin) of 4 mM auxin from hatching and with or without PAR-6 hypodermal rescue. n = 10 for control, and 11 for PAR-6 deg and PAR-6 deg + rescue. Bars represent median ±interquartile range. (E) Seam cells visualized by nuclear H2B::mCherry and membrane-bound PH::mCherry at 20 hr of post-embryonic development in nekl-2::aid; Phyp7::bfp::tir-1 animals in absence (- aux) or presence (+ aux) of 4 mM auxin from hatching. Images are maximum intensity projections. (F) Number of seam cells (V1–4, 6) at 20 hr of post-embryonic development in nekl-2::aid; Phyp7::bfp::tir-1 animals in absence (Control – no deg) or presence (NEKL-2 deg.) of 4 mM auxin and in par-6::aid::gfp; Pwrt-2::tir-1::bfp animals in presence (PAR-6 deg.) of 4 mM auxin from hatching. n = 6 for Control, 5 for PAR-6 deg, and 10 for NEKL-2 deg. Test of significance: Dunn’s test of significance for D. ns = not significant.
-
Figure 3—figure supplement 2—source data 1
Source data for Figure 3—figure supplement 2.
This zip archive contains the microscopy images shown in panels A, C, and E, and the data graphed in panels B, D, and F. The images are in TIFF and Adobe Photoshop format. The TIFF file is the unadjusted grayscale image (A) or the unadjusted grayscale maximum intensity projection image generated in ImageJ from an image stack (C and E). The Photoshop file contains the original image with the adjustment layers used to arrive at the final image displayed in the main figure. The raw graph data are in Microsoft Excel format, and the summary data and actual graph in Graphpad Prism format.
- https://cdn.elifesciences.org/articles/62067/elife-62067-fig3-figsupp2-data1-v2.zip
Figure 4 with 2 supplements
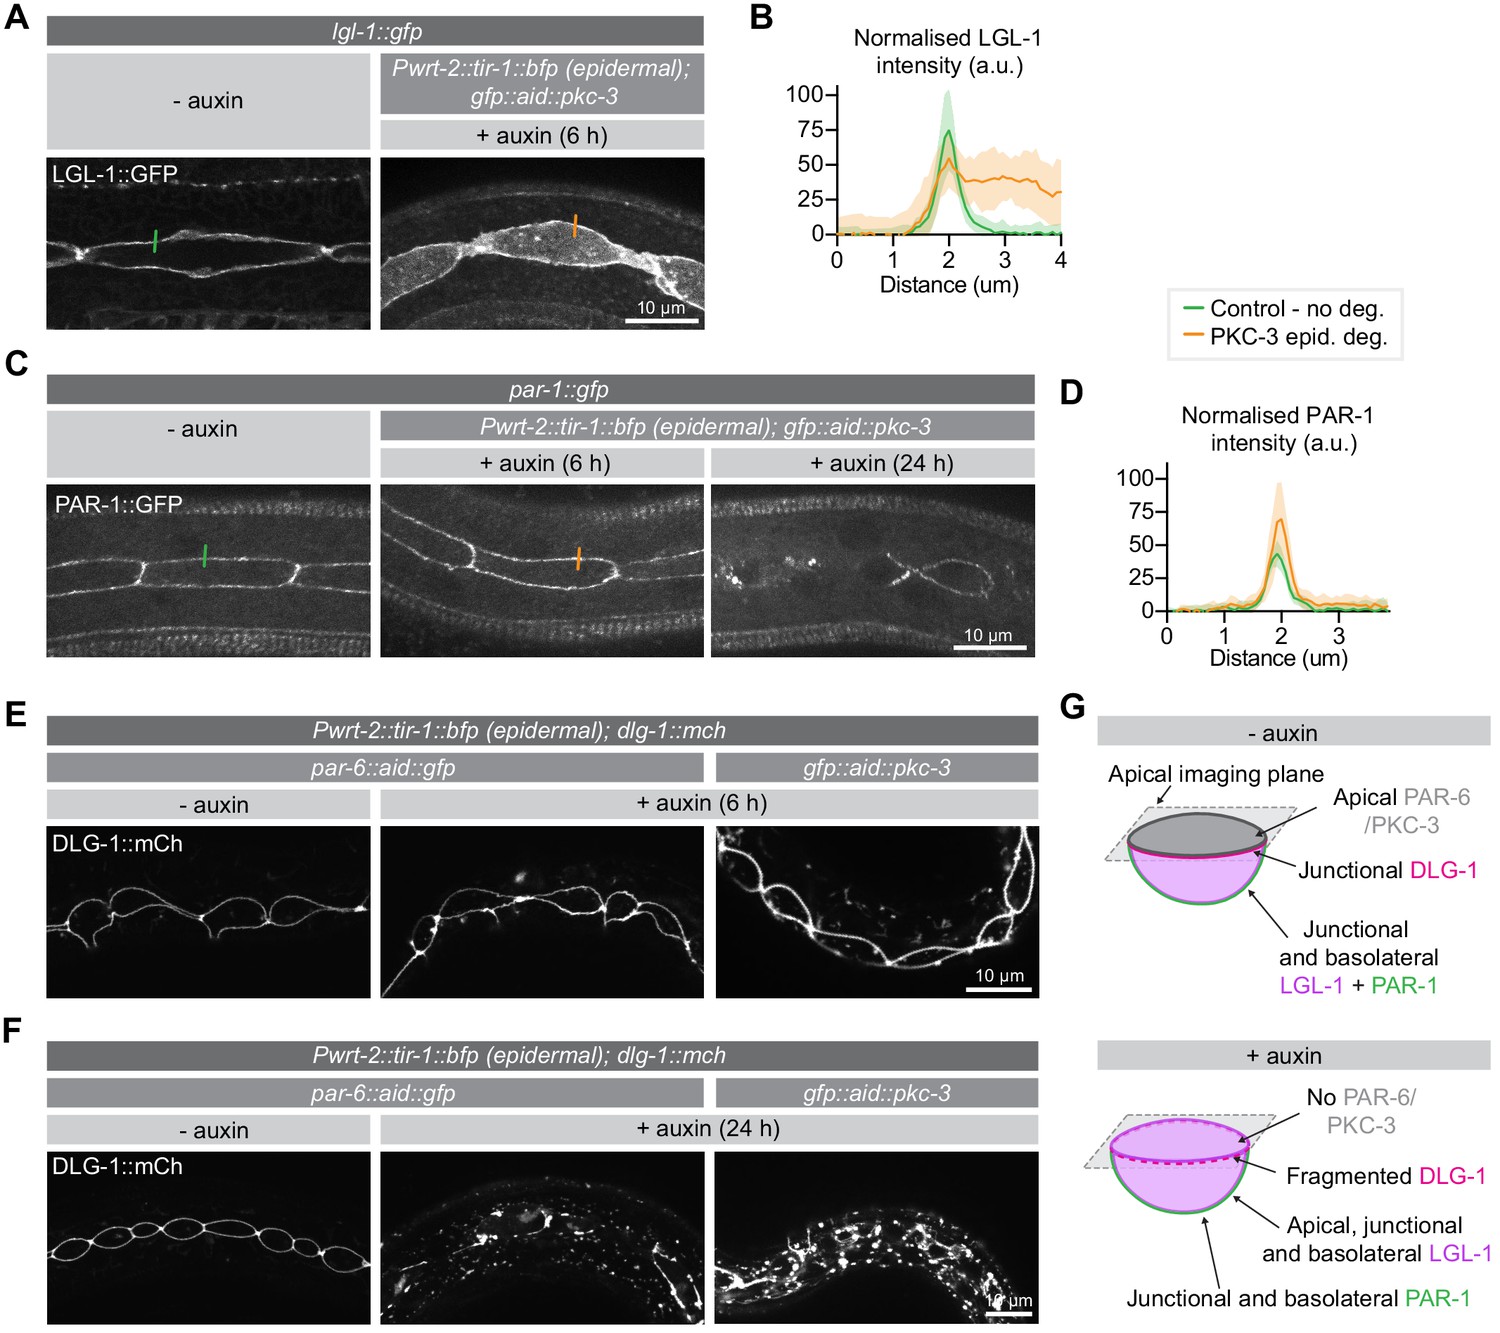
PKC-3 excludes LGL-1 from the apical cortex and, together with PAR-6, regulates junctions.
(A, B) Distribution and quantification of LGL-1::GFP in the epidermis of lgl-1::gfp animals without auxin and in lgl-1::gfp; gfp::aid::pkc-3; Pwrt-2::tir-1::bfp animals in the presence of 4 mM auxin for 6 hr. Images are maximum intensity projections of the apical domain. Quantifications shows mean apical GFP fluorescence intensity ± SD at the hyp7–seam-cell junction, normalized to background intensity of each animal measured in the hypodermis. n = 7 animals for both conditions. Short colored lines in A indicate the area quantified in B. (C, D) Distribution and quantification of PAR-1::GFP in the epidermis in par-1::gfp animals without auxin and in par-1::gfp; gfp::aid::pkc-3; Pwrt-2::tir-1::bfp animals in the presence of 4 mM auxin for 6 or 24 hr. Images are maximum intensity projections of the apical domain. Quantifications show mean apical GFP fluorescence intensity ± SD at the hyp7–seam-cell junction, normalized to the background intensity of each animal measured in the hypodermis. n = 6 animals for both conditions. Short colored lines in C indicate the area quantified in D. (E, F) Junction organization visualized by DLG-1::mCherry expression in par-6::aid::gfp or gfp::aid::pkc-3 animals in the absence (- auxin) or presence (+ auxin) of 1 mM auxin for 6 (E) or 24 (F) hours. Images are maximum intensity projections of the junctional domain. (G) Graphical representation of junctional defects in the seam cells upon PAR-6 or PKC-3 degradation.
-
Figure 4—source data 1
Source data for Figure 4.
This zip archive contains the microscopy images shown in panels A, C, E, and F, and the data graphed in panels B, D. The images are in TIFF and Adobe Photoshop format. The TIFF file is the unadjusted grayscale maximum intensity projection image generated in ImageJ from an image stack. The Photoshop file contains the original image with the adjustment layers used to arrive at the final image displayed in the main figure. The raw graph data are in Microsoft Excel format, and the summary data and actual graph in Graphpad Prism format.
- https://cdn.elifesciences.org/articles/62067/elife-62067-fig4-data1-v2.zip
Figure 4—figure supplement 1
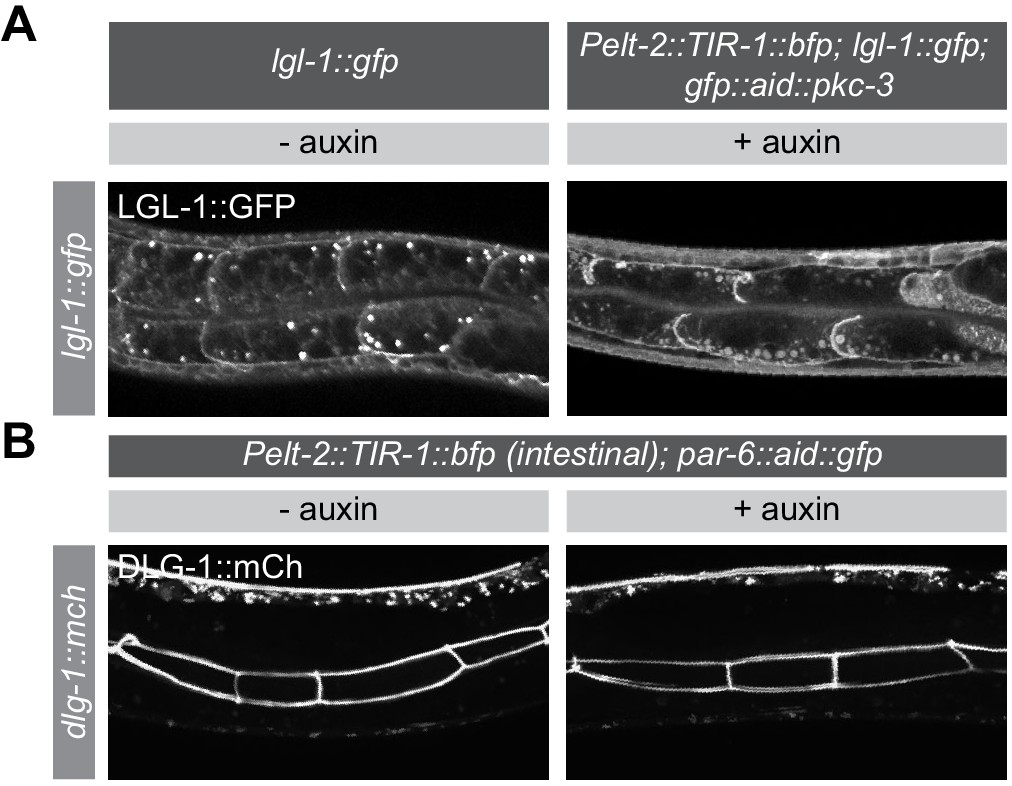
PAR-6 and PKC-3 are not essential for LGL-1 localization or junction maintenance in the larval intestine.
(A) Distribution of LGL-1::GFP, in lgl-1::gfp animals without auxin and in lgl-1::gfp; gfp::aid::pkc-3; Pelt-2::tir-1::bfp animals in presence of 4 mM auxin from hatching. Images are maximum intensity projections covering the whole intestinal cells. (B) Distribution of DLG-1::mCherry in par-6::aid::gfp; Pelt-2::tir-1::bfp animals in absence (- auxin) or presence (+ auxin) of 4 mM auxin from hatching. Images are maximum intensity projections of the luminal domain for the intestine.
-
Figure 4—figure supplement 1—source data 1
Source data for Figure 4—figure supplement 1.
This zip archive contains the microscopy images shown in panels A and B. The images are in TIFF and Adobe Photoshop format. The TIFF file is the unadjusted grayscale maximum intensity projection image generated in ImageJ from an image stack. The Photoshop file contains the original image with the adjustment layers used to arrive at the final image displayed in the main figure.
- https://cdn.elifesciences.org/articles/62067/elife-62067-fig4-figsupp1-data1-v2.zip
Figure 4—figure supplement 2
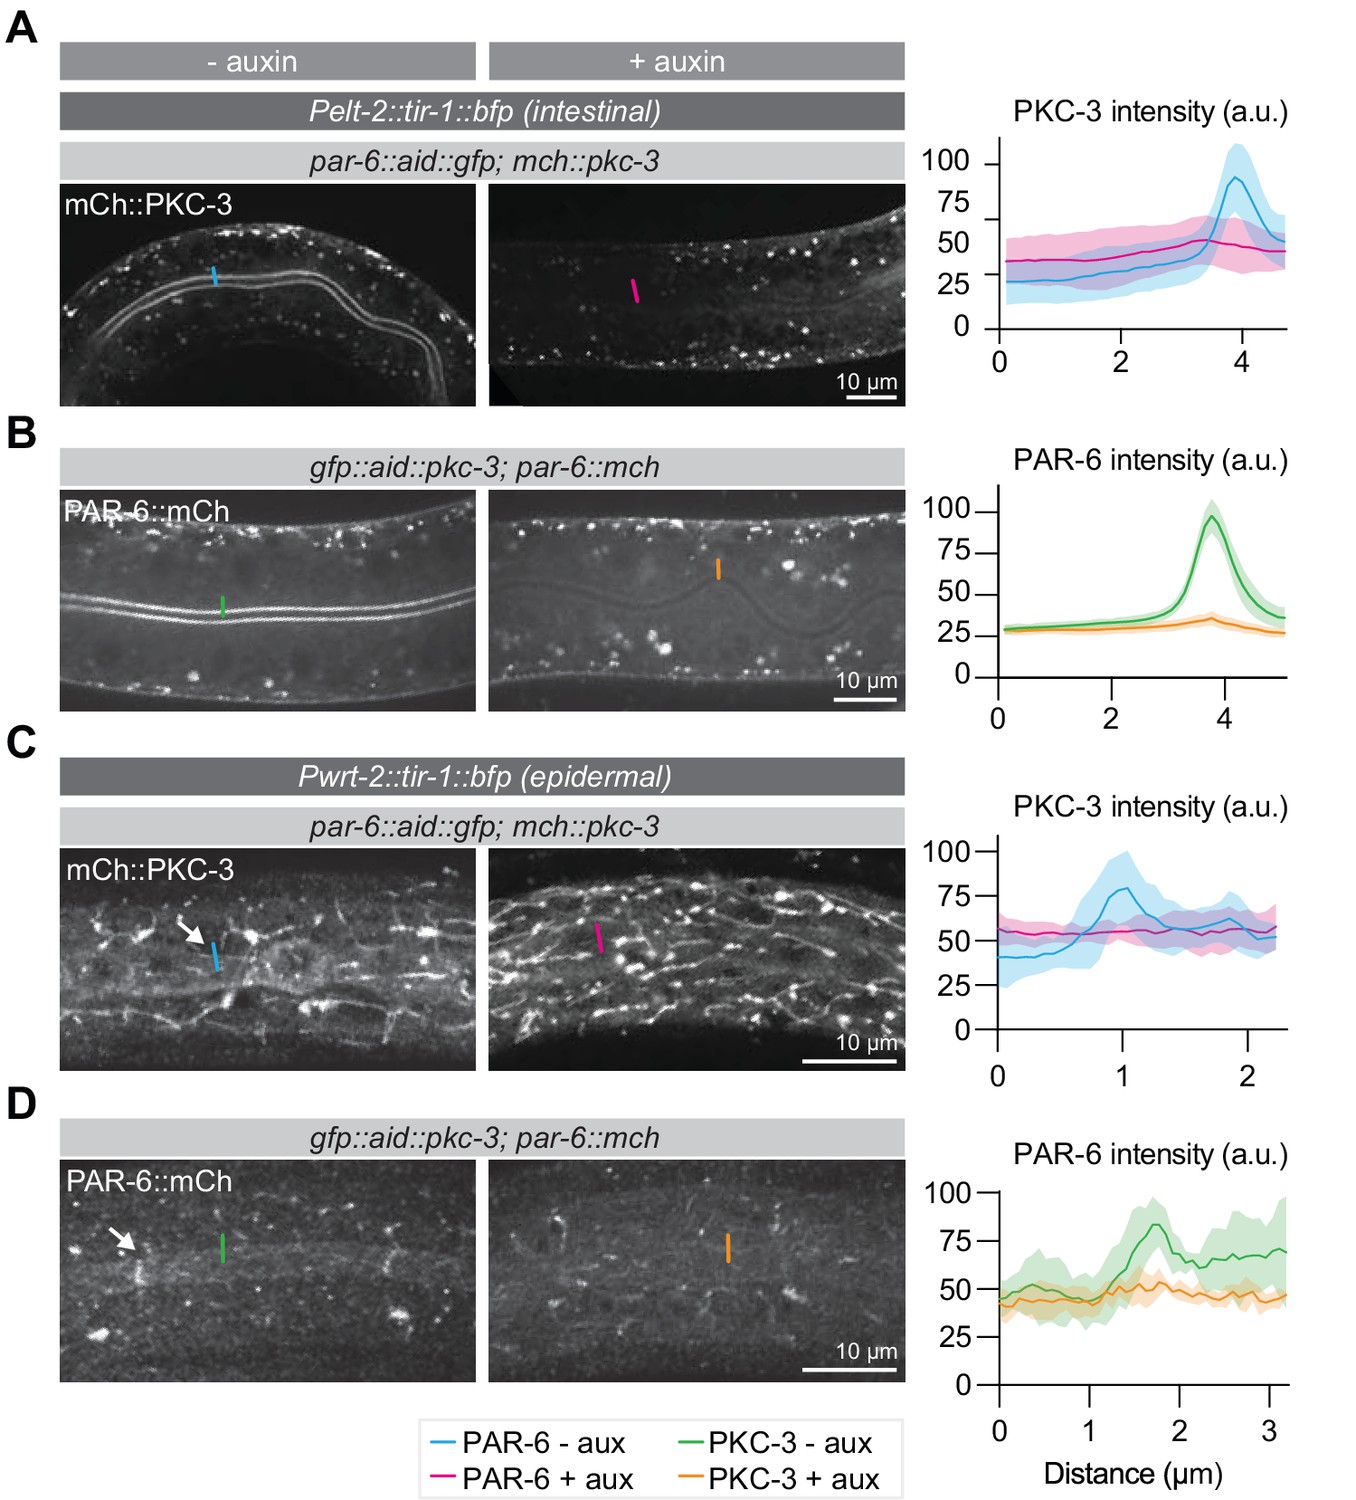
Localization dependencies of PAR-6 and, PKC-3.
Left panels are of animals not exposed to auxin, right panels are of animals exposed to 1 mM auxin for 1 hr. (A, B) Distribution and quantification of mCherry::PKC-3 upon intestinal depletion of PAR-6, and of PAR-6::mCherry upon intestinal depletion of PKC-3. Images are maximum intensity projections of the apical domain. (C, D) Distribution and quantification of mCherry::PKC-3 upon epidermal depletion of PAR-6, and of PAR-6::mCherry upon epidermal depletion of PKC-3. Images are maximum intensity projections of the apical domain from a z-stack. Short colored lines in microscopy images indicate the areas quantified in the graphs. Quantifications show mean apical GFP fluorescence intensity ± SD at the intestinal lumen (A, B) or the hyp7–seam-cell junction (C, D). n = 8 animals for -aux and 4 animals for + aux in panel A, 8 animals for -aux and 4 animals for + aux in panel B, and 5 animals for both conditions in panels C and D.
-
Figure 4—figure supplement 2—source data 1
Source data for Figure 4—figure supplement 2.
This zip archive contains the microscopy images and the data graphed in panels A–D. The images are in TIFF and Adobe Photoshop format. The TIFF file is the unadjusted grayscale maximum intensity projection image generated in ImageJ from an image stack. The Photoshop file contains the original image with the adjustment layers used to arrive at the final image displayed in the main figure. The raw graph data are in Microsoft Excel format, and the summary data and actual graph in Graphpad Prism format.
- https://cdn.elifesciences.org/articles/62067/elife-62067-fig4-figsupp2-data1-v2.zip
Figure 5
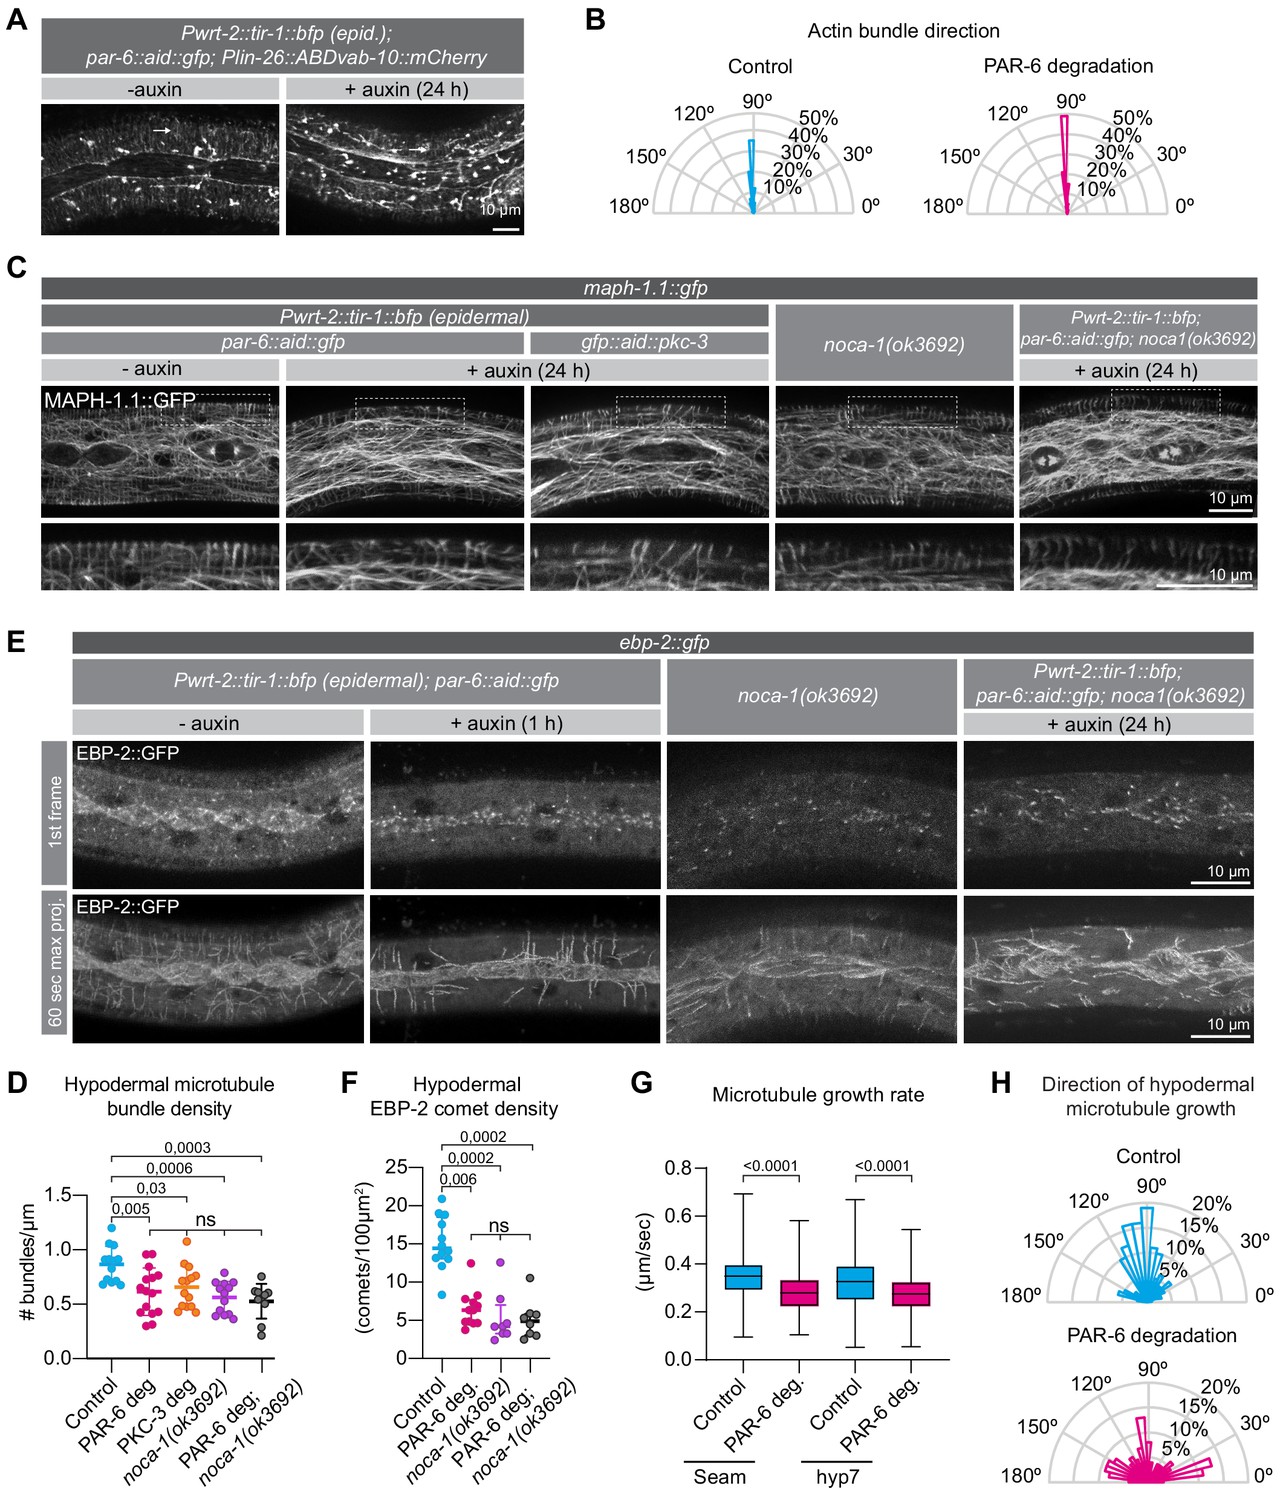
PAR-6 and PKC-3 control microtubule organization in the C.elegans epidermis.
(A) Actin organization visualized by the Plin-26::ABDvab-10::mCherry reporter in par-6::aid::gfp animals in absence (- auxin) or presence (+ auxin) of 1 mM auxin for 24 hr. Images are maximum intensity projections. (B) Quantification of actin bundle orientation. Angle is measured relative to the anterior (180°) – posterior (0°) axis. n = 100 bundles in five animals per condition. (C) Microtubule organization of the indicated genotypes visualized by MAPH-1.1::GFP in absence (- auxin) or presence (+ auxin) of 1 mM auxin for 24 hr. Images are maximum intensity projections. (D) Hypodermal microtubule bundle density. n = 13 animals for control, 15 for PAR-6 deg, 14 for PKC-3 deg, 13 for noca-1(ok3692), and 10 for PAR-6 deg. in noca-1(ok3692). Bars show mean ± SD. (E) Microtubule growth visualized by the plus end marker EBP-2::GFP in absence (- auxin) or presence (+ auxin) of 1 mM auxin for 1 hr. Images are a single frame or a 60 s maximum projection (one frame/second). To match the age of animals in (C), we depleted PAR-6 for 1 hr starting with 23 hr old L2 animals. (F) EBP-2 comet density in hyp7 in 24 hr old animals. n = 12 animals for control and PAR-6 deg, 8 for noca-1(ok3692), and 10 for PAR-6 deg in noca-1(ok3692). Auxin was present for 1 hr, from 23 to 24 hr of development. Bars show mean ± SD (G) Microtubule growth rate in 24 hr old animals. n > 400 comets in two animals (seam), four animals (hyp7 control), or five animals (hyp7 + auxin). Auxin was present for 1 hr, from 23 to 24 hr of development. Bars = mean ± SD (H) Quantification of microtubule growth orientation in hyp7 in 24 hr old animals. Auxin was present for 1 hr, from 23 to 24 hr of development. Vertical axis: left/right orientation; horizontal axis: anterior/posterior orientation. n = 150 comets. Bars = mean ± SD. Tests of significance: Tukey’s multiple comparisons test for D, and Dunn’s multiple comparisons test for F and G. ns = not significant.
-
Figure 5—source data 1
Source data for Figure 5.
This zip archive contains the microscopy images shown in panels A, C, and E, and the data graphed in panels B, D, F, G, and H. The images are in TIFF and Adobe Photoshop format. The TIFF file is the unadjusted grayscale maximum intensity projection image generated in ImageJ from an image stack. The Photoshop file contains the original image with the adjustment layers used to arrive at the final image displayed in the main figure. The raw graph data are in Microsoft Excel format, and the summary data and actual graph in Graphpad Prism format.
- https://cdn.elifesciences.org/articles/62067/elife-62067-fig5-data1-v2.zip
Figure 6 with 1 supplement
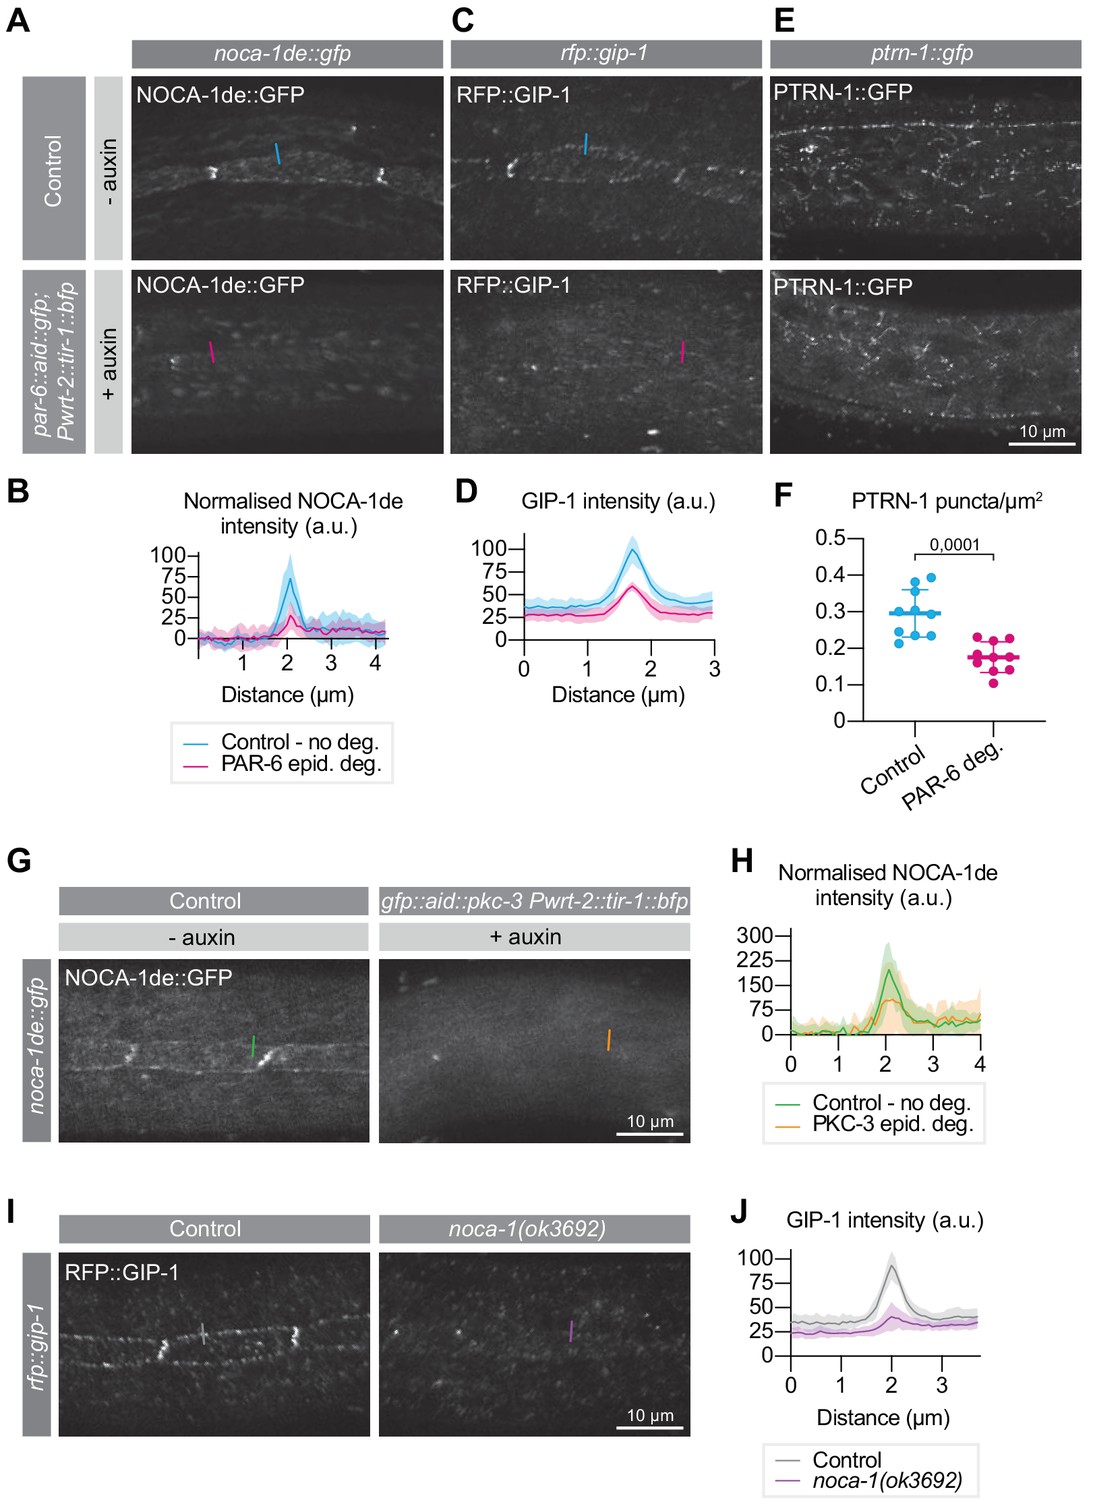
PAR-6 promotes the localization of its binding partner NOCA-1, as well as of GIP-1 and PTRN-1.
(A, B) Distribution and quantification of NOCA-1de::GFP in the epidermis of noca-1de::gfp animals without auxin, and noca-1de::gfp; par-6::aid::gfp; Pwrt-2::tir-1::bfp animals in the presence of 4 mM auxin for 6 hr. n = 9 animals for Control, and 10 for PAR-6 epid. deg. Short colored lines in A indicate the area quantified in B. (C, D) Distribution and quantification of GIP-1::RFP in the epidermis of gip-1::rfp animals without auxin, and gip-1::rfp; par-6::aid::gfp; Pwrt-2::tir-1::bfp animals in the presence of 4 mM auxin for 6 hr. n = 6 for Control and 6 for PAR-6 epid. deg. Short colored lines in C indicate the area quantified in D. (E, F) Distribution and quantification of PTRN-1::GFP in the hyp7 and seam cells of ptrn-1::gfp animals without auxin, and ptrn-1::gfp; par-6::aid::gfp; Pwrt-2::tir-1::bfp animals in the presence of 4 mM auxin for 6 hr. n = 10 for Control and 10 for PAR-6 deg. Short colored lines in E indicate the area quantified in F. (G, H) NOCA-1de::GFP in the epidermis of noca-1de::gfp animals without auxin, and noca-1de::gfp; gfp::aid::pkc-3; Pwrt-2::tir-1::bfp animals in the presence of 4 mM auxin for 6 hr. n = 10 for Control and 10 for PKC-3 epid. deg. Short colored lines in G indicate the area quantified in H. (I, J) Distribution and quantification of GIP-1::RFP in the epidermis of gip-1::rfp animals and gip-1::rfp; noca-1(ok3692). n = 6 for Control and 6 for noca-1(ok3692). Short colored lines in I indicate the area quantified in J. All images are maximum intensity projections of the apical domain. Quantifications in B, D, H and J show mean apical GFP fluorescence intensity ± SD at the hyp7-seam-cell junction (indicated by colored lines), normalized to background intensity of each animal measured in the hypodermis. Quantification in F shows mean PTRN-1::GFP puncta density ± SD. Tests of significance: unpaired t-test for F.
-
Figure 6—source data 1
Source data for Figure 6.
This zip archive contains the microscopy images shown in panels A, C, E, G, and I, and the data graphed in panels B, D, F, H, and J. The images are in TIFF and Adobe Photoshop format. The TIFF file is the unadjusted grayscale maximum intensity projection image generated in ImageJ from an image stack. The Photoshop file contains the original image with the adjustment layers used to arrive at the final image displayed in the main figure. The raw graph data are in Microsoft Excel format, and the summary data and actual graph in Graphpad Prism format.
- https://cdn.elifesciences.org/articles/62067/elife-62067-fig6-data1-v2.zip
Figure 6—figure supplement 1
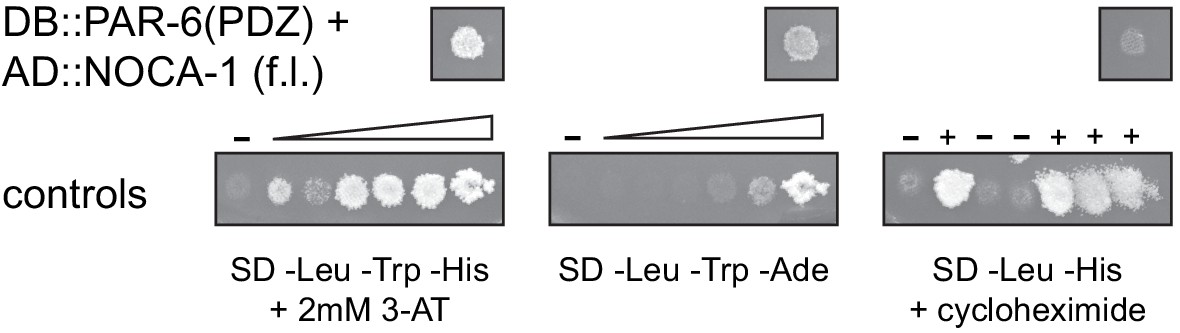
Interaction of PAR-6 and NOCA-1 in the yeast two-hybrid system.
The PAR-6 PDZ domain fused to the Gal4 DNA binding domain was co-expressed with full-length NOCA-1 fused to the Gal4 activation domain. Growth on -Leu -Trp -His + 2 mM 3-AT, and on -Leu -Trp -Ade plates indicates presence of interaction. Lack of growth on -Leu -His + cycloheximide plate shows that DB::PAR-6 is not self-activating. Controls range from no reporter activation to strong reporter activation. On cycloheximide plates, (-) indicates no growth expected, and (+) indicates growth expected.
-
Figure 6—figure supplement 1—source data 1
Source data for Figure 6—figure supplement 1.
This zip archive contains the uncropped TIFF images of the yeast growth on the three types of selective plates.
- https://cdn.elifesciences.org/articles/62067/elife-62067-fig6-figsupp1-data1-v2.zip
Videos
Video 1
Time-lapse imaging of PAR-6::AID::GFP and PKC-3::mCherry in animals expressing intestine-specific TIR1 upon addition of 1 mM Auxin.
Video 2
Time-lapse imaging of EBP-2::GFP in control animals and PAR-6 depleted animals.
Freeze frame circles EBP-2 comets as an example of quantification. Final frames show a time projection as displayed in Figure 5E.
Video 3
Dual-color time-lapse imaging of EBP-2::mKate2 and MAPH-1.1::GFP.
New microtubules largely grow along existing bundles.
Tables
Key resources table
| Reagent type (species) or resource | Designation | Source or reference | Identifiers | Additional information |
|---|---|---|---|---|
| Strain, strain background(C. elegans) | BOX289 | This paper | par-6(mib30[par-6::aid::egfp-loxp]) I; ieSi57[eft-3p::TIR1::mRuby::unc-54 3'UTR + Cbr-unc-119(+)] II | |
| Strain, strain background(C. elegans) | BOX570 | This paper | pkc-3(mib78[egfp-loxp::aid::pkc-3]) II; ieSi57[eft-3p::TIR1::mRuby::unc-54 3'UTR + Cbr-unc-119(+)] II | |
| Strain, strain background(C. elegans) | BOX292 | This paper | ieSi57[eft-3p::TIR1::mRuby::unc-54 3'UTR + Cbr-unc-119(+)] II; par-3(mib68[eGFP-Lox2272::AID::par-3b+eGFP(noIntrons)-LoxP::AID::par-3g]) III | |
| Strain, strain background(C. elegans) | BOX276 | This paper | par-3b(mib65[eGFP-Lox2272::AID::par-3b]) III | |
| Strain, strain background(C. elegans) | BOX667 | This paper | par-3(mib68[eGFP-Lox2272::AID::par-3b+eGFP(noIntrons)-LoxP::AID::par-3g]) III; ieSi64 [gld-1p::TIR1::mRuby::gld-1 3’UTR + Cbr-unc-119(+)] II | |
| Strain, strain background(C. elegans) | BOX409 | This paper | par-6(mib30[par-6::aid::egfp-loxp]) I; mibIs49[Pwrt-2::TIR-1::tagBFP2-Lox511::tbb-2–3'UTR, IV:5014740–5014802 (cxTi10882 site)] IV | |
| Strain, strain background(C. elegans) | BOX607 | This paper | pkc-3(mib78[egfp-loxp::aid::pkc-3]) II; mibIs49[Pwrt-2::TIR-1::tagBFP2-Lox511::tbb-2–3'UTR, IV:5014740–5014802 (cxTi10882 site)] IV | |
| Strain, strain background(C. elegans) | BOX444 | This paper | pkc-3(mib78[egfp-loxp::aid::pkc-3]) II; mibIs48[Pelt-2::TIR-1::tagBFP2-Lox511::tbb-2–3'UTR, IV:5014740–5014802 (cxTi10882 site)] IV | |
| Strain, strain background(C. elegans) | BOX285 | This paper | par-6(mib30[par-6::aid::egfp-loxp]) I; mibIs48[Pelt-2::TIR-1::tagBFP2-Lox511::tbb-2–3'UTR, IV:5014740–5014802 (cxTi10882 site)] IV | |
| Strain, strain background(C. elegans) | BOX506 | This paper | par-6(mib30[par-6::aid::egfp-loxp]) I; mibIs49[Pwrt-2::TIR-1::tagBFP2-Lox511::tbb-2–3'UTR, IV:5014740–5014802 (cxTi10882 site)] IV; dlg-1(mib23[dlg-1::mCherry-LoxP]) X; mgIs49[mlt-10::gfp-pest] | |
| Strain, strain background(C. elegans) | BOX412 | This paper | par-6(mib30[par-6::aid::egfp-loxp]) I; mibIs49[Pwrt-2::TIR-1::tagBFP2-Lox511::tbb-2–3'UTR, IV:5014740–5014802 (cxTi10882 site)] IV; heIs63[Pwrt-2::GFP::PH, Pwrt-2::GFP::H2B, Plin-48::mCherry]V | |
| Strain, strain background(C. elegans) | BOX490 | This paper | ouIs10[Pscm::NLS::tdTomato(pAW584)+Pwrt2::GFP::PH(pAW561)+Pdpy-7::2xNLS::YFP(pAW516)] I; par-6(mib30[par-6::aid::egfp-loxp]) I; mibIs49[Pwrt-2::TIR-1::tagBFP2-Lox511::tbb-2–3'UTR, IV:5014740–5014802 (cxTi10882 site)] IV | |
| Strain, strain background(C. elegans) | BOX041 | This paper | mibIs23 [lgl-1::GFP-2TEV-Avi 10 ng + Pmyo-3::mCherry 10 ng + lambda DNA 60 ng] V | |
| Strain, strain background(C. elegans) | BOX553 | This paper | pkc-3(mib78[egfp-loxp::aid::pkc-3]) II; mibIs49[Pwrt-2::TIR-1::tagBFP2-Lox511::tbb-2–3'UTR, IV:5014740–5014802 (cxTi10882 site)] IV; mibIs23 [lgl-1::GFP-2TEV-Avi 10 ng + Pmyo-3::mCherry 10 ng + lambda DNA 60 ng] V | |
| Strain, strain background(C. elegans) | BOX554 | This paper | pkc-3(mib78[egfp-loxp::aid::pkc-3]) II; mibIs49[Pwrt-2::TIR-1::tagBFP2-Lox511::tbb-2–3'UTR, IV:5014740–5014802 (cxTi10882 site)] IV; par-1(it324[par-1::gfp::par-1 exon 11a]) | |
| Strain, strain background(C. elegans) | BOX493 | This paper | pkc-3(mib78[egfp-loxp::aid::pkc-3]) II; mibIs49[Pwrt-2::TIR-1::tagBFP2-Lox511::tbb-2–3'UTR, IV:5014740–5014802 (cxTi10882 site)] IV; dlg-1(mib23[dlg-1::mCherry-LoxP]) X | |
| Strain, strain background(C. elegans) | BOX402 | This paper | par-6(mib30[par-6::aid::egfp-loxp]) I; mibIs49[Pwrt-2::TIR-1::tagBFP2-Lox511::tbb-2–3'UTR, IV:5014740–5014802 (cxTi10882 site)] IV; dlg-1(mib23[dlg-1::mCherry-LoxP]) X | |
| Strain, strain background(C. elegans) | BOX494 | This paper | mcIs40 [Plin-26::ABDvab-10::mCherry + Pmyo-2::GFP]; par-6(mib30[par-6::aid::egfp-loxp]) I; mibIs49[Pwrt-2::TIR-1::tagBFP2-Lox511::tbb-2–3'UTR, IV:5014740–5014802 (cxTi10882 site)] IV; heIs63[Pwrt-2::GFP::PH, Pwrt-2::GFP::H2B, Plin-48::mCherry] V | |
| Strain, strain background(C. elegans) | BOX483 | This paper | par-6(mib30[par-6::aid::egfp-loxp]) I; maph-1.1(mib12[egfp::maph-1.1]) I; mibIs49[Pwrt-2::TIR-1::tagBFP2-Lox511::tbb-2–3'UTR, IV:5014740–5014802 (cxTi10882 site)] IV; dlg-1(mib23[dlg-1::mCherry-LoxP]) X | |
| Strain, strain background(C. elegans) | BOX505 | This paper | maph-1.1(mib12[egfp::maph-1.1]) I; pkc-3(mib78[egfp-loxp::aid::pkc-3]) II; mibIs49[Pwrt-2::TIR-1::tagBFP2-Lox511::tbb-2–3'UTR, IV:5014740–5014802 (cxTi10882 site)] IV; dlg-1(mib23[dlg-1::mCherry-LoxP]) X | |
| Strain, strain background(C. elegans) | BOX592 | This paper | maph-1.1(mib12[egfp::maph-1.1]) I; noca-1(ok3692)V/nT1[qIs51](IV;V) | |
| Strain, strain background(C. elegans) | BOX658 | This paper | maph-1.1(mib12)I; par-6(mib24[par-6::egfp-loxp] I; mibIs49[Pwrt-2::TIR-1::tagBFP2-Lox511::tbb-2–3'UTR, IV:5014740–5014802 (cxTi10882 site)]) IV; noca-1(ok3692)V/nT1[qIs51](IV;V) | |
| Strain, strain background(C. elegans) | BOX487 | This paper | par-6(mib25[par-6::mCherry-LoxP]) I; ebp-2(he293[ebp-2::egfp]) II; mibIs49[Pwrt-2::TIR-1::tagBFP2-Lox511::tbb-2–3'UTR, IV:5014740–5014802 (cxTi10882 site)] IV | |
| Strain, strain background(C. elegans) | BOX580 | This paper | ebp-2(he293[ebp-2::egfp]) II; noca-1(ok3692)V/nT1[qIs51](IV;V) | |
| Strain, strain background(C. elegans) | BOX659 | This paper | par-6(mib24[par-6::egfp-loxp] I; ebp-2(he293[ebp-2::egfp]) II; mibIs49[Pwrt-2::TIR-1::tagBFP2-Lox511::tbb-2–3'UTR, IV:5014740–5014802 (cxTi10882 site)]) IV; noca-1(ok3692)V/nT1[qIs51](IV;V) | |
| Strain, strain background(C. elegans) | BOX567 | This paper | par-6(mib30[par-6::aid::egfp-loxp]) I; ltSi540[pOD1343/pSW160; Pnoca-1de::noca-1de::sfGFP; cb-unc-119(+)]II; unc-119(ed3)III; mibIs49[Pwrt-2::TIR-1::tagBFP2-Lox511::tbb-2–3'UTR, IV:5014740–5014802 (cxTi10882 site)] IV | |
| Strain, strain background(C. elegans) | BOX355 | This paper | par-6(mib30[par-6::aid::egfp-loxp]) I; ltSi540[pOD1343/pSW160; Pnoca-1de::noca-1de::sfGFP; cb-unc-119(+)]II; unc-119(ed3)III; ieSi57[eft-3p::TIR1::mRuby::unc-54 3'UTR + Cbr-unc-119(+)] II | |
| Strain, strain background(C. elegans) | BOX568 | This paper | par-6(mib30[par-6::aid::egfp-loxp]) I; gip-1(wow25[tagRFP-t::3xMyc::gip-1]) III; mibIs49[Pwrt-2::TIR-1::tagBFP2-Lox511::tbb-2–3'UTR, IV:5014740–5014802 (cxTi10882 site)] IV | |
| Strain, strain background(C. elegans) | BOX502 | This paper | par-6(mib30[par-6::aid::egfp-loxp]) I; mibIs49[Pwrt-2::TIR-1::tagBFP2-Lox511::tbb-2–3'UTR, IV:5014740–5014802 (cxTi10882 site)] IV; dlg-1(mib23[dlg-1::mCherry-LoxP]) X; ptrn-1(wow4[PTRN-1::GFP]) X | |
| Strain, strain background(C. elegans) | BOX657 | This paper | pkc-3(mib78[egfp-loxp::aid::pkc-3]) II; Pnoca-1de::noca-1de::superfolderGFP; cb-unc-119(+)II; unc-119(ed3)III; mibIs49[Pwrt-2::TIR-1::tagBFP2-Lox511::tbb-2–3'UTR, IV:5014740–5014802 (cxTi10882 site)] IV | |
| Strain, strain background(C. elegans) | BOX579 | This paper | gip-1(wow25[tagRFP-t::3xMyc::gip-1]) III; noca-1(ok3692)V/nT1[qIs51](IV;V) | |
| Strain, strain background(C. elegans) | BOX561 | This paper | par-6(mib30[par-6::aid::egfp-loxp]) I; mibIs49[Pwrt-2::TIR-1::tagBFP2-Lox511::tbb-2–3'UTR, IV:5014740–5014802 (cxTi10882 site)] IV; mibEx221(Pdpy-7::par-6::mch) | |
| Strain, strain background(C. elegans) | BOX563 | This paper | par-6(mib30[par-6::aid::egfp-loxp]) I; mibIs49[Pwrt-2::TIR-1::tagBFP2-Lox511::tbb-2–3'UTR, IV:5014740–5014802 (cxTi10882 site)] IV; heIs63[Pwrt-2::GFP::PH, Pwrt-2::GFP::H2B, Plin-48::mCherry] V; mibEx222(Pdpy-7::par-6::mch; Pmyo-2::egfp) | |
| Strain, strain background(C. elegans) | BOX608 | This paper | pw27[nekl-2::aid];pwSi10[phyp7::bfp::tir-1];pw17[chc-1::GFP]; mibEx223(Pwrt-2::mCh::H2B; Pwrt-2::mCh::PH) | |
| Strain, strain background(C. elegans) | BOX447 | This paper | pkc-3(mib78[egfp-loxp::aid::pkc-3]) II; mibIs48[Pelt-2::TIR-1::tagBFP2-Lox511::tbb-2–3'UTR, IV:5014740–5014802 (cxTi10882 site)] IV; mibIs23 [lgl-1::GFP-2TEV-Avi 10 ng + Pmyo-3::mCherry 10 ng + lambda DNA 60 ng] V | |
| Strain, strain background(C. elegans) | BOX431 | This paper | par-6(mib30[par-6::aid::egfp-loxp]) I; mibIs48[Pelt-2::TIR-1::tagBFP2-Lox511::tbb-2–3'UTR, IV:5014740–5014802 (cxTi10882 site)] IV; dlg-1(mib23[dlg-1::mCherry-LoxP]) X | |
| Strain, strain background(C. elegans) | BOX406 | This paper | par-6(mib30[par-6::aid::egfp-loxp]) I; pkc-3(mib80[mcherry-loxp::pkc-3]) II; mibIs48[Pelt-2::TIR-1::tagBFP2-Lox511::tbb-2–3'UTR, IV:5014740–5014802 (cxTi10882 site)] IV | |
| Strain, strain background(C. elegans) | BOX653 | This paper | par-6(mib24[par-6::egfp-loxp] I; pkc-3(mib78[egfp-loxp::aid::pkc-3]) II; mibIs48[Pelt-2::TIR-1::tagBFP2-Lox511::tbb-2–3'UTR, IV:5014740–5014802 (cxTi10882 site)]) IV | |
| Strain, strain background(C. elegans) | BOX411 | This paper | par-6(mib30[par-6::aid::egfp-loxp]) I; pkc-3(mib80[mcherry-loxp::pkc-3]) II; mibIs49[Pwrt-2::TIR-1::tagBFP2-Lox511::tbb-2–3'UTR, IV:5014740–5014802 (cxTi10882 site)] IV | |
| Strain, strain background(C. elegans) | BOX578 | This paper | par-6(mib30[par-6::aid::egfp-loxp]) I; par-3(it300[par-3::mcherry]) III; mibIs49[Pwrt-2::TIR-1::tagBFP2-Lox511::tbb-2–3'UTR, IV:5014740–5014802 (cxTi10882 site)] IV | |
| Strain, strain background(C. elegans) | BOX484 | This paper | par-6(mib25[par-6::mCherry-LoxP]) I; pkc-3(mib78[egfp-loxp::aid::pkc-3]) II; mibIs49[Pwrt-2::TIR-1::tagBFP2-Lox511::tbb-2–3'UTR, IV:5014740–5014802 (cxTi10882 site)] IV | |
| Strain, strain background(C. elegans) | BOX485 | This paper | pkc-3(mib78[egfp-loxp::aid::pkc-3]) II; par-3(it300[par-3::mcherry]) III; mibIs49[Pwrt-2::TIR-1::tagBFP2-Lox511::tbb-2–3'UTR, IV:5014740–5014802 (cxTi10882 site)] IV | |
| Strain, strain background(C. elegans) | BOX486 | This paper | par-6(mib25[par-6::mCherry-LoxP]) I; par-3(mib68[eGFP-Lox2272::AID::par-3b+eGFP(noIntrons)-LoxP::AID::par-3g]) III; mibIs49[Pwrt-2::TIR-1::tagBFP2-Lox511::tbb-2–3'UTR, IV:5014740–5014802 (cxTi10882 site)] IV | |
| Strain, strain background(C. elegans) | BOX492 | This paper | pkc-3(it309[GFP::pkc-3]) II; par-3(mib68[eGFP-Lox2272::AID::par-3b+eGFP(noIntrons)-LoxP::AID::par-3g]) III; mibIs49[Pwrt-2::TIR-1::tagBFP2-Lox511::tbb-2–3'UTR, IV:5014740–5014802 (cxTi10882 site)] IV | |
| Strain, strain background(C. elegans) | AW1015 | Hughes et al., 2014 | RRID:WB-STRAIN:WBStrain00042230 | ouIs10[Pscm::NLS::tdTomato(pAW584)+Pwrt2::GFP::PH(pAW561)+Pdpy-7::2xNLS::YFP(pAW516)] I |
| Strain, strain background(C. elegans) | BOX188 | Waaijers et al., 2016 | maph-1.1(mib12[egfp::maph-1.1]) I | |
| Strain, strain background(C. elegans) | CA1200 | CGC | RRID:WB-STRAIN:WBStrain00004055 | ieSi57[eft-3p::TIR1::mRuby::unc-54 3'UTR + Cbr-unc-119(+)] II; unc-119(ed3) III |
| Strain, strain background(C. elegans) | GR1395 | Hayes et al., 2006 | RRID:WB-STRAIN:WBStrain00007913 | mgIs49 [mlt-10::GFP-pest; ttx-1::GFP] |
| Strain, strain background(C. elegans) | JLF15 | Jessica Feldman | ptrn-1(wow4[PTRN-1::GFP]) X | |
| Strain, strain background(C. elegans) | JLF173 | Jessica Feldman | gip-1(wow25[tagRFP-t::3xMyc::gip-1]) III | |
| Strain, strain background(C. elegans) | KK1218 | CGC | RRID:WB-STRAIN:WBStrain00023582 | par-3(it300[par-3::mCherry]) III |
| Strain, strain background(C. elegans) | KK1228 | CGC | RRID:WB-STRAIN:WBStrain00023583 | pkc-3(it309[GFP::pkc-3]) II |
| Strain, strain background(C. elegans) | KK1262 | CGC | RRID:WB-STRAIN:WBStrain00023586 | par-1 (it324[par-1::gfp::par-1 exon 11a]) |
| Strain, strain background(C. elegans) | ML916 | CGC | RRID:WB-STRAIN:WBStrain00026581 | mcIs40 [Plin-26::ABDvab-10::mCherry + Pmyo-2::GFP] |
| Strain, strain background(C. elegans) | OD1652 | Karen Oegema | RRID:WB-STRAIN:WBStrain00044359 | ltSi540[pOD1343/pSW160; Pnoca-1de::noca-1de::sfGFP; cb-unc-119(+)]II; unc-119(ed3)III |
| Strain, strain background(C. elegans) | RT3638 | David Fay | pw27[nekl-2::aid];pwSi10[phyp7::bfp::tir-1];pw17[chc-1::GFP] | |
| Strain, strain background(C. elegans) | SV1009 | Wildwater et al., 2011 | RRID:WB-STRAIN:WBStrain00034608 | heIs63[Pwrt-2::GFP::PH, Pwrt-2::GFP::H2B, Plin-48::mCherry]V |
| Strain, strain background(C. elegans) | SV1937 | Sander van den Heuvel | ebp-2(he293[ebp-2::egfp]) II | |
| Strain, strain background(C. elegans) | VC2998 | CGC | RRID:WB-STRAIN:WBStrain00037614 | noca-1(ok3692)V/nT1[qIs51](IV;V) |
| Strain, strain background(C. elegans) | CA1352 | RRID:WB-STRAIN:WBStrain00004071 | ieSi64 [gld-1p::TIR1::mRuby::gld-1 3’UTR + Cbr-unc-119(+)] II | |
| Strain, strain background(C. elegans) | STR320 | Martin Harterink | maph-1.1(mib15[GFPKI]);hrtEx110[Pptrn-1::ebp-2::mKate2; Pmyo-2::tdTom] | |
| Recombinant DNA reagent | Plasmid: pJJR82 | Addgene | #75027 | EGFP^SEC^3xFlag vector with ccdB markers for cloning homology arms |
| Recombinant DNA reagent | Plasmid: pJJR83 | Addgene | #75028 | mCherry^SEC^3xFlag vector with ccdB markers for cloning homology arms |
| Recombinant DNA reagent | Plasmid: pMLS257 | Addgene | #73716 | SapTrap destination vector for building repair template only vectors |
| Recombinant DNA reagent | Plasmid: pDD379 | Addgene | #91834 | SapTrap destination vector for building combined sgRNA expression + repair template vectors, using the F+E sgRNA scaffold |
| Recombinant DNA reagent | Plasmid: pJJR50 | Addgene | #75026 | U6 promoter driven flipped + extended sgRNA expression vector |
| Recombinant DNA reagent | Plasmid: Peft-3::cas9 | Addgene | #46168 | codon optimized Cas9_SV40 NLS with intron |
| Recombinant DNA reagent | Plasmid: Pdpy-7::par-6::mCherry | This paper | Plasmid for expression of PAR-6::mCherry in the hypodermis (Figure 3—figure supplement 2). Full sequence in Supplementary file 1. | |
| Recombinant DNA reagent | Plasmid: PAR-6 PDZ in pMB28 | This paper | Yeast expression plasmid of PAR-6 PDZ fused to Gal4 DNA binding domain (Figure 6—figure supplement 1). Full sequence in Supplementary file 1. | |
| Recombinant DNA reagent | Plasmid: NOCA-1d in pMB29 | This paper | Yeast expression plasmid of NOCA-1d fused to Gal4 activation domain (Figure 6—figure supplement 1). Full sequence in Supplementary file 1. | |
| Sequence-based reagent | par-6 sgRNA | gacgcaaatgacagtgatagTGG | sgRNA target site used to engineer the par-6 locus. PAM site in uppercase. | |
| Sequence-based reagent | pkc-3 sgRNA | tgggtctccgacatcattagAGG | sgRNA target site used to engineer the pkc-3 locus. PAM site in uppercase. | |
| Sequence-based reagent | par-3 sgRNA 1 | tttcagatcgatcatcatgtCGG | sgRNA target site used to target the par-3 locus. PAM site in uppercase. | |
| Sequence-based reagent | par-3 sgRNA 2 | cacatgcataacggtcgtggTGG | sgRNA target site used to target the par-3 locus. PAM site in uppercase. | |
| Sequence-based reagent | dlg-1 sgRNA | gccacgtcattagatgaaatTGG | sgRNA target site used to target the dlg-1 locus. PAM site in uppercase. | |
| Sequence-based reagent | mos IV 5013690.5015700 sgRNA | agctcaatcgtgtacttgcgTGG | sgRNA target site for LG IV position 5013690.5015700, used to insert TIR-1 expression cassette. PAM site in uppercase. | |
| Sequence-based reagent | ebp-2 sgRNA 1 | gcaggcaaatctggacgataCGG | sgRNA target site used to edit the ebp-2 locus. | |
| Sequence-based reagent | ebp-2 sgRNA 2 | tacggggataggataagcaaTGG | sgRNA target site used to edit the ebp-2 locus. | |
| Sequence-based reagent | Pdpy-7_F | This paper | PCR primers | TGTAATACGACTCACTATAGGGCGAATTGGctcattccacgatttctcgc. See Materials and methods section ‘PAR-6::mCherry transgenic array’ for usage details. |
| Sequence-based reagent | Pdpy-7_R | This paper | PCR primers | tctggaacaaaatgtaagaatattc See Materials and methods section ‘PAR-6::mCherry transgenic array’ for usage details. |
| Sequence-based reagent | par-6_F1 | This paper | PCR primers | tttaagaatattcttacattttgttccagaATGTCCTACAACGGCTCCTA See Materials and methods section ‘PAR-6::mCherry transgenic array’ for usage details. |
| Sequence-based reagent | par-6_R1 | This paper | PCR primers | GGCCATGTTGTCCTCCTCTCCCTTGGACATGTCCTCTCCACTGTCCGAAT See Materials and methods section ‘PAR-6::mCherry transgenic array’ for usage details. |
| Sequence-based reagent | par-6_UTR_F | This paper | PCR primers | CACTCCACCGGAGGAATGGACGAGCTCTACTGAaaaactcttttcagcca See Materials and methods section ‘PAR-6::mCherry transgenic array’ for usage details. |
| Sequence-based reagent | par-6_UTR_R | This paper | PCR primers | TAAAGGGAACAAAAGCTGGAGCTCCACCGCgaaataaataatttattctc See Materials and methods section ‘PAR-6::mCherry transgenic array’ for usage details. |
| Sequence-based reagent | mCherry_F | This paper | PCR primers | TCCAAGGGAGAGGAGGACAA See Materials and methods section ‘PAR-6::mCherry transgenic array’ for usage details. |
| Sequence-based reagent | mCherry_R | This paper | PCR primers | GTAGAGCTCGTCCATTCCTC See Materials and methods section ‘PAR-6::mCherry transgenic array’ for usage details. |
| Sequence-based reagent | par-6_F2 | This paper | PCR primers | ggaggcgcgccATGATTGTGCCAGAAGCTCATCG See Materials and methods section ‘yeast two-hybrid’ analysis for usage details. |
| Sequence-based reagent | par-6_R2 | This paper | PCR primers | ggagcggccgcTCAGGCGTTCGGTGTTCCTTGTT See Materials and methods section ‘yeast two-hybrid’ analysis for usage details. |
| Sequence-based reagent | noca-1d_F | This paper | PCR primers | ggaggcgcgccATGAATATTTGTTGTTGTGG See Materials and methods section ‘yeast two-hybrid’ analysis for usage details. |
| Sequence-based reagent | noca-1d_R | This paper | PCR primers | ggagcggccgcCTATTGAACTCTGCATACAT. See Materials and methods section ‘yeast two-hybrid’ analysis for usage details. |
Additional files
-
Supplementary file 1
A zip archive containing the DNA sequences of genome edits and plasmids described in this paper in genbank and SnapGene format.
- https://cdn.elifesciences.org/articles/62067/elife-62067-supp1-v2.zip
-
Transparent reporting form
- https://cdn.elifesciences.org/articles/62067/elife-62067-transrepform-v2.docx
Download links
A two-part list of links to download the article, or parts of the article, in various formats.
Downloads (link to download the article as PDF)
Open citations (links to open the citations from this article in various online reference manager services)
Cite this article (links to download the citations from this article in formats compatible with various reference manager tools)
Epidermal PAR-6 and PKC-3 are essential for larval development of C. elegans and organize non-centrosomal microtubules
eLife 9:e62067.
https://doi.org/10.7554/eLife.62067


