Celsr1 adhesive interactions mediate the asymmetric organization of planar polarity complexes
- Department of Molecular Biology, Princeton University, United States
Figures
Figure 1 with 1 supplement
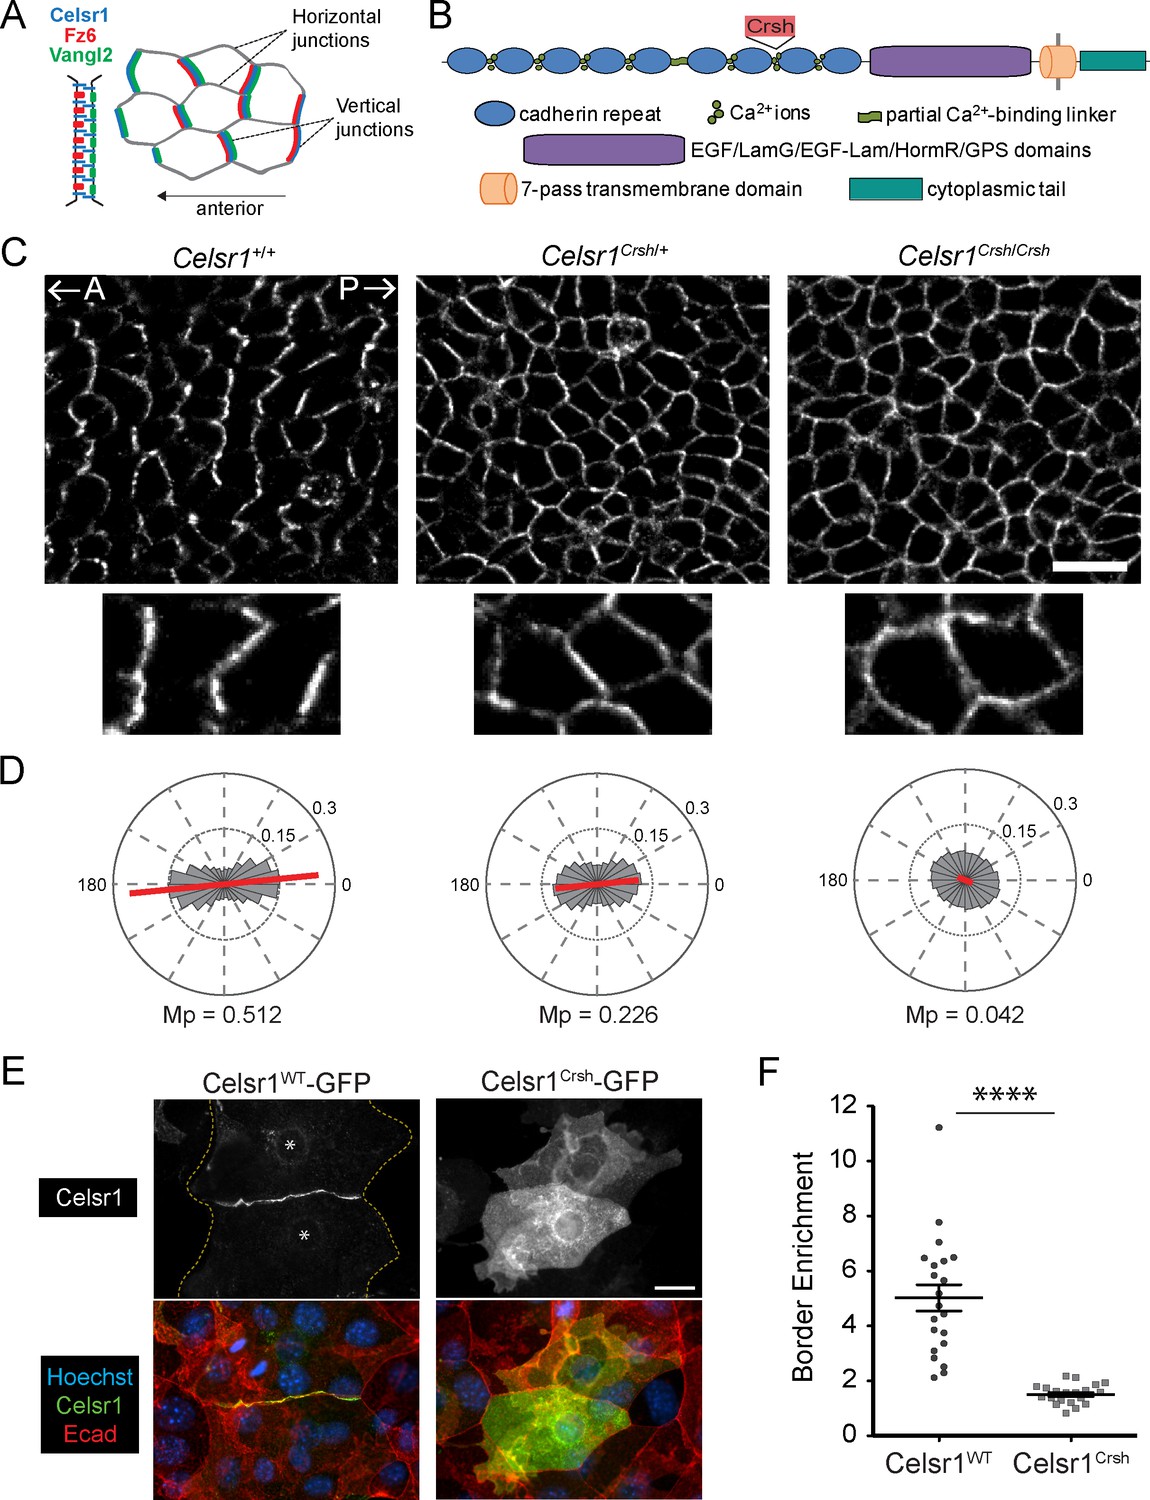
Planar cell polarity (PCP)-disrupting mutation Celsr1Crsh perturbs Celsr1 polarity in the epidermis and reduces border enrichment in keratinocytes.
(A) Schematics of core transmembrane PCP proteins at a cell–cell junction and their polarized localization at vertical junctions in the epidermis. (B) Schematic of Celsr1 protein domain organization with emphasis on the extracellular cadherin repeats. Non-cadherin repeat domains shown as collective purple region. Not drawn to scale. Location of Crash (Celsr1Crsh, D1040G) mutation indicated by red text box. (C) Planar confocal section through the basal layer of whole-mount back skin from E15.5 Celsr1+/+, Celsr1Crsh/+, and Celsr1Crsh/Crsh embryos stained for Celsr1. A, anterior; P, posterior. Scale bar, 20 µm. (D) Quantification of Celsr1 polarity. Mp indicates the magnitude of polarity. Celsr1+/+, five embryos (9010 cells); Celsr1Crsh/+, six embryos (11,614 cells); Celsr1Crsh/Crsh, five embryos (13,892 cells). (E) Cultured mouse keratinocytes transfected with Celsr1WT-GFP or Celsr1Crsh-GFP and switched to high calcium for 24 hr. For the cell pair expressing Celsr1WT-GFP, yellow dashed lines indicate outline of cells and * denotes location of nuclei. Scale bar, 20 µm. (F) Celsr1 border enrichment quantification (two-tailed unpaired t-test with Welch’s correction, ****p<0.0001; n = 21 cell pairs).
-
Figure 1—source data 1
Data accompanying Figure 1.
- https://cdn.elifesciences.org/articles/62097/elife-62097-fig1-data1-v1.xlsx
Figure 1—figure supplement 1
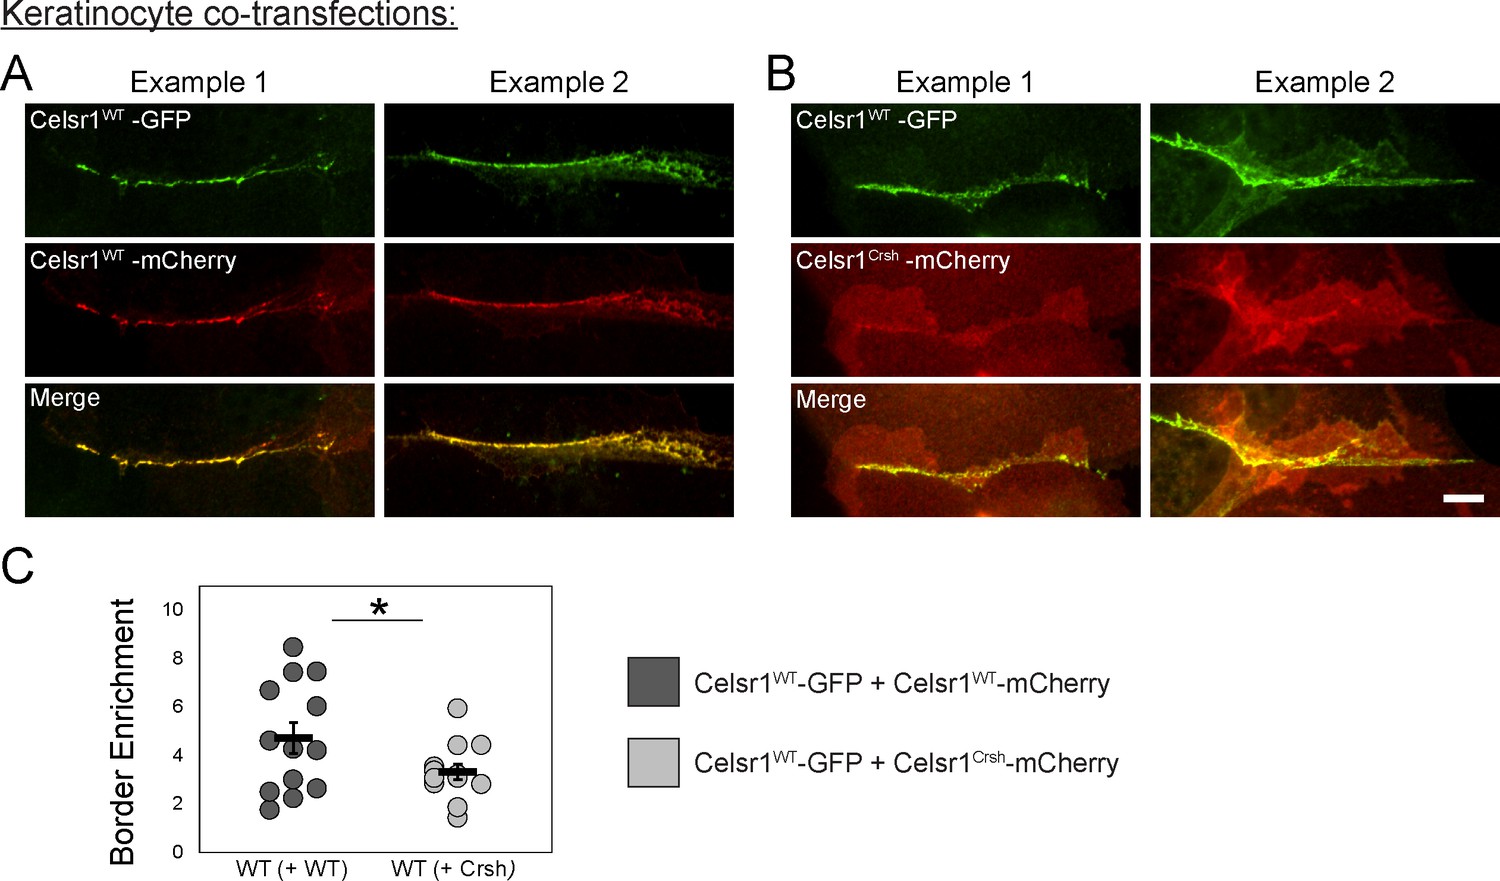
Celsr1Crsh does not enrich at keratinocyte cell borders when co-expressed with Celsr1WT and acts as a partial dominant negative.
(A and B) Cultured mouse keratinocytes were co-transfected with Celsr1WT-GFP and mCherry variants of either Celsr1WT (A) or Celsr1Crsh (B). Cells were switched to 1.5 mM calcium for 24 hr. Images are cropped and rotated to display cell border with horizontal orientation. Scale bar, 10 µm. See Figure 7—figure supplement 1B for additional Celsr1WT/Celsr1Crsh co-transfection examples. (C) Cell border enrichment of CelsrWT quantification (one-tailed unpaired t-test, *p=0.032; two-tailed unpaired t-test, p=0.063; n = 13 cell pairs).
Figure 2 with 2 supplements
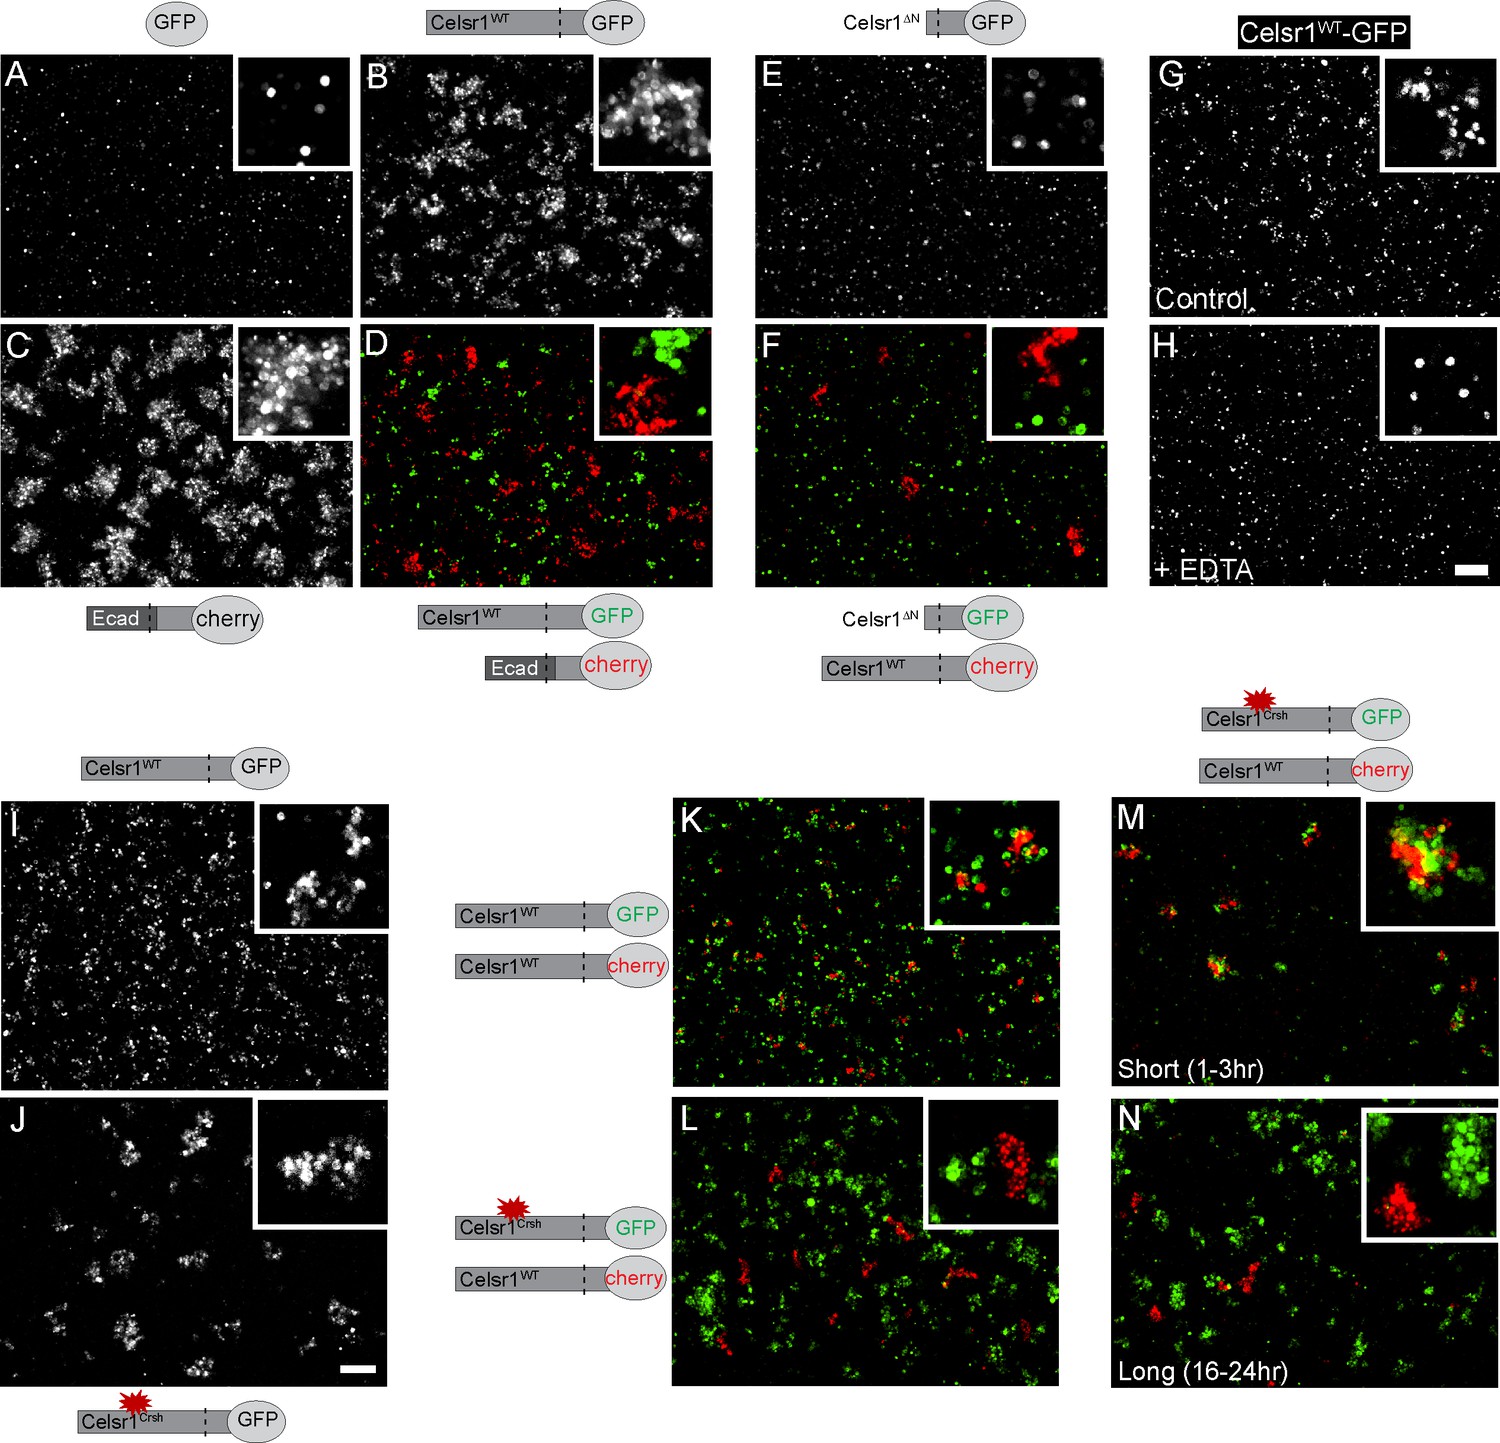
Celsr1WT and Celsr1Crsh mediate cell adhesion but do not form stable homotypic contacts between cells.
Cell aggregation assay. K-562 cells stably expressing protein variants indicated were assayed for their ability to induce cell aggregation, or cell adhesion. (A–D) Cells expressing GFP (A), Celsr1WT-GFP (B), EcadECD+TM-Celsr1CT-mCherry (C) or Celsr1WT-GFP mixed with EcadECD+TM-Celsr1CT-mCherry (D) imaged live following a 1.5 hr aggregation. Ecad, E-cadherin; ECD, extracellular domain; TM, transmembrane domain; CT, cytoplasmic tail. (E and F) Cells expressing Celsr1ΔN-GFP (E) or Celsr1ΔN-GFP mixed with Celsr1-mCherry (F) imaged fixed following a 3 hr aggregation. ΔN, lacking nearly the entire N-terminal extracellular domain. (G and H) Celsr1WT-GFP expressing cells incubated in either media alone or media containing 10 mM EDTA (calcium chelator) during a 2 hr aggregation. (I and J) K-562 cells expressing Celsr1WT or Celsr1Crsh mediate adhesion by the formation of cell aggregates. (K and L) Celsr1WT-GFP and Celsr1Crsh-GFP expressing K-562 cells were mixed for 16–24 hr with Celsr1WT-mCherry expressing cells. (M and N) Mixed cell aggregation assay between K-562 cells expressing either Celsr1Crsh-GFP or Celsr1WT-mCherry for incubation periods indicated (short, 1–3 hr or long, 16–24 hr). Scale bar, 200 µm.
-
Figure 2—source data 1
Data accompanying Figure 2.
- https://cdn.elifesciences.org/articles/62097/elife-62097-fig2-data1-v1.xlsx
Figure 2—figure supplement 1
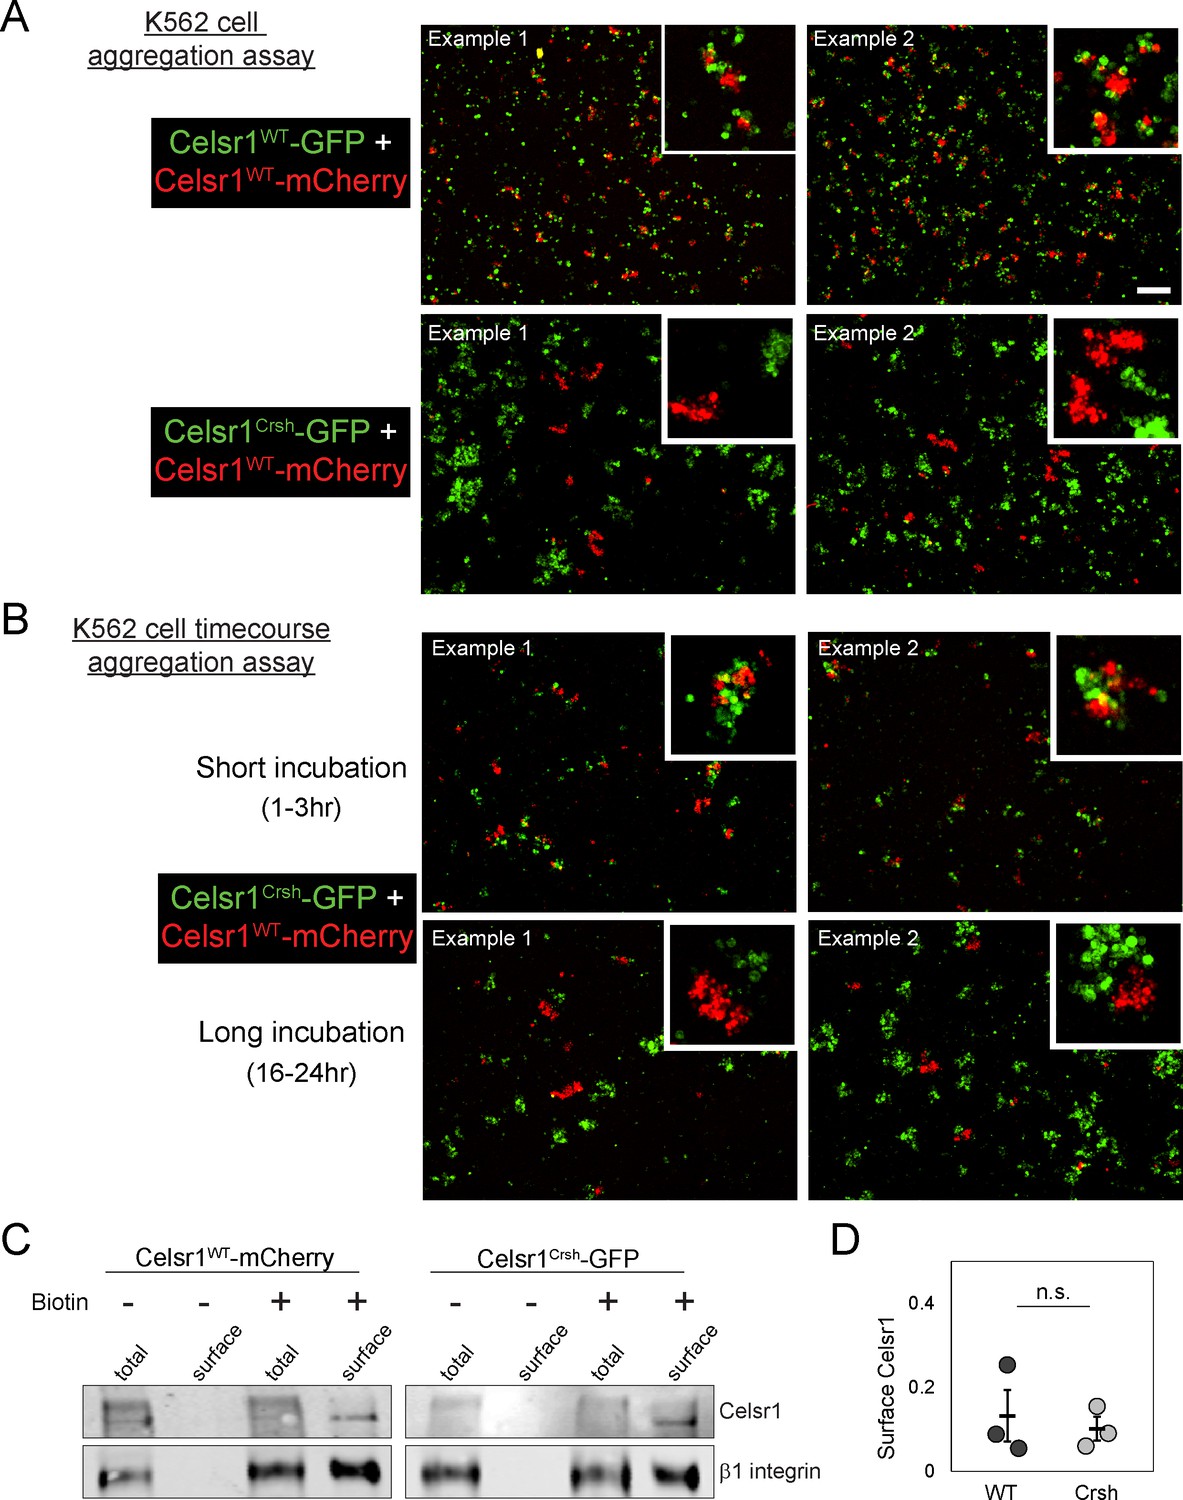
Celsr1Crsh does not form stable trans-interactions with Celsr1WT in K-562 cells.
(A) Additional examples of mixed cell aggregation assay between K-562 cells expressing Celsr1WT-mCherry and either Celsr1WT-GFP or Celsr1Crsh-GFP. (B) Additional examples of mixed cell aggregation assay between K-562 cells expressing either Celsr1Crsh-GFP or Celsr1WT-mCherry for incubation periods indicated (short, 1–3 hr or long, 16–24 hr). Scale bar, 200 µm. (C) Cell surface biotinylation assay. Biotinylated surface proteins from K-562 cells expressing Celsr1WT-mCherry or Celsr1Crsh-GFP were recovered with streptavidin-coated beads and analyzed by western blot. (D) Quantification of relative Celsr1 surface levels (normalized to control surface protein β1 integrin; two-tailed unpaired t-test, p=0.687; n = 3).
Figure 2—figure supplement 2

Celsr1Crsh does not form stable trans-interactions with Celsr1WT in keratinocytes.
Cultured mouse keratinocytes transfected with Celsr1WT-GFP were mixed with keratinocytes transfected with mCherry-tagged variants of either Celsr1WT (WT-WT mixed border) or Celsr1Crsh (WT-Crsh mixed border). Cells were switched to 1.5 mM calcium for 24 hr. Images are cropped and rotated to display cell border with horizontal orientation. Celsr1WT-GFP is displayed as the top cell in each cell pair, whereas mCherry-tagged Celsr1 variants are displayed as the bottom cell of each pair. Scale bar, 10 µm. See Figure 7—figure supplement 1C for additional Celsr1WT/Celsr1Crsh mixed-cell border examples.
Figure 3
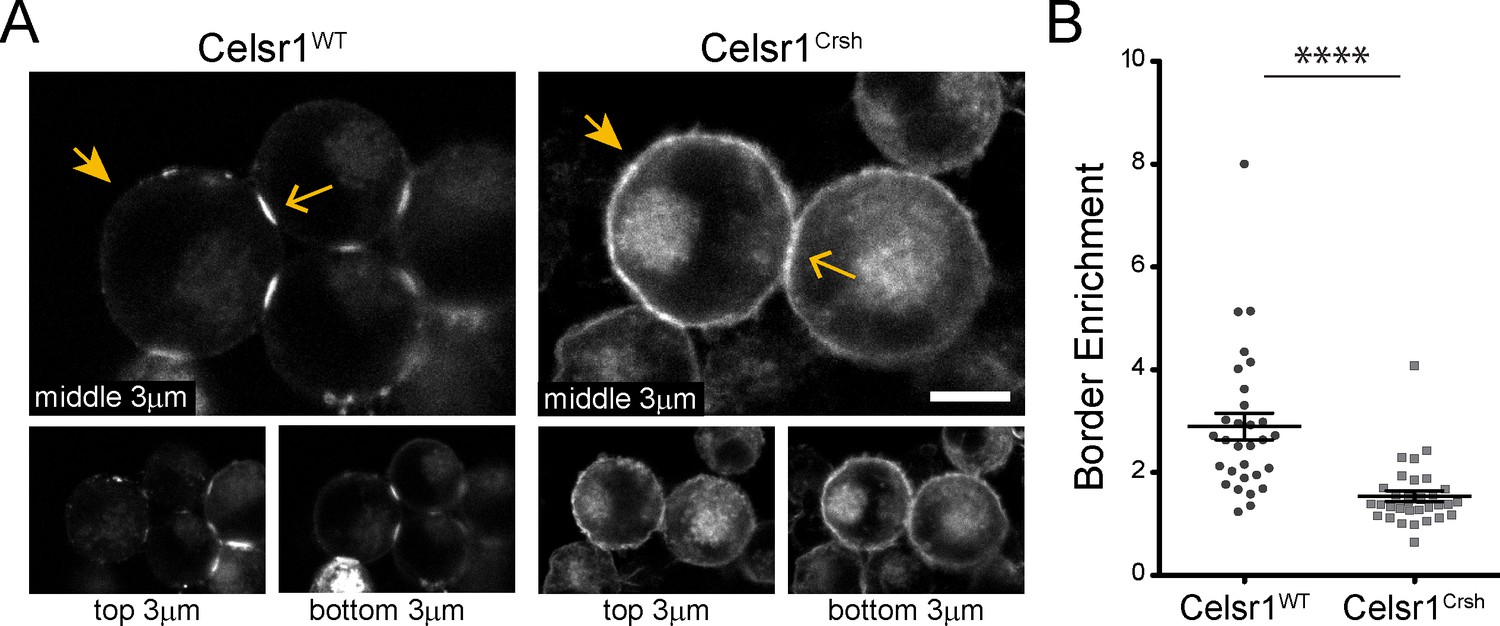
Celsr1Crsh displays altered surface distribution and border enrichment in K-562 cells.
(A) Confocal max projections (3 µm each from top, middle and bottom of cell aggregate) of GFP tagged Celsr1WT and Celsr1Crsh aggregates. Scale bar, 10 µm. (B) Border enrichment quantification (Celsr1Crsh border enrichment reduced 46.8%; two-tailed unpaired t-test with Welch’s correction, ****p<0.0001; Celsr1WT, n = 30; Celsr1Crsh, n = 33).
-
Figure 3—source data 1
Data accompanying Figure 3.
- https://cdn.elifesciences.org/articles/62097/elife-62097-fig3-data1-v1.xlsx
Figure 4 with 2 supplements
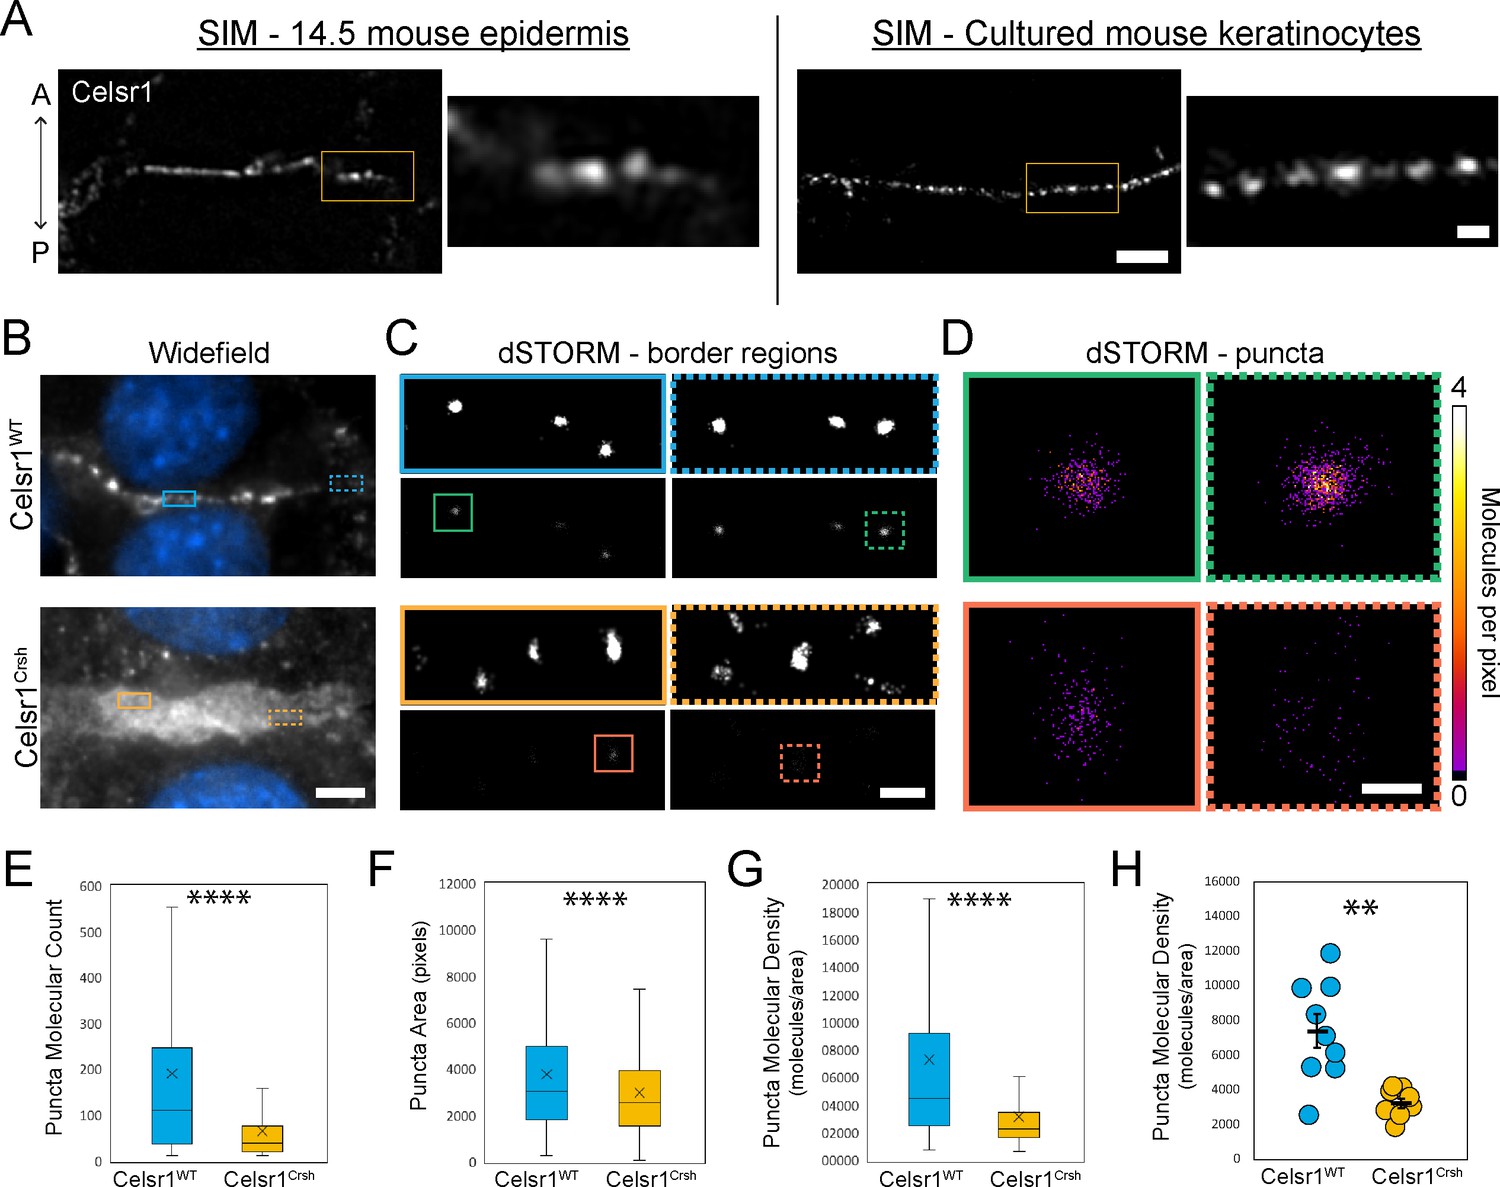
Celsr1Crsh disrupts the subcellular organization of Celsr1 puncta in keratinocytes as assessed by dSTORM.
(A) Super-resolution structured illumination microscopy (SIM) images of single cell borders, stained for Celsr1, in E14.5 mouse epidermis and cultured mouse keratinocytes (cell line stably over-expressing Celsr1-mNeonGreen switched to 1.5 mM calcium for 8 hr). Images rotated to display border with horizontal orientation, and thus the epidermis image is oriented with a vertical A-P axis. Scale bar, 2 µm (inset 0.5 µm). (B) Widefield images of cell–cell border between Celsr1WT or Celsr1Crsh transfected cells. Scale bar, 5 µm. (C) dSTORM reconstruction with Gaussian (top panels) or molecular density (bottom panels) rendering of border regions highlighted in panel A. Scale bar, 500 nm. (D) dSTORM reconstruction with molecular density rendering of individual puncta highlighted in B. Scale bar, 100 nm. (E–G) Quantification of molecule count (E), area in pixels (F), and density (G) per puncta. Outliers not displayed. Box displays first and third quartile with mean represented by ‘x’. Celsr1WT, n = 268; Celsr1Crsh, n = 782; two-tailed unpaired t-test, ****p<0.0001. (H) Scatter-plot of average puncta density per cell border. Black overlay represents mean ± standard error. Celsr1WT, n = 9; Celsr1Crsh, n = 8. **p=0.0029.
-
Figure 4—source data 1
Data accompanying Figure 4.
- https://cdn.elifesciences.org/articles/62097/elife-62097-fig4-data1-v1.xlsx
Figure 4—figure supplement 1
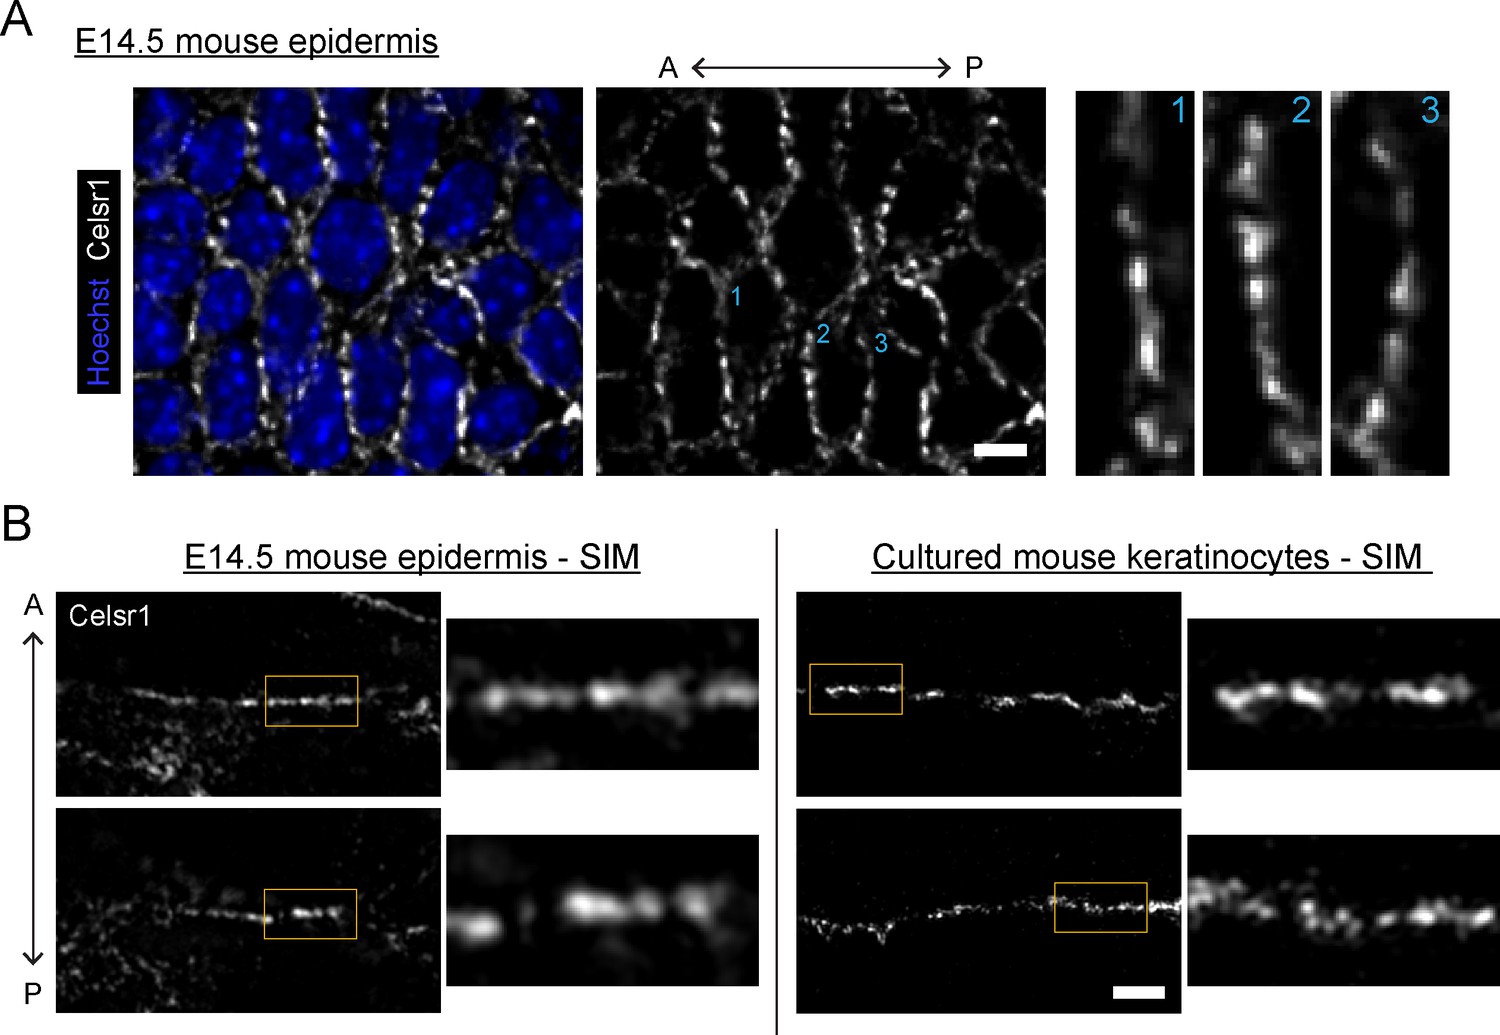
Celsr1 distribution in epidermis and cultured keratinocytes is punctate.
(A) Planar confocal (60×) section of the basal layer of E14.5 mouse epidermis stained for Celsr1. Image oriented anterior to the left, Celsr1 localizes primarily to vertical borders and displays punctate distribution along cell borders. Single border enlargements highlighted to the right and indicated by blue number in the upper right of each border. Scale bar, 5 µm. (B) Super-resolution structured illumination microscopy (SIM) images of single cell borders, stained for Celsr1, in E14.5 mouse epidermis and cultured mouse keratinocytes (cell line stably over-expressing Celsr1-mNeonGreen switched to 1.5 mM calcium for 8 hr). All images rotated to display border with horizontal orientation. Epidermis with vertical A×P axis in contrast to ‘A’. Whole borders shown for epidermis borders, whereas cultured keratinocyte borders cropped to maintain similar region of interest to epidermis. Two representative examples are shown for each. Scale bar, 2 µm (inset 0.5 µm).
Figure 4—figure supplement 2
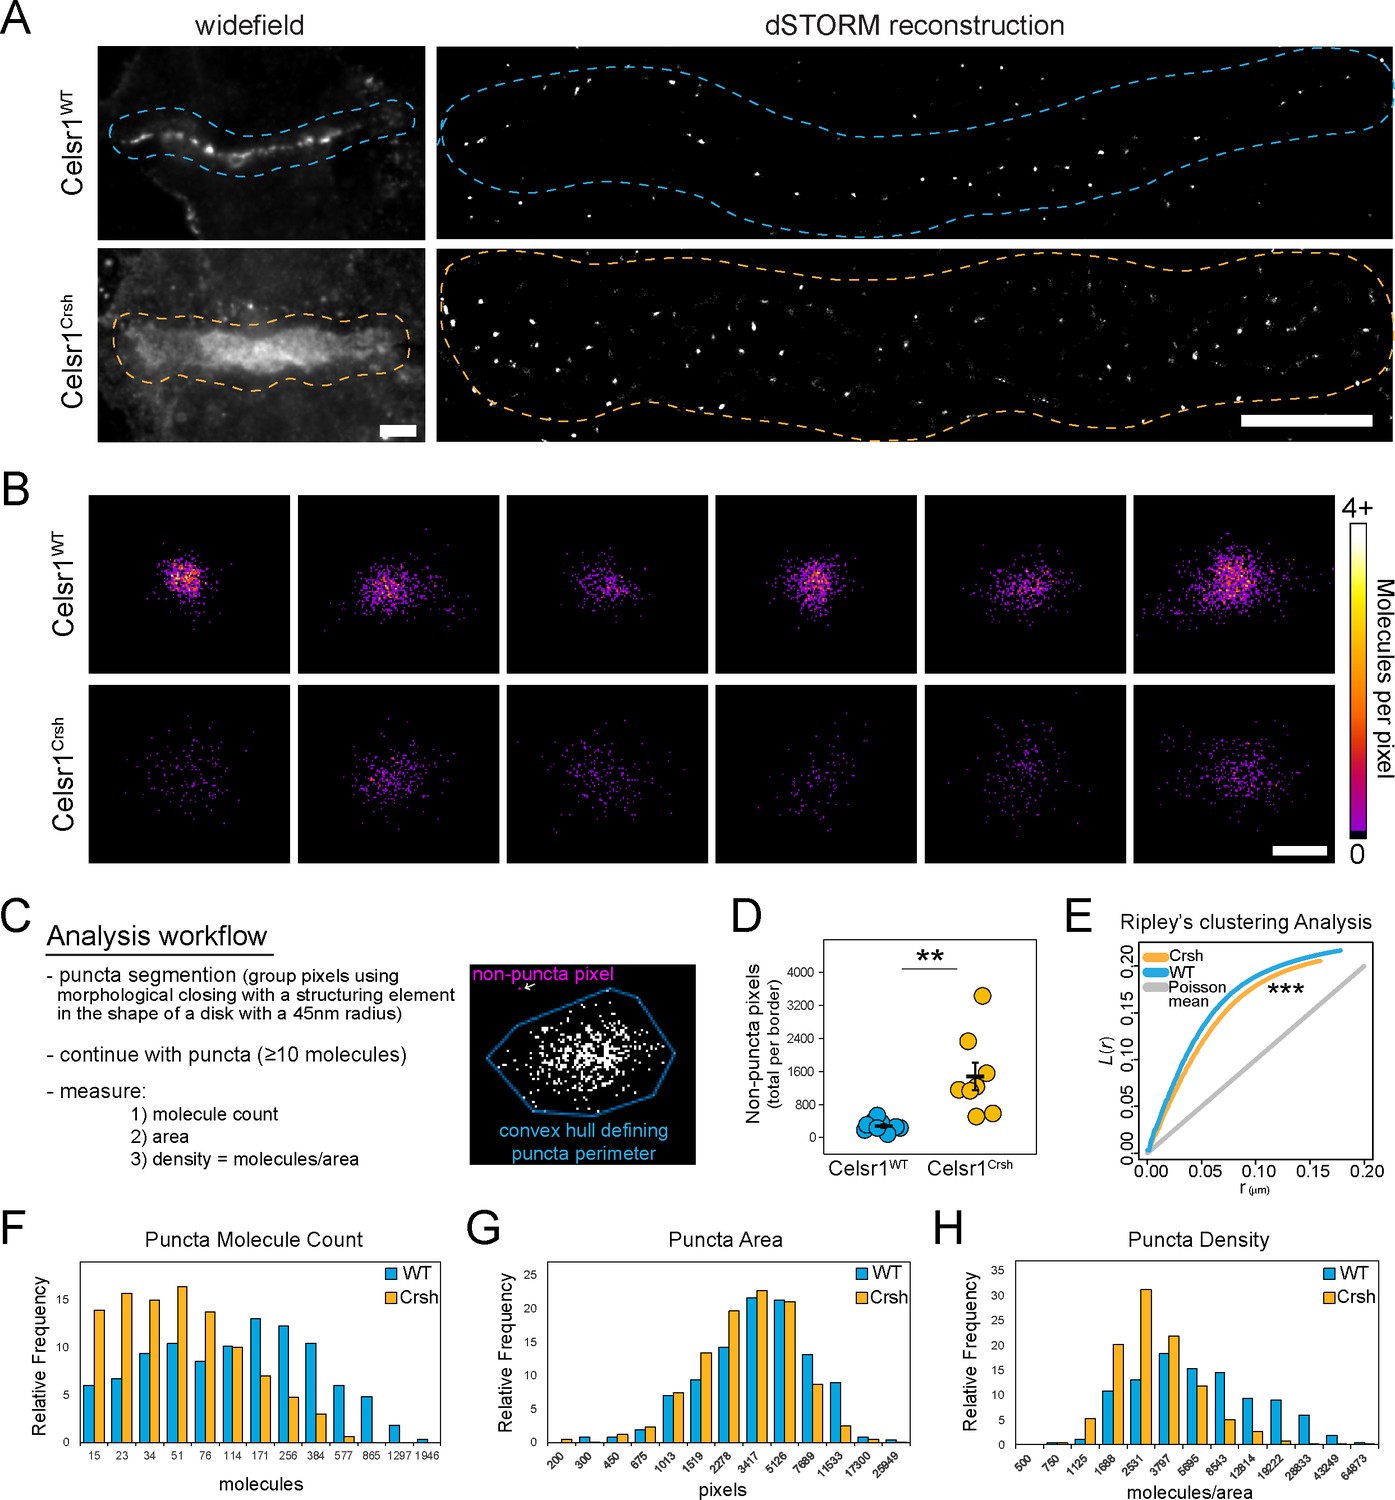
Celsr1Crsh disrupts the subcellular organization of Celsr1 in keratinocytes.
(A) Full dSTORM border reconstruction (Gaussian rendering) of those shown in Figure 5. Dashed line highlights cell–cell border interface region. Scale bars, 5 µm. (B) Additional examples of individual puncta (molecular density rendering) from cell borders not shown. Scale bar, 100 nm. (C) Overview of analysis workflow. See Materials and methods for additional details. (D) Quantification of pixels per border that did not identify within a puncta per outlined criteria. **p=0.01. (E) Ripley’s spatial cluster analysis. ***p=0.001, Celsr1WT vs. Celsr1Crsh. (F–H) Histogram representation of molecules (F), area (G), and density (H) per puncta.
Figure 5 with 2 supplements
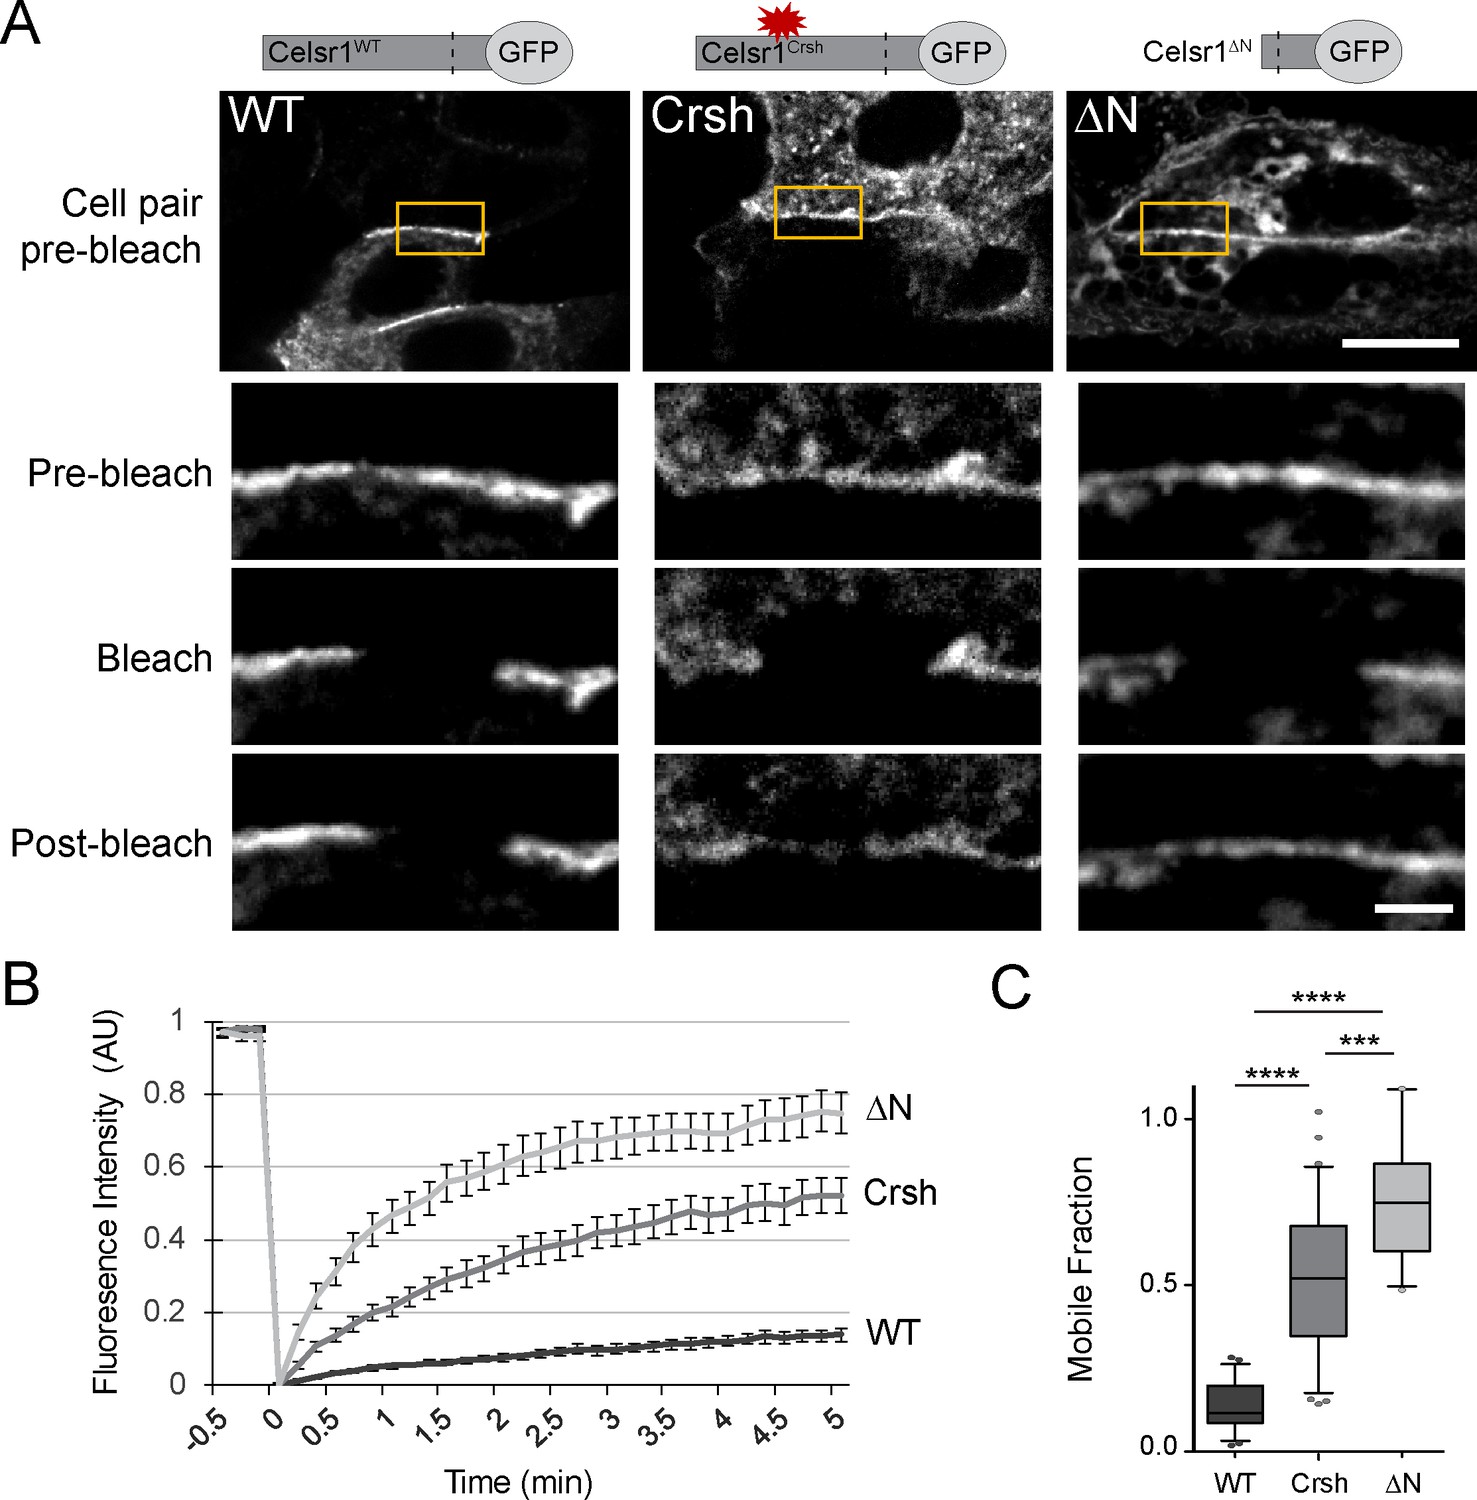
Celsr1Crsh displays increased mobility.
(A) Representative images of FRAP performed on cultured keratinocytes transfected with the Celsr1-GFP variants indicated. Yellow box highlights regions (~3–4 µm in length) along cell borders that were photobleached. Images were acquired every 10 s for 5 min. Images rotated to display all borders horizontally with magnifications of borders below for the time points indicated. Pre-bleach and post-bleach images shown are at −10 s and 5 min respectively. Scale bars, 10 µm; insets, 2 µm. (B) Normalized FRAP recovery curves. AU, arbitrary units. (C) Mobile fraction quantification (normalized to 1, box and whisker plot, box displaying first quartile, mean, and third quartile). Mean ± standard error: WT (13.6 ± 1.61%, n = 23), Crsh (50.7 ± 3.9%, n = 33), and ΔN (74.7 ± 4.2%, n = 18) border regions. Two-tailed, unpaired t-tests with Welch’s correction: WT vs Crsh, ***p=0.0003; WT vs ΔN, ****p<0.0001; Crsh vs ΔN, ****p<0.0001. WT, wild type; Crsh, Celsr1 variant harboring Crsh mutation; ΔN, Celsr1 variant lacking the extracellular domain.
-
Figure 5—source data 1
Data accompanying Figure 5.
- https://cdn.elifesciences.org/articles/62097/elife-62097-fig5-data1-v1.xlsx
Figure 5—figure supplement 1
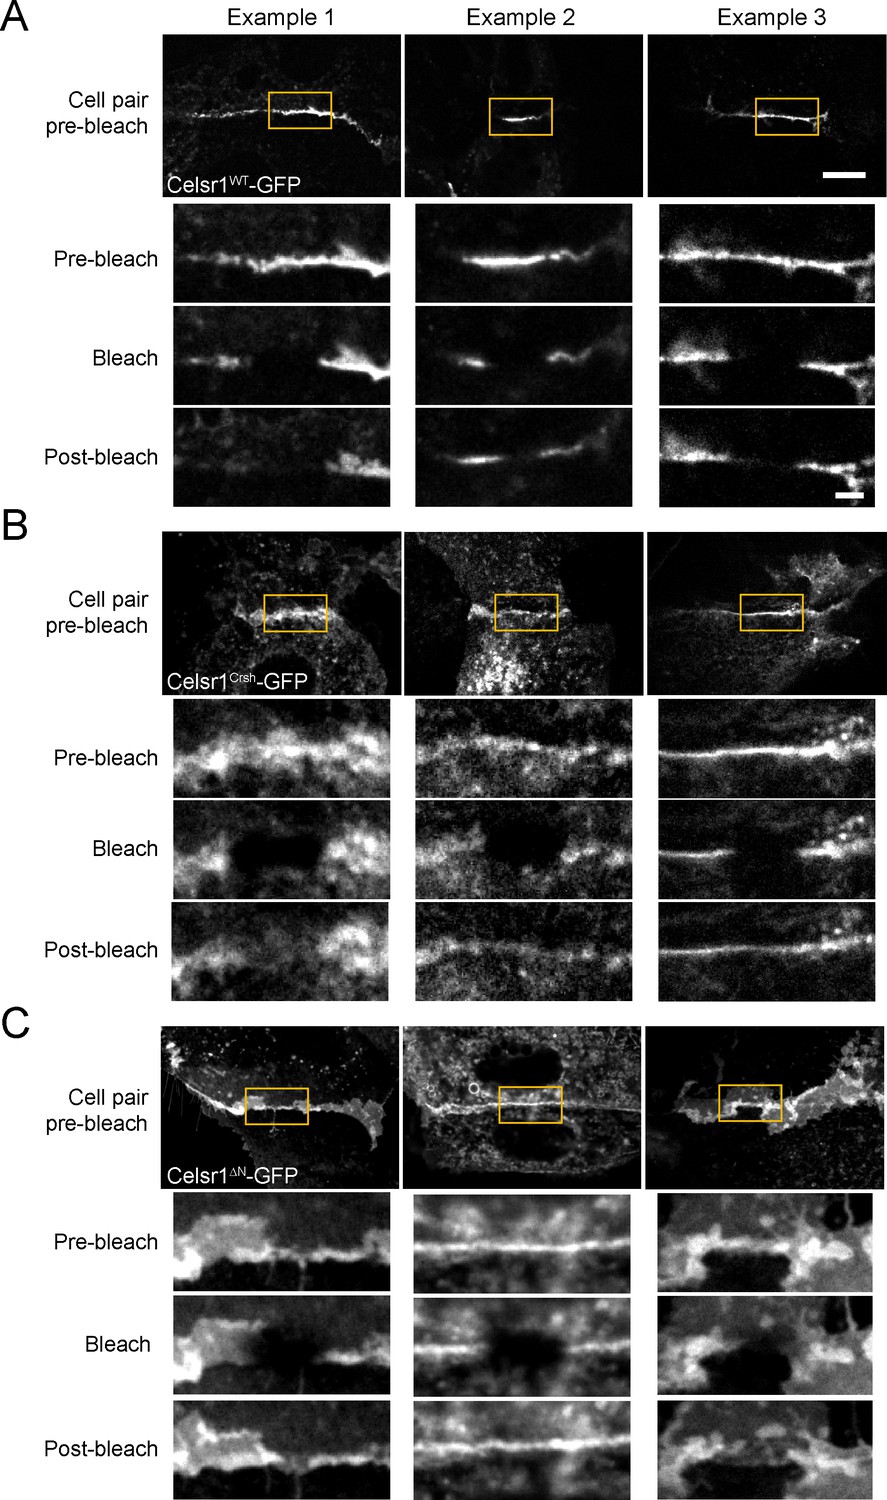
Celsr1Crsh and Celsr1ΔN display altered mobility by FRAP.
Additional representative images, three examples each, of FRAP performed on cultured keratinocyte cell borders expressing Celsr1WT (A), Celsr1Crsh (B), and Celsr1ΔN (C). Yellow box highlights bleached regions, magnified below for the timepoints indicated. Pre-bleach and post-bleach images shown are at −10 s and 5 min respectively. Scale bars, 10 µm; insets, 2 µm.
Figure 5—figure supplement 2
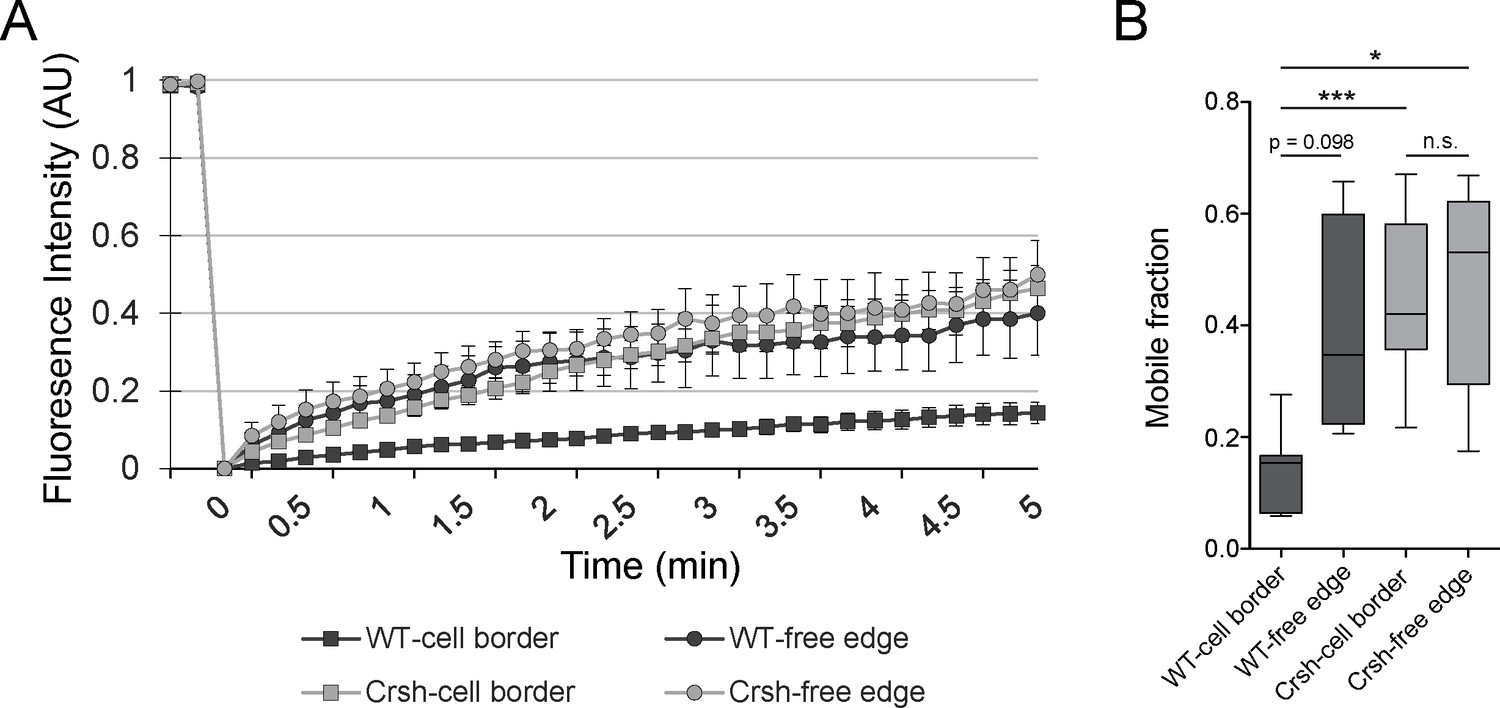
FRAP analysis of Celsr1 mobility at cell–cell borders vs cell-free edges.
(A) Normalized FRAP recovery curves. AU, arbitrary units. (B) Mobile fraction quantification (normalized to 1, box and whisker plot, box displaying first quartile, mean, and third quartile). Mean ± standard error: WT-cell border (14.2 ± 2.79%, n = 7), WT-free edge (38.96 ± 9.99%, n = 4), Crsh-cell border (44.86 ± 5.77%, n = 7) and Crsh-free edge (47.25 ± 8.49%, n = 5) border regions. Two-tailed, unpaired t-tests with Welch’s correction: WT-cell border vs WT-free edge, p=0.0976; WT-cell border vs Crsh-cell border, ***p=0.0009; WT-cell border vs Crsh-free edge, *p=0.0139; WT-free edge vs Crsh-cell border, p=0.6311; WT-free edge vs Crsh-free edge; p=0.5505; and Crsh-cell border vs Crsh-free edge, p=0.8223. WT, wild type; Crsh, Celsr1 variant harboring Crsh mutation.
Figure 6 with 1 supplement
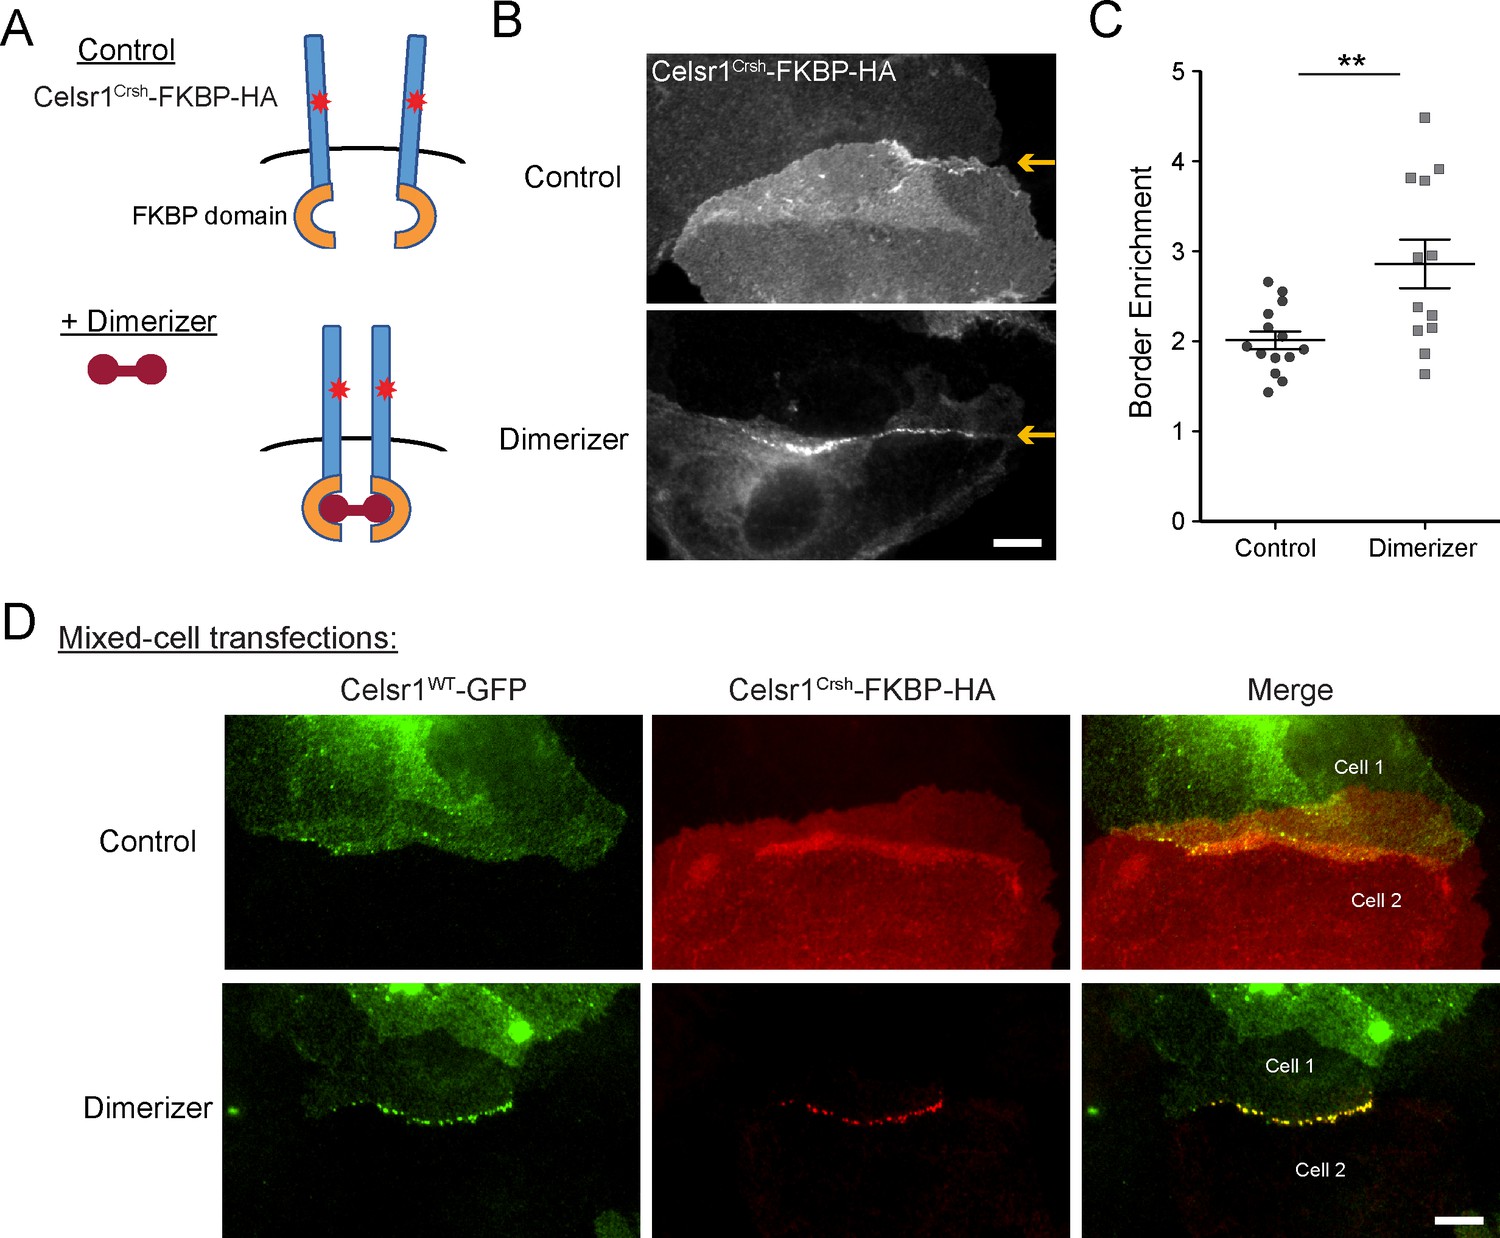
Induced cis-dimerization of Celsr1Crsh rescues junctional enrichment and trans-interactions with Celsr1WT.
(A) Illustration of FKBP-dimer system. Protein of interest is tagged with FKBP domain. Cell-permeable agent B/B homodimerizer (dimerizer) forces FKBP domains together. (B) Cultured keratinocytes were transfected with Celsr1Crsh-FKBP-HA, switched to 1.5 mM calcium for 24 hr, and treated with ethanol (control) or dimerizer for 2 hr prior to the end of the calcium switch to induce dimerization of the FKBP domain fused to Celsr1Crsh. Yellow arrows highlight position of the cell–cell interface between Celsr1Crsh-FKBP-HA expressing cells. (C) Border enrichment quantification for Celsr1Crsh-FKBP-HA. Ethanol, n = 14; Dimerizer, n = 12. One-tailed, unpaired t-test, **p=0.0057. (D) Cell mixing assay where cells were transfected separately with either Celsr1WT-GFP or Celsr1Crsh-FKBP-HA and mixed. Shown are representative examples of mixed-cell junctions between Celsr1WT-GFP (top cell in pair, green) and Celsr1Crsh-FKBP-HA (bottom cell in pair, red) treated with ethanol (control) or dimerizer. Scale bars, 10 µm.
-
Figure 6—source data 1
Data accompanying Figure 6.
- https://cdn.elifesciences.org/articles/62097/elife-62097-fig6-data1-v1.xlsx
Figure 6—figure supplement 1
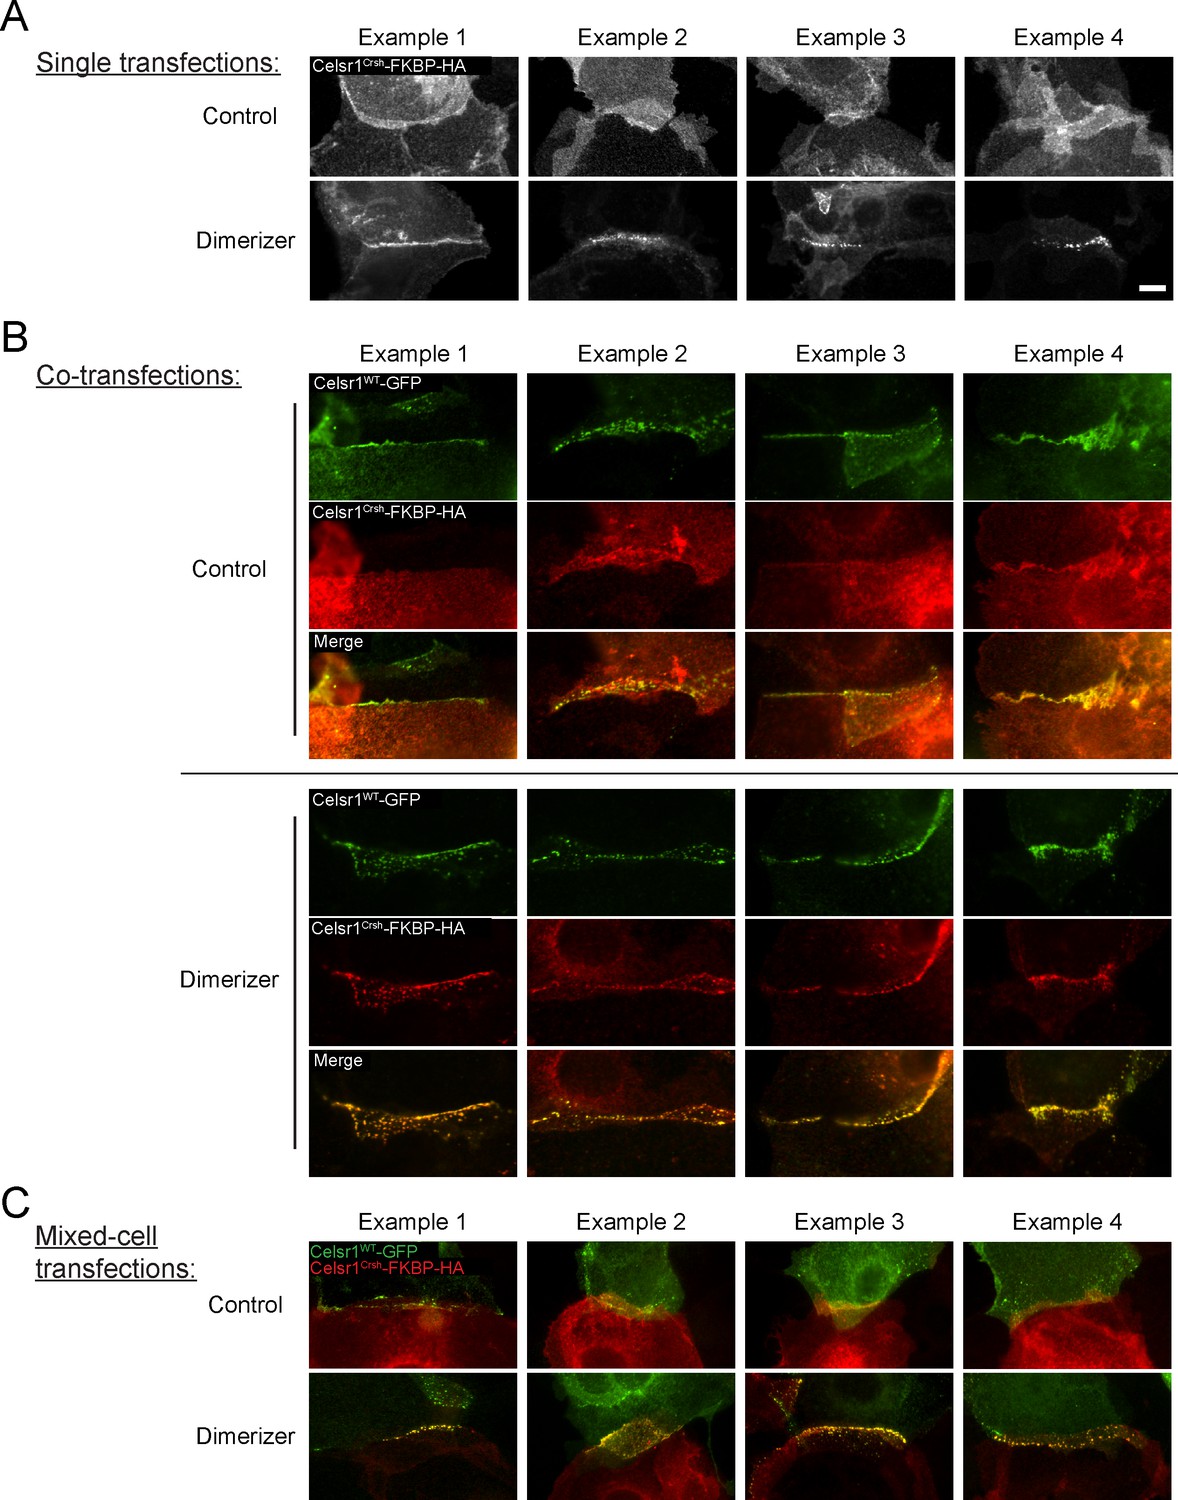
Induced dimerization rescues Celsr1Crsh.
Additional representative examples of cell borders of neighboring cells both expressing transfected constructs from cis-dimerization FBKP experiment. Images cropped and rotated to display border with horizontal orientation. Mouse keratinocytes were transfected with constructs indicated, switched to 1.5 mM calcium for 24 hr along with treatment of either ethanol (control) or dimerizer (B/B homo-dimerizer) for the final 2 hr of the calcium switch to induce FKBP domain dimerization. (A) Transfection of just Celsr1Crsh-FKBP-HA. (B) Co-transfection of both Celsr1WT-GFP with Celsr1Crsh-FKBP-HA. (C) Mixed culture of cells transfected with either Celsr1WT-GFP or Celsr1Crsh-FKBP-HA. Scale bar, 10 µm.
Figure 7 with 1 supplement
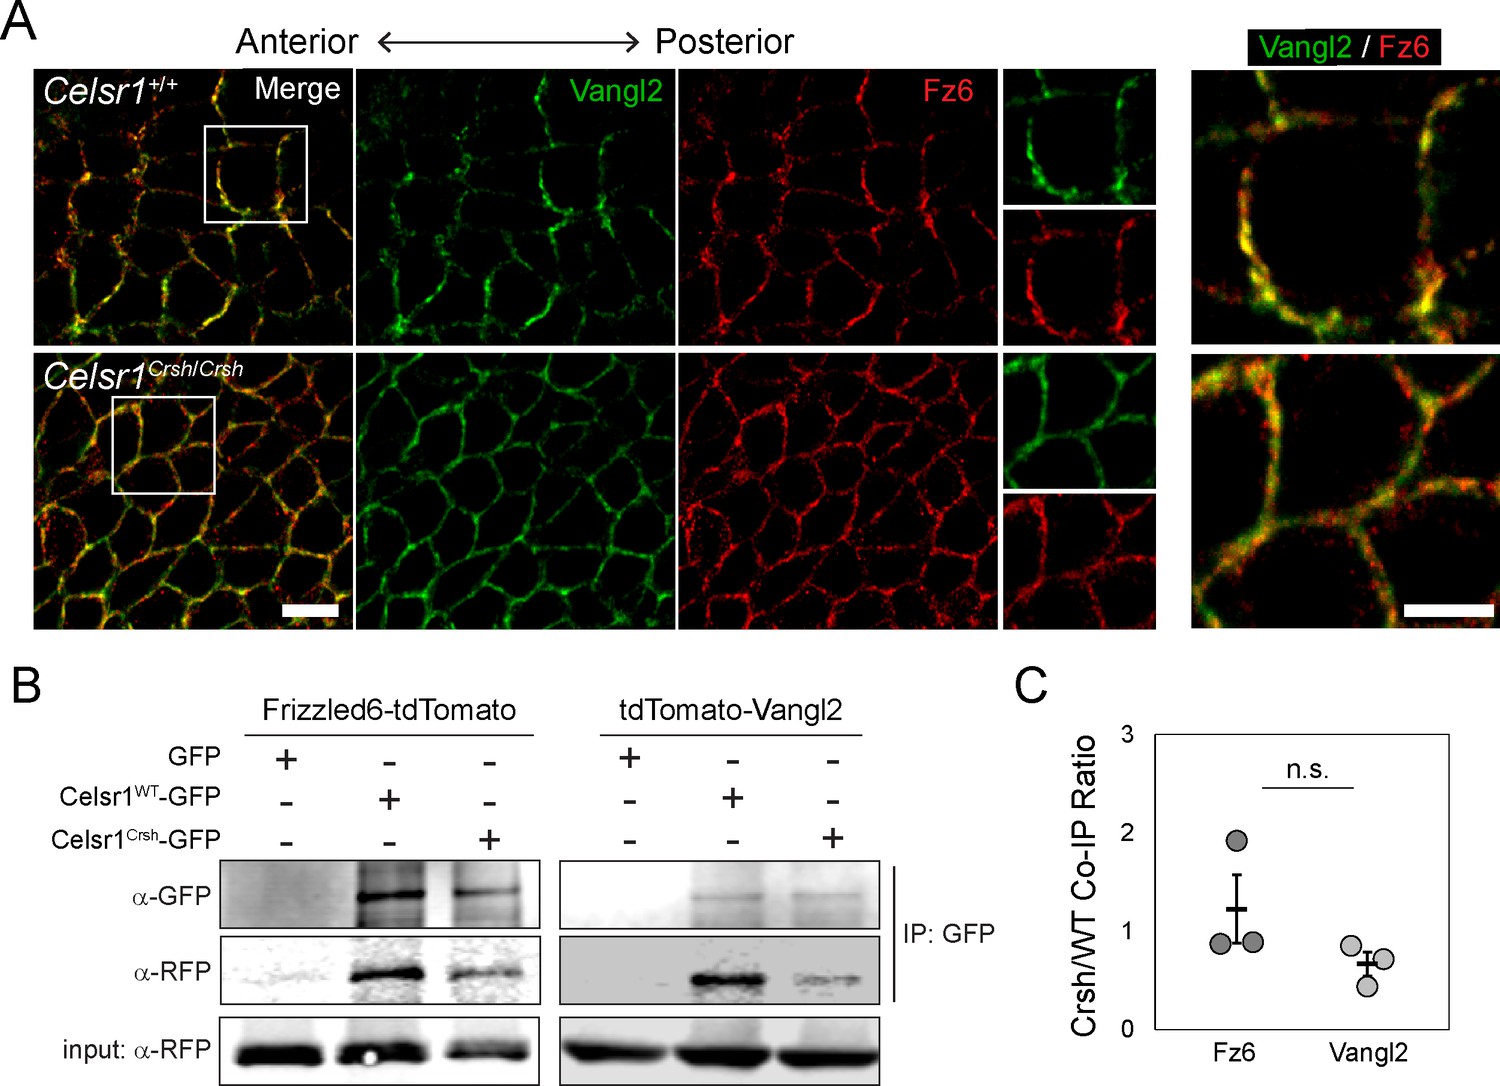
Celsr1Crsh interacts with planar cell polarity (PCP) proteins Frizzled6 and Vangl2.
(A) High magnification (100×) confocal, 0.6 µm max projections of Celsr1+/+ or Celsr1Crsh/Crsh E14.5 epidermis stained for Frizzled6 (Fz6, red) and Vangl2 (green). Scale bar, 10 µm. Right panels display two-color enlargement of white-box region on left. Scale bar, 5 µm. (B) Protein extracts from keratinocytes expressing Frizzled6-tdTomato or tdTomato-Vangl2 (detected with RFP antibody) with either Celsr1WT-GFP or Celsr1Crsh-GFP, as indicated, were immunoprecipitated with anti-GFP antibodies. (C) Co-immunoprecipitation (Co-IP) quantification. Immunoprecipitated Fz6 or Vangl2, normalized to Celsr1, is shown as a ratio of Crsh/WT (i.e. the normalized amount of Fz6 or Vangl2 immunoprecipitated by Celsr1Crsh relative to Celsr1WT). Unpaired two-tailed t-test, p=0.287; n = 3.
-
Figure 7—source data 1
Data accompanying Figure 7.
- https://cdn.elifesciences.org/articles/62097/elife-62097-fig7-data1-v1.xlsx
Figure 7—figure supplement 1
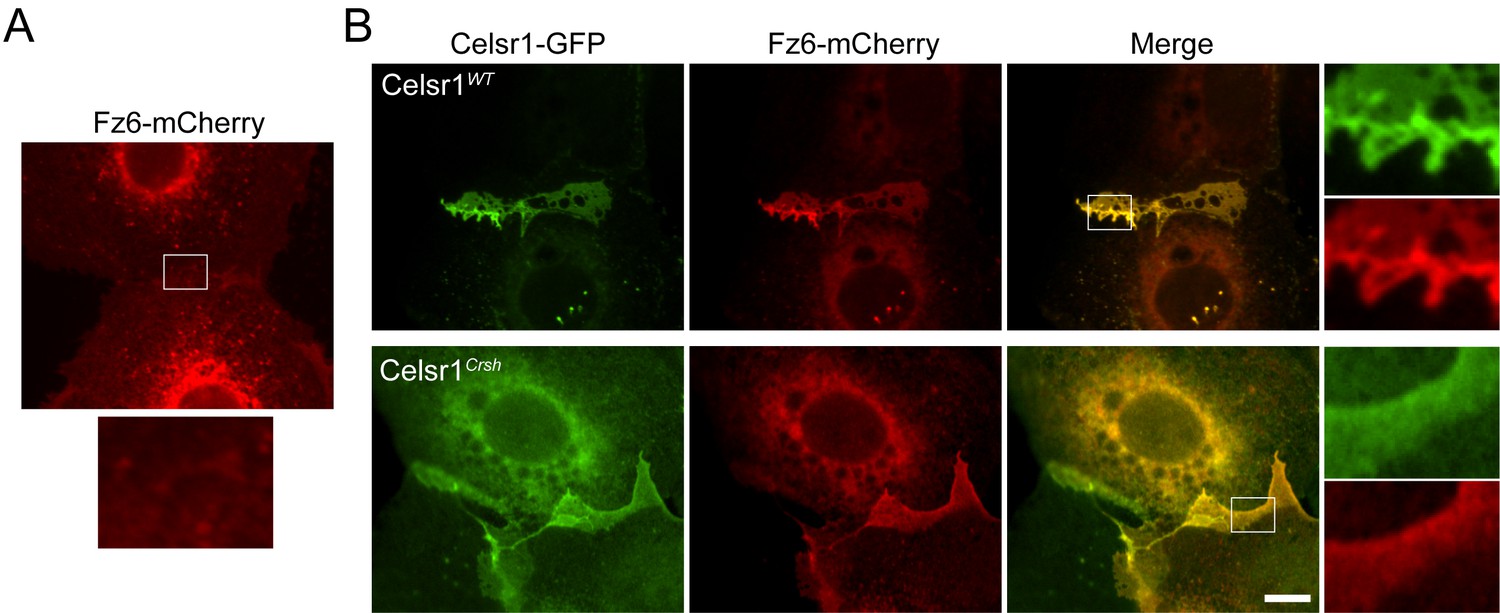
Frizzled6 colocalizes with Celsr1Crsh.
Cultured mouse keratinocytes were transfected with constructs indicated, switched to 1.5 mM calcium for 24 hr, and processed for immunofluorescence. Images are cropped and rotated to display the cell borders with horizontal orientation. (A) Single transfection of Fz6-mCherry. Fz6 alone is not sufficient to localize to cell borders between neighboring cells. (B) Co-transfection of Fz6-mCherry with either Celsr1WT or Celsr1Crsh variants of Celsr1-GFP. Fz6 is readily recruited to cell–cell borders with the addition of WT Celsr1. Even though Celsr1Crsh does not strongly enrich at cell borders, Fz6 colocalizes with Celsr1Crsh. Scale bar, 10 µm. Data is representative of a single set of transfection experiments.
Figure 8 with 2 supplements
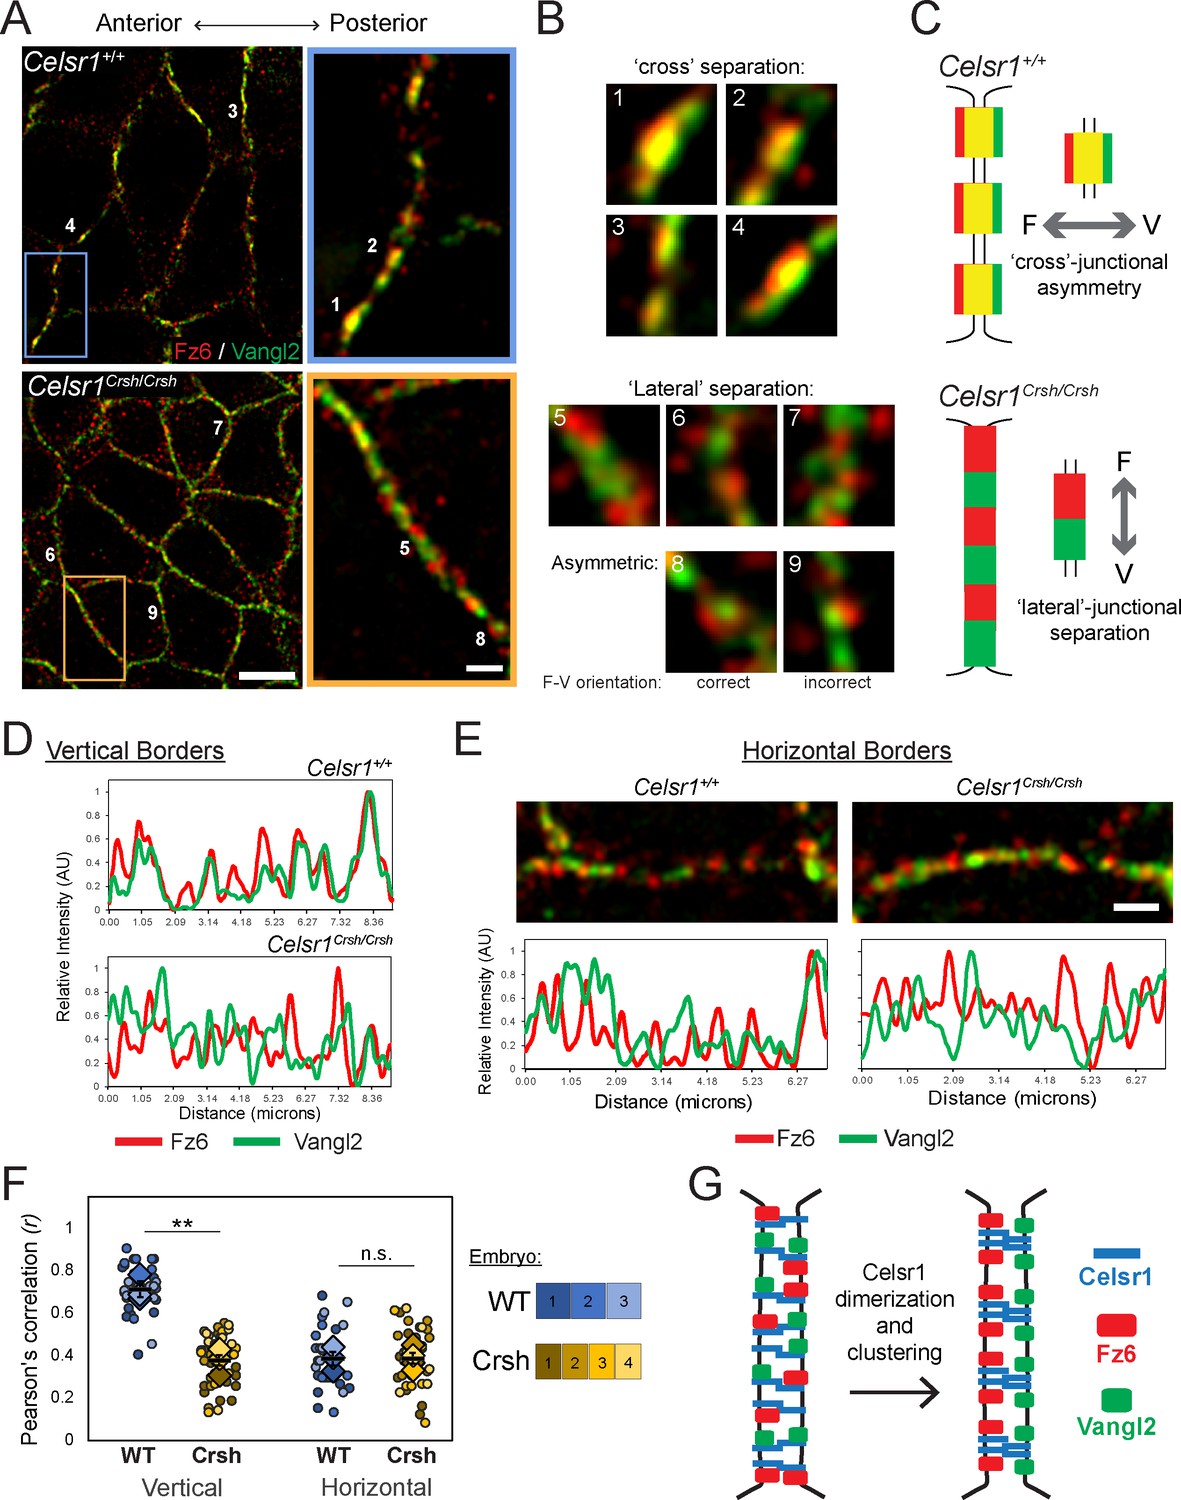
Failure to organize asymmetric planar cell polarity (PCP) complexes in Celsr1Crsh/Crsh mutants in vivo.
Whole mount preparation of E14.5 dorsal skin labeled for Fz6 and Vangl2 and imaged by super-resolution structured illumination microscopy (SIM). (A) Planar SIM images of the basal layer from either Celsr1+/+ or Celsr1Crsh/Crsh embryos. Images oriented with anterior to the left. Scale bars, 5 µm (insets 1 µm). (B) Enlargements of individual puncta (or equivalent regions) along cell borders. (C) Schematic of Fz6 (F) and Vangl2 (V) distribution along cell borders that display ‘cross’-junctional asymmetry in Celsr1+/+ and ‘lateral’-junctional separation in Celsr1Crsh/Crsh epidermis. (D) Fluorescence intensity measurements of lines drawn along vertical cell borders. (E) Horizontal cell borders with corresponding fluorescence intensity measurements along borders. (F) Quantification of Pearson’s correlation between Fz6/Vangl2 at cell borders. Dots represent individual cell borders. Colors indicate different embryos. Vertical borders, 12 per embryo. Horizontal borders, nine per embryo. Diamonds indicate the individual embryo average. Black dash overlay represents the mean across the individual embryo average ± standard error. **p=0.0016. Data are representative of four Celsr1+/+ (WT) embryos and five Celsr1Crsh/Crsh (Crsh) embryos from two litters. (G) PCP establishment model. Celsr1 dimerization and clustering through cis-interactions are required to organize asymmetric Fz6-Vangl2 complexes at cell junctions.
-
Figure 8—source data 1
Data accompanying Figure 8.
- https://cdn.elifesciences.org/articles/62097/elife-62097-fig8-data1-v1.xlsx
Figure 8—figure supplement 1
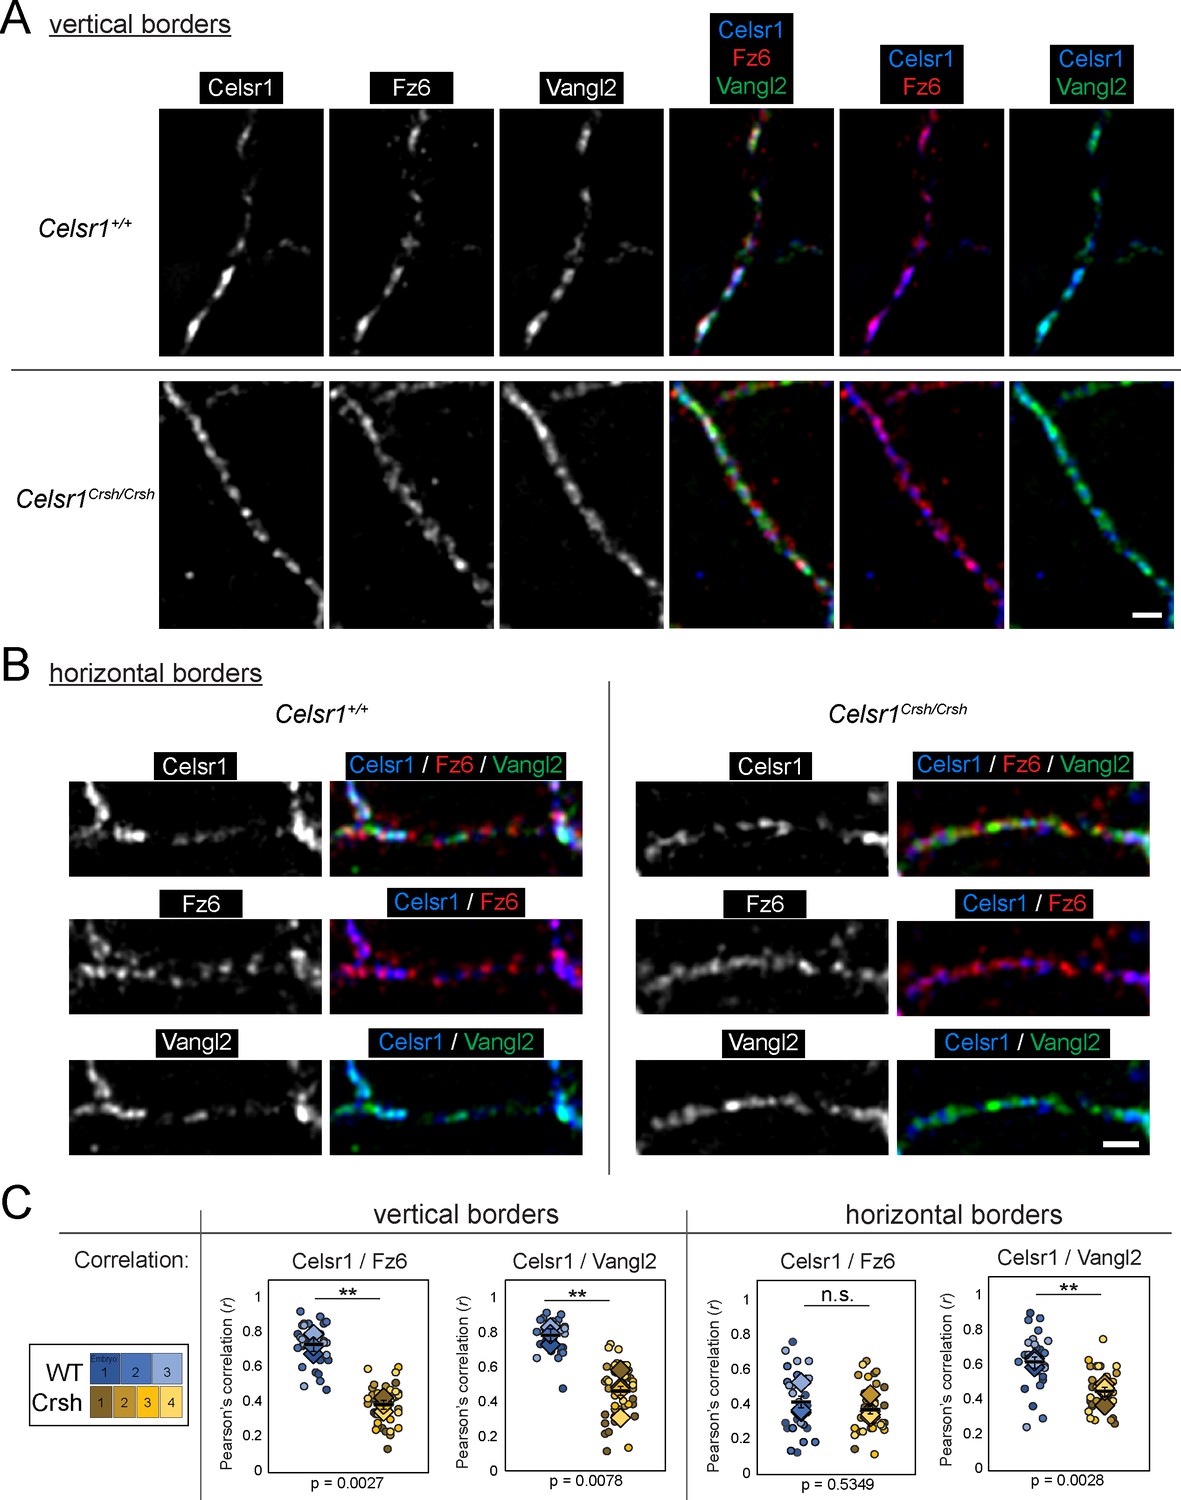
Colocalization analysis of Celsr1 with Fz6 or Vangl2 in vivo.
Whole mount preparation of E14.5 dorsal skin labeled for Fz6, Vangl2, and Celsr1 and imaged by super-resolution structured illumination microscopy (SIM). Vertical (A) and horizontal (B) cell border images are oriented with anterior to the left. Scale bars, 1 µm. See Figure 8—figure supplement 2 for corresponding fluorescence intensity measurements along cell borders. (C) Quantification of Pearson’s correlation between Celsr1 and either Fz6 or Vangl2 at cell borders. Dots represent individual cell borders. Colors indicate different embryos. Vertical borders, 12 per embryo. Horizontal borders, nine per embryo. Diamonds indicate the individual embryo average. Black dash overlay represents the mean across the individual embryo average ± standard error. Data are representative of four Celsr1+/+ (WT) embryos and five Celsr1Crsh/Crsh (Crsh) embryos from two litters.
Figure 8—figure supplement 2
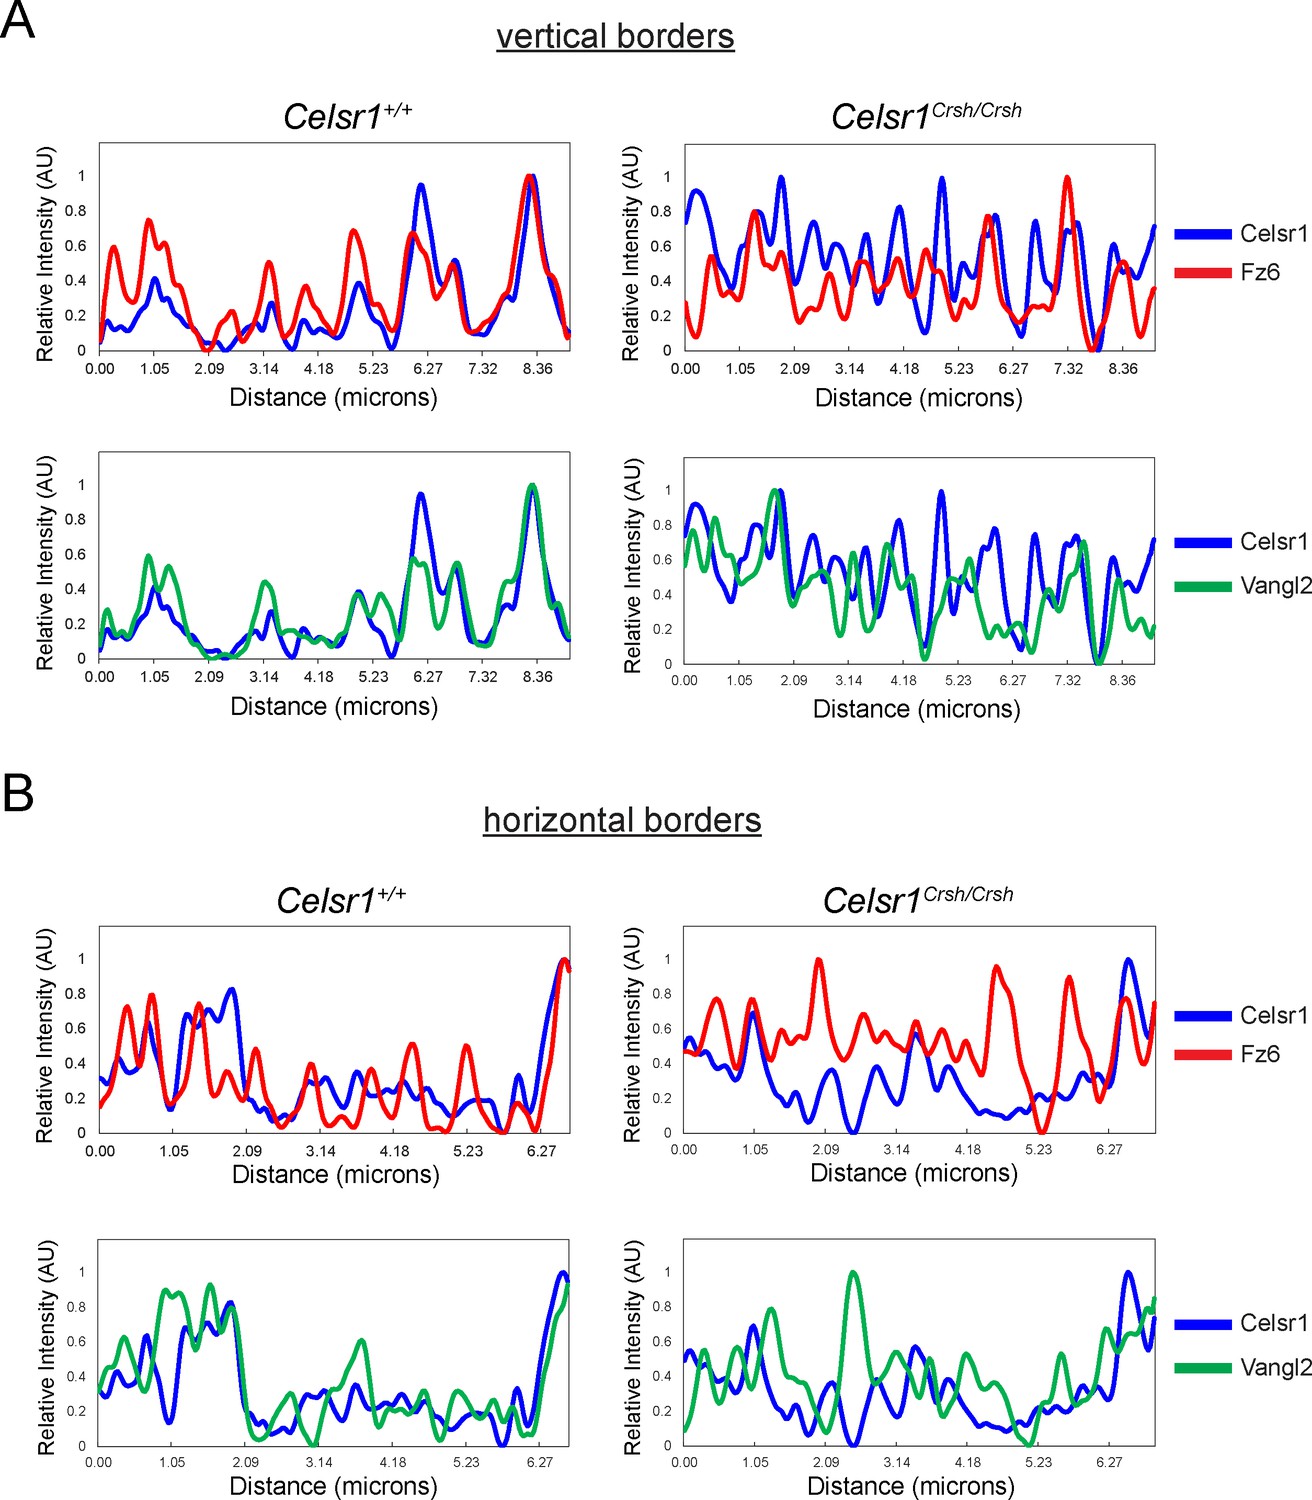
Planar cell polarity (PCP) protein distribution along cell borders in vivo.
Fluorescence intensity measurements of lines drawn along vertical (A) and horizontal (B) borders in E14.5 Celsr1+/+ and Celsr1Crsh/Crsh epidermis. See Figure 8—figure supplement 1 for corresponding images.
Tables
Key resources table
| Reagent type (species) or resource | Designation | Source or reference | Identifiers | Additional information |
|---|---|---|---|---|
| Strain, strain background (M. musculus) | Celsr1Crsh/+(mixed background) | Elaine Fuchs, Jen Murdoch (Curtin et al., 2003) | MGI: 2668337 | |
| Cell line (Homo-sapiens) | K-562 | ATCC | CCL-243 | |
| Cell line (M. musculus) | Celsr1-mNeonGreen (mouse CD1 keratinocytes) | Heck and Devenport, 2017 | ||
| Antibody | Anti-Celsr1 (Guinea pig polyclonal) | Devenport and Fuchs, 2008 | 1:1000 | |
| Antibody | Anti-Frizzled6 (Goat polyclonal) | R and D Systems | Cat #AF1526 | 1:400 |
| Antibody | Anti-Vangl2, clone 2G4 (Rat monoclonal) | Millipore | Cat #MABN750 | 1:100 |
| Antibody | Anti-GFP (Chicken polyclonal) | Abcam | Cat #ab13970 | 1:2000 (IF), 1:2500 (WB) |
| Antibody | Anti-RFP, also recognizes mCherry (Rabbit polyclonal) | Rockland Inc | Cat #600-401-379 | 1:200 (IF), 1:1000 (WB) |
| Antibody | Anti-HA, clone 3F10 (Rat monoclonal) | Roche | Cat #11867423001 | 1:500 |
| Antibody | Anti-E-cadherin, clone DECMA-1 (Rat monoclonal) | Thermo Pierce | Cat #MA1-251-60 | 1:1000 |
| Antibody | Anti-Integrin β1 (Mouse monoclonal) | Millipore | Cat #MAB1965 | 1:1000 |
| Antibody | Anti-Guinea Pig, Alexa Fluor 488 (Donkey) | Jackson ImmunoResearch | Cat #706-545-148; | 1:2000 |
| Antibody | Anti-Guinea Pig, Alexa Fluor 647 (Donkey) | Jackson ImmunoResearch | Cat #706-605-148 | 1:2000 |
| Antibody | Anti-Guinea Pig, Alexa Fluor 555 (Goat) | Invitrogen | Cat #A-21435 | 1:2000 |
| Antibody | Anti-Chicken, Alexa Fluor 488 (Goat) | Invitrogen | Cat #A-11039 | 1:2000, 1:500 (dSTORM) |
| Antibody | Anti-Rabbit, Alexa Fluor 555 (Donkey) | Invitrogen | Cat #A-31572 | 1:2000 |
| Antibody | Anti-Rat, Alexa Fluor 647 (Donkey) | Jackson ImmunoResearch | Cat #712-605-153 | 1:2000 |
| Antibody | Anti-Rat, Alexa Fluor 555 (Goat) | Invitrogen | Cat #A-21434 | 1:2000 |
| Antibody | Anti-Goat, Alexa Fluor 555 (Donkey) | Invitrogen | Cat #A-21432 | 1:2000 |
| Antibody | Anti-Chicken IRdye 680RD (Donkey) | LI-COR | Cat #925–68075 | 1:10,000 |
| Antibody | Anti-Mouse IRDye 800CW (Goat) | LI-COR | Cat #926–32210 | 1:10,000 |
| Antibody | Anti-Rabbit IRDye 800CW (Goat) | LI-COR | Cat #926–3221 | 1:10,000 |
| Chemical compound, drug | B/B Homodimerizer | TakaraBio, Clontech | Cat #635059 | 1:1000 |
| Chemical compound, drug | Catalase | Sigma | Cat #C40 | |
| Chemical compound, drug | Glucose oxidase | Sigma | Cat #G2133 | |
| Chemical compound, drug | G418 | Fisher | Cat #50-841-720 | |
| Transfection reagent | Effectene | QIAGEN | Cat #301427 | |
| Transfection reagent | SuperFect | QIAGEN | Cat #301305 | |
| Other | EX-Link Sulfo-NHS-SS-Biotin | Thermo Scientific | Cat #21331 | |
| Other | Pierce Streptavidin Agarose | Thermo Scientific | Cat #20347 | |
| Other | Protease inhibitor cocktail | Roche | Cat #11836153001 | |
| Recombinant DNA reagent | pEGFPN1 (for GFP only control) (plasmid) | Clontech | ||
| Recombinant DNA reagent | pEGFPN1-Celsr1-GFP (plasmid) | Devenport and Fuchs, 2008 | ||
| Recombinant DNA reagent | pEGFPN1-Celsr1-mCherry (plasmid) | This paper | ||
| Recombinant DNA reagent | pEGFPN1-Celsr1-Crsh-GFP (plasmid) | Devenport and Fuchs, 2008 | ||
| Recombinant DNA reagent | pEGFPN1-Celsr1-Crsh-mCherry (plasmid) | This paper | ||
| Recombinant DNA reagent | pEGFPN1-Celsr1-Crsh-FKBP-HA (plasmid) | This paper | ||
| Recombinant DNA reagent | pEGFPN1-Celsr1-dN-GFP (plasmid) | This paper | ||
| Recombinant DNA reagent | pEGFPN1-EcadECD+TM-Celsr1CT-mCherry (plasmid) | This paper | ||
| Recombinant DNA reagent | K14-Fzd6-mCherry (plasmid) | Devenport and Fuchs, 2008 | ||
| Recombinant DNA reagent | K14-Fzd6-tdTomato (plasmid) | Heck and Devenport, 2017 | ||
| Recombinant DNA reagent | K14-tdTomato-Vangl2 (plasmid) | This paper | ||
| Software, algorithm | Coloc2 | Fiji (ImageJ) | https://imagej.net/Coloc_2 | |
| Software, algorithm | Matlab | MathWorks | https://www.mathworks.com/products/matlab.html | |
| Software, algorithm | R | R Project | https://www.r-project.org/ | |
| Software, algorithm | spatstat | Baddeley et al., 2016 | http://www.crcpress.com/Spatial-Point-Patterns-Methodology-and-Applications-with-R/Baddeley-Rubak-Turner/9781482210200/ . | |
| Software, algorithm | Prism | GraphPad | https://www.graphpad.com/scientific-software/prism/ | |
| Software, algorithm | Tissue Analyzer | Aigouy et al., 2010 | https://grr.gred-clermont.fr/labmirouse/software/WebPA/index.html |
Additional files
-
Source code 1
MATLAB script for dSTORM puncta analysis.
- https://cdn.elifesciences.org/articles/62097/elife-62097-code1-v1.zip
-
Source code 2
MATLAB script for batch processing of dSTORM puncta analysis.
- https://cdn.elifesciences.org/articles/62097/elife-62097-code2-v1.zip
-
Source code 3
R script for Ripley’s L and K statistics.
- https://cdn.elifesciences.org/articles/62097/elife-62097-code3-v1.zip
-
Transparent reporting form
- https://cdn.elifesciences.org/articles/62097/elife-62097-transrepform-v1.docx
Download links
A two-part list of links to download the article, or parts of the article, in various formats.
Downloads (link to download the article as PDF)
Open citations (links to open the citations from this article in various online reference manager services)
Cite this article (links to download the citations from this article in formats compatible with various reference manager tools)
Celsr1 adhesive interactions mediate the asymmetric organization of planar polarity complexes
eLife 10:e62097.
https://doi.org/10.7554/eLife.62097


