Longitudinal stability of medial temporal lobe connectivity is associated with tau-related memory decline
- Elaine C. Hubbard Center for Nursing Research on Aging, School of Nursing, University of Rochester Medical Center, United States
- Department of Psychiatry, School of Medicine and Dentistry, University of Rochester Medical Center, United States
- Department of Imaging Sciences, School of Medicine and Dentistry, University of Rochester Medical Center, United States
- Department of Biomedical Engineering, University of Rochester, United States
- Department of Neuroscience, School of Medicine and Dentistry, University of Rochester Medical Center, United States
- Department of Neurology, School of Medicine and Dentistry, University of Rochester Medical Center, United States
- Department of Brain and Cognitive Sciences, University of Rochester, United States
- School of Medicine, Stanford University, United States
Figures
Figure 1 with 1 supplement

Regions of interests.
(A) Regions of interests are identified based on the Desikan-Killiany Atlas and visualized with the BrainNet Viewer (Xia et al., 2013). The medial temporal lobe (MTL) includes bilateral entorhinal cortex (ENT), hippocampus (HIP), and parahippocampal gyrus (PHIP). The anterior-temporal (AT) system includes bilateral inferior temporal cortex (IT), temporal pole (TP), and lateral and medial orbitofrontal cortex (LOF/MOF), while the posterior-medial (PM) system includes bilateral posterior and isthmus cingulate (PCC/ISTC), lateral occipital cortex (LO), precuneus (PREC), and thalamus (TH). (B) Visualization of connections between MTL-related structures in a representative participant with TractVis (Wang and Wedeen, 2007).
Figure 1—figure supplement 1
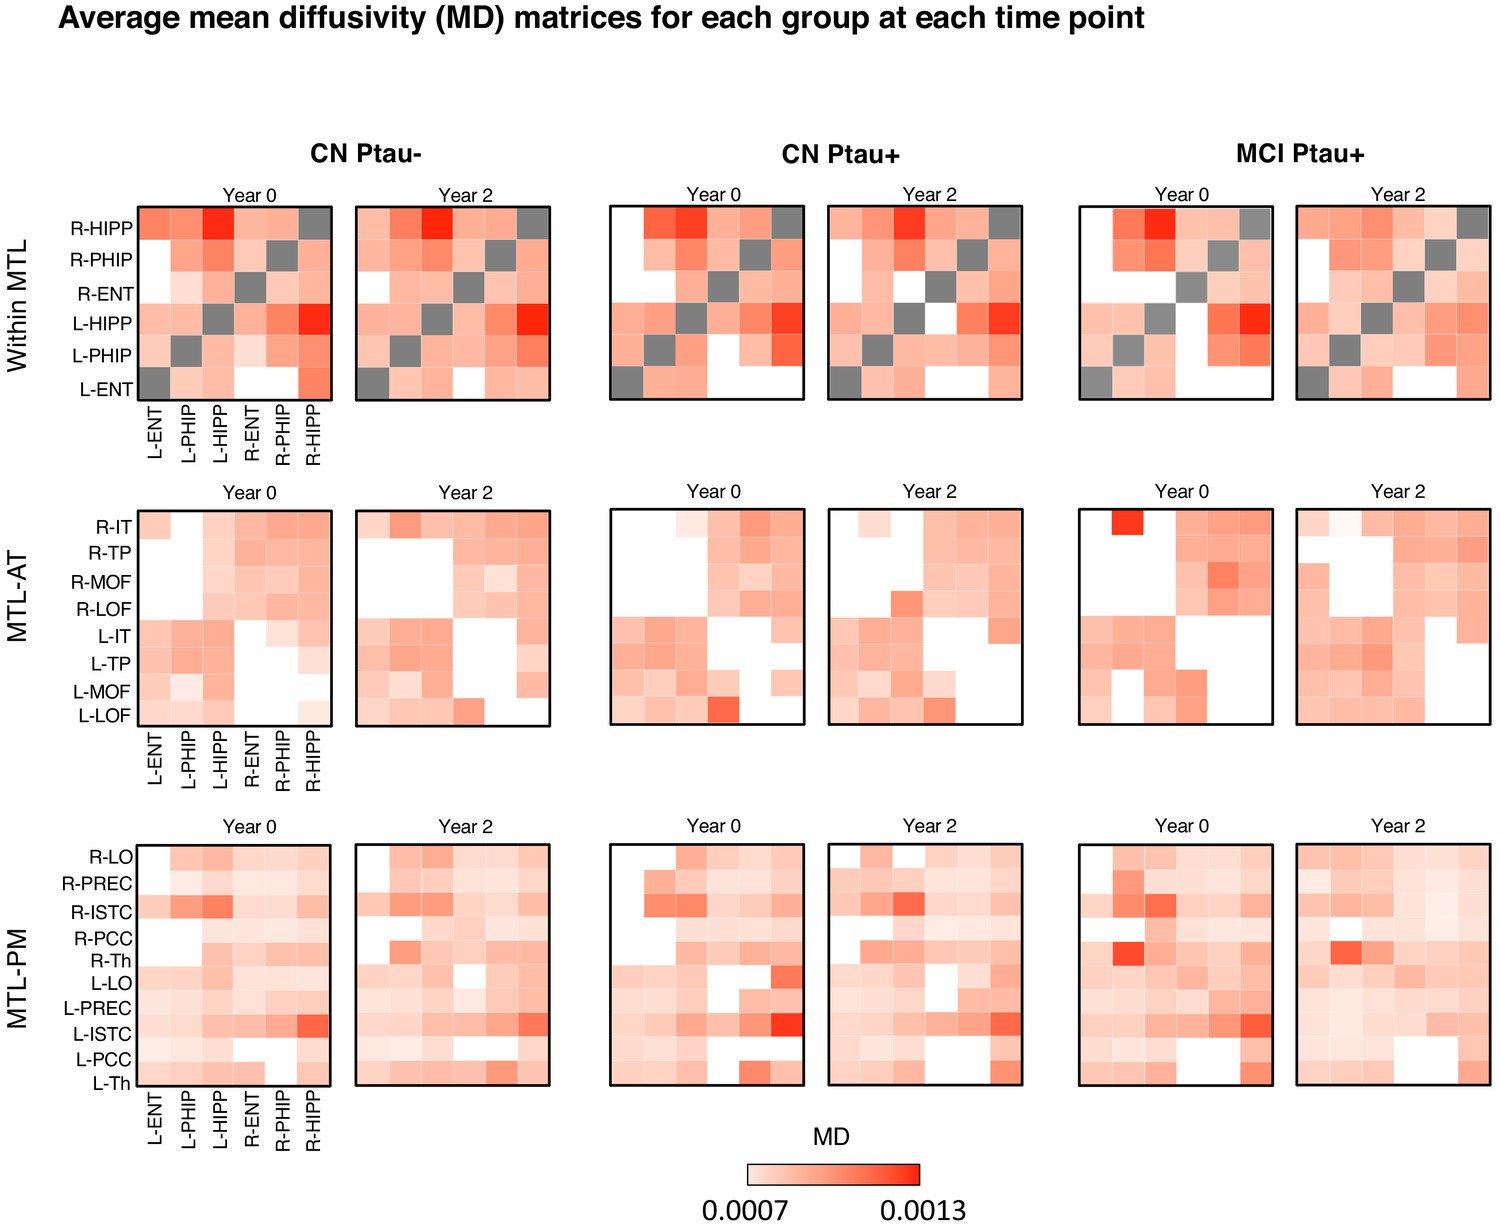
Average mean diffusivity (MD) matrices for each group at each time point.
Please note that the white color indicates that no streamline was generated between the region of interest pairs in any of the participants within the group.
-
Figure 1—figure supplement 1—source data 1
Average mean diffusivity (MD) matrices for each group at each time point.
- https://cdn.elifesciences.org/articles/62114/elife-62114-fig1-figsupp1-data1-v3.xlsx
Figure 2 with 1 supplement
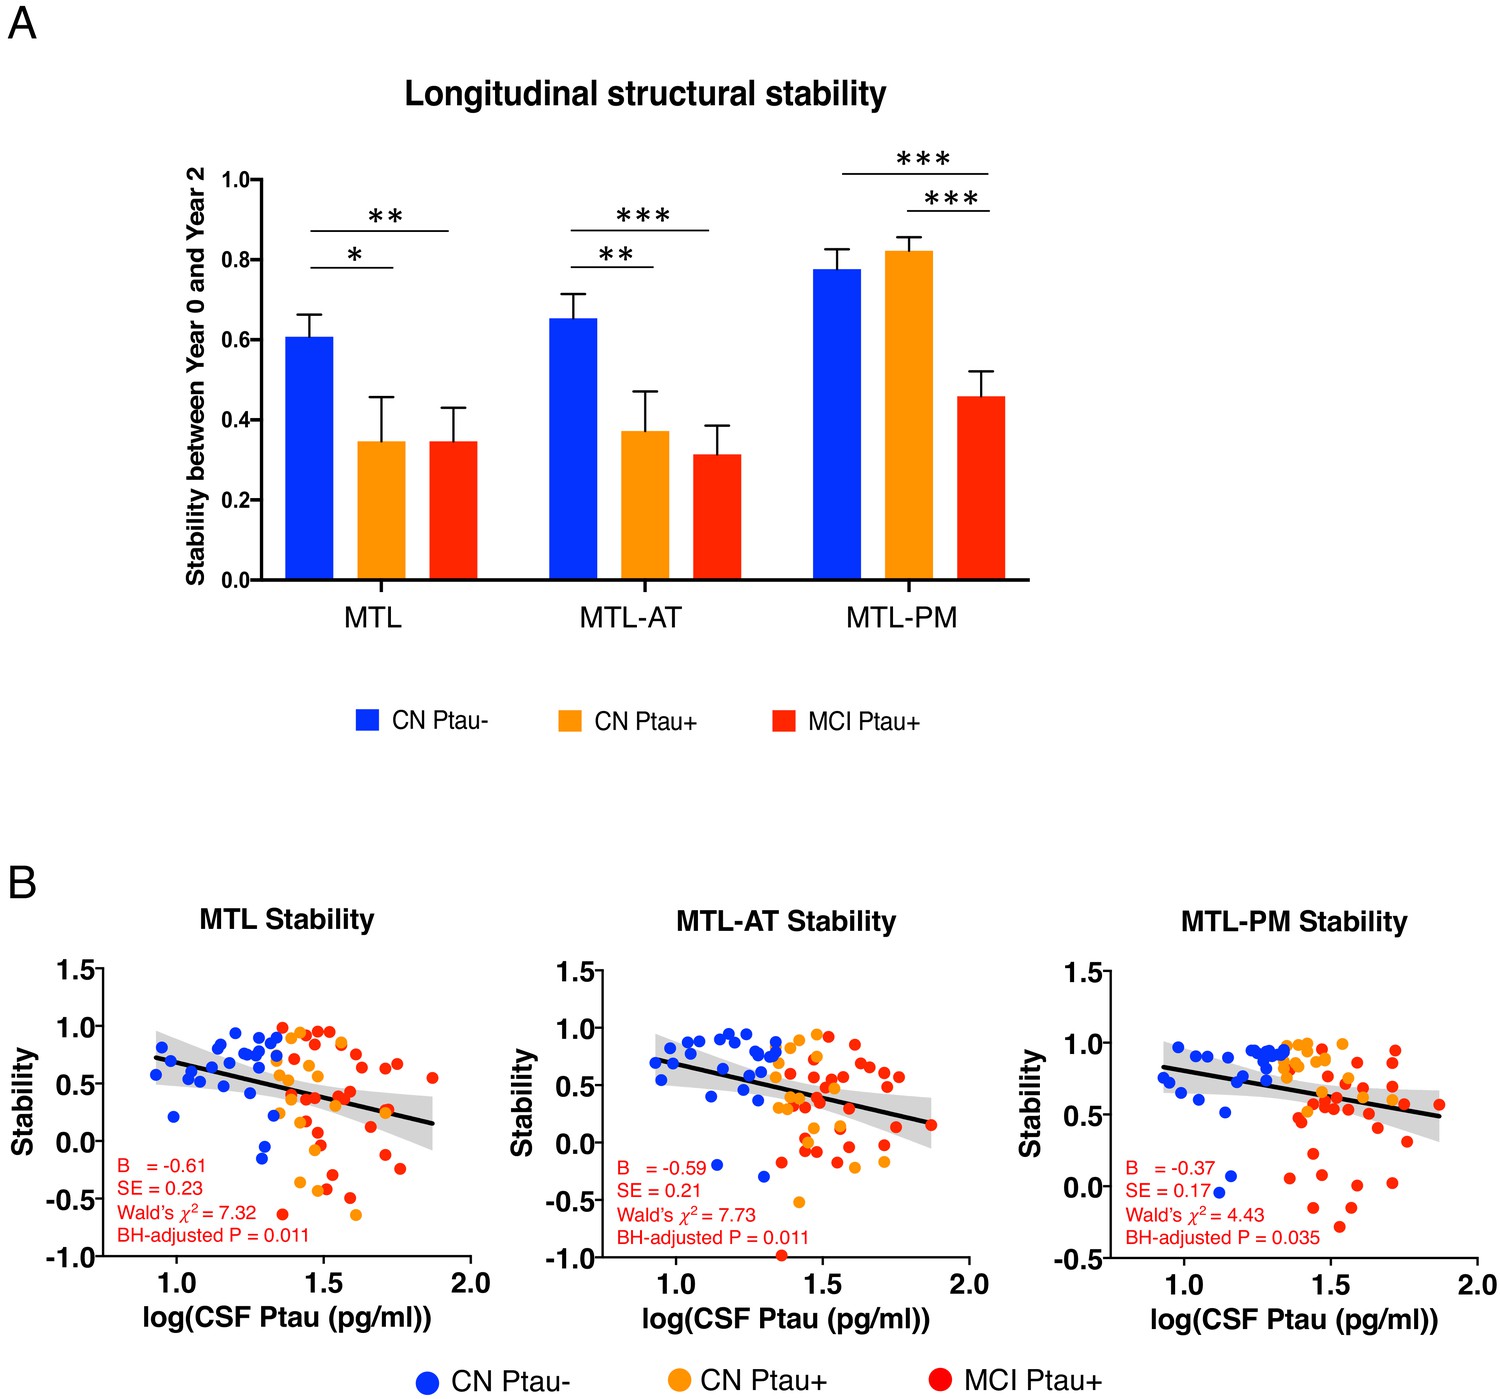
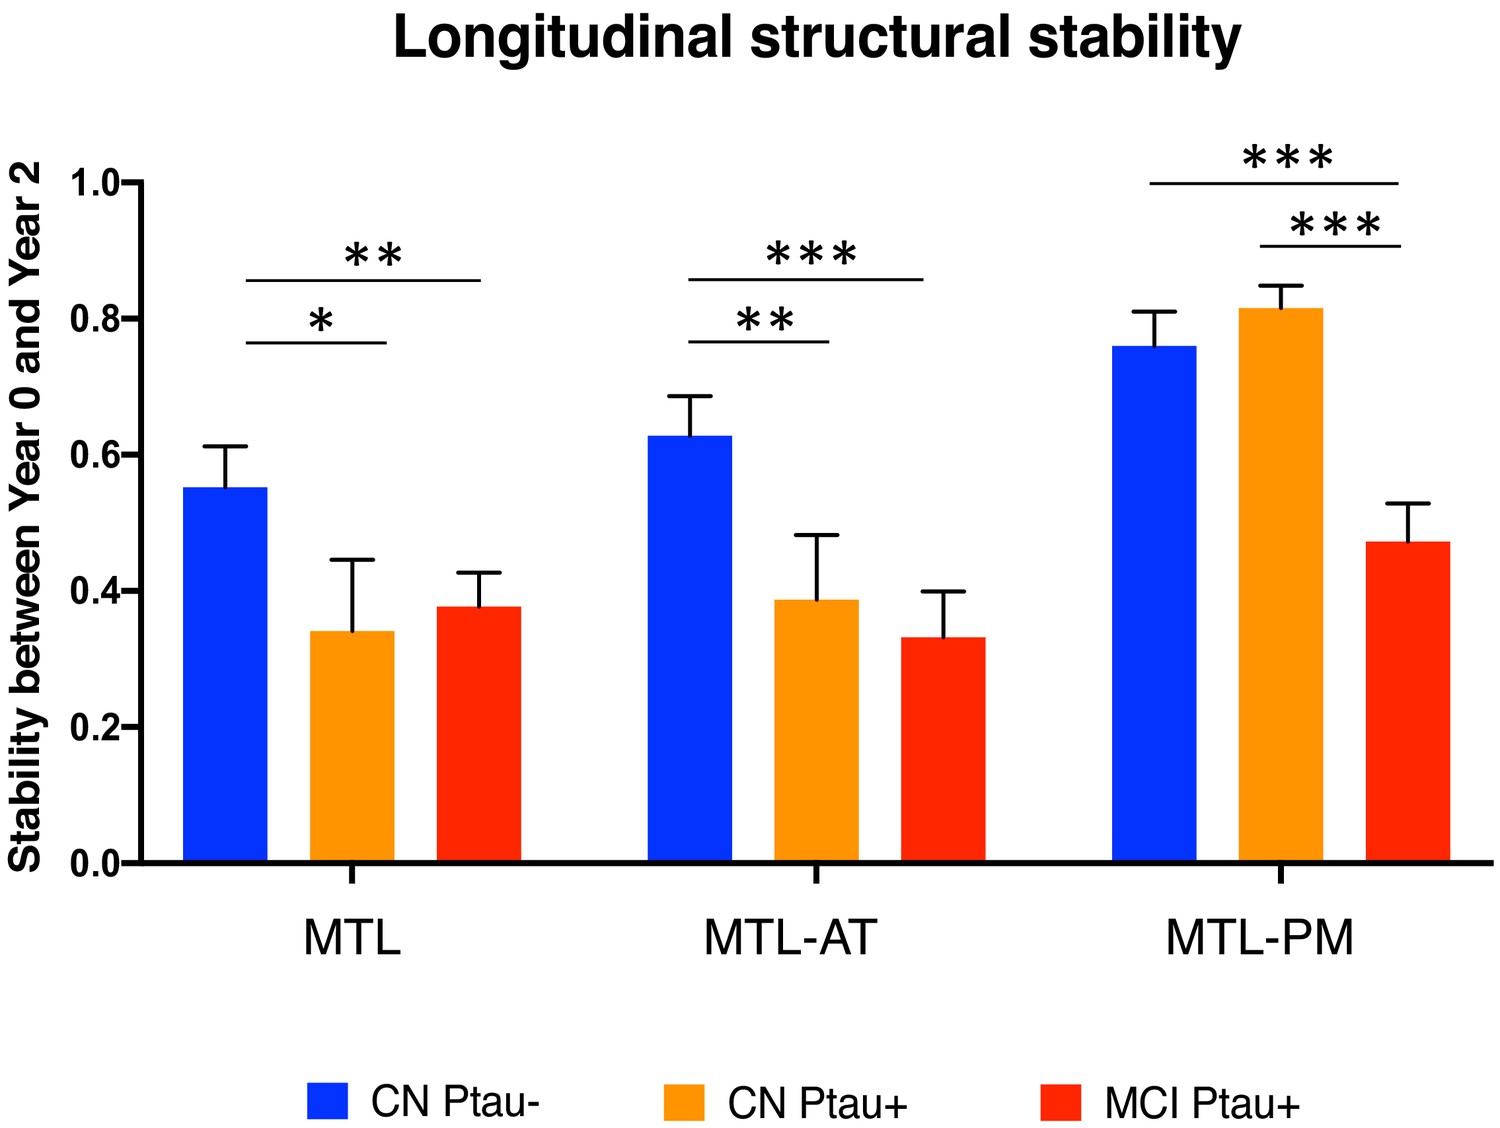
Relationship between baseline CSF Ptau and MTL structural stability.
(A) Structural stability within MTL, MTL-AT, and MTL-PM for CN Ptau– (blue), CN Ptau+ (orange), and MCI Ptau+ (red) groups. Asterisk represents significant group comparison. *p < 0.05; **p < 0.01; ***p < 0.001. (B) Relationship of baseline CSF Ptau levels and structural stability within MTL, MTL-AT, and MTL-PM for the entire sample.
-
Figure 2—source data 1
Group comparisons.
- https://cdn.elifesciences.org/articles/62114/elife-62114-fig2-data1-v3.xlsx
Figure 2—figure supplement 1
Group comparisons without the exclusion of eight participants.
Figure 3
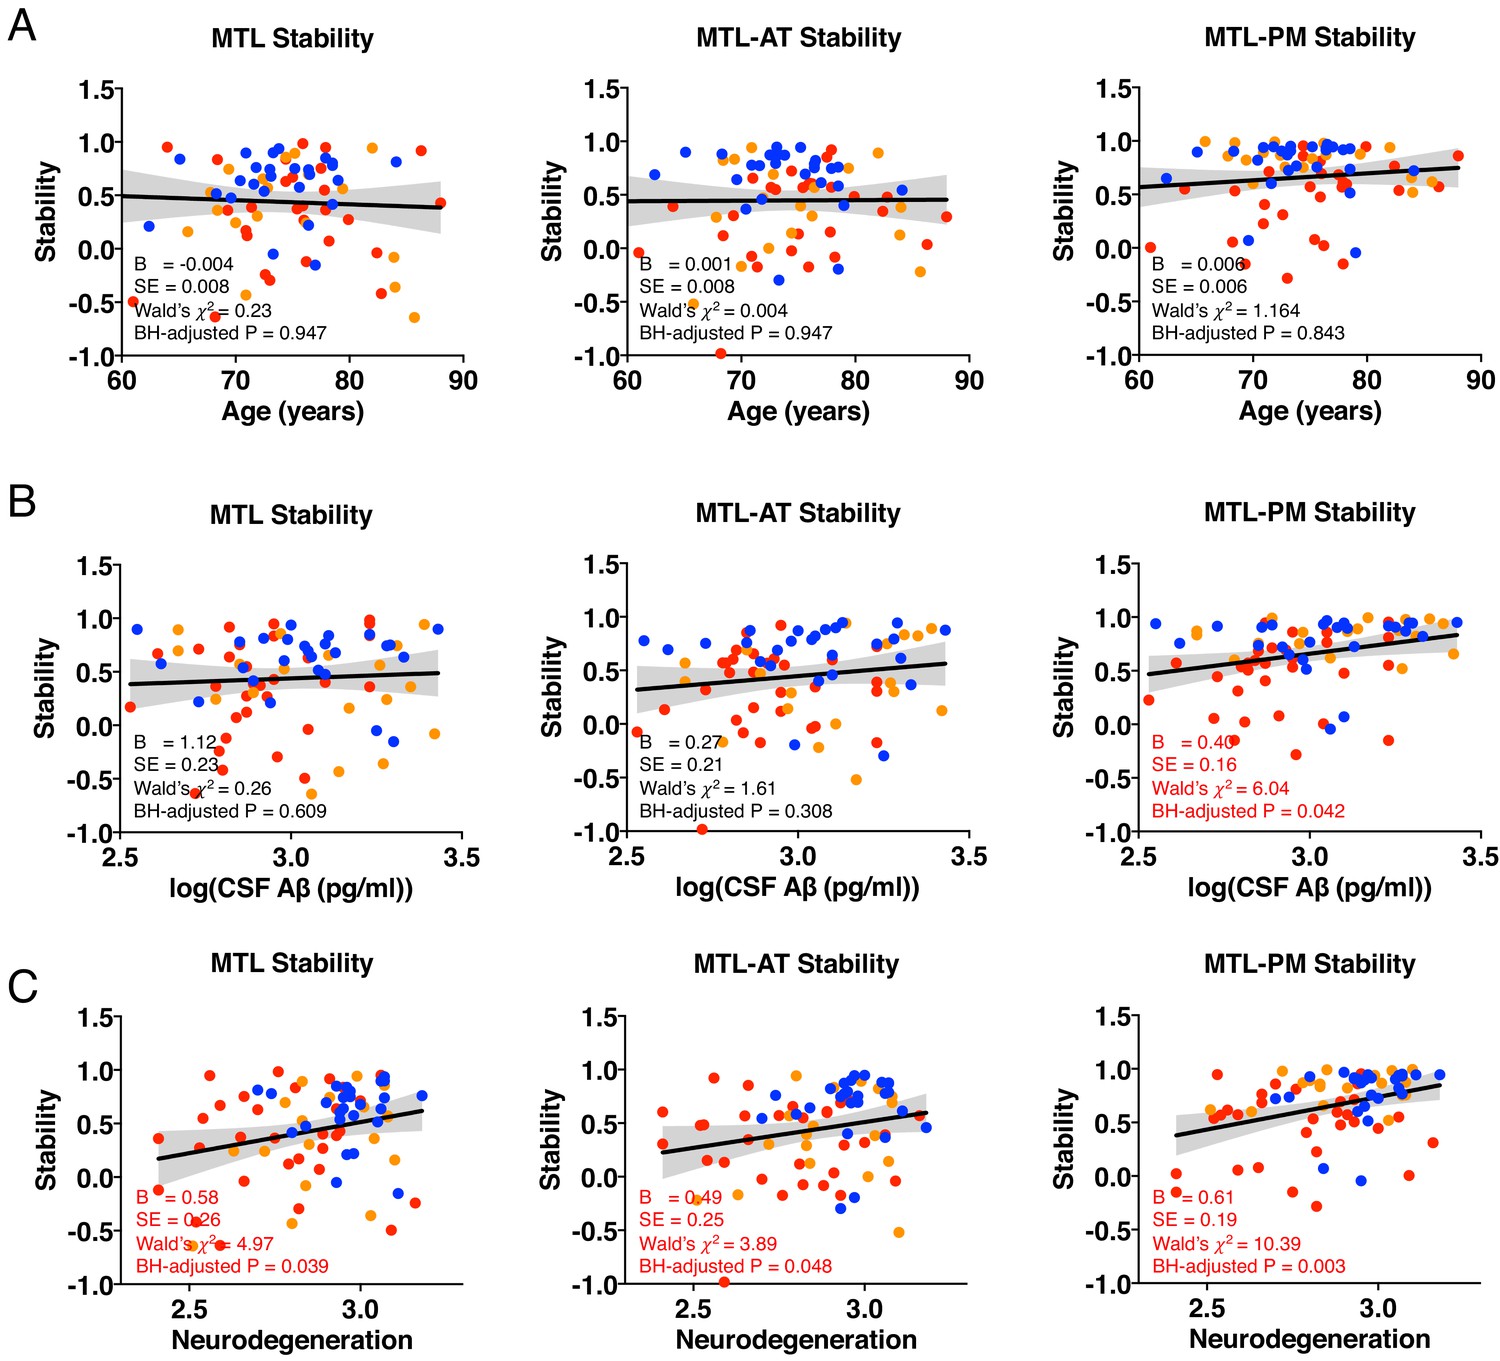
The effect of age (A), CSF Aβ pathology (B), and neurodegeneration (C) on the structural stability within MTL, MTL-AT, and MTL-PM in the whole sample.
N: neurodegeneration; higher values indicate greater cortical thickness and lower severity in neurodegeneration.
-
Figure 3—source data 1
The effect of covariates on the structural stability in the whole sample.
- https://cdn.elifesciences.org/articles/62114/elife-62114-fig3-data1-v3.xlsx
Figure 4
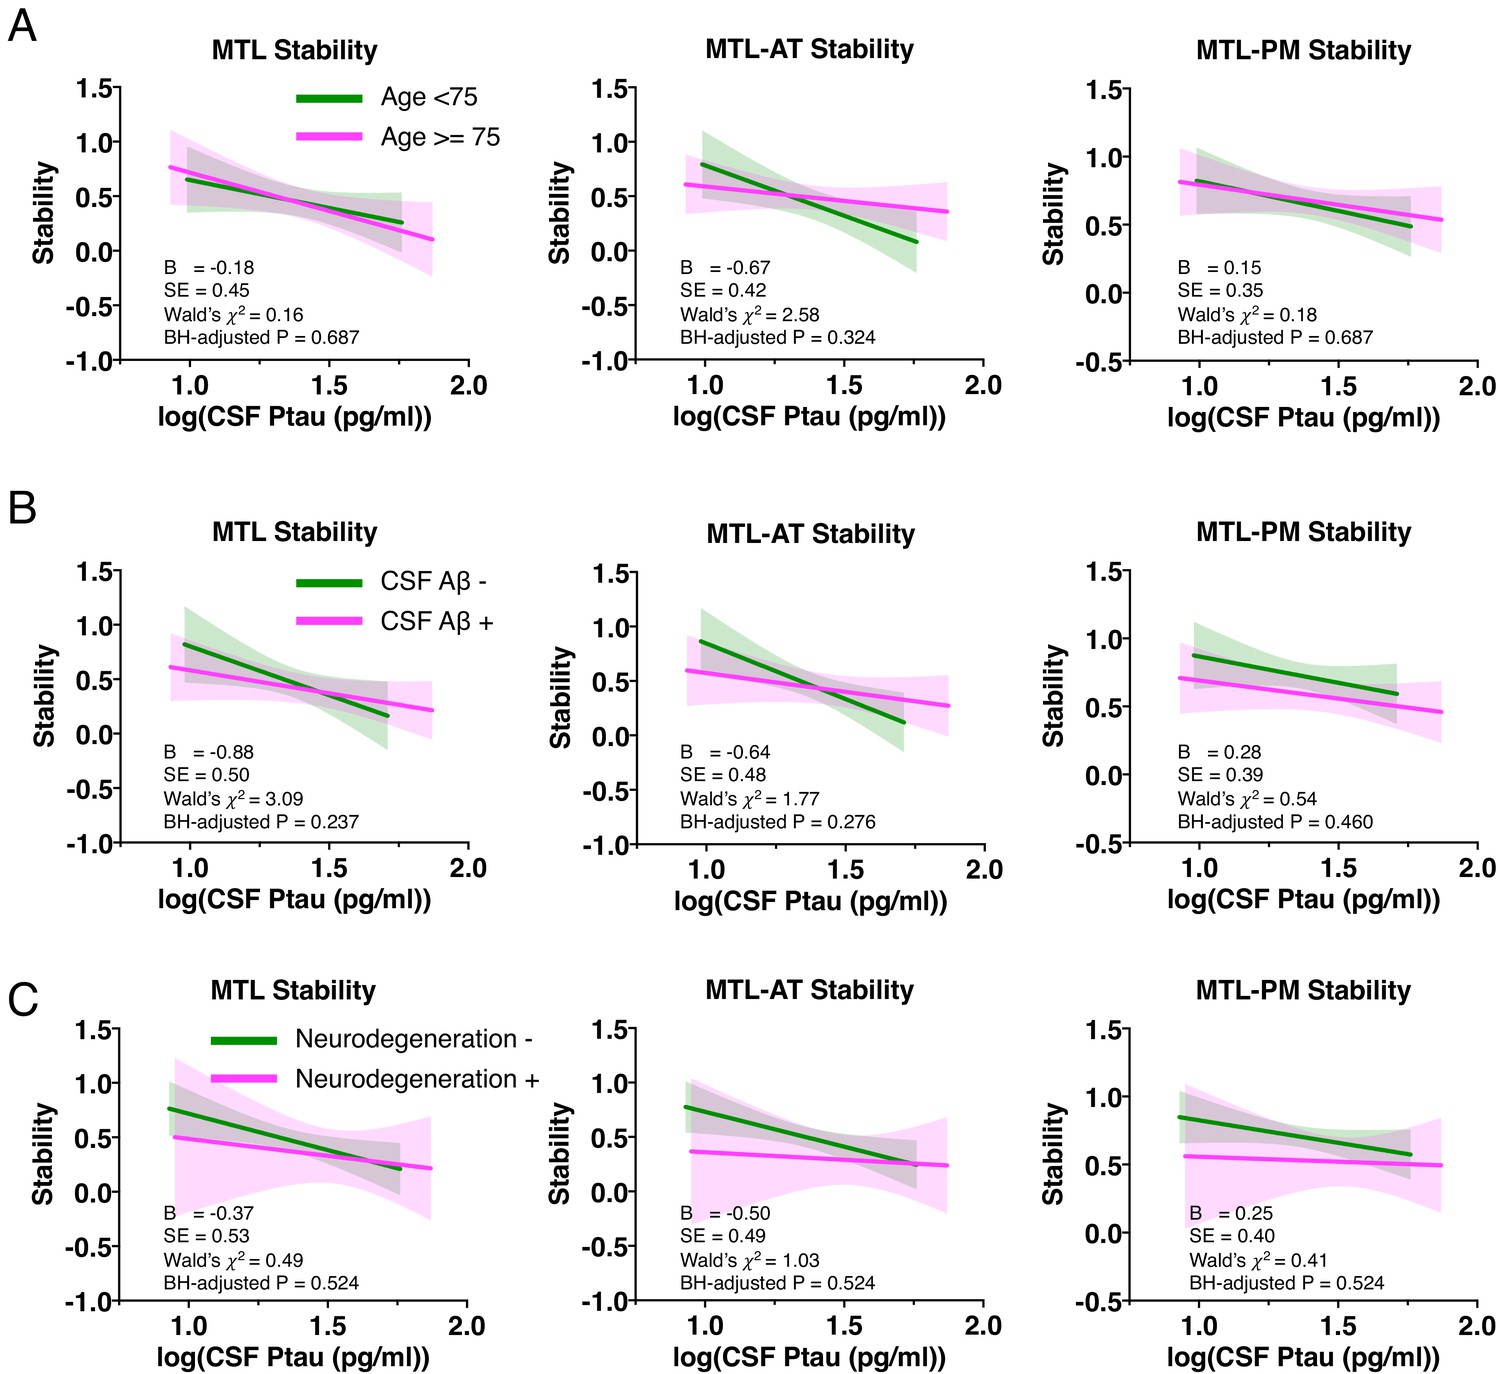
The effect of age (A), CSF Aβ pathology (B), and neurodegeneration (C) on the relationship between baseline CSF Ptau levels and the structural stability within MTL, MTL-AT, and MTL-PM in the whole sample.
-
Figure 4—source data 1
The effect of covariates on the relationship between Ptau and structural stability.
- https://cdn.elifesciences.org/articles/62114/elife-62114-fig4-data1-v3.xlsx
Figure 5
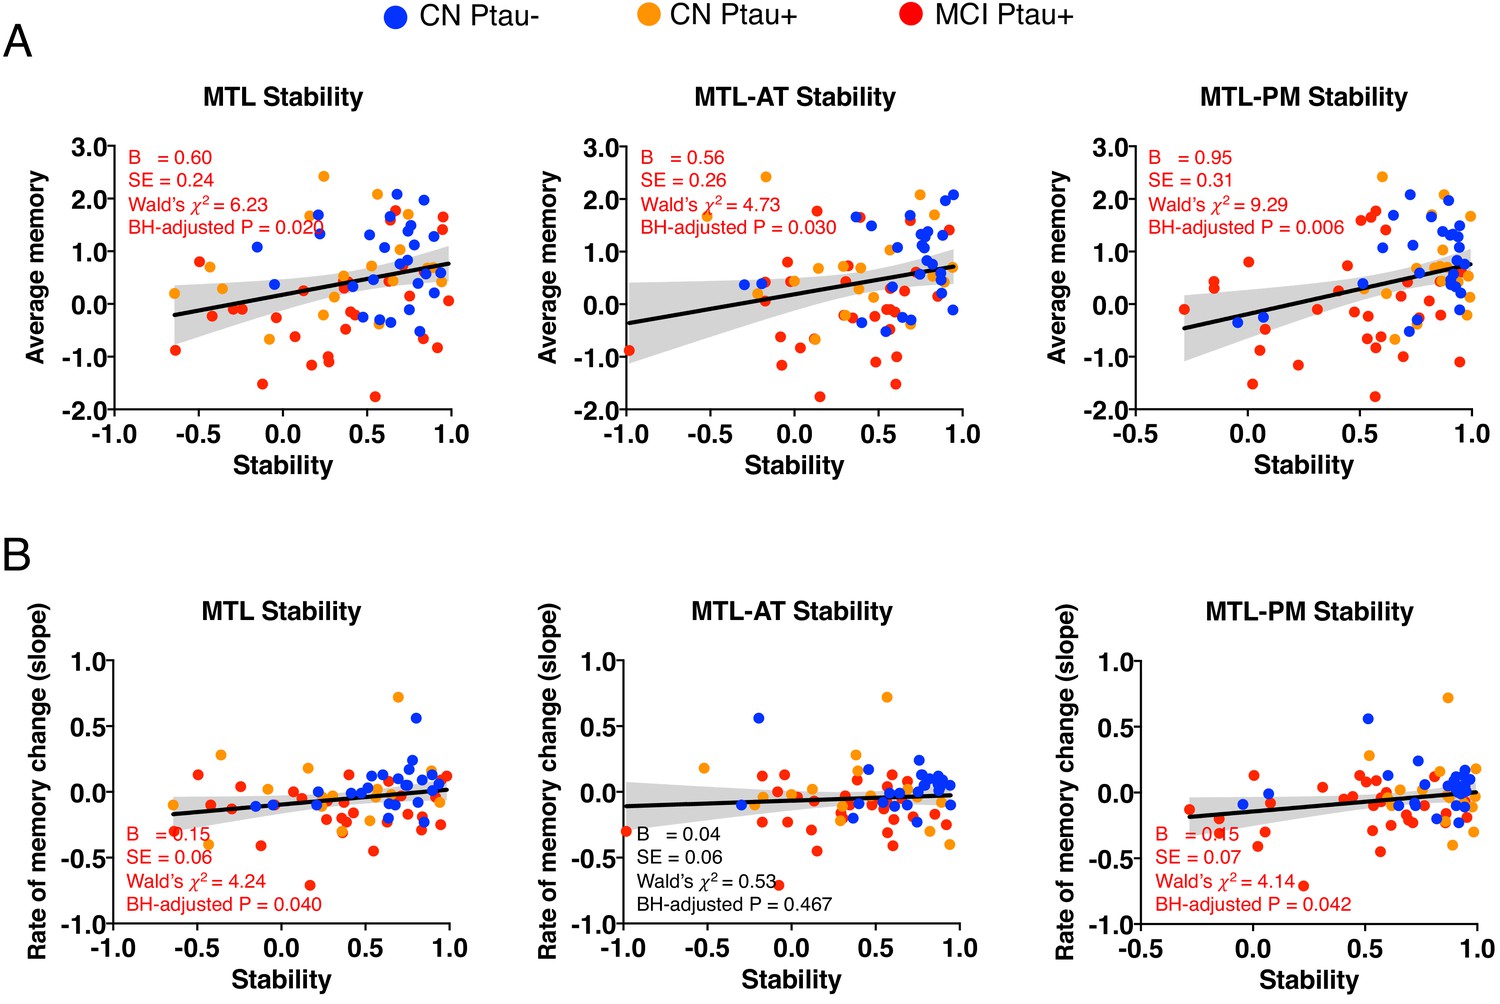
MTL structural stability predicts episodic memory.
(A) Relationship of average episodic memory over 5 years and the structural stability in the whole sample. (B) Relationship of episodic memory decline rate and the structural stability in the whole sample.
-
Figure 5—source data 1
MTL structural stability predicts episodic memory.
- https://cdn.elifesciences.org/articles/62114/elife-62114-fig5-data1-v3.xlsx
Figure 6

The moderating effect of medial temporal lobe (MTL) structural stability on the relationship between Ptau and rate of memory change.
The plot shows how structural stability within MTL affected the relationship between Ptau and rate of memory change. Participants were divided into terciles based on their MTL stability. The lowest tercile is shown in red, the middle in green, and the highest in blue. P-values indicate whether the slope of the regression line is significantly different from zero for each tercile separately.
-
Figure 6—source data 1
MTL structural stability moderates the relationship between Ptau and memory change.
- https://cdn.elifesciences.org/articles/62114/elife-62114-fig6-data1-v3.xlsx
Tables
Table 1
Baseline characteristics.
| CN Ptau– (n = 26) | CN Ptau+ (n = 18) | MCI Ptau+ (n = 30) | T, F, or χ2 tests, df1, df2, (p) | |
|---|---|---|---|---|
| Age baseline, mean (SD) | 74.0 (4.63) | 74.8 (6.04) | 73.9 (7.34) | 0.14, 2, 71 (0.87) |
| Age baseline ≥ 75, N (%) | 12 (46.2) | 8 (44.4) | 15 (50.0) | 0.16, 2 (0.92) |
| Male, N (%) | 11 (42.3) | 7 (38.9) | 18 (60.0) | 2.65, 2 (0.27) |
| Education, mean (SD) | 16.69 (2.57) | 17.28 (2.42) | 15.67 (2.35) | 2.68, 2, 71 (0.08) |
| APOEε4 carrier, N (%) | 5 (19.2)a | 7 (38.8)a | 22 (73.3)b | 14.79, 2 (<0.001) |
| CSF Ptau baseline, mean (SD) | 15.8 (4.30)a | 29.0 (7.63)b | 38.0 (12.34)c | 41.58, 2, 71 (<0.001) |
| CSF Aβ baseline, mean (SD) | 1231.1 (571.89)a | 1396.2 (690.95)a | 890.7 (383.11)b | 5.63, 2, 71 (0.005) |
| CSF Aβ-positive baseline, N (%) | 9 (34.6)a | 7 (38.9)a | 22 (73.3)b | 9.84, 2 (0.007) |
| Neurodegeneration baseline, mean (SD) | 2.97 (0.11)a | 2.89 (0.17)a | 2.77 (0.20)b | 9.68, 2, 71 (<0.001) |
| Neurodegeneration-positive baseline, N (%) | 2 (7.69)a | 3 (16.67)a | 14 (46.67)b | 12.10, 2 (0.002) |
| Episodic memory baseline, mean (SD) | 0.75 (0.81)a | 0.67 (0.79)a | 0.14 (0.84)b | 4.60, 2, 71 (0.013) |
| MOCA baseline, mean (SD) | 25.92 (2.07)a | 25.89 (2.54)a | 21.67 (2.17)b | 32.17, 2, 71 (<0.001) |
-
Note: CN, cognitively normal; MCI, amnestic mild cognitive impairment; APOEε4, apolipoprotein E ε4; SD, standard deviation; CSF, cerebrospinal fluid; Aβ, beta-amyloid-(1–42); Ptau, phosphorylated tau; MOCA, Montreal Cognitive Assessment. a, b, c represents the post hoc comparison difference from the F-test or χ2 test. Bold values indicate p < 0.05.
-
Table 1—source data 1
Baseline characteristics.
- https://cdn.elifesciences.org/articles/62114/elife-62114-table1-data1-v3.xlsx
Table 2
Dichotomized mean MD and stability of MTL.
| Mean MD of MTL at year 0 | Mean MD of MTL at year 2 | Stability of MTL | CN Ptau– (N = 26) | CN Ptau+ (N = 18) | MCI Ptau+ (N = 30) |
|---|---|---|---|---|---|
| High | High | Stable | 8 (30.8%) | 0 (0%) | 4 (13.3%) |
| High | Low | Stable | 0 (0%) | 0 (0%) | 3 (10.0%) |
| Low | High | Stable | 6 (23.1%) | 1 (5.6%) | 0 (0%) |
| Low | Low | Stable | 4 (15.4%) | 7 (38.9%) | 4 (13.3%) |
| High | High | Instable | 2 (7.6%) | 6 (33.3%) | 4 (13.3%) |
| High | Low | Instable | 0 (0%) | 2 (11.1%) | 8 (26.7%) |
| Low | High | Instable | 3 (11.5%) | 0 (0%) | 3 (10.0%) |
| Low | Low | Instable | 3 (11.5%) | 2 (11.1%) | 4 (13.3%) |
-
Note: Mean MD is the averaged MD across all connections within MTL. MD, mean diffusivity; MTL, medial temporal lobe.
-
Table 2—source data 1
Dichotomized mean MD and stability of MTL.
- https://cdn.elifesciences.org/articles/62114/elife-62114-table2-data1-v3.xlsx
Additional files
Download links
A two-part list of links to download the article, or parts of the article, in various formats.
Downloads (link to download the article as PDF)
Open citations (links to open the citations from this article in various online reference manager services)
Cite this article (links to download the citations from this article in formats compatible with various reference manager tools)
Longitudinal stability of medial temporal lobe connectivity is associated with tau-related memory decline
eLife 9:e62114.
https://doi.org/10.7554/eLife.62114


