Structural basis for transcription complex disruption by the Mfd translocase
- Laboratory of Molecular Biophysics, The Rockefeller University, United States
- Laboratory of Mass Spectrometry and Gaseous Ion Chemistry, The Rockefeller University, United States
Figures
Figure 1
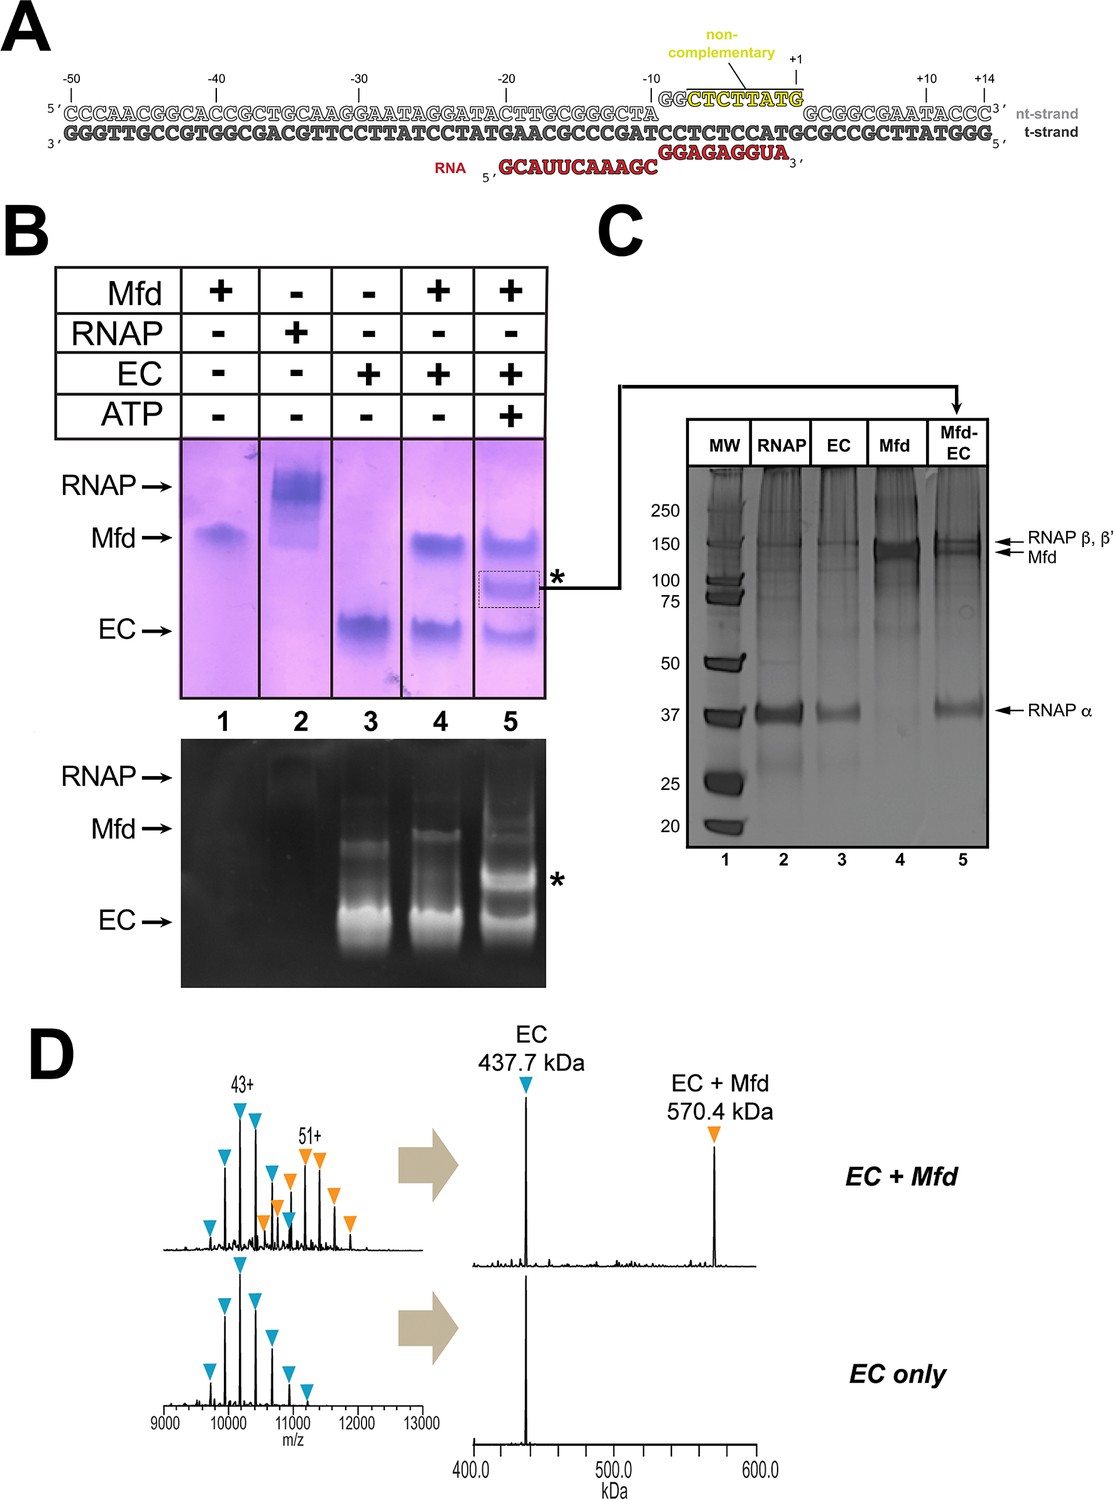
Formation of stable complexes between Mfd and an RNA polymerase (RNAP) elongation complex (EC).
(A) The nucleic acid scaffold used for native mass spectrometry (nMS) and cryo-EM. The region of the nt-strand DNA shown in yellow is non-complementary with the t-strand. (B) Native gel electrophoretic mobility shift assay reveals the formation of a unique complex in the presence of an Eco RNAP EC (formed on the nucleic acid scaffold shown in A), Mfd, and 2 mM ATP (band labeled '*', lane 5). The same gel was stained with Coomassie blue to reveal protein (top panel) or Gel Red to reveal nucleic acids (bottom panel). (C) The band labeled '*' (panel B, lane 5) was excised from the gel and analyzed by SDS-polyacrylamide gel electrophoresis with silver staining, revealing the presence of RNAP and Mfd (lane 5). (D) nMS spectra and the corresponding deconvolved spectra for EC and Mfd-EC samples with the nucleic acid scaffold shown in (A). RNAP and the scaffold form a stable EC with 1:1 stoichiometry (437.7 kDa complex). Upon incubation of this complex with sub-stoichiometric Mfd (Mfd:EC ratio of 1:2) and 2 mM ATP, about 40% of the EC was converted to the Mfd-EC complex (570.4 kDa) with 1:1 stoichiometry. Excess EC was mixed with Mfd because unbound Mfd yielded extremely high relative peak signals that dominated the spectrum, making interpretation and quantitation difficult.
Figure 2 with 4 supplements
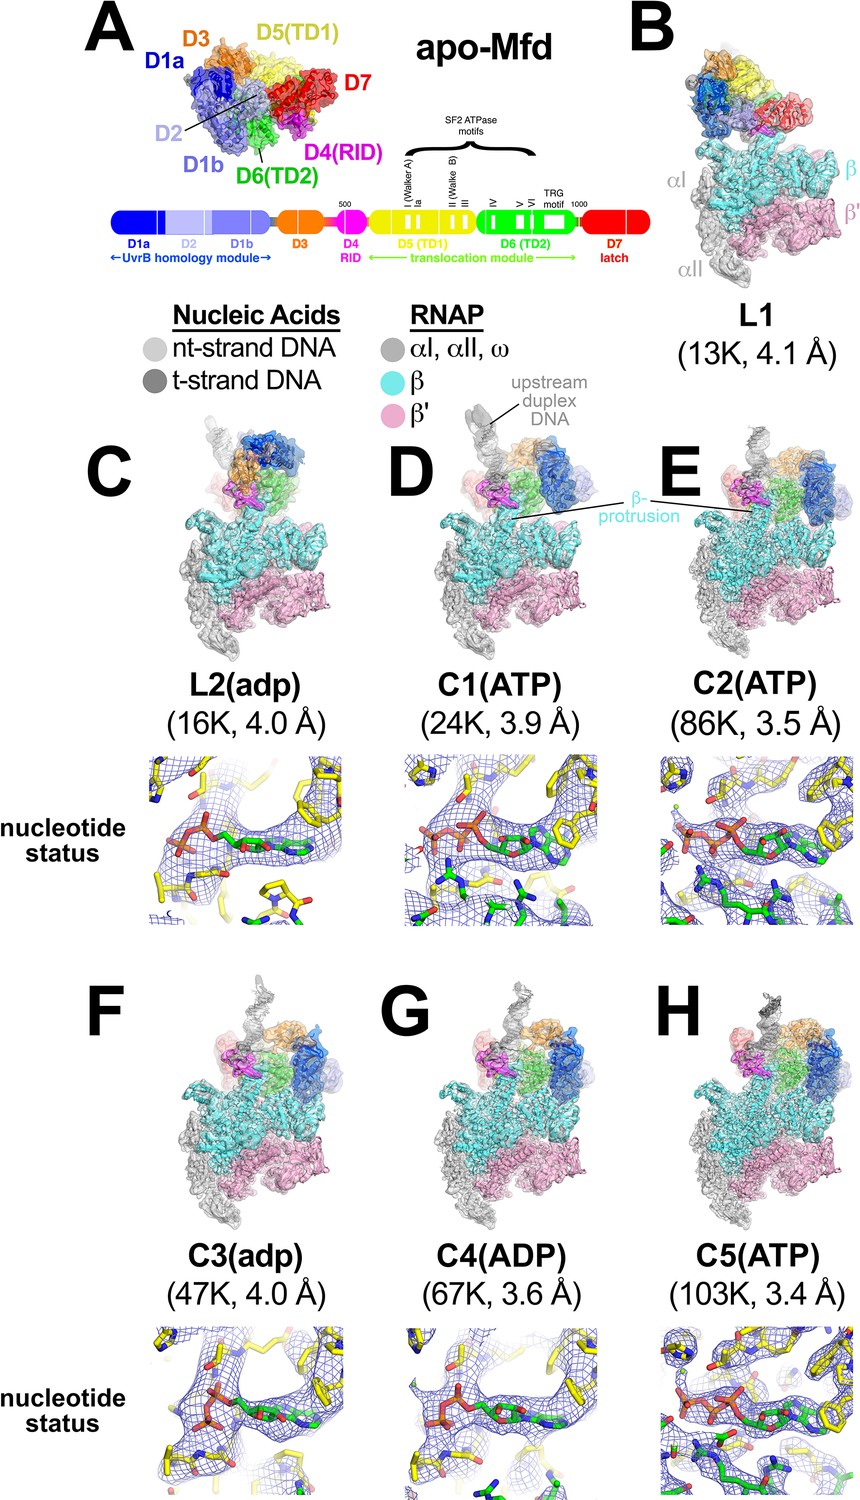
Mfd-elongation complex (EC) structures.
(A) The structure of apo-Mfd [PDB 2EYQ; Deaconescu et al., 2006] is shown as a transparent molecular surface surrounding a backbone ribbon. The domain nomenclature and color coding are schematically represented by the horizontal bar below, which represents the 1148-residue Eco Mfd primary sequence (every 100 residues are marked by a vertical white line). Structural domains are shown as thick bars; thin bars represent connecting linkers. The UvrB homology module (D1a-D2-D1b) is structurally homologous to the namesake elements of UvrB (Deaconescu et al., 2006; Selby and Sancar, 1993). D4 is the RNA polymerase (RNAP) interacting domain (RID). D5 (Translocation Domain 1, or TD1) and D6 (TD2) contain the seven SF2 ATPase motifs denoted by white boxes and labeled (Gorbalenya and Koonin, 1993) as well as the TRG motif (Chambers et al., 2003; Mahdi et al., 2003), and together comprise the translocation module. (B)–(H). (Top) Overall structures of Mfd-EC complexes obtained by cryo-EM. The cryo-EM density maps low-pass filtered to the local resolution (Cardone et al., 2013) are shown as transparent surfaces with final models superimposed. Mfd is colored as shown in (A); the RNAP and nucleic acids are colored according to the key. (Bottom) Cryo-EM density (blue mesh) and superimposed models in the region around the Mfd nucleotide-binding site. Bound nucleotide could not be visualized in the L1 cryo-EM map (B) because of the low resolution. The nucleotide status (either ADP or ATP/ATP•P) could be determined from the cryo-EM map alone for C1(ATP), C2(ATP), C4(ADP), and C5(ATP) (see Supplementary file 2). Determination of the nucleotide status for L2(adp) and C3(adp) was not possible from the cryo-EM maps alone (see Supplementary file 2), but other arguments suggest that these two states were bound to ADP (see text). (B) L1. (C) L2(adp). (D) C1(ATP). (E) C2(ATP). (F) C3(adp). (G) C4(ADP). (H) C5(ATP).
Figure 2—figure supplement 1
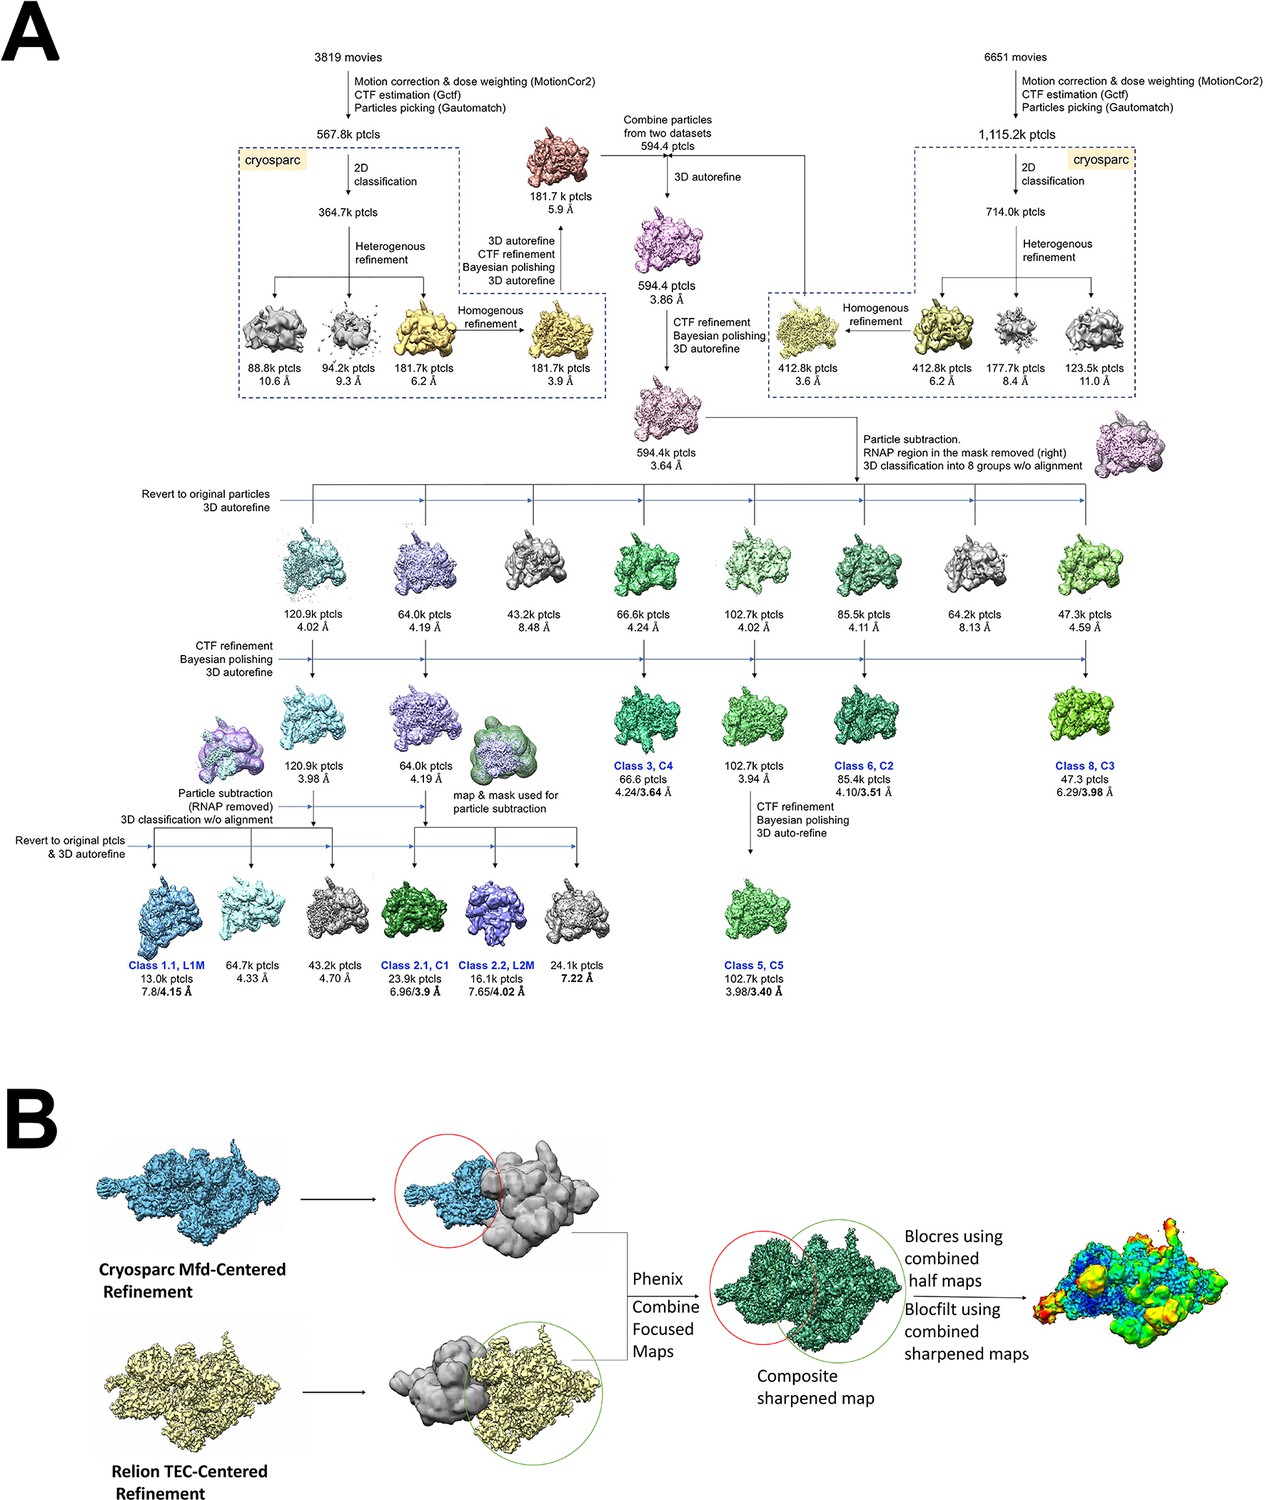
Cryo-EM processing pipeline for Mfd-elongation complex (EC) complexes.
(A) Cryo-EM processing pipeline for Mfd-EC complexes. (B) EC-centered and Mfd-centered maps were combined using the PHENIX combine_focused maps command (Adams et al., 2010).
Figure 2—figure supplement 2
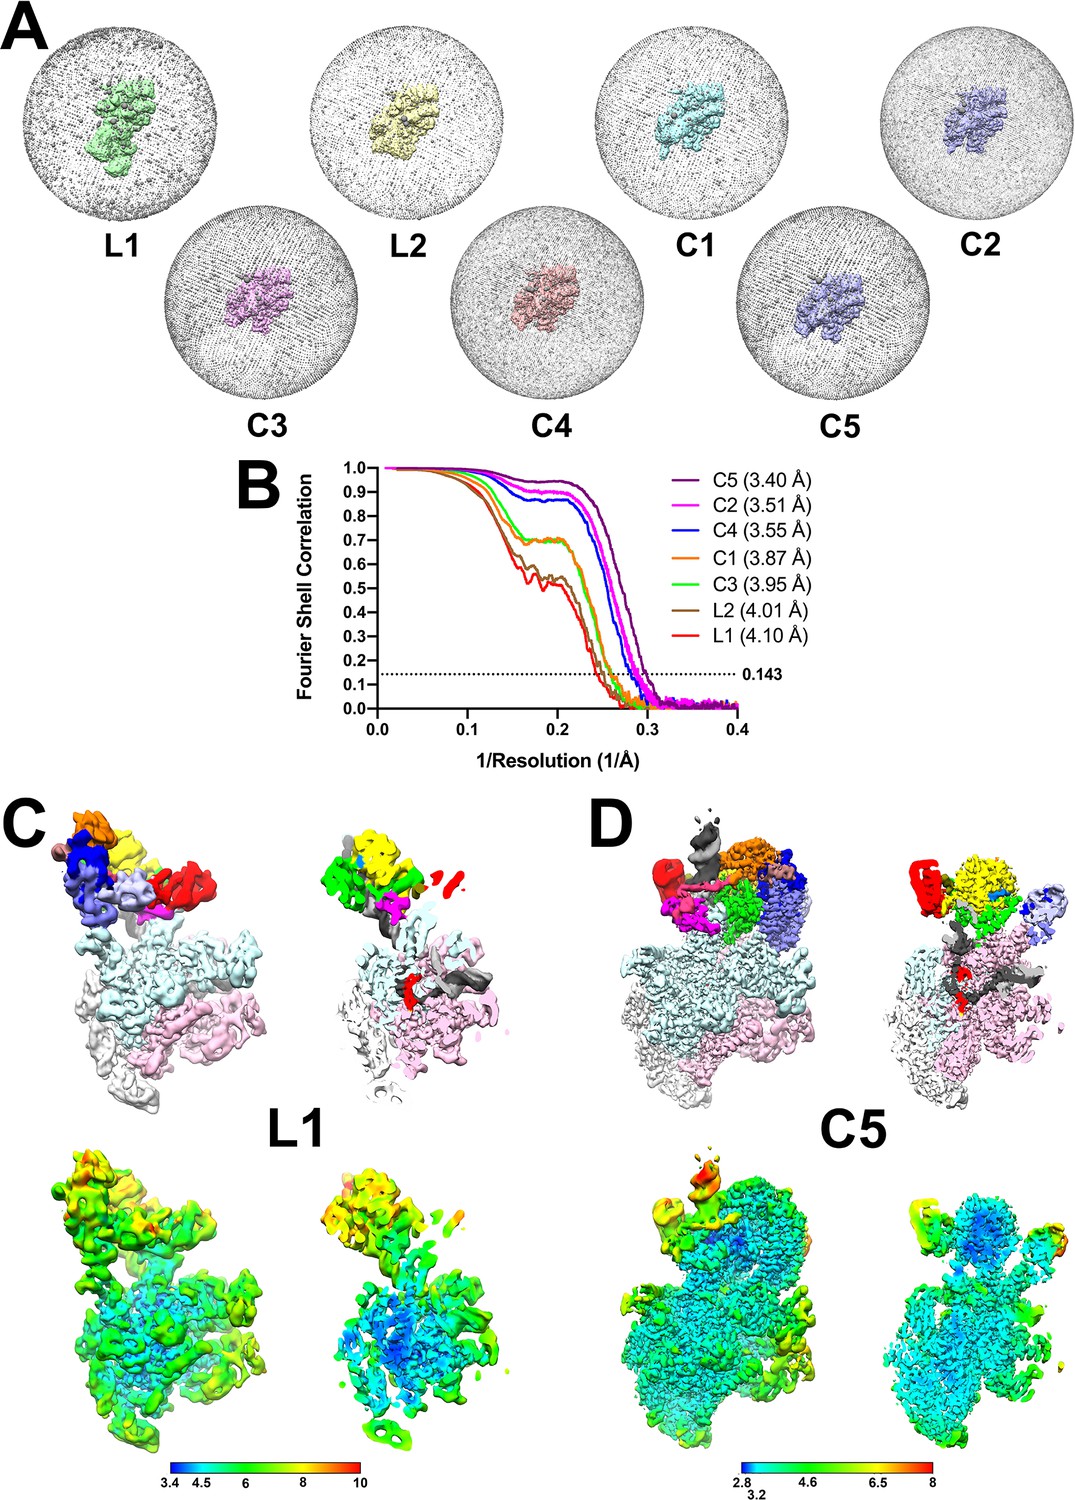
Cryo-EM of Mfd-elongation complex (EC) complexes.
(A) Angular distribution of particle projections for each structural class. (B) Gold-standard FSC for the EC-centered/Mfd-centered composite maps, calculated by comparing the two independently determined half-maps using the MTRIAGE module (Afonine et al., 2018) of PHENIX (Adams et al., 2010). The dotted line represents the 0.143 FSC cutoff. (C and D) (Top) Views of the cryo-EM density map, colored according to the key of Figure 2. The right view is a cross-section through the center of the left view. (Bottom) Same views as on top but colored by local resolution (Cardone et al., 2013). C.L1, the lowest resolution structural class. D.C5, the highest resolution structural class.
Figure 2—figure supplement 3
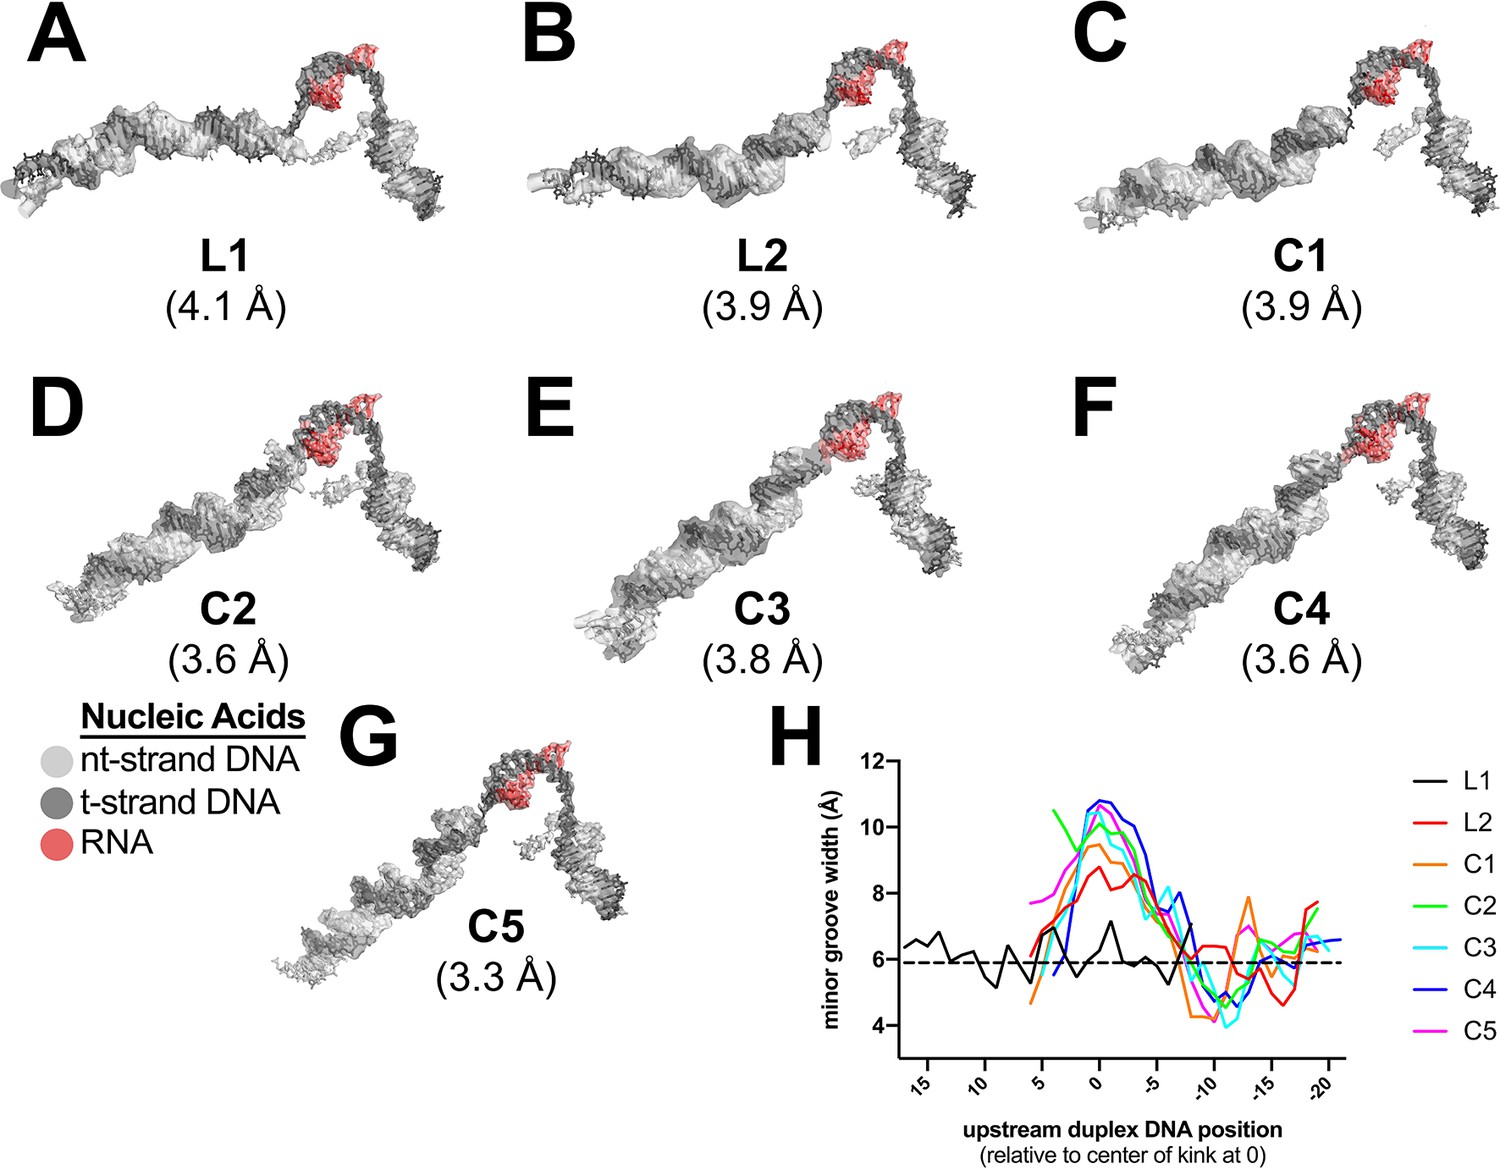
Examples of cryo-EM density and Mfd-induced DNA kink.
(A)–(G). Cryo-EM density maps, filtered according to the local resolution (Cardone et al., 2013), corresponding to the nucleic acids, are shown as transparent surfaces with the final refined models superimposed. The color coding is shown in the key. (A) L1. (B) L2. (C) C1. (D) C2. (E) C3. (F) C4. (G) C5. (H) Plot showing the minor groove width [calculated using Curves+ (Lavery et al., 2009)] of the upstream duplex DNA, aligned by the center of the kink (defined as position '0').
Figure 2—video 1
The Mfd loading cycle.
The video starts with a top view of the elongation complex (EC). The upstream duplex DNA exits the complex in the ~11 o'clock direction. The direction of transcription would be left-to-right. The color coding of the RNA polymerase (RNAP) subunits is as in Figure 2; αI, αII, ω, light gray; β, light cyan; β', light pink. The t-strand DNA is colored dark gray, and the nt-strand DNA light gray. The video progresses through the Mfd loading pathway {[L0] → L1 → L2 → C1}. To begin, the apo-Mfd structure (color coded as in Figure 2A) enters from the upper-right and the Mfd-D4(RID) docks with the RNAP βprotursion and the upstream duplex DNA to generate [L0]. Through the progression of structures, the current structure shown in the video is highlighted in red (upper left). During the transition from L1 → L2, Mfd-D1-D3 are removed for clarity (as modeled in [L1.5a] and [L1.5b] in Figure 5), and the Mfd translocation module [D5(TD1)/D6(TD2)] translocates on the DNA, moving toward the RNAP until D6(TD2) encounters the RNAP βprotrusion. The L2 → C1 transition mainly involves repositioning of Mfd-D1-D3, finally exposing the UvrA-interacting surface of Mfd-D2.
Figure 3
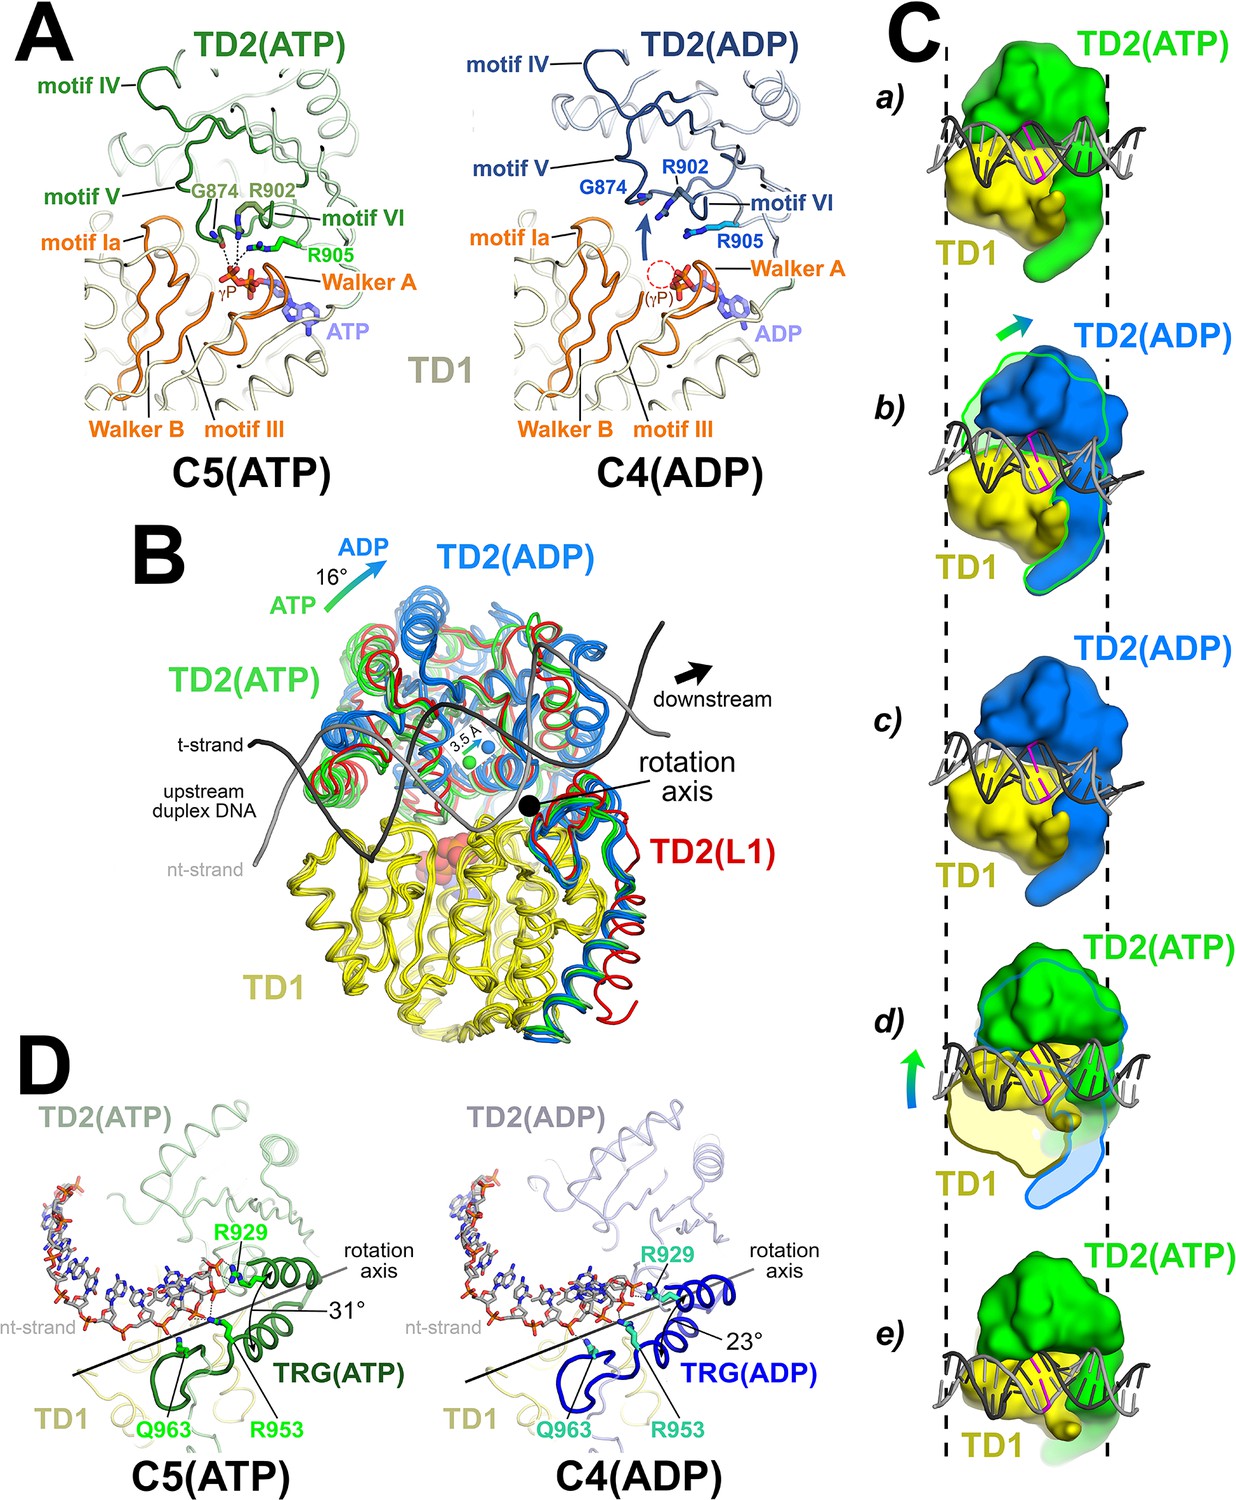
The Mfd translocation module and the DNA translocation mechanism.
(A) Conformational changes of the Mfd translocation module induced by ATP hydrolysis and Pi release. The structural environments of the ATP [left; C5(ATP)] or ADP [right; C4(ADP)] binding sites are shown. The protein is shown as a backbone worm; TD1 is colored pale yellow but the SF2 ATPase motifs of TD1 (Walker A, motif Ia, Walker B, motif III) are colored orange; TD2(ATP) or (ADP) are colored pale green or light blue, respectively, but the SF2 ATPase motifs of TD2 (motifs IV, V, and VI) are colored dark green or dark blue. The nucleotide is shown in stick format with blue carbon atoms. The side chain or backbone atoms of three key residues, G874 (motif V), R902 (motif VI), and R905 (just beyond motif VI), are also shown. The backbone carbonyl of G874 and the side chains of R902 and R905 form polar interactions with the ATP γ-phosphate (denoted as gray dashed lines). In the ADP structure, these interactions are lost due to the missing γ-phosphate (denoted by the dashed red circle), causing TD2 to swing away from TD1 (denoted by the thick arrow). Here, 'polar contacts' include both hydrogen bonds (≤3.5 Å) and ionic interactions. Ionic interactions can include both close range interactions (where the hydration shells of the two oppositely charged moieties are displaced) that are typically called salt-bridges (≤3.5 Å), but can also include longer range interactions where the two oppositely charged moieties remain hydrated but their Coulombic interaction is favorable (Kumar and Nussinov, 2002; Xu et al., 1997). These longer-range favorable interactions are significant and extend to well beyond 4.5 Å distance (Yu et al., 2019). (B) The translocation modules of all seven Mfd-elongation complex (EC) structures were superimposed by alignment of TD1 (colored yellow) α-carbons. The resulting positions of TD2 clustered into two groups, those with ATP (TD2 colored green) or ADP (TD2 colored blue). TD2 of L1 is shown in red and clusters with the ATP-bound structures. The relative disposition of the upstream duplex DNA is also shown (gray phosphate backbone worms). TD2(ATP) and TD2(ADP) are related by an ~16° rotation (denoted by the thick arrow, upper left) about an axis roughly perpendicular to the DNA helical axis (denoted by the black dot), resulting in a 3.5 Å shift of the TD2 center of mass roughly parallel to the DNA helical axis [center of mass positions for TD2(ATP) and TD2(ADP) denoted by the green and blue spheres, respectively], corresponding to one base pair rise of B-form DNA. The 3.5 Å shift of the TD2 center of mass is not sensitive to which structures are used to perform the calculation. (C) Inchworm model for duplex DNA translocation. Duplex DNA is shown as a cartoon (for reference, a central base pair is colored magenta). TD1 is colored yellow, while TD2 is colored green (ATP) or blue (ADP). In (a), both TD1 and TD2(ATP) interact with the duplex DNA (the initial positions of TD1 and TD2 on the DNA are denoted by the vertical dashed reference lines). Upon ATP hydrolysis and Pi release, TD2(ADP) rotates away from TD1 (b) and interacts with the DNA one base pair downstream (to the right, c). With the release of ADP, ATP binding induces TD1 to rotate toward TD2 (d). In (e), TD1 and TD2(ATP) both interact with the duplex DNA but one base pair to the right. Also see Video 1. (D) Conformational changes of the TRG motif. Protein is shown as a backbone worm; TD1 is colored pale yellow; TD2(ATP) or (ADP) are colored pale green or light blue, respectively, but the TRG motifs are colored dark green or dark blue. The nt-strand of the upstream duplex DNA is shown in stick format (the t-strand of the DNA is not shown for clarity). Three key TRG motif residues interact with the nt-strand DNA backbone, R929, R953, and Q963 (side chains shown, polar interactions with the DNA denoted by the gray dashed lines). The rotation axis of the TD2(ATP) → TD2(ADP) conformational change passes directly through the TRG motif helical hairpin linker, which serves as the hinge. Opening of TD2(ADP) causes the TRG helical hairpin to pinch closed nearly 10 Å.
Figure 4 with 1 supplement
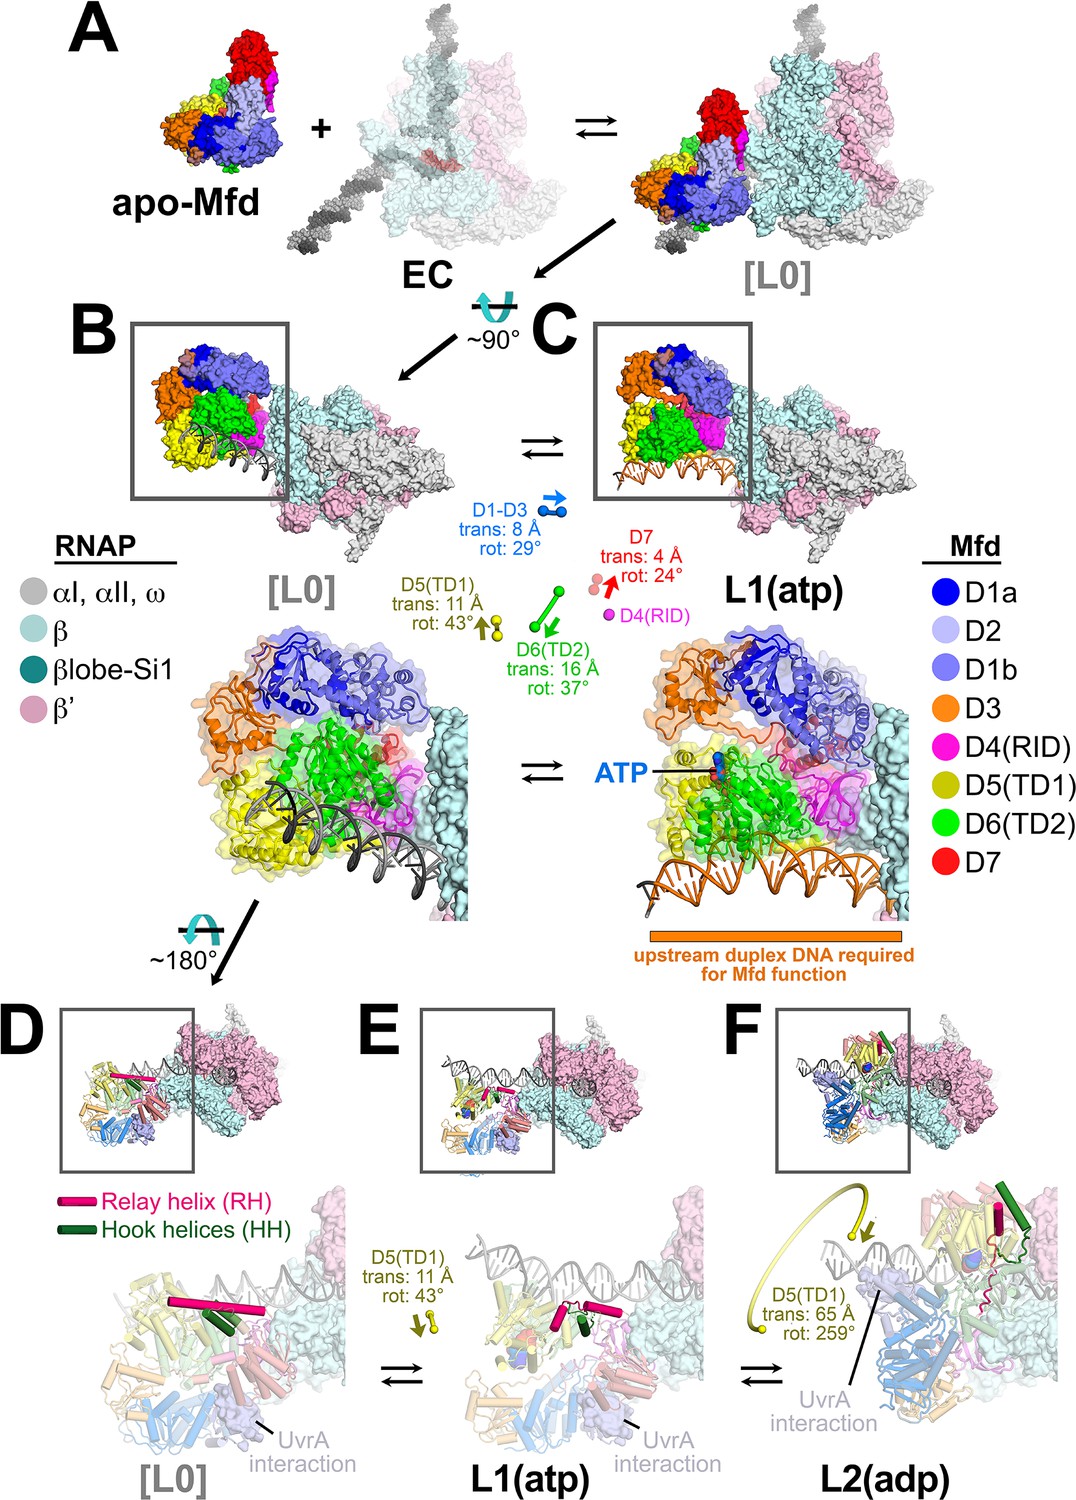
Initial stages of the Mfd loading pathway.
Color coding of RNA polymerase (RNAP) subunits and Mfd domains are shown in the keys on the left and right, respectively. (A) Apo-Mfd PDB 2EYQ (Deaconescu et al., 2006) combines with an elongation complex (EC) [PDB 6ALF (Kang et al., 2017) with upstream and downstream duplex DNA extended] to form a putative initial encounter complex [L0], which was modeled by superimposing apo-Mfd D4(RID) onto the MfdL1-D4(RID) and adjusting the trajectory of the upstream duplex DNA. (C) The [L0] → L1(atp) transition is shown. In this view, the downstream duplex DNA (and the direction of transcription) points away from the viewer. (Top) The Mfd-EC structures are shown as molecular surfaces with DNA shown in cartoon format. The boxed regions are magnified below. (Bottom) Mfd is shown as a transparent molecular surface surrounding a backbone ribbon. In the middle, the colored spheres denote the relative positions of the Mfd domain center-of-masses (com), with connecting lines denoting the motions from the L[0] → L1(atp) transition (the translations of the com's, as well as the relative rotation of the domains, are listed. The D4(RID) motion is negligible; also see Supplementary file 4). D.[L0]. E.L1(atp): The region of the upstream duplex DNA colored orange and denoted by the orange stripe was found to be required for Mfd function on an EC (Park et al., 2002). (F) View of the [L0] → L1(atp) → L2(adp) transition, highlighting the structural changes in the Mfd relay helix (RH) and hook helices (HH). In this view, the Mfd-EC complex is rotated ~180° about a horizontal axis, so the downstream duplex DNA (and direction of transcription) is toward the viewer. (Top) The RNAP is shown as a molecular surface, with nucleic acids shown in cartoon format. Mfd is shown with cylindrical helices. Color coding is as above but the RH is colored hot pink, and the HHs are colored dark green. The boxed region is magnified below. (Bottom) The complexes are shown in faded colors except for the RH and HHs. Also shown as a molecular surface are the residues of Mfd-D2 that interact with UvrA [determined from PDB 4DFC (Deaconescu et al., 2012)]. D.L[0]: The RH at the very N-terminus of TD1 extends for 30 residues and is surrounded by the HHs at the very C-terminus of TD2. The UvrA-interacting surface of Mfd-D2 is occluded by D7 (Deaconescu et al., 2006). E.L1(atp): The middle portion of the RH helix unfolds and the RH kinks about 112° around the second HH due to the translation/rotation of TD1 (denoted) and also TD2. The UvrA-interacting surface of Mfd-D2 is still occluded by D7. F.L2(adp): The transition from L1(atp) → L2(adp) involves a 259° rotation of TD1 around the backside of the DNA, as well as a 65 Å translation toward the RNAP (denoted). This is likely accomplished by ATP-hydrolysis-dependent walking of the Mfd translocation module and D7 along the DNA until it bumps into the RNAP. The corkscrewing translocation module unfolds the N-terminal half of the RH, wrapping it around the DNA as it goes. In this process D2 is separated from D7 but the UvrA-interacting surface of D2 is now occluded by the DNA. Also see Figure 2—video 1.
Figure 4—figure supplement 1
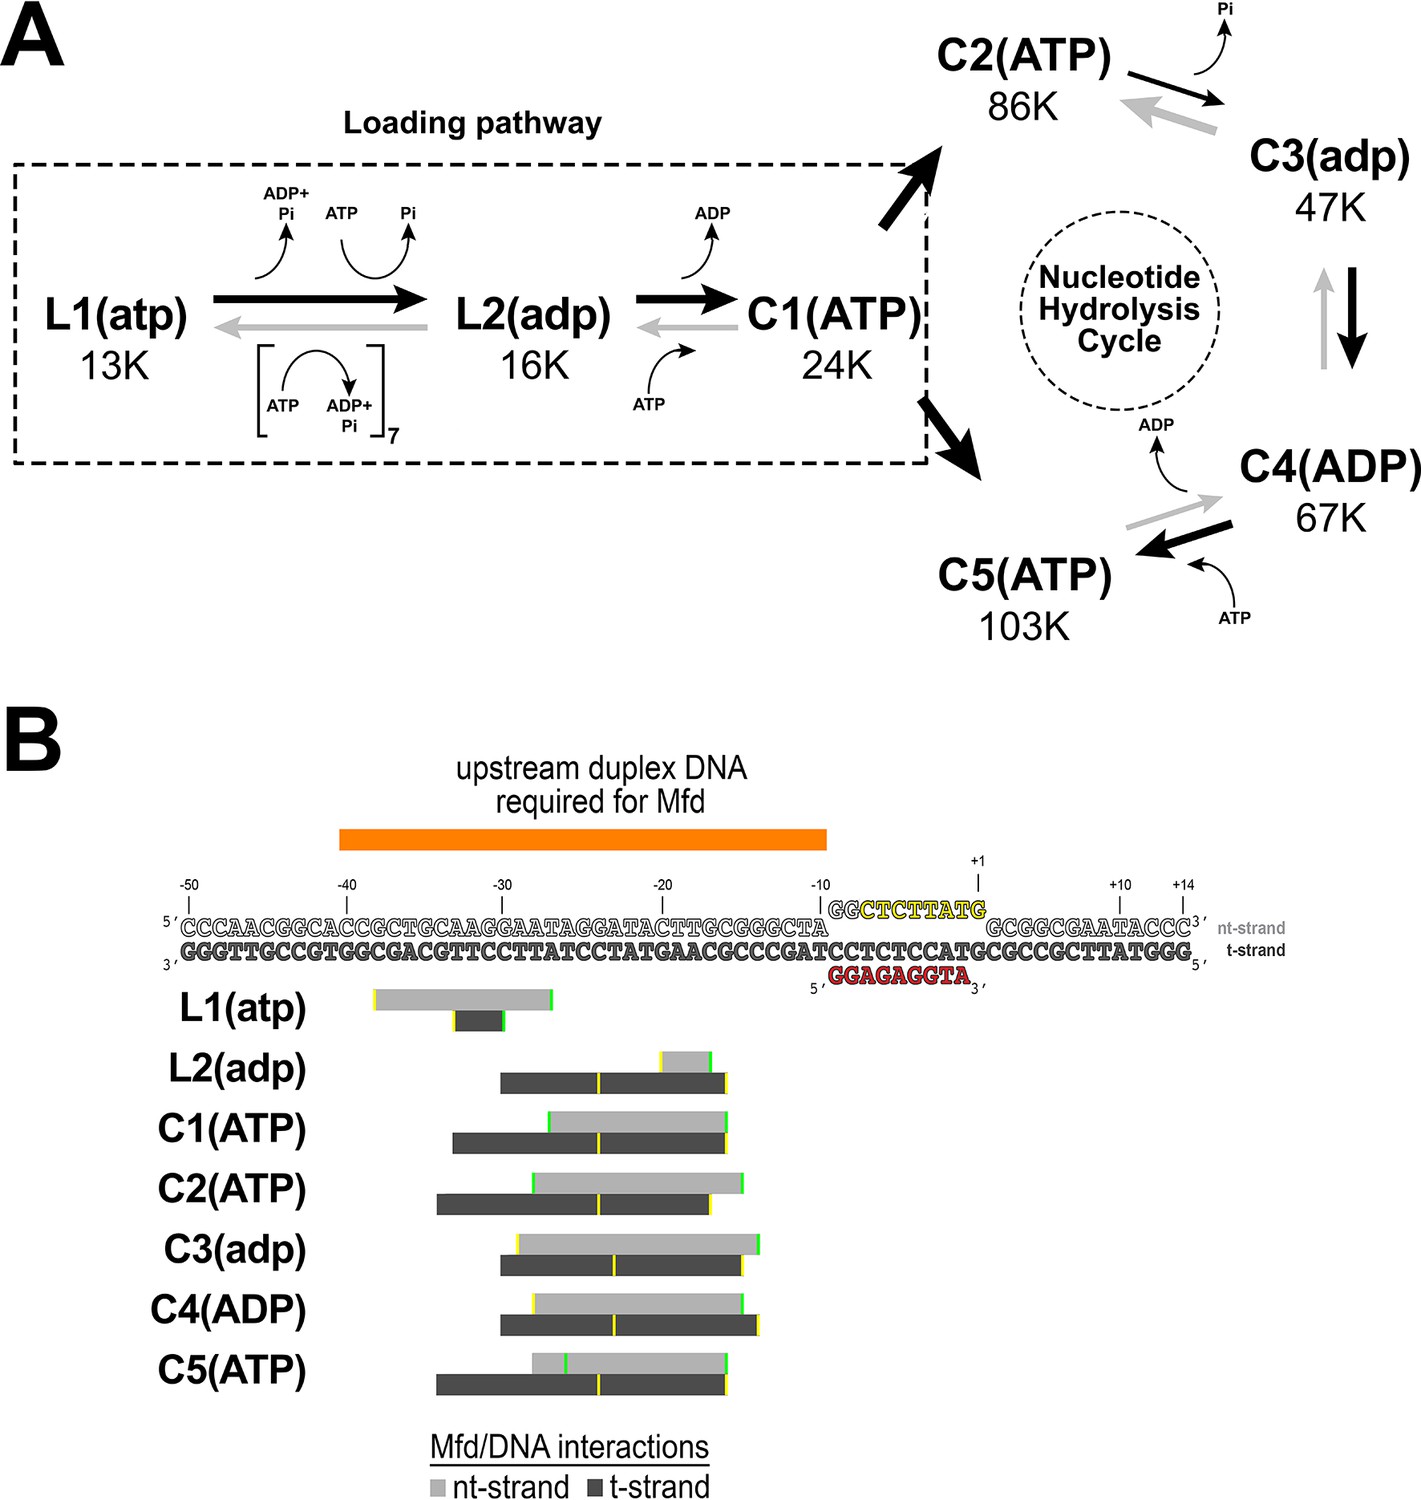
Putative structural pathway for Mfd activity and Mfd/DNA interactions.
(A) Putative ordered pathway of seven Mfd-elongation complex (EC) structures (Figure 2B–H). Each structure is shown in its position along with the number of particles that gave rise to that structural class (Figure 2—figure supplement 1). All the structures came from identically prepared samples, so the particle numbers are likely related to the stability of each complex. L1(atp) was placed first in the pathway because the Mfd component [Mfd(atp)L1 most closely superimposes with apo-Mfd (Supplementary file 4)]. The structures can be grouped into two main groups, L1(atp) and L2(adp), which do not superimpose well with any of the other structures, and C1(ATP), C2(ATP), C3(adp), C4(ADP), and C5(ATP), which are all relatively similar to each other (Supplementary file 4, Figure 2—figure supplement 3A). We thus place L1(atp) and L2(adp) in a loading pathway (also see Figure 2—video 1), while C1–C5 represent the fully EC-engaged nucleotide hydrolysis cycle (NHC) for Mfd (see Figure 7—video 1). As described in the text, the complete loading pathway requires a minimum of 10 ATP hydrolysis events, while each cycle of the NHC requires one ATP hydrolysis. (B) (Top) The nucleic acid scaffold is shown (same as Figure 1A except the upstream single-stranded RNA is not shown for clarity). Above the sequences, the orange bar denotes the extent of upstream duplex DNA required for Mfd function (Park et al., 2002). The gray bars below denote the extent of Mfd/DNA interactions in the seven Mfd-EC structures (light gray bar, nt-strand interacts; dark gray bar, t-strand). The interactions of Mfd(atp)L1 with the DNA explain the requirement for ~40 base pairs of upstream duplex DNA (Park and Roberts, 2006) and indicate that L1(atp) is an obligate intermediate in the pathway.
Figure 5 with 1 supplement
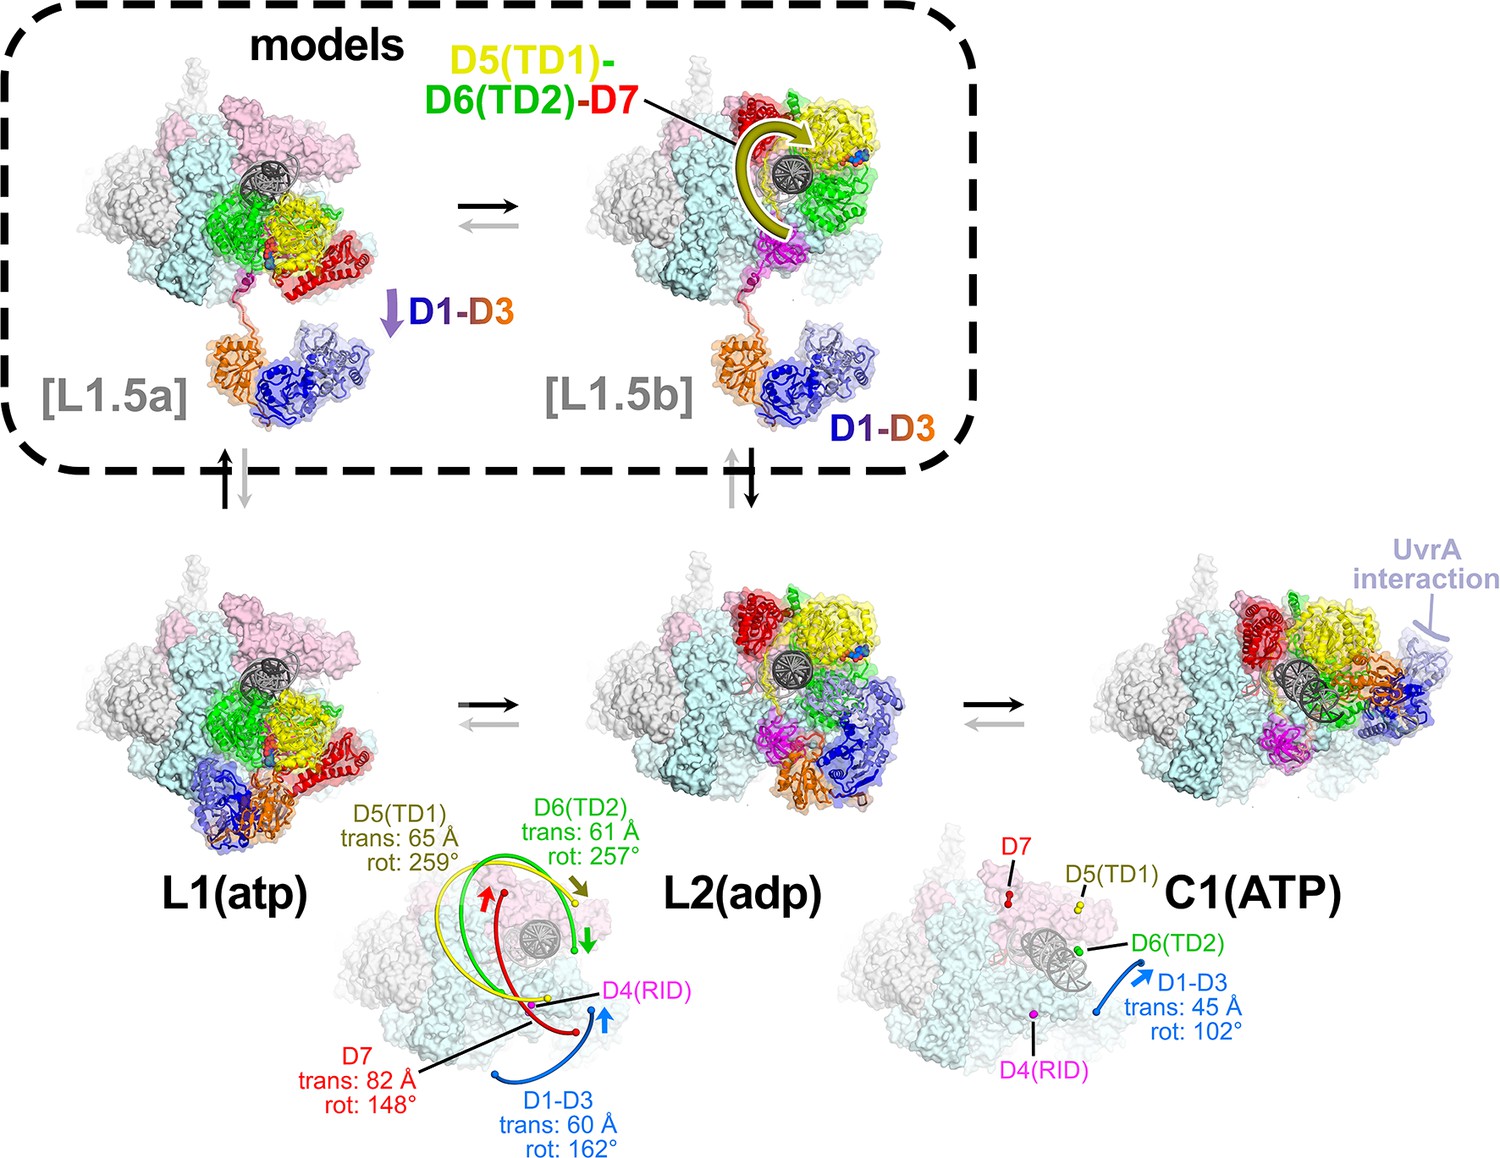
The L1(atp) → L2(adp) → C1(atp) transition.
(A) A back view of the Mfd-elongation complex (EC) structures is shown, viewing down the axis of the upstream duplex DNA (the direction of transcription would be to the right). The RNA polymerase (RNAP) is shown as a molecular surface with nucleic acids shown in cartoon format. Mfd is shown as transparent molecular surfaces surrounding the backbone ribbon. The bottom row shows the transition through the experimental structures [L1(atp) → L2(adp) → C1(ATP)]. Below that is denoted the translations and rotations of the Mfd domains associated with each transition (superimposed on the EC structure). The large translation/rotation of Mfd D5(TD1)-D6(TD2)-D7 in the L1(atp) → L2(adp) transition must occur by clockwise corkscrewing around the DNA minor groove in order to leave behind the unfolded portion of the RH, which wraps around the DNA. The configuration of Mfd D1–D3 in L1(atp) would block this transition and also result in the entanglement of linkers; thus, we propose that this transition is facilitated by transient intermediates [L1.5a] and [L1.5b], which have been modeled with displaced Mfd D1–D3 tethered by the long linker connecting D3 with the D4(RID). This allows the unencumbered transition of Mfd D5(TD1)-D6(TD2)-D7 from [L1.5a] to [L1.5b] (illustrated by the thick yellow arrow). Mfd D1-D3 then accommodates in a new configuration in L2(adp). The L2(adp) → C1(ATP) transition involves another large translation and rotation of D1–D3 (denoted), which finally exposes the Mfd-D2 UvrA-interacting surface. This transition is also illustrated in Figure 2—video 1.
Figure 5—figure supplement 1
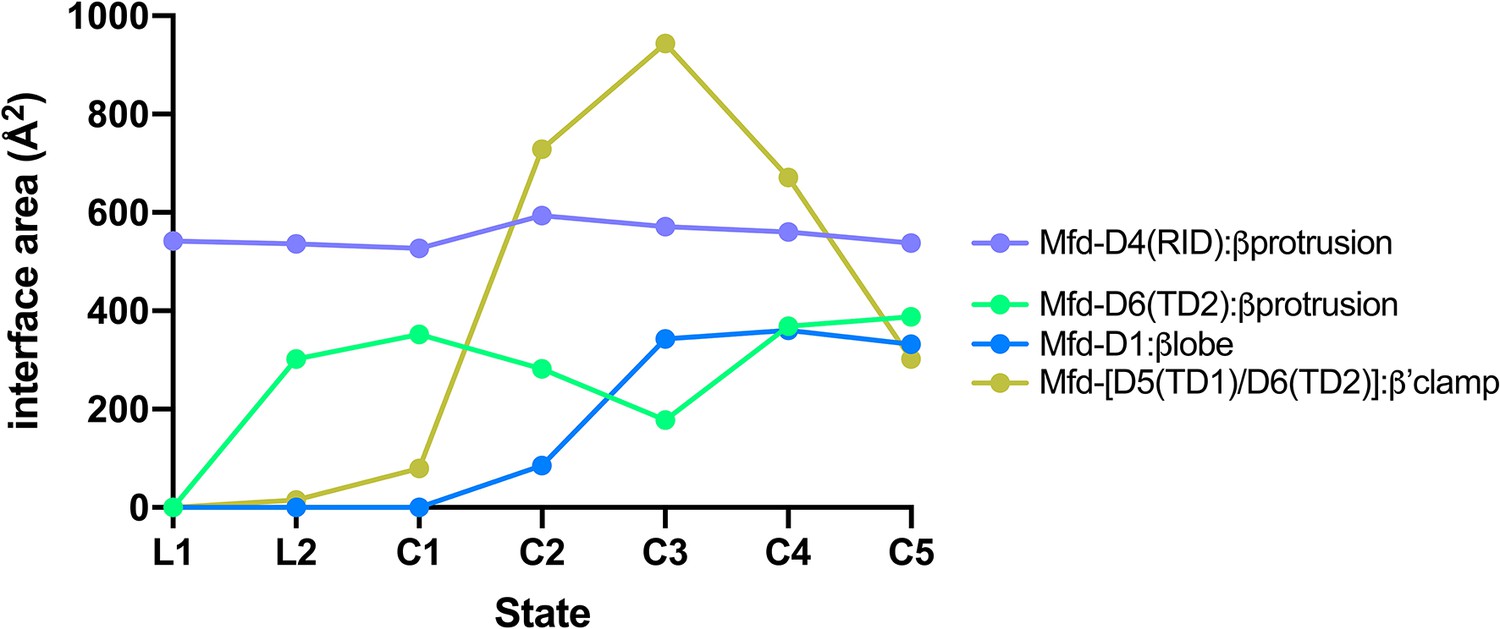
Selected interdomain Mfd:RNAP interface areas.
Interface areas [calculated using the PDBePISA server; (Krissinel and Henrick, 2007)] for selected Mfd:RNAP interdomain interfaces, plotted for each Mfd-elongation complex (EC) structural state. Mfd-D4(RID):βprotrusion: The initial engagement of Mfd with the RNA polymerase (RNAP) is through the Mfd-D4(RID):βprotrusion interaction (average interface area of 553 Å2) and this interaction is maintained through all seven states (L1, L2, and C1–C5). Mfd-[D6(TD2)]:βprotrusion: In L1, the Mfd translocation module [D5(TD1)/D6(TD2)] interacts with upstream DNA (roughly −38 to −27) and does not interact with RNAP (Figure 4—figure supplement 1B). Upon the transition to L2, the translocation module walks on the DNA, moving toward the RNAP until it 'bumps' into the RNAP, characterized primarily by D6(TD2) interacting with the RNAP βprotrusion [the Mfd-D4(RID) and D6(TD2) interfaces with the RNAP βprotrusion do not overlap]. Once Mfd-D6(TD2) pushes up against the RNAP βprotrusion in L2, that interface is also maintained throughout the rest of the structures (L2, C1–C5, average interface area of 312 Å2). During the Mfd-nucleotide hydrolysis cycle, the movements of Mfd relative to the RNAP cause cyclical RNAP conformational changes involving RNAP clamp and βlobe-Si1 motions (Figure 7). The RNAP clamp is opened in C3 as Mfd wedges itself between the βprotrusion and the clamp, pushing on the clamp through a large interface with the translocation module (maximum Mfd-[D5(TD1)/D6(TD2)]:β'clamp interface area of 944 Å2 in C3). The RNAP βlobe-Si1 is pushed sideways by an interaction with Mfd-D1 (can be seen in Figure 7).
Figure 6
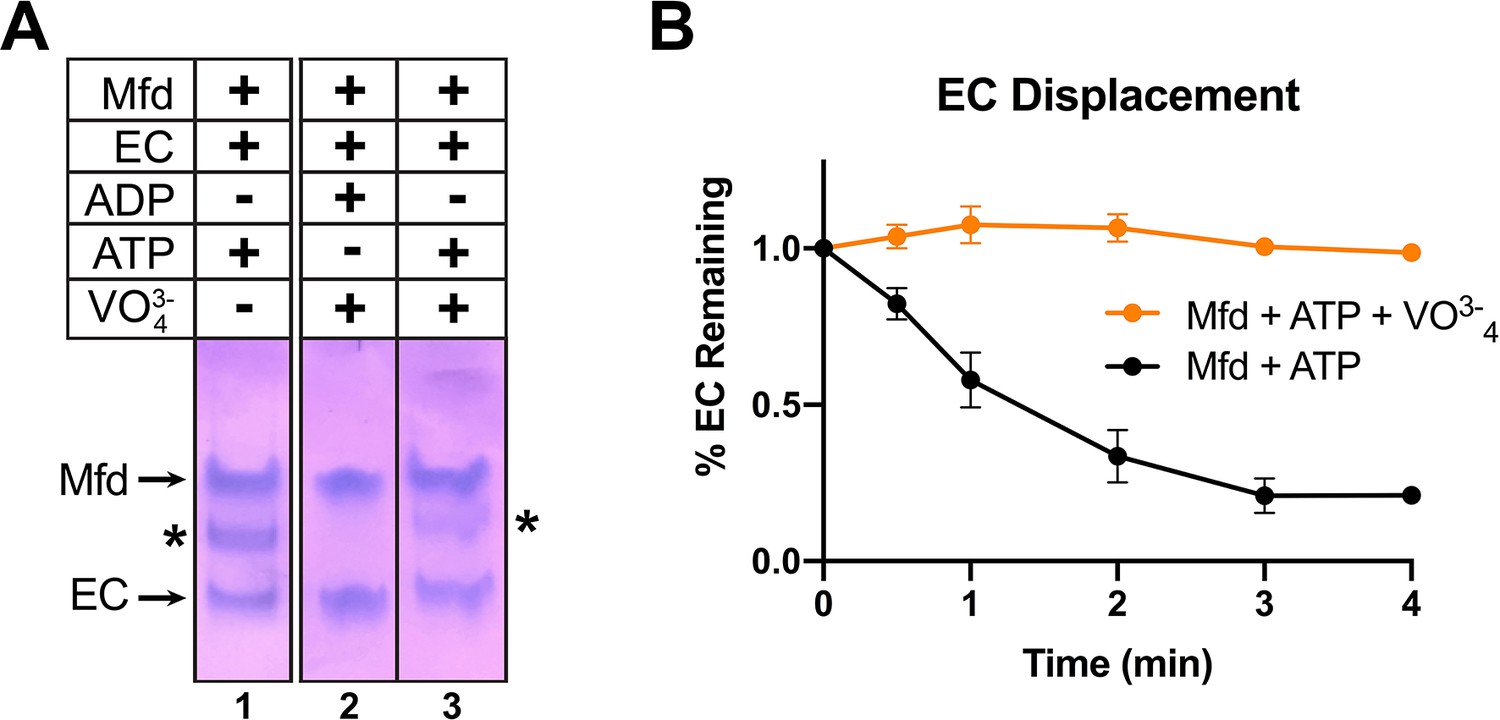
ATP hydrolysis is required for Mfd loading.
(A) Native gel electrophoretic mobility shift assay shows that a stable Mfd-elongation complex (EC) complex (denoted by '*') requires a minimum of one round of ATP hydrolysis (lane 3). (B) Displacement of stalled Eco ECs from end-labeled DNA fragments by Mfd was monitored by electrophoretic mobility shift analysis and quantified using a phosphorimager and Imagequant software (Chambers et al., 2003). Data shown are the average of three independent experiments and are expressed as a percentage of the amount of EC present prior to the addition of Mfd. Error bars indicate standard deviation of three independent measurements.
Figure 7 with 1 supplement
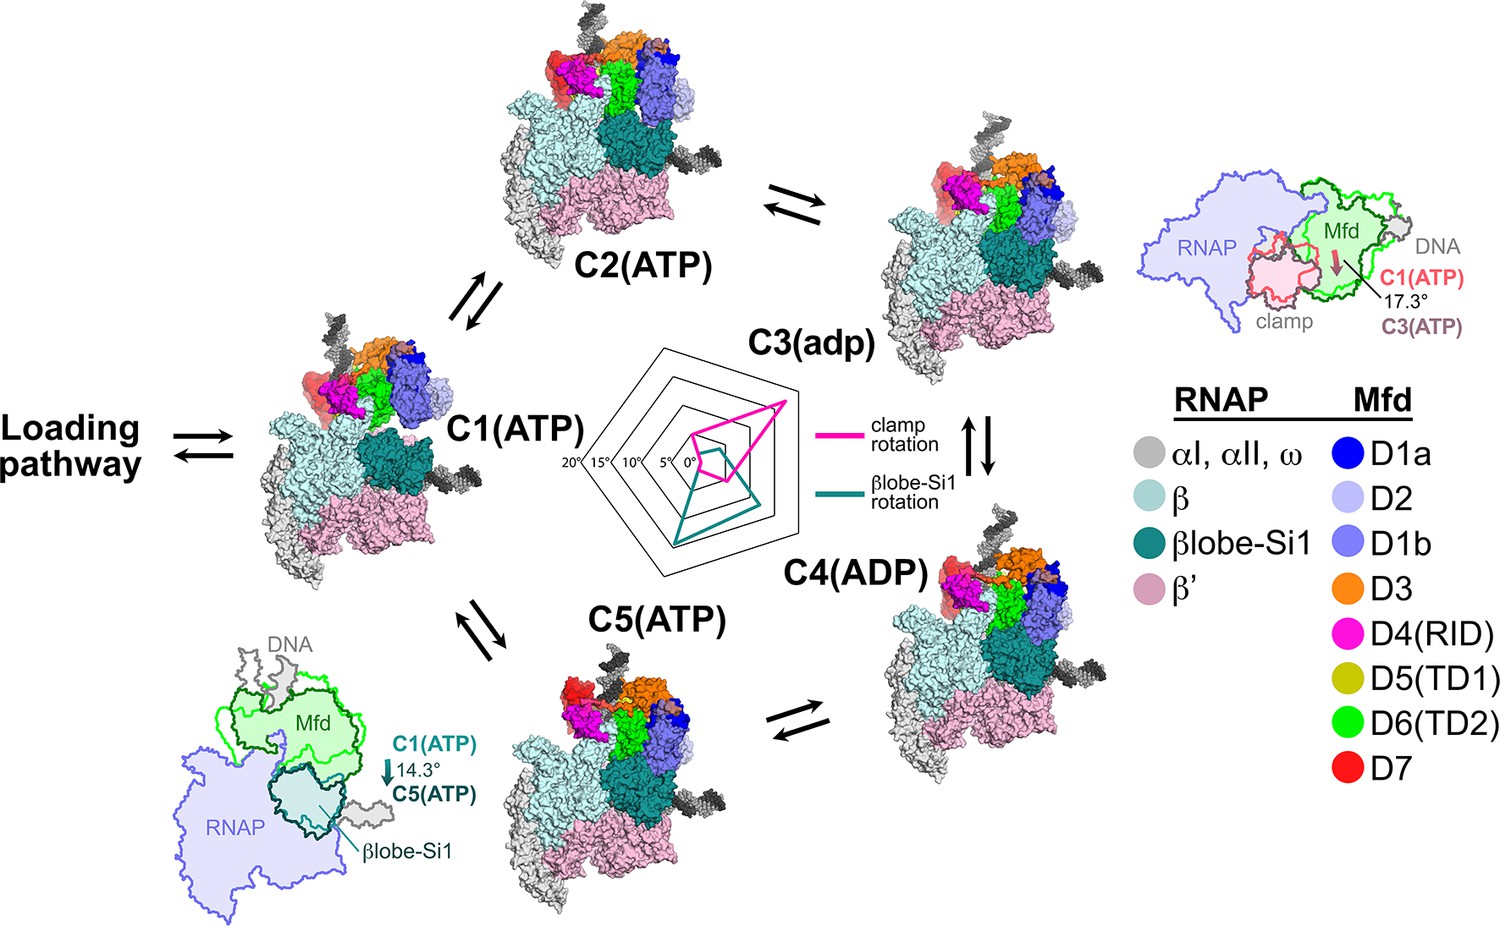
Mfd motions during its nucleotide hydrolysis cycle cause significant RNA polymerase (RNAP) conformational changes.
The completion of the Mfd loading pathway culminates in the formation of C1(ATP) (Supplementary file 5). Mfd then cycles through five distinct states in the order proposed here (also see Supplementary file 5, Figure 4—figure supplement 1A, and Figure 7—video 1). In looping through this cycle, internal conformational changes of Mfd are relatively small (involving primarily the nucleotide-dependent shifts of D5(TD1) and D6(TD2) with respect to each other; see Figure 3), but Mfd and the upstream duplex DNA as a whole wobble back and forth by about 30° on the upstream face of the RNAP. These motions cause significant RNAP conformational changes quantified in the radar plot in the middle. Using C1(ATP) as a reference structure, the RNAP clamp of C3(adp) is opened 17.3° (schematically illustrated in the cartoon inset). The βlobe-Si1 domain of C5(ATP) is rotated 14.3° as illustrated.
Figure 7—video 1
The Mfd nucleotide hydrolysis cycle.
The video starts with two orthogonal views of C1 (color coded as in Figure 7, with the RNA polymerase (RNAP) βlobe-Si1 colored in teal, and the RNAP clamp colored in purple, and each domain highlighted with a transparent molecular surface). The video cycles through the five structures of the Mfd-nucleotide hydrolysis cycle (C1 → C2 → C3 → C4 → C5). The current structure is highlighted in red (lower left). At C2 → C3 the motions of Mfd open the RNAP clamp, and at C4 → C5 the motions of Mfd twist the βlobe-Si1. After two cycles, two more cycles are shown but Mfd and the nucleic acids are removed to further highlight the motions of RNAP.
Figure 8
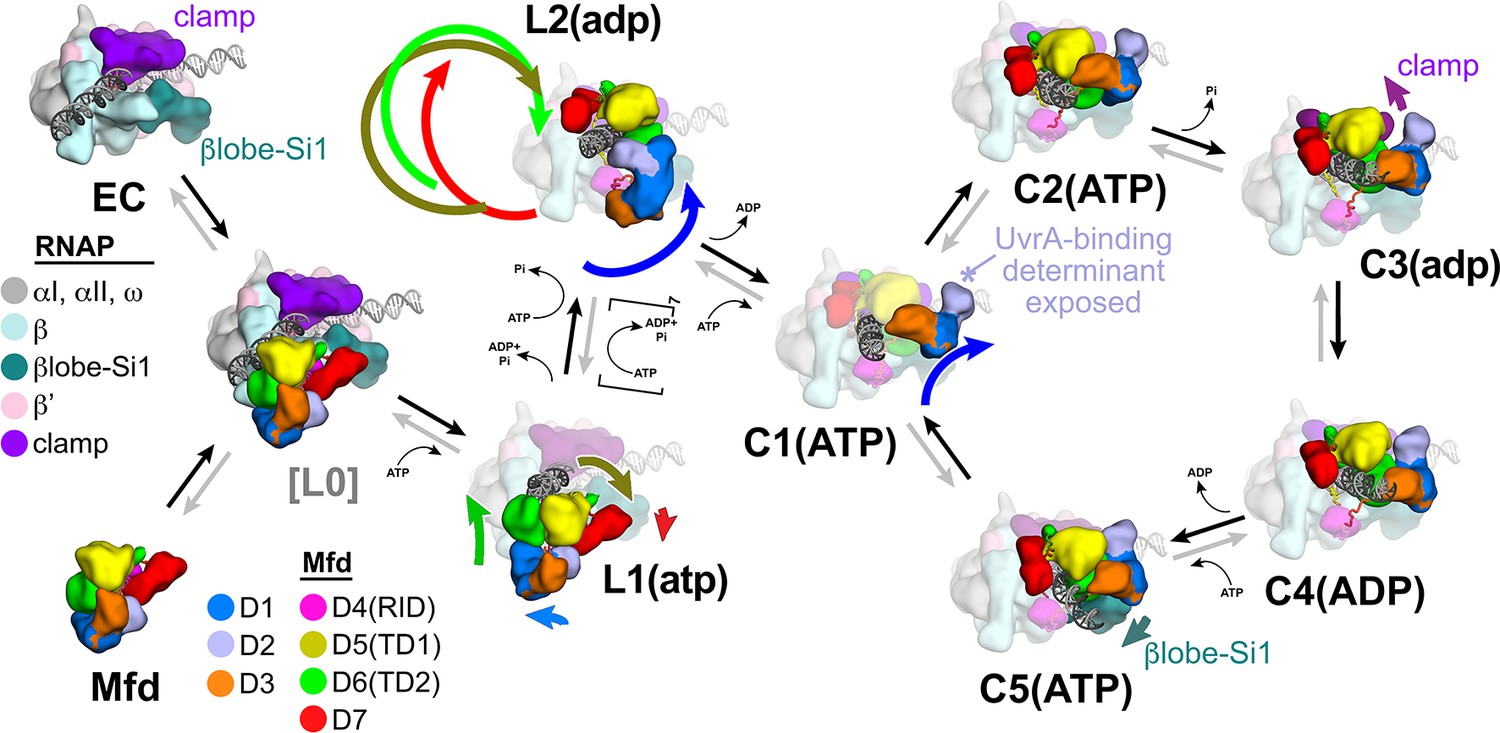
Structural pathway for RNA polymerase (RNAP) elongation complex (EC) displacement by Mfd.
Putative ordered pathway for Mfd-mediated displacement of the RNAP EC (see Figure 4—figure supplement 1A). Structures are shown as cartoons, with RNAP and Mfd-domain color coding shown in the keys on the left. For most of the structures, domains that undergo the most significant conformational changes at each step are highlighted, and the relative direction and magnitude of the conformational changes are indicated by the thick, colored arrows. Starting at the left, the RNAP EC (top left) and apo-Mfd (bottom left) combine to form the putative encounter complex [L0] (see Figure 4A,B). In the [L0] → L1(atp) transition (Figure 4B), Mfd domains D5(TD1) and D6(TD2) rearrange to bind a molecule of ATP and engage fully with the upstream duplex DNA. D1–D3 and D7 also make small rearrangements. In the L1(atp) → L2(adp) transition, the Mfd translocation module [D5(TD1)/D6(TD2)] walks nine base pairs in the downstream direction (into the page) by clockwise corkscrewing around the duplex DNA approximately 260°, hydrolyzing nine molecules of ATP in the process. The transition to C1(ATP) involves another accommodation of D1–D3 which finally exposes the UvrA-binding determinant of D2. We propose that the Mfd-EC complex then loops through an ATP hydrolysis cycle (C1 → C2 → C3 → C4 → C5 → C1 →…) that works to overwind the upstream duplex DNA, facilitating RNA transcript release and transcription bubble collapse to displace the RNAP from the nucleic acids. During this cycle, movements of Mfd on the upstream duplex DNA also force conformational changes in the RNAP; clamp opening in C3(adp), and βlobe-Si1 opening in C5(ATP). These RNAP conformational changes also serve to weaken the RNAP-nucleic acid contacts, facilitating RNAP release.
Videos
Video 1
Mfd translocation.
The video illustrates the Mfd translocation module inchworm translocation model. The Mfd translocation module [D5(TD1), yellow; D6(TD2), green] transitions between the closed ATP-bound state and the open ADP-bound state as it translocates on duplex DNA. In the first section of the video, the Mfd translocation module inchworms on stationary DNA. The second section of the video simulates the effect of blocking the forward (left-to-right) motion of the protein but with continued ATP hydrolysis – the protein continues to translocate with respect to the DNA, but since the protein cannot move, the DNA moves (from right-to-left) instead. A reference base pair in the DNA is colored magenta.
Tables
Key resources table
| Reagent type (species) or resource | Designation | Source or reference | Identifiers | Additional information |
|---|---|---|---|---|
| Strain, strain background (Escherichia coli) | Eco BL21(DE3) | Novagen | ||
| Strain, strain background (Escherichia coli) | Eco Rosetta(DE3)pLysS | Novagen | ||
| Recombinant DNA reagent | pACYCDuet-1_Ec_rpoZ | PMID:21416542 | ||
| Recombinant DNA reagent | pEcrpoABC(-XH)Z | PMID:21416542 | ||
| Recombinant DNA reagent | pAD6 | PMID:16469698 | ||
| Recombinant DNA reagent | pAR1707 | PMID:3309350 | ||
| Sequence-based reagent | Mfd_scaffold1b_top | This paper | Synthetic DNA oligonucleotide | CCCAACGGCACCGCTGCAAGGAATAGGATACTTGCGGGCTAGGCTCTTATGGCGGCGAATACCC |
| Sequence-based reagent | Mfd_scaffold1b_bot | This paper | Synthetic DNA oligonucleotide | GGGTATTCGCCGCGTACCTCTCCTAGCCCGCAAGTATCCTATTCCTTGCAGCGGTGCCGTTGGG |
| Sequence-based reagent | Mfd_RNA_20A11 | This paper | Synthetic RNA oligonucleotide | GCAUUCAAAGCGGAGAGGUA |
| Chemical compound, drug | 3-[(3-Cholamidopropyl)dimethylammonio]−2-Hydroxy-1-Propanesulfonate (CHAPSO) | Anatrace | Cat# C317 | |
| Chemical compound, drug | 3'-deoxyuridine-5'-triphosphate | Trilink Biotechnologies | Cat# N3005 | |
| Software, algorithm | Bayesian Polishing | PMID:30412051 | ||
| Software, algorithm | Bsoft | PMID:23954653 | ||
| Software, algorithm | Coot | PMID:15572765 | ||
| Software, algorithm | cryoSPARC | PMID:28165473 | ||
| Software, algorithm | Gautomatch | http://www.mrc-lmb.cam.ac.uk/kzhang/Gautomatch | ||
| Software, algorithm | Gctf | PMID:26592709 | ||
| Software, algorithm | Molprobity | PMID:20057044 | ||
| Software, algorithm | MotionCor2 | PMID:28250466 | ||
| Software, algorithm | PHENIX | PMID:20124702 | ||
| Software, algorithm | RELION | PMID:23000701 | ||
| Software, algorithm | PyMOL | http://pymol.org/2/ | ||
| Software, algorithm | SerialEM | PMID:16182563 | ||
| Software, algorithm | UCSF Chimera | PMID:15264254 | ||
| Other | C-flat CF-1.2/1.3 400 mesh gold grids | Electron Microscopy Sciences | Cat# CF413-100-Au |
Additional files
-
Supplementary file 1
Cryo-EM data collection, refinement, and validation statistics.
- https://cdn.elifesciences.org/articles/62117/elife-62117-supp1-v2.docx
-
Supplementary file 2
Bound nucleotide test.
- https://cdn.elifesciences.org/articles/62117/elife-62117-supp2-v2.docx
-
Supplementary file 3
Conformational changes for the RNAP component of the Mfd-EC structures.
- https://cdn.elifesciences.org/articles/62117/elife-62117-supp3-v2.docx
-
Supplementary file 4
Conformational changes for the Mfd component of the Mfd-EC structures.
- https://cdn.elifesciences.org/articles/62117/elife-62117-supp4-v2.docx
-
Supplementary file 5
Conformational changes for the entire Mfd-EC complexes.
- https://cdn.elifesciences.org/articles/62117/elife-62117-supp5-v2.docx
-
Supplementary file 6
Conformational transitions (translation of center-of-gravity and rotation) for Mfd domains.
- https://cdn.elifesciences.org/articles/62117/elife-62117-supp6-v2.docx
-
Transparent reporting form
- https://cdn.elifesciences.org/articles/62117/elife-62117-transrepform-v2.pdf
Download links
A two-part list of links to download the article, or parts of the article, in various formats.
Downloads (link to download the article as PDF)
Open citations (links to open the citations from this article in various online reference manager services)
Cite this article (links to download the citations from this article in formats compatible with various reference manager tools)
Structural basis for transcription complex disruption by the Mfd translocase
eLife 10:e62117.
https://doi.org/10.7554/eLife.62117


