Mapping the endemicity and seasonality of clinical malaria for intervention targeting in Haiti using routine case data
- Curtin University, Australia
- Telethon Kids Institute, Perth Children’s Hospital, Australia
- Clinton Health Access Initiative, United States
- Tulane University School of Public Health and Tropical Medicine, United States
- Big Data Institute, Li Ka Shing Centre for Health Information and Discovery, University of Oxford, United Kingdom
- Swiss Tropical and Public Health Institute, Switzerland
- Division of Global Health Protection, Centers for Disease Control and Prevention, United States
- Programme National de Contrôle de la Malaria/MSPP, Haiti
- Division of Parasitic Diseases and Malaria, Centers for Disease Control and Prevention, United States
- Direction d’Epidémiologie de Laboratoire et de la Recherche, Haiti
- Institute for Disease Modelling, United States
Figures
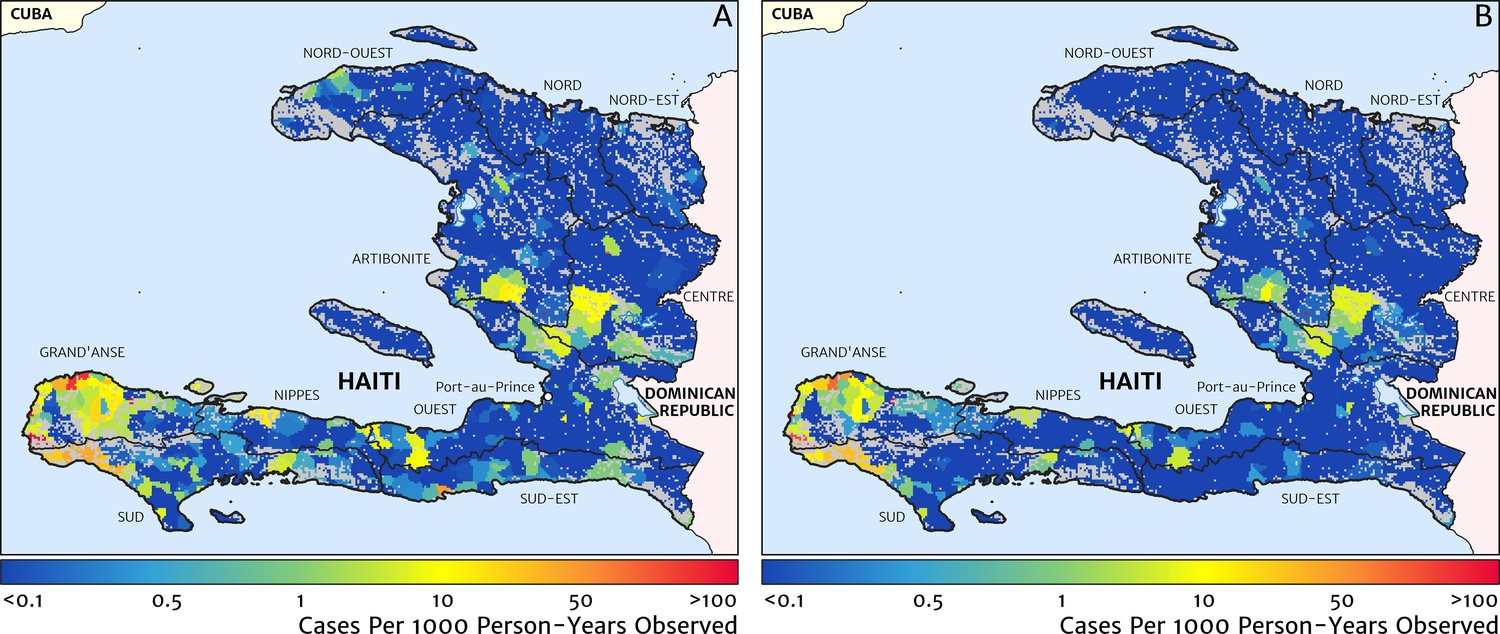
Figure 1
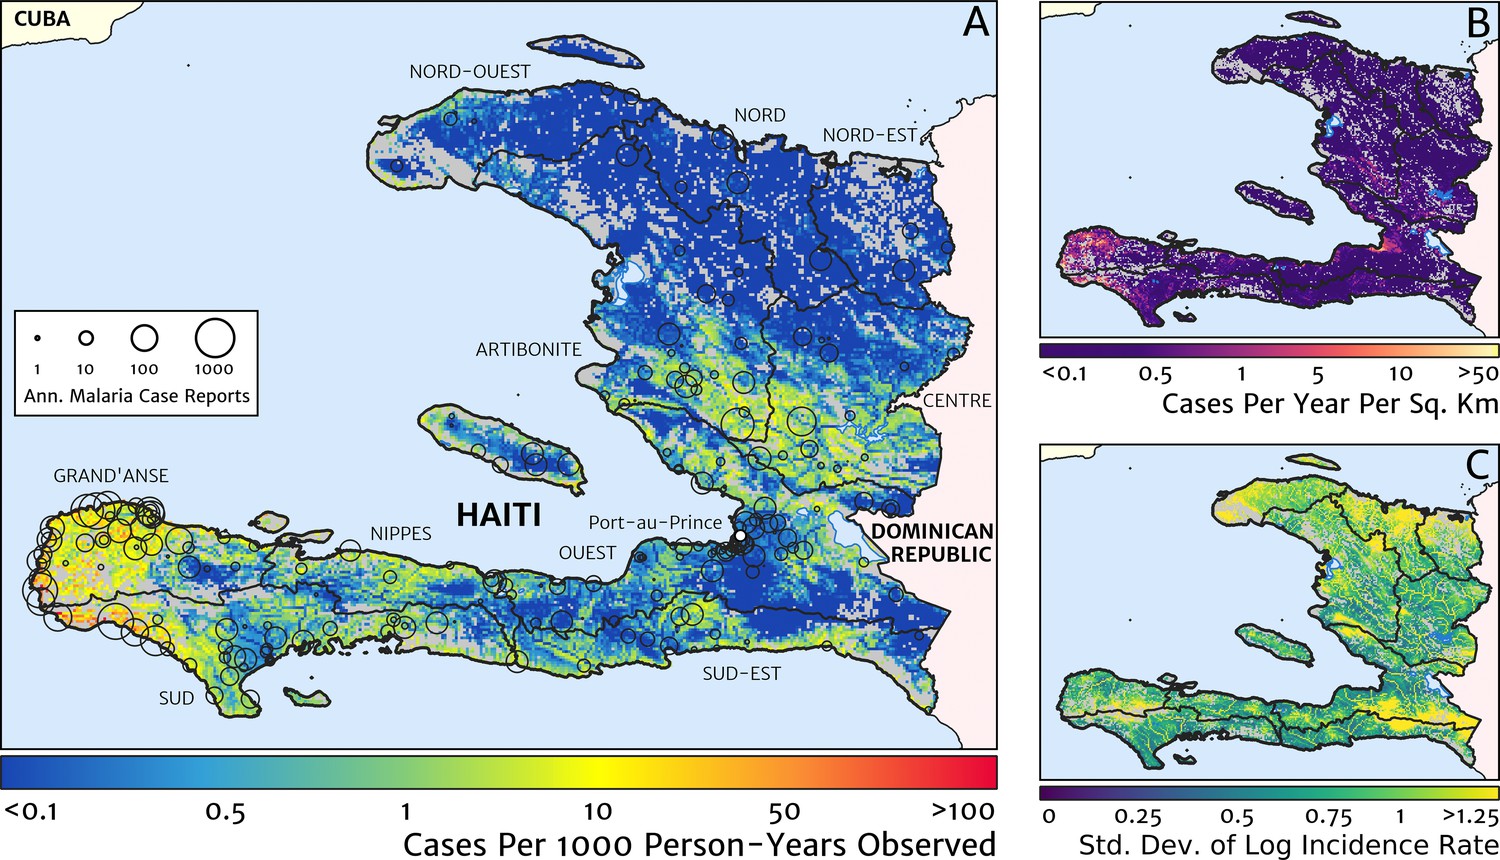
The contemporary spatial pattern of malaria endemicity in Haiti (2019) based on reported health facility case counts from 2014 to 2019.
(A) The (pointwise) posterior (geometric) mean of the clinical incidence rate of malaria in Haiti at 1 × 1 km resolution based on our model fit to ‘representative’ annual case totals constructed from the health facility dataset. The grey-shaded regions have zero mapped population density, so we do not predict malaria risk in those areas. The boundaries and names (in light capital letters) of the 10 administrative departments of Haiti are marked for reference, as is the location of the capital city, Port-au-Prince. (B) The (pointwise) posterior (geometric) mean of the clinical incidence count (total annual cases): this is the product of the risk surface in (A) with the population surface. (C) A visualisation of the model-based uncertainty in these fine-scale predictions, shown here in terms of the (pointwise) standard deviation in the logarithm of the predicted case incidence rate.
Figure 2
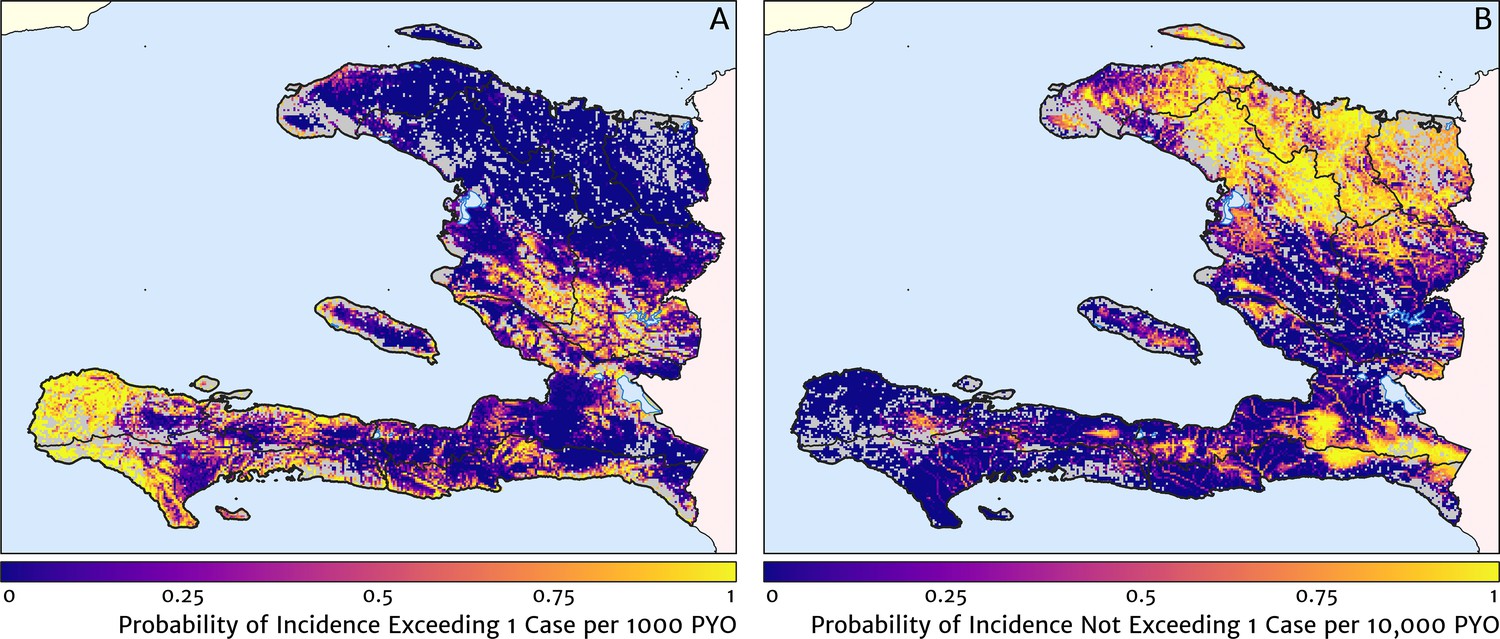
Exceedance and non-exceedance maps for clinical malaria incidence in Haiti (2019) at policy-relevant thresholds.
(A) The posterior probability that the clinical incidence rate exceeds 1 case per 1000 PYO in each pixel under our geostatistical model. (B) The posterior probability that the clinical incidence rate does not exceed 1 case per 10,000 PYO in each pixel under our geostatistical model.
Figure 3
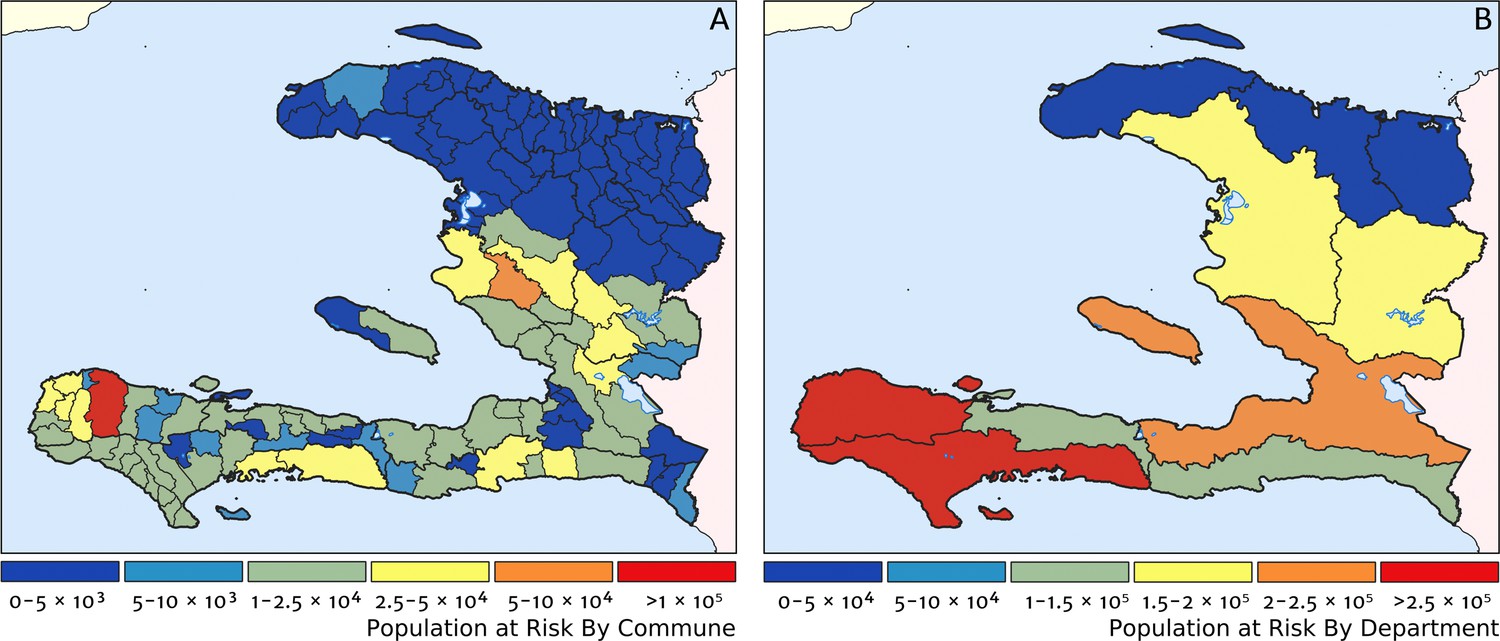
Predicted population-at-risk of clinical malaria for Haiti (2019) by commune and department.
(A) The posterior median estimate of the number of individuals in each commune (the third largest sub-national administrative level in Haiti) living in areas subjected to a clinical incidence rate above 1 case per 1000 PYO. (B) The same but aggregated at the level of departments (the largest sub-national administrative level in Haiti).
Figure 4

The dominant covariates in fine-scale prediction of the case incidence rate for Haiti (2019).
The colour of each pixel corresponds to the covariate with (A) greatest positive impact (in terms of increasing the local estimate of malaria risk) and (B) greatest negative impact (in terms of decreasing the local estimate of malaria risk), upon the predicted incidence rate in accordance with the legend. Of the 12 total spatial covariates offered to the model, only the eight shown here appear among the most dominant in at least one pixel.
Figure 5
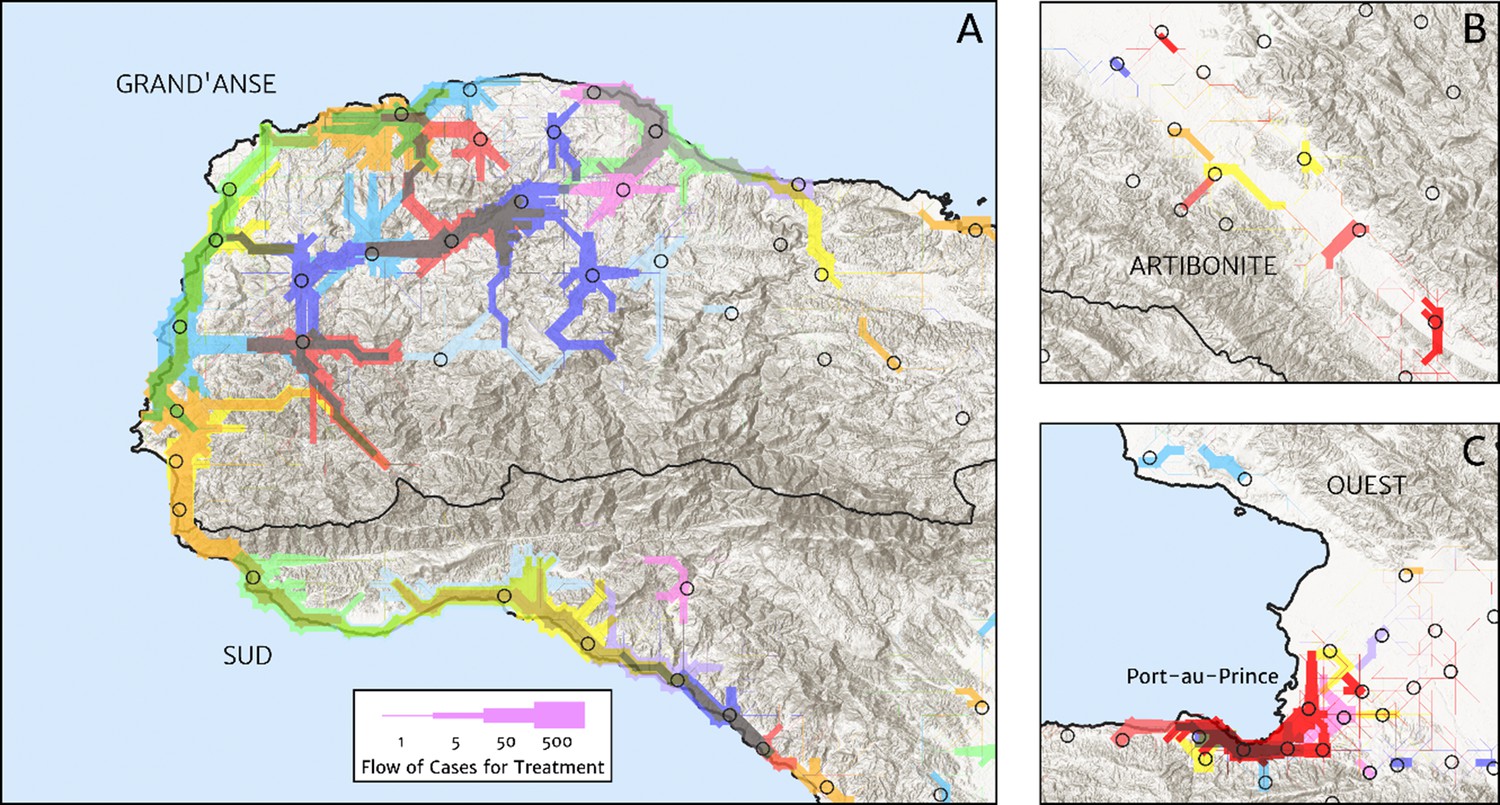
Flow paths from predicted malaria case household locations to health facilities based on our catchment model for treatment seeking in Haiti (2019).
Each health facility is assigned a random colour and the flow of patients from households to health facilities predicted under our posterior mean catchment model and case incidence surface are illustrated by the colour-matched (semi-transparent) lines of logarithmically proportional thickness, for regions of interest: (A) in Grand’Anse (tip of the Tiburon peninsula); (B) along the Artibonite River in the central valley; and (C) in Port-au-Prince and its surrounding settlements. Note that the flows shown here are modelled at a discretise 1 × 1 km resolution, far coarser than that of the hill-shading relief and coastline shapefiles used in plotting; no journeys by sea are allowed in our least cost path model.
Figure 6
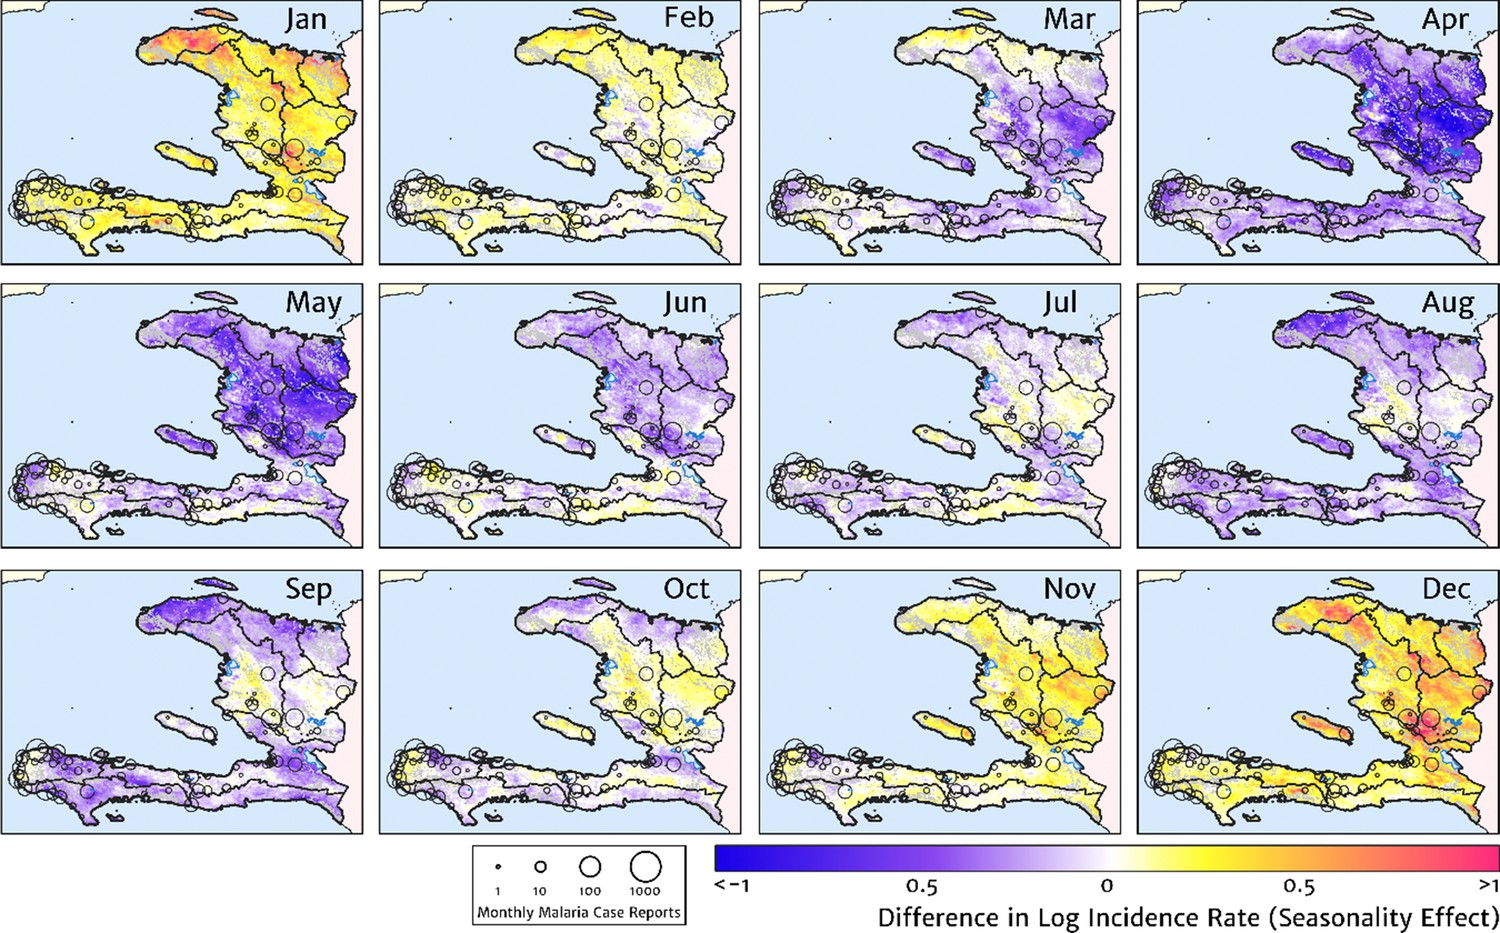
The typical fine-scale spatial pattern of month-specific variations in the incidence of clinical malaria in Haiti based on reported health facility case counts from 2014 to 2019.
The (pointwise) posterior mean of the seasonal effect on the logarithm of the predicted case incidence rate is illustrated for each calendar month based on the third stage of our inference procedure: the spatio-temporal geostatistical model with fixed catchment sub-model fitted to the representative monthly case counts constructed at health facility level.
Figure 7
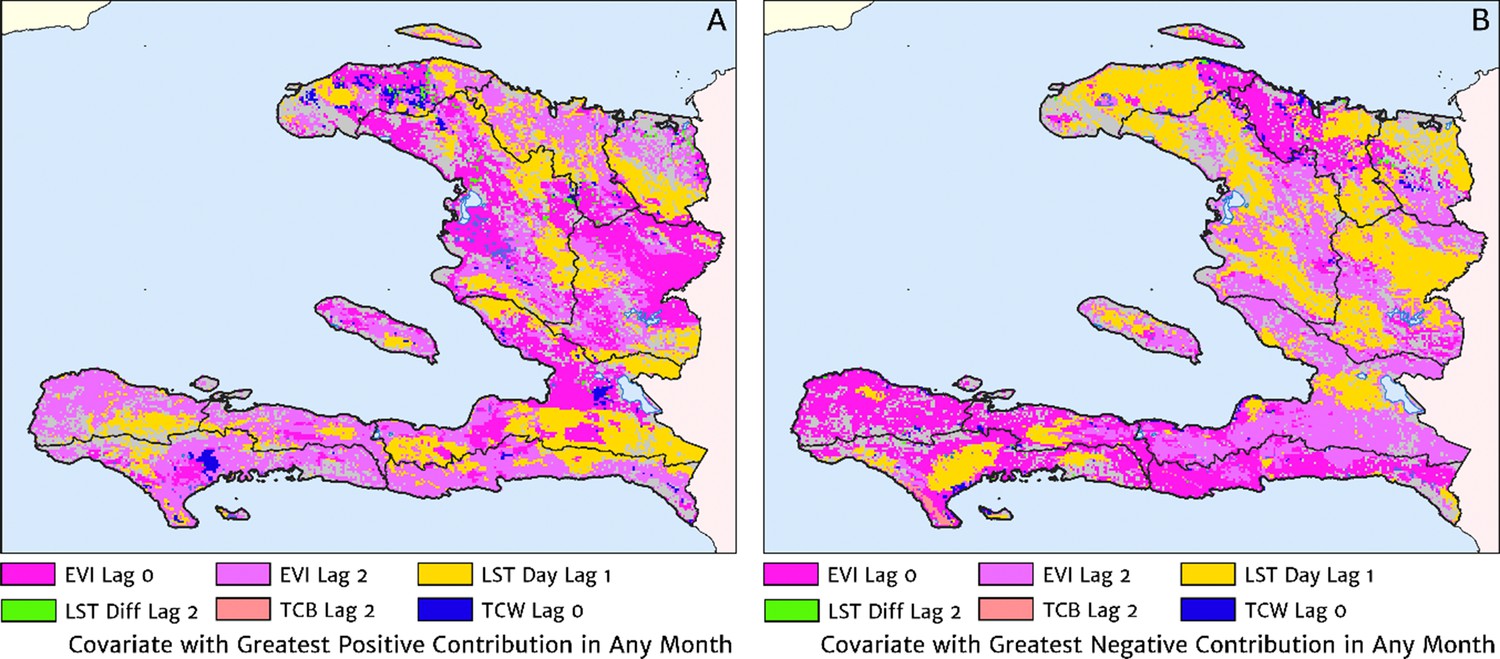
The dominant covariates in fine-scale prediction of month-specific variations in the incidence of clinical malaria in Haiti (2014–2019).
In each pixel, the colour key indicates the covariate having the greatest (A) positive or (B) negative influence on the monthly incidence offset in any month. The lags denoted here are in units of months prior.
Figure 8
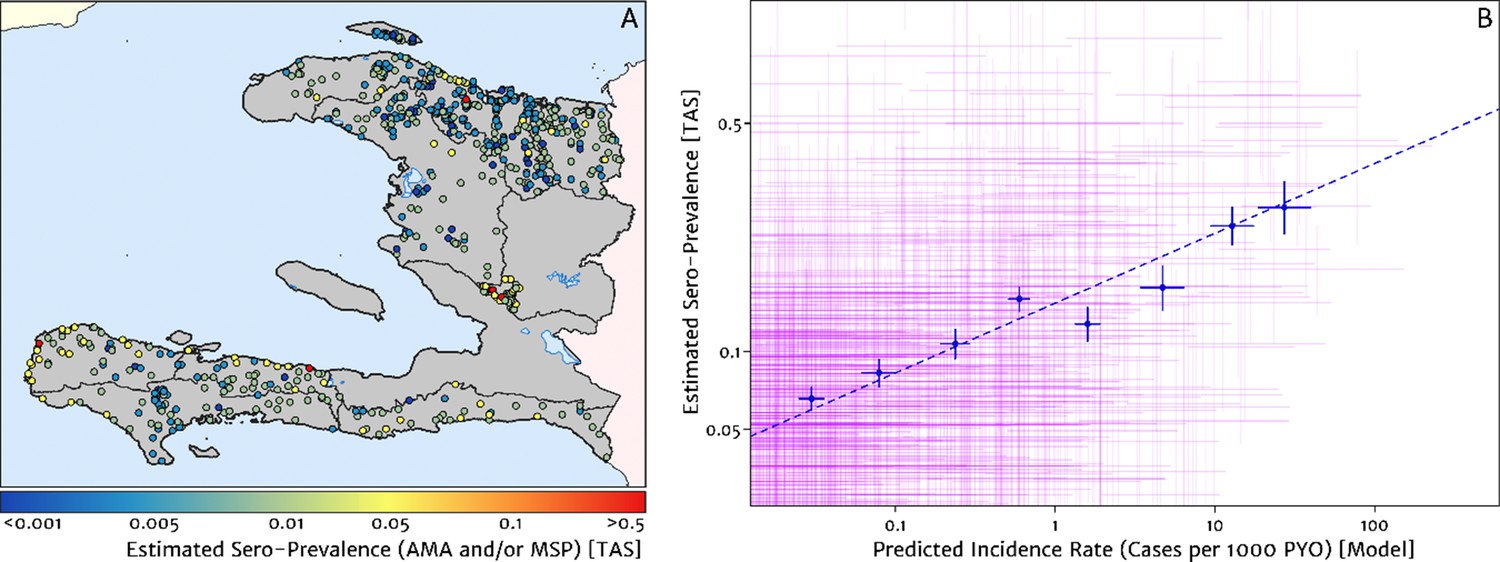
Model validation against the estimated proportion of school children testing positive to serological markers of past malaria exposure in the TAS dataset (2014–2016).
(A) The spatial location of each school sampled in the TAS study is illustrated here with the colour of the plotting symbol (filled circle), indicating the estimated sero-prevalence at that site. In this case, sero-positivity is defined as being classified positive for either the MSP antigenic response, the AMA antigenic response, or both. (B) Comparison of the estimated sero-prevalence (using a simple Bayesian beta-binomial model) from the TAS schools data against the predicted case incidence rate from our full geospatial model fit to the representative health facility-level data. The 95% credible interval in each metric for each school location is illustrated by the purple lines. The median estimated sero-prevalence for sites grouped in a series of bins by predicted case incidence is overlaid in blue, along with the associated line of best fit.
Figure 9
Risk stratification maps for 2019 produced under a naïve catchment model in which patients attend only their nearest facility.
(A) The raw case data is used with a crude imputation by way of per-facility empirical means excluding missing months; (B) the case data has now been imputed, de-trended, and microscopy-to-RDT converted.
Additional files
-
Source code 1
R script for Stepwise Modelling of Case Count Dataset.
- https://cdn.elifesciences.org/articles/62122/elife-62122-code1-v1.zip
-
Source code 2
TMB code for the Impact of Diagnostic Type.
- https://cdn.elifesciences.org/articles/62122/elife-62122-code2-v1.zip
-
Source code 3
TMB code for Detrending Model.
- https://cdn.elifesciences.org/articles/62122/elife-62122-code3-v1.zip
-
Source code 4
TMB Code for Seasonality Model.
- https://cdn.elifesciences.org/articles/62122/elife-62122-code4-v1.zip
-
Source code 5
TMB Code for Static Risk Surface Model.
- https://cdn.elifesciences.org/articles/62122/elife-62122-code5-v1.zip
-
Transparent reporting form
- https://cdn.elifesciences.org/articles/62122/elife-62122-transrepform-v1.docx
Download links
A two-part list of links to download the article, or parts of the article, in various formats.
Downloads (link to download the article as PDF)
Open citations (links to open the citations from this article in various online reference manager services)
Cite this article (links to download the citations from this article in formats compatible with various reference manager tools)
Mapping the endemicity and seasonality of clinical malaria for intervention targeting in Haiti using routine case data
eLife 10:e62122.
https://doi.org/10.7554/eLife.62122


