Role of matrix metalloproteinase-9 in neurodevelopmental deficits and experience-dependent plasticity in Xenopus laevis
- Department of Neuroscience, Brown University, United States
- The Scripps Research Institute, United States
Figures
Figure 1
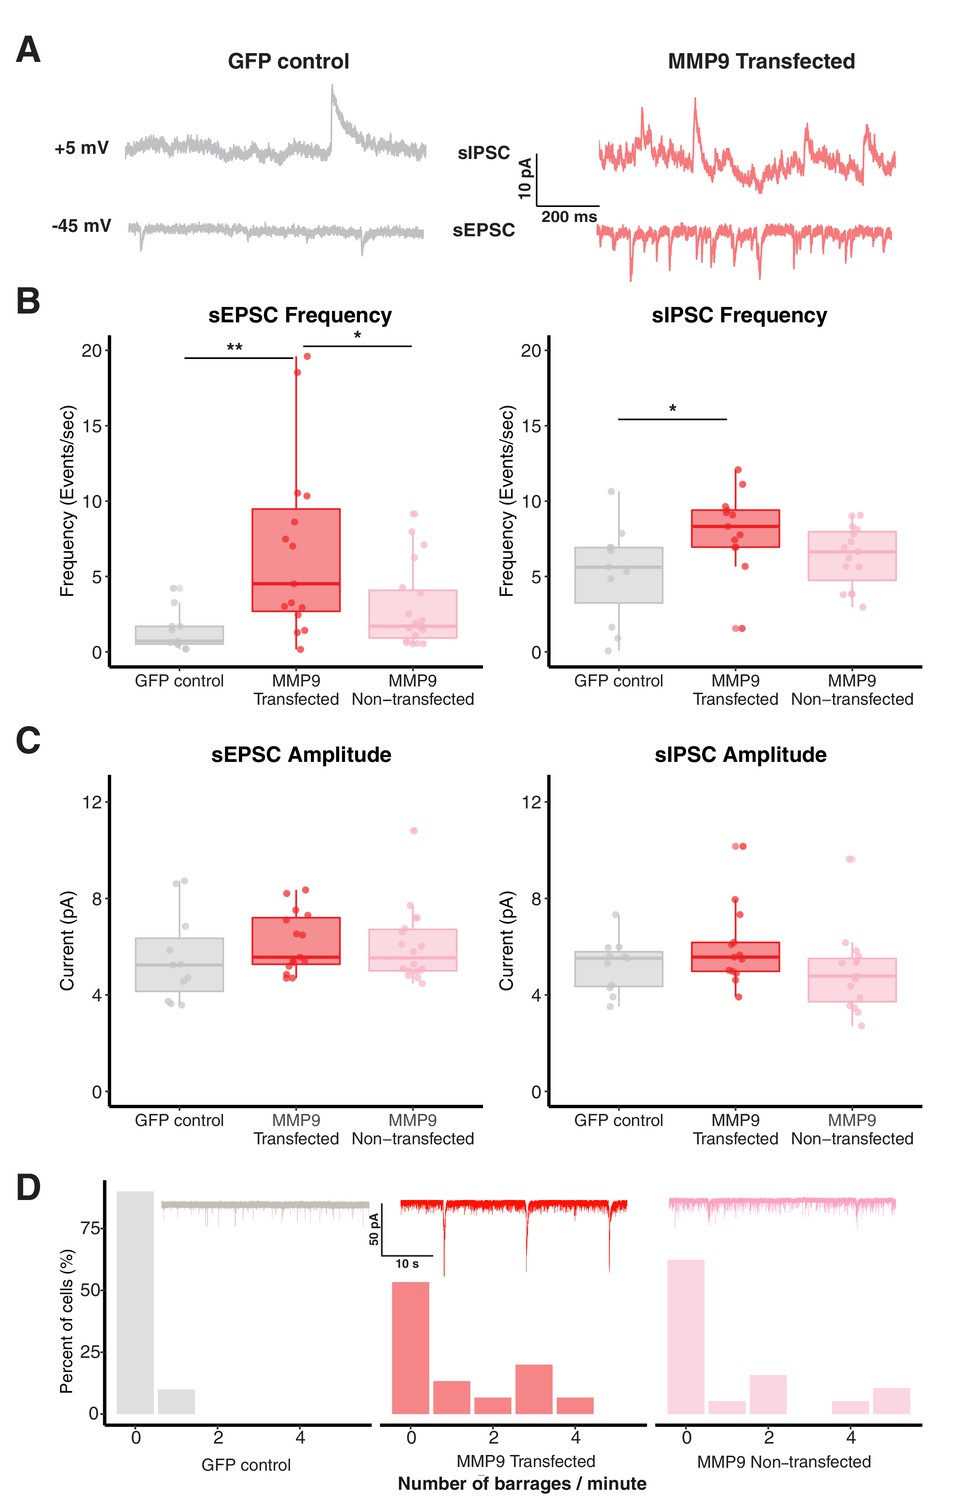
MMP-9 overexpression increases spontaneous synaptic activity and network connectivity.
(A) Representative sEPSCs and sIPSCs recorded at −45 mV and +5 mV, respectively, from control and MMP-9 transfected cells. (B) Boxplots showing frequency of sEPSCs and sIPSCs for GFP control, MMP-9 transfected and MMP-9 non-transfected groups. The sEPSC and sIPSC frequencies are significantly enhanced in the MMP-9 transfected cells in comparison to the GFP control. Each dot represents data from one cell, the box represents median and interquartile range (IQR) and whiskers represent the range of data. (C) Box plot showing sEPSC and sIPSC amplitudes for each group. The sEPSC and sIPSC amplitudes do not vary significantly between control, MMP-9 transfected and MMP-9 non-transfected groups. Data are represented as median ± IQR. (D) Histogram showing relative barrage frequency for each group. The inset shows representative traces of barrages from each experimental group. MMP-9 transfected and non-transfected groups showed a higher number of barrages (recorded at −45 mV) than the GFP control group. * p < 0.05, ** p < 0.005.
-
Figure 1—source data 1
MMP9 overexpression data.
- https://cdn.elifesciences.org/articles/62147/elife-62147-fig1-data1-v3.xlsx
Figure 2 with 1 supplement

Pharmacological inhibition of MMP-9 rescues VPA-induced effects on synaptic transmission.
(A) Representative sEPSCs (left) and evoked response (right) form control, VPA and VPA + SB-3CT-treated animals. (B) Boxplots showing frequency of sEPSCs for control, VPA, VPA + SB-3CT, and SB-3CT alone groups. Frequency of sEPSCs are significantly enhanced in the VPA group, an effect rescued by addition of SB-3CT. SB-3CT alone does not have any significant effect on sEPSC frequency. Data are represented as median ± IQR. (C) Boxplots showing sEPSCs amplitude for each group. sEPSC amplitude does not change significantly between control and treatment animals. Data are represented as median ± IQR. (D) Boxplot showing total charge from evoked synaptic response over a 100 ms window for each group. Total charge from evoked synaptic response is significantly higher in VPA treated animals and this effect is rescued in the presence of SB-3CT. Data are represented as median ± IQR. (E) Histogram showing relative barrage frequency for each group. Higher number of barrages are observed for VPA treated animals than in any other group. * p < 0.05, ** p < 0.005.
-
Figure 2—source data 1
SB3CT source data.
- https://cdn.elifesciences.org/articles/62147/elife-62147-fig2-data1-v3.xlsx
Figure 2—figure supplement 1
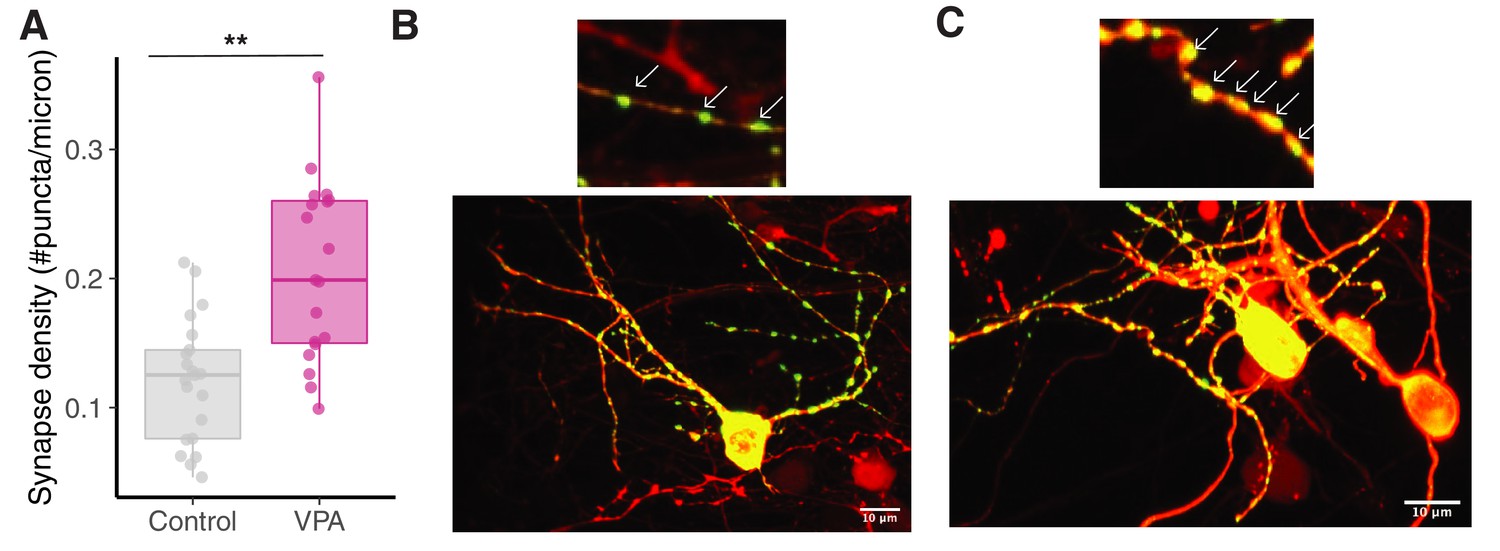
Exposure to VPA results in increased synapse density.
(A) Box plot showing synapse density for control and VPA groups. VPA exposed tadpoles showed increased synapse density compared to control group. (B) Representative image from control animal expressing punctate PSD95-GFP (green) and pcDNA-mCherry (red). Upper image shows a magnified dendritic branch. (C) Representative image from VPA-exposed animal expressing punctate PSD95-GFP (green) and pcDNA-mCherry (red). Upper image shows a magnified dendritic branch with increased synapse density., ** p < 0.005.
-
Figure 2—figure supplement 1—source data 1
PSD95 overexression source data.
- https://cdn.elifesciences.org/articles/62147/elife-62147-fig2-figsupp1-data1-v3.xlsx
Figure 3
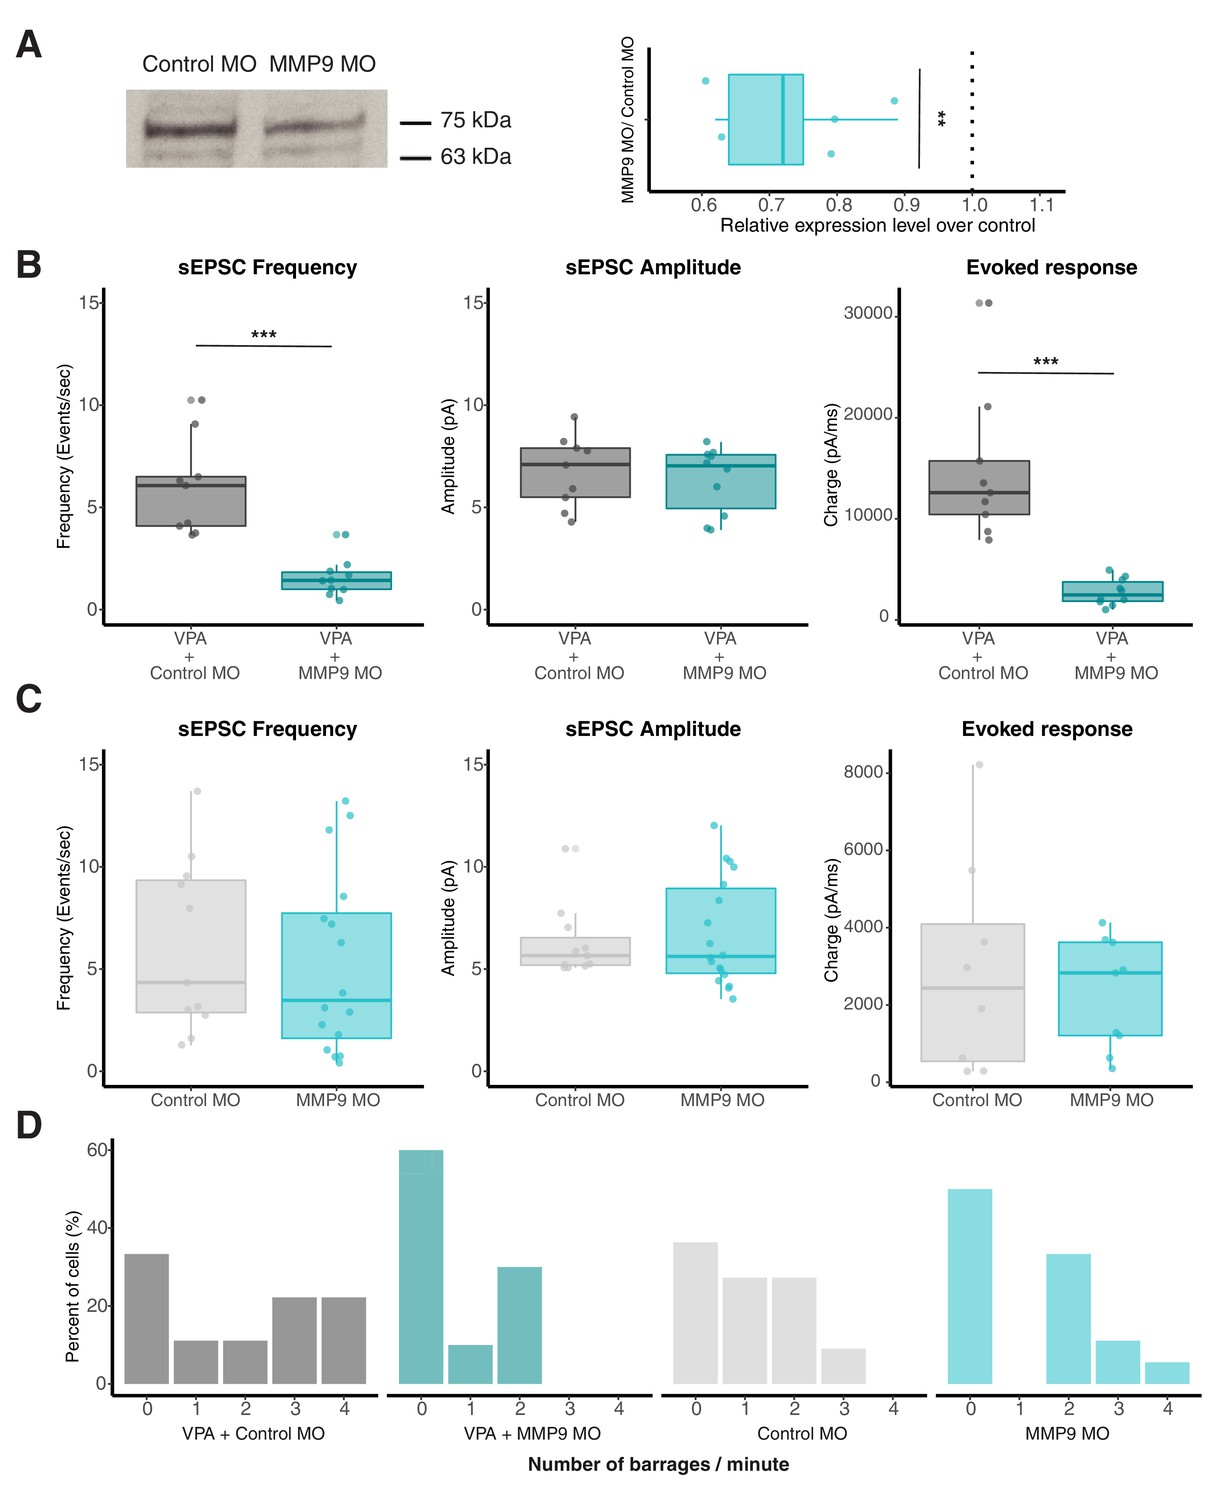
Morpholino targeted against MMP-9 rescues VPA-induced effects.
(A) Western blot image (left) indicating MMP-9 levels (75kD band) in control (scrambled) MO and MMP-9 MO transfected groups. Boxplot (right) shows relative MMP-9 levels for control MO and MMP MO transfected tadpoles. MMP-9 MO group consistently shows relatively reduced MMP-9 levels compared to controls. The dotted line represents a ratio of 1 (no difference). The 63 kDa band is a non-specific band labeled by MMP-9 antibody that shows no change. (B) Boxplots showing sEPSC frequency, amplitude and evoked synaptic response from VPA + Control MO and VPA + MMP-9 MO groups. Frequency of sEPSCs and not amplitude are significantly enhanced in VPA + Control MO group. Total charge from evoked synaptic response is significantly higher in the VPA + Control MO compared to VPA + MMP-9 MO-treated animals. Data are represented as median ± IQR. (C) Boxplots showing sEPSC frequency, amplitude and evoked synaptic response from Control MO and MMP-9 MO alone. Control MO and MMP-9 MO alone does not differ significantly in sEPSC frequency or amplitude. MMP-9 MO alone does not show any significant effect on evoked response. Data are represented as median ± IQR. (D) Histogram showing relative barrage frequency for each group. Higher number of barrages are observed for VPA + control MO, and this effect is rescued by addition of MMP-9 MO. ** p < 0.005, *** p < 0.0001.
-
Figure 3—source data 1
Morpholino source data.
- https://cdn.elifesciences.org/articles/62147/elife-62147-fig3-data1-v3.xlsx
Figure 4
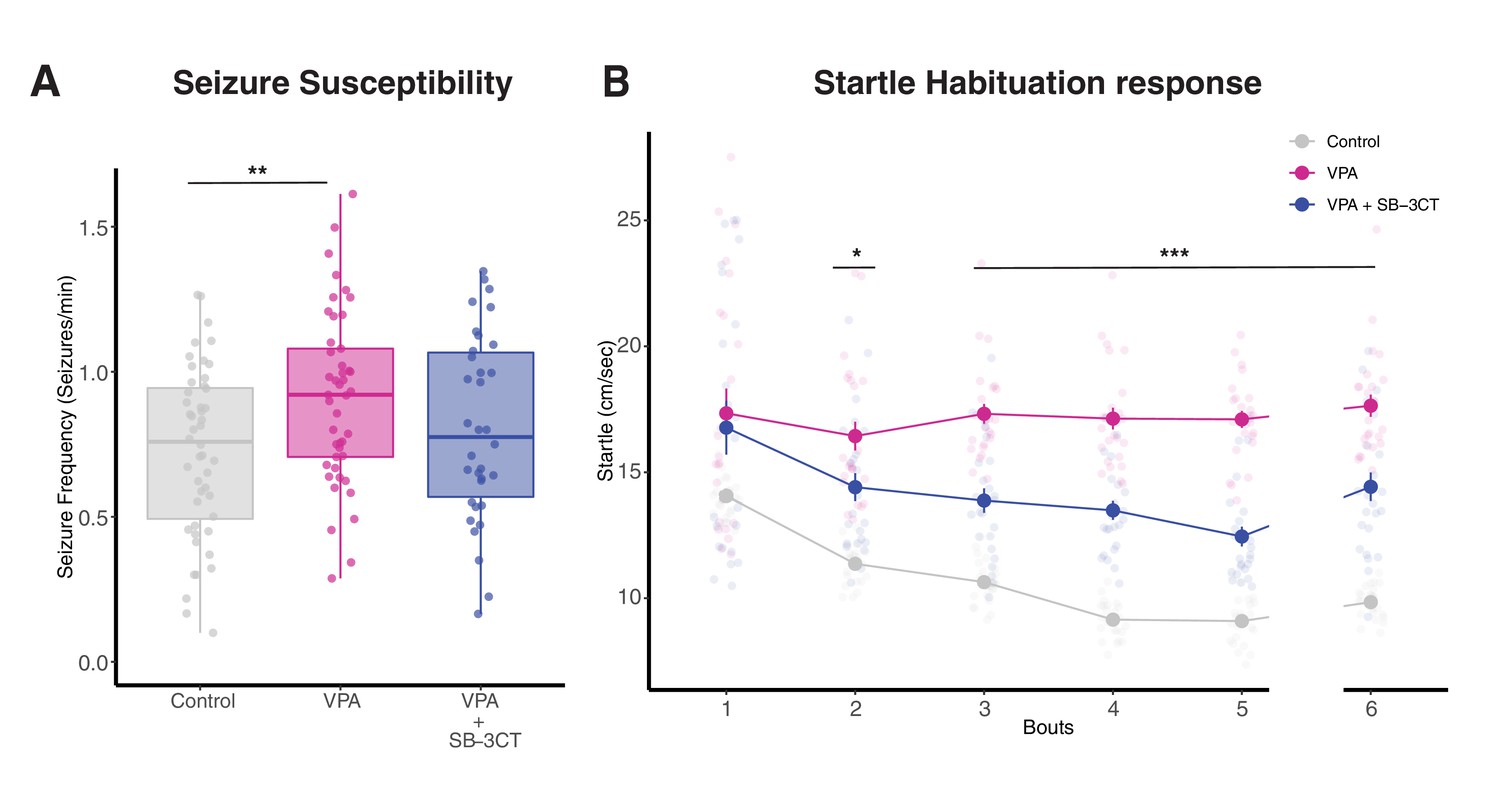
Inhibition of MMP-9 reverses VPA-induced behavioral effects.
(A) Boxplots showing seizure frequencies for Control, VPA and VPA + SB-3CT groups. Seizure frequency is increased in the VPA group, but this effect is rescued by addition of SB-3CT. Data are represented as median ± IQR. (B) Line plot for startle response habituation for Control, VPA, and VPA + SB-3CT. VPA-treated animals show less habituation to startle response compared to control animals. Addition of SB-3CT to VPA reverses this effect. Bouts 1 to 5 are separated by 5 min time intervals, whereas bout six is separated from bout 5 by a 15-min time interval. Each dot represents average with standard error bars. * p < 0.05, ** p < 0.005, *** p<0.001.
-
Figure 4—source data 1
Behavior data.
- https://cdn.elifesciences.org/articles/62147/elife-62147-fig4-data1-v3.xlsx
Figure 5 with 1 supplement
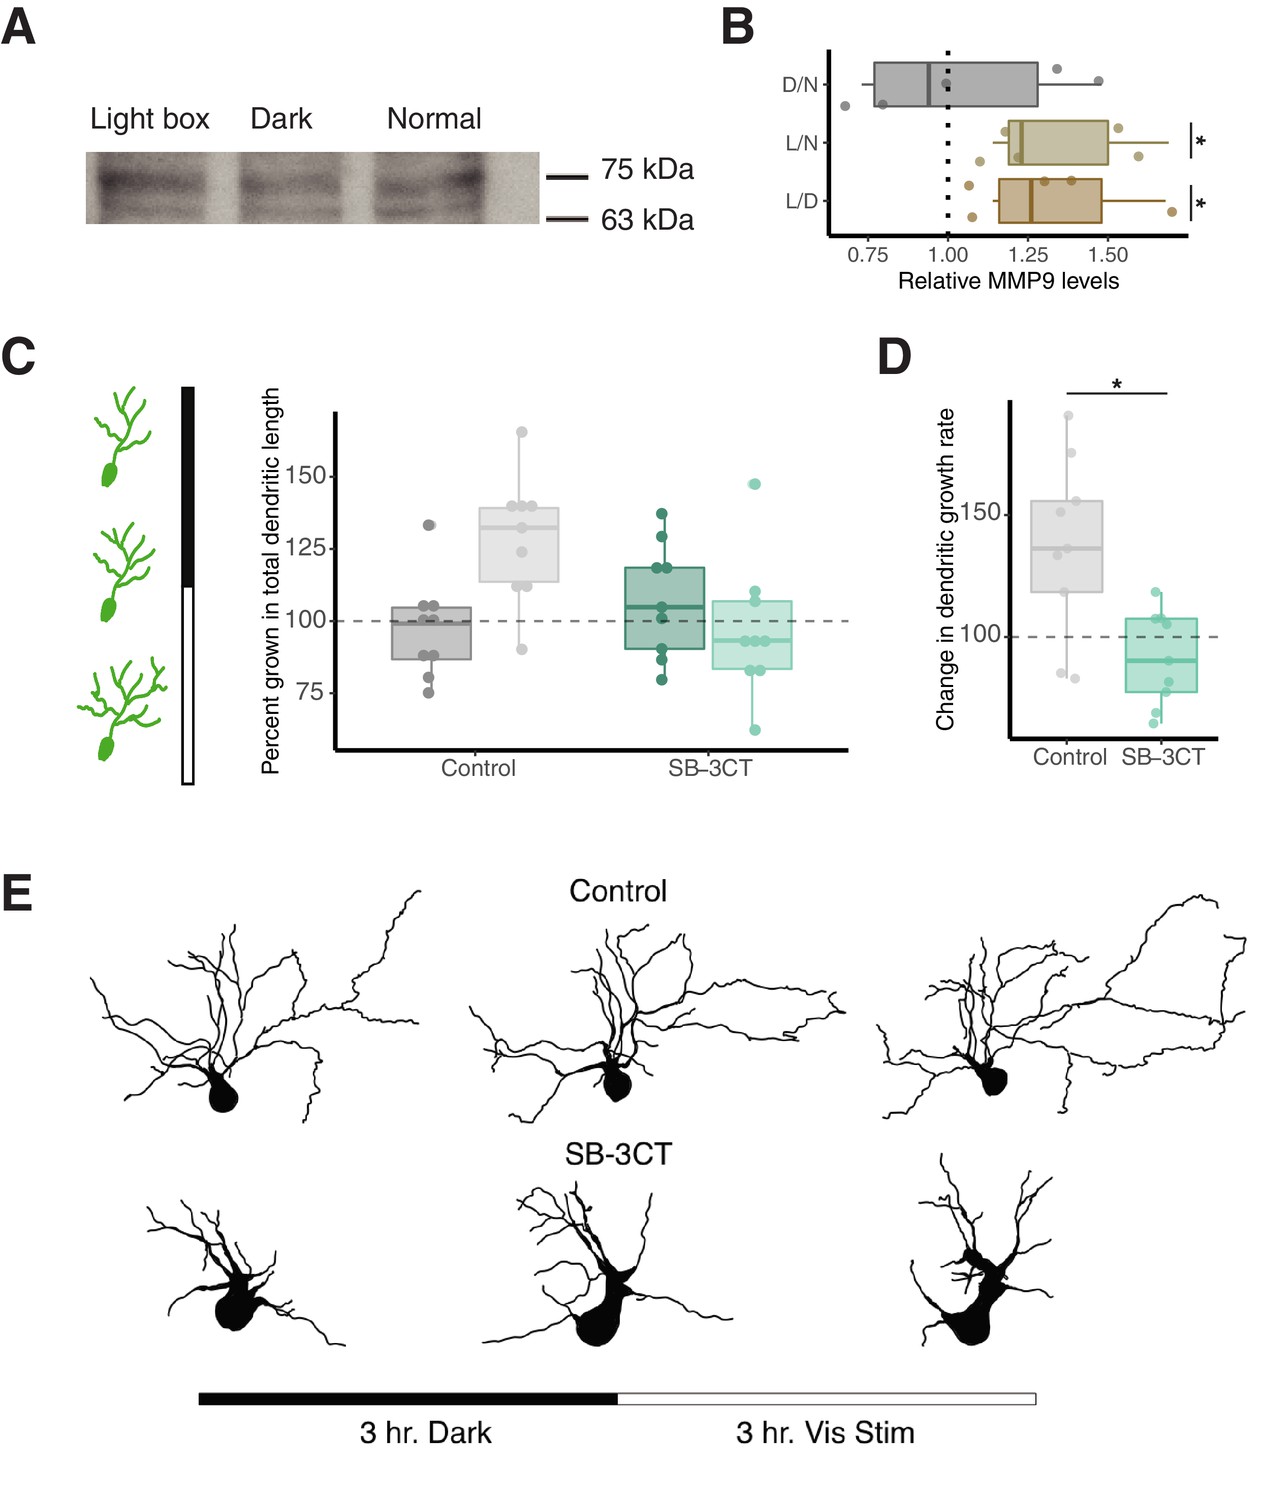
Enhanced visual activity increases MMP-9 levels and MMP-9 inhibition prevents visual-activity induced dendritic growth.
(A) Western blot analysis specifying MMP-9 levels (75 kDa band) after lightbox, dark exposure and naive controls (normal). (B) Box plot showing relative MMP-9 levels for light box treatment (enhanced visual stimulation) vs dark exposed (L/D), light box vs naive controls (L/N) and dark exposed vs naive controls (D/N), based on western blot analysis. Enhanced visual activity using a light box experimental setup significantly increases relative MMP-9 levels compared to dark and normal rearing conditions. The dotted line represents a ratio of 1 (no difference). Data are represented as median ± IQR. (C) Left panel shows schematic of experimental design, three confocal imaging sessions were performed: one at the start of an experiment, a second after 3 hr of dark exposure and a third after 3 hr of enhanced visual stimulation. In control animals, visual stimulation enhances dendritic growth whereas SB-3CT prevents dendritic growth during this period. (D) SB-3CT significantly reduces the growth rate of dendrites during visual stimulation compared to the control group. Data are represented as median ± IQR. (E) Representative 2D tracings of 3D tectal cell reconstructions from control and SB-3CT groups are shown before any treatment (left), after 3 hr of dark exposure (middle) and after enhanced visual stimulation (right). * p < 0.05.
-
Figure 5—source data 1
Visual stimulation source data.
- https://cdn.elifesciences.org/articles/62147/elife-62147-fig5-data1-v3.xlsx
Figure 5—figure supplement 1
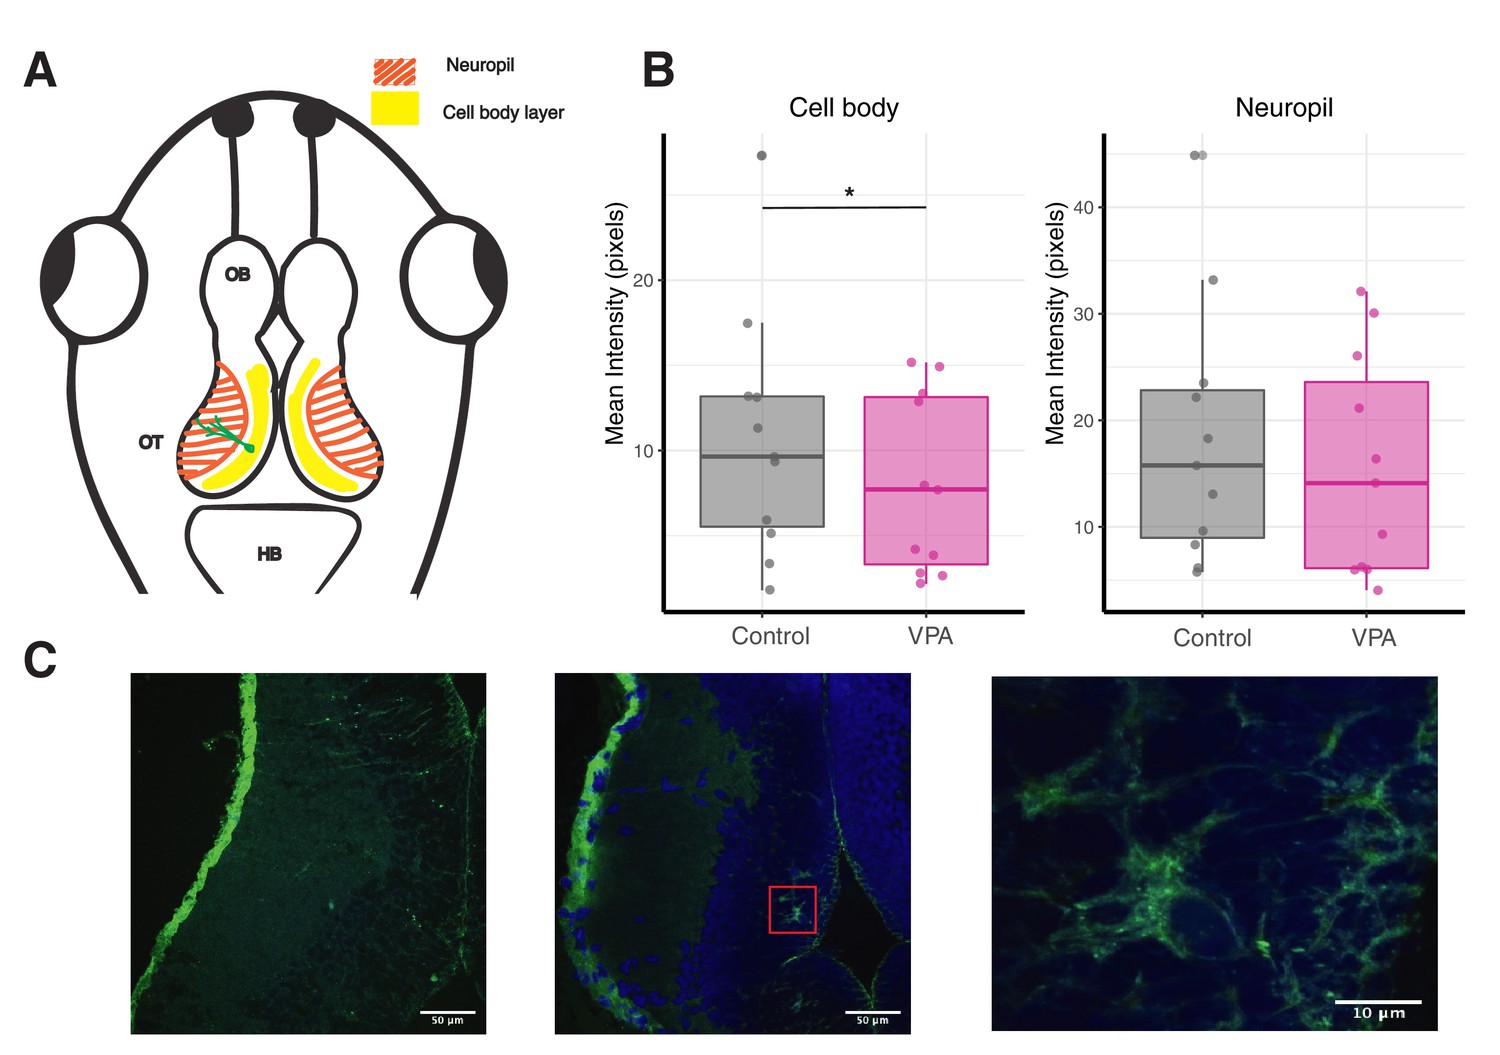
Exposure to VPA results in significantly less WFA staining intensity in comparison to control animals.
(A) Schematic representation of the tadpole nervous system showing hindbrain (HB), optic tectum (OT) and olfactory bulb (OB). Optic tectum consists of a well-defined layer of cell bodies (yellow) extending their dendrites to the neuropil layer (orange). A representative neuron is shown in green with its cell body located in the cell body layer and dendrites extending in the neuropil layer. (B) The mean intensity of WFA was significantly less in the cell body layer of VPA-exposed animals compared to control. The mean WFA intensity in the neuropil layer was not significantly different across groups. (C) Representative images showing WFA distribution in tectal sections. Green color represents F-WFA while the blue color is DAPI. (Left) F-WFA staining is diffused across cell body and neuropil layers. (Middle) In some tectal sections, distinct compact PNNs (magnified PNN shown in right image) are observed in the tectal cell body layer while neuropil has diffused F-WFA staining. (Right) Magnified image of PNNs from tectal cell body layer. * p < 0.05.
-
Figure 5—figure supplement 1—source data 1
WFA staining data.
- https://cdn.elifesciences.org/articles/62147/elife-62147-fig5-figsupp1-data1-v3.xlsx
Tables
Key resources table
| Reagent type (species) or resource | Designation | Source or reference | Identifiers | Additional information |
|---|---|---|---|---|
| Strain, strain background (Xenopus laevis) | Tadpole | Nasco | WT and Albino strains; LM00456, LM00456(A) | Bred in house |
| Chemical compound, drug | Valproic Acid | Sigma | Cat. No. P4543 | Drug |
| Chemical compound, drug | SB-3CT | Tocris | Cat. No. 6088 | MMP9/2 inhibitor |
| Recombinant DNA reagent | pCMV-SPORT6, MMP-9, GFP | Invitrogen | pCMV-SPORT6 (backbone) | Expressing Xenopus MMP9 and GFP, or GFP alone, or MMP9-FLAG |
| Genetic reagent | MMP-9 MO | GeneTools Bestman and Cline, 2014 | DOI:10.1007/978-1-62703-655-9_11 | Morpholino antisense oligonucleotide- lissamine tagged, Used to drive down expression of MMP9 |
| Genetic reagent | Control MO | GeneTools Bestman and Cline, 2014 | DOI:10.1007/978-1-62703-655-9_11 | Used as a transfection control, Morpholino antisense oligonucleotide- lissamine tagged |
| Antibody | Anti-MMP9 (Rabbit polyclonal) | EMD Millipore | Ab19016; RRID:AB_91090 | WB (1:2000) |
| Antibody | Anti-Rabbit-HRP (goat polyclonal) | BioRad | #1662408EDU; RRID:AB_11125345 | Secondary Ab for WB |
| Commercial assay or kit | Pierce ECL-western blot substrate | Thermo Fisher | Cat#32209 | For visualizing labeling |
| Recombinant DNA reagent | pCALNL-GFP (plasmid) | Schohl et al., 2020 , DOI: 10.3389/fncir.2020.00047 | For single cell labeling | |
| Recombinant DNA reagent | pCAG-Cre (plasmid) | Schohl et al., 2020, DOI: 10.3389/fncir.2020.00047 | For single cell labeling | |
| Recombinant DNA reagent | pBE-PSD-95 GFP | Sanchez et al., 2006; DOI: 10.1242/dev.02409 | For synaptic labeling | |
| Recombinant DNA reagent | pCMV-mCherry | Schwartz et al., 2009; DOI:10.1016/j.neuron.2011.02.055 | Cell filling mCherry | |
| Chemical compound, drug | F-WFA | Vector Labs | FL-1351–2 | Fluorescein-labeled Wisteria floribunda agglutinin, 1:500 dilution for staining PNNs |
Additional files
-
Supplementary file 1
Intrinsic cellular properties in different experimental groups.
Input resistance and membrane capacitance values showed no significant differences between experimental groups.
- https://cdn.elifesciences.org/articles/62147/elife-62147-supp1-v3.docx
-
Transparent reporting form
- https://cdn.elifesciences.org/articles/62147/elife-62147-transrepform-v3.docx
Download links
A two-part list of links to download the article, or parts of the article, in various formats.
Downloads (link to download the article as PDF)
Open citations (links to open the citations from this article in various online reference manager services)
Cite this article (links to download the citations from this article in formats compatible with various reference manager tools)
Role of matrix metalloproteinase-9 in neurodevelopmental deficits and experience-dependent plasticity in Xenopus laevis
eLife 10:e62147.
https://doi.org/10.7554/eLife.62147


