Transport mechanism of P4 ATPase phosphatidylcholine flippases
Figures
Figure 1 with 1 supplement

Purification and characterization of the detergent-purified flippases.
(A) SDS-PAGE gel of the purified Dnf1-Lem3 (left) and Dnf2-Lem3 (right). (B) 2D class averages of cryo-EM images of Dnf1-Lem3 in the E2P state. (C) ATP hydrolysis activity of Dnf1-Lem3 and Dnf2-Lem3 without added substrate or with the addition of 0.1 mM sphingomyelin (non-substrate) or 0.1 mM GlcCer (substrate). (D) ATP hydrolysis activity of Dnf1-Lem3 and Dnf2-Lem2 at increasing GlcCer concentration. Data points in (C–D) represent the mean ± SD in triplicate.
Figure 1—figure supplement 1
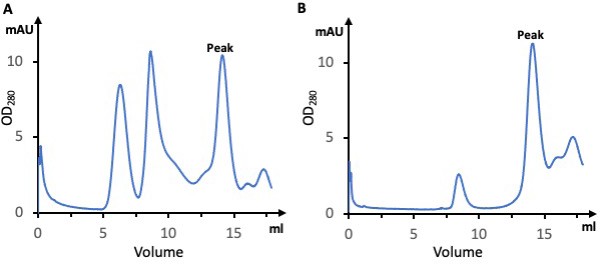
Purification of the Dnf1–Lem3 and Dnf2–Lem3 complexes.
(A) Gel filtration profile of the Dnf1–Lem3 complex. (B) Gel filtration profile of the Dnf2–Lem3 complex.
Figure 2 with 11 supplements
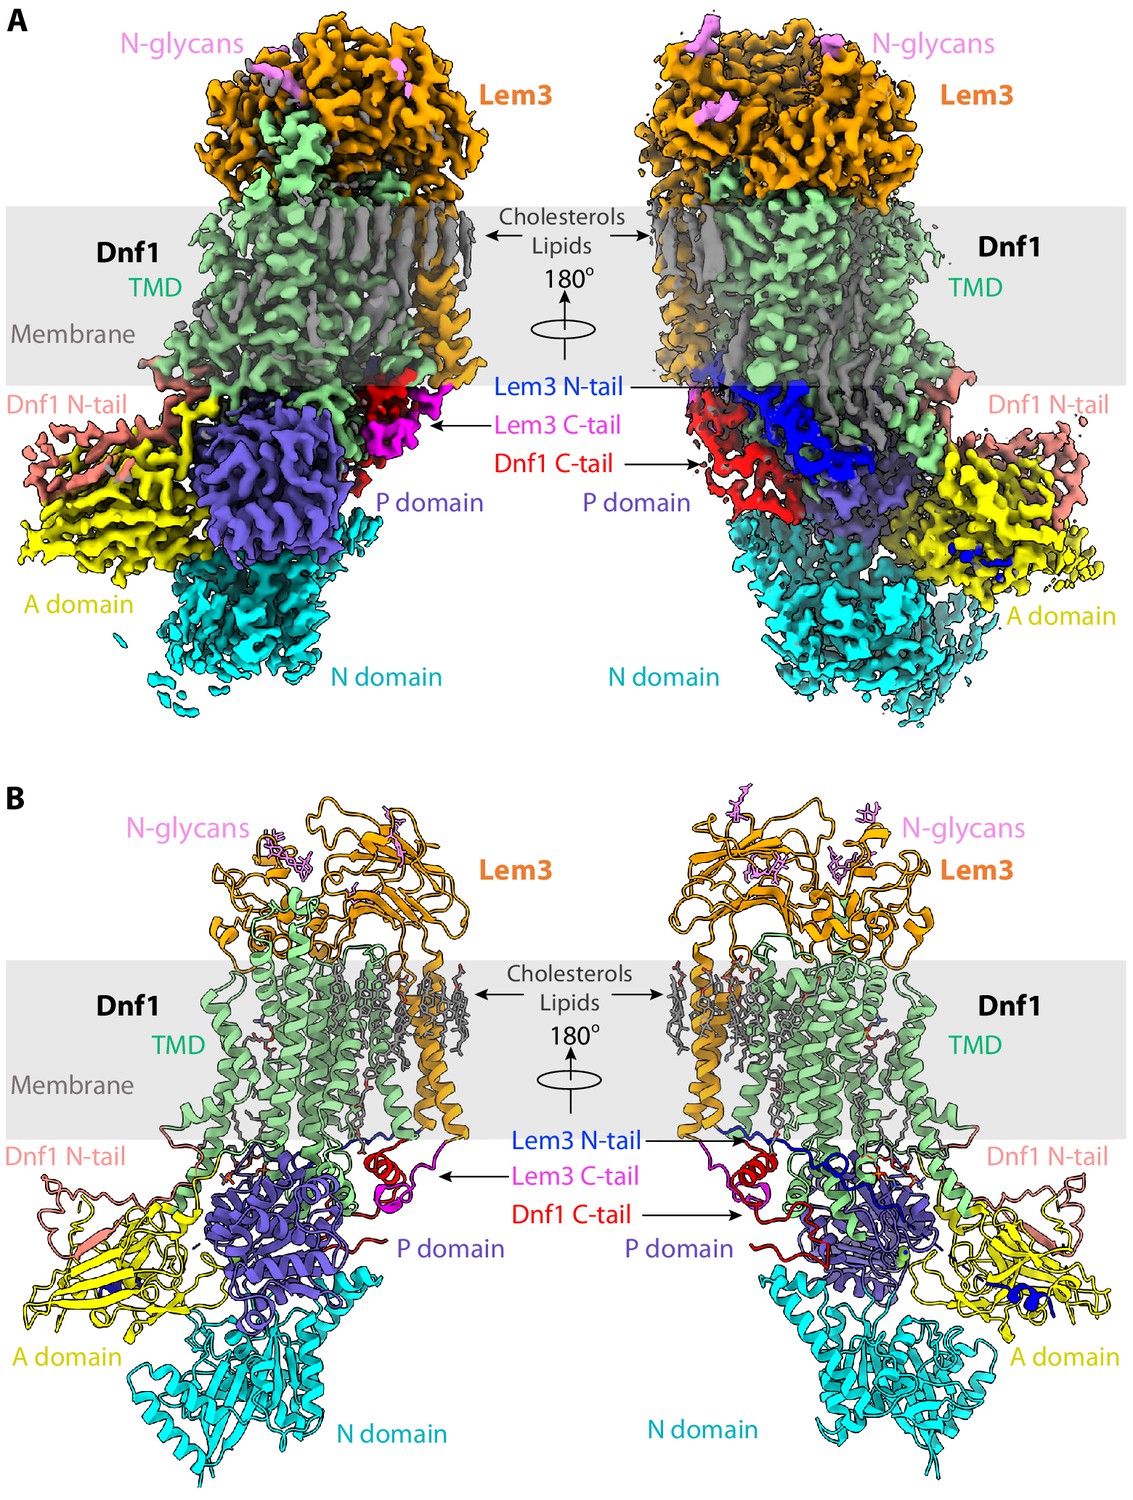
Structure of the S. cerevisiae class-3 lipid flippase Dnf1–Lem3 in the E2P state.
(A) Cryo-EM 3D map of Dnf1–Lem3 in the E2P, in front (left) and back (right) views. The major domains and motifs are labeled in different colors. (B) Atomic model of Dnf1–Lem3 in the E2P state in cartoon and colored as in panel A. The detergent and phospholipid molecules and the covalently linked glycans on Lem3 are shown as sticks.
Figure 2—figure supplement 1
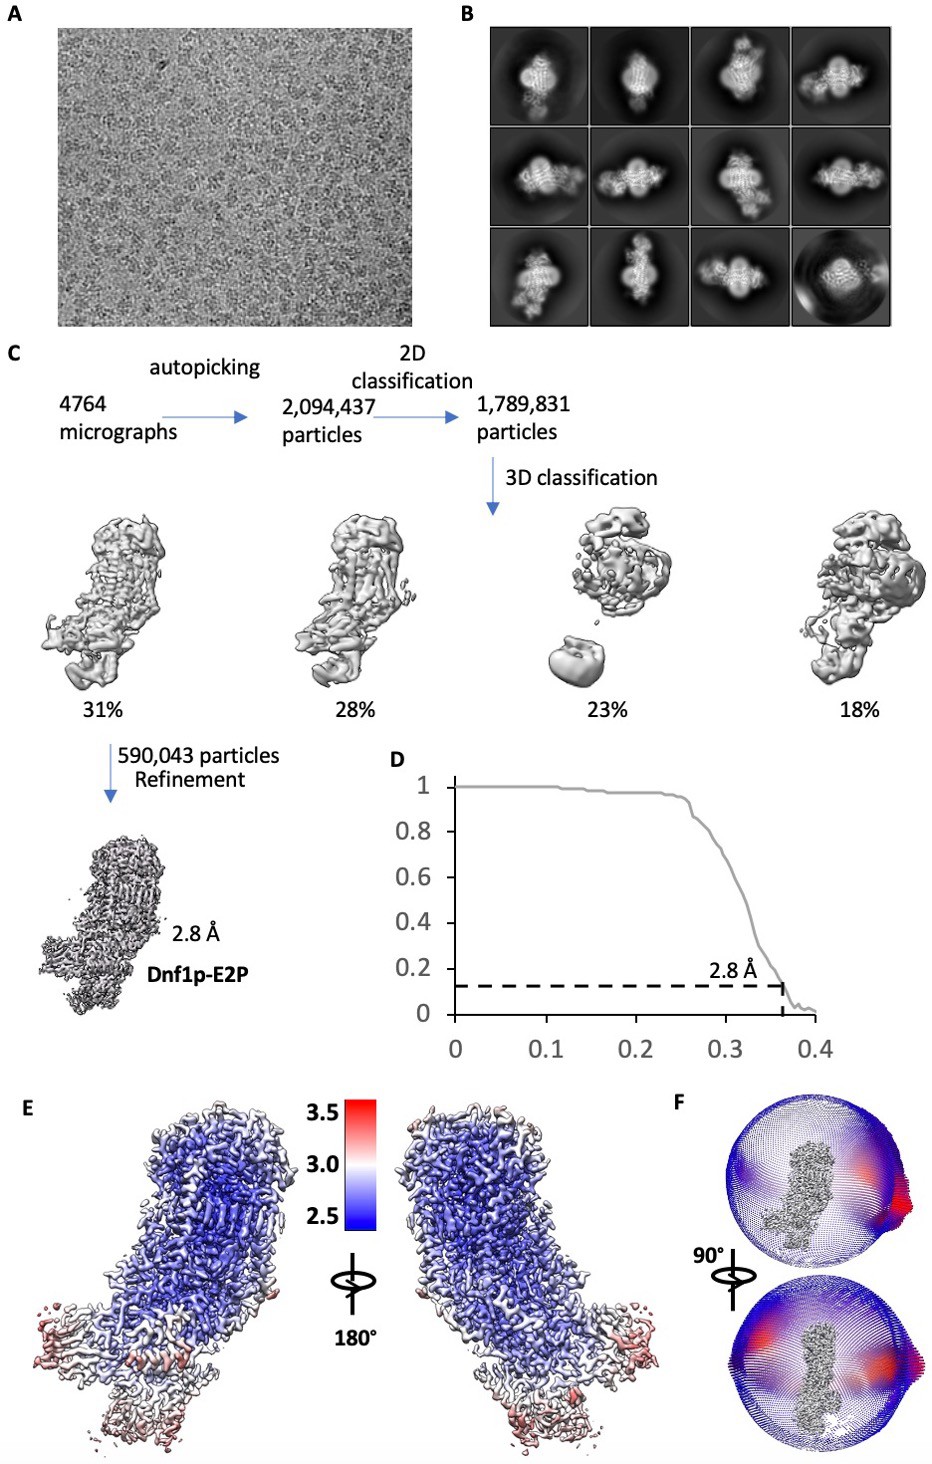
Cryo-EM data processing and resolution estimation of Dnf1–Lem3 in the E2P state.
(A) A representative electron micrograph. (B) Selected reference-free 2D class averages. This panel is the same as in Figure 1B. (C) Cryo-EM data processing procedure. (D) Gold-standard Fourier shell correlation of two independent half 3D maps. (E) Local resolution map of the final 3D map. (F) Angular distribution of raw particles used in the final reconstruction of the 2.8 Å 3D map.
Figure 2—figure supplement 2
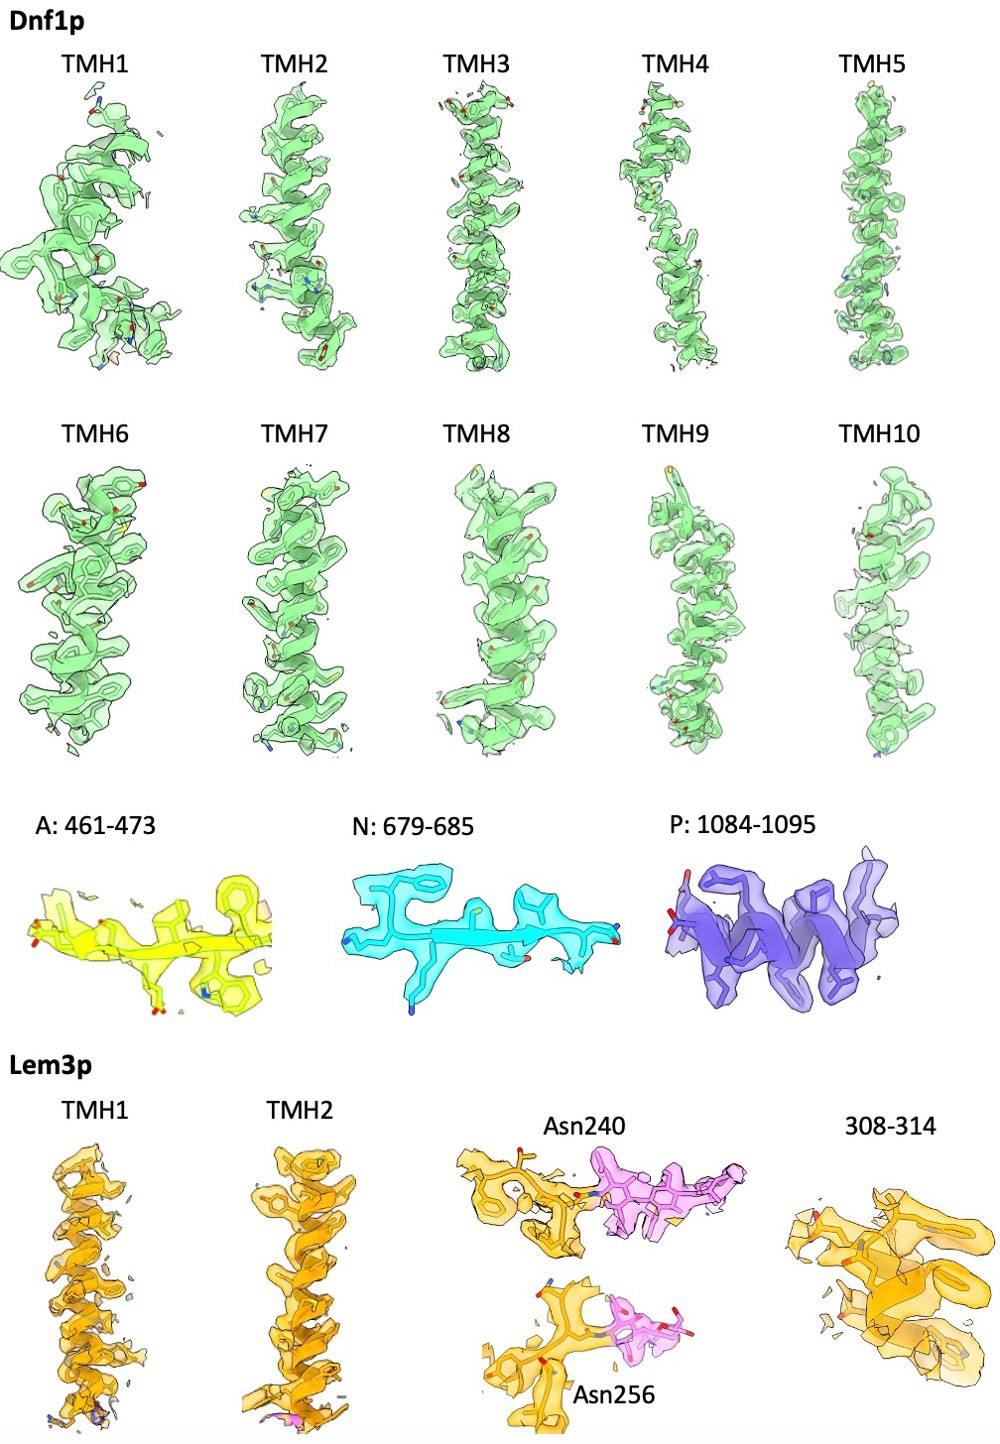
Selected regions in the 3D map of Dnf1–Lem3 in the E2P state, superimposed on the atomic model.
Figure 2—figure supplement 3
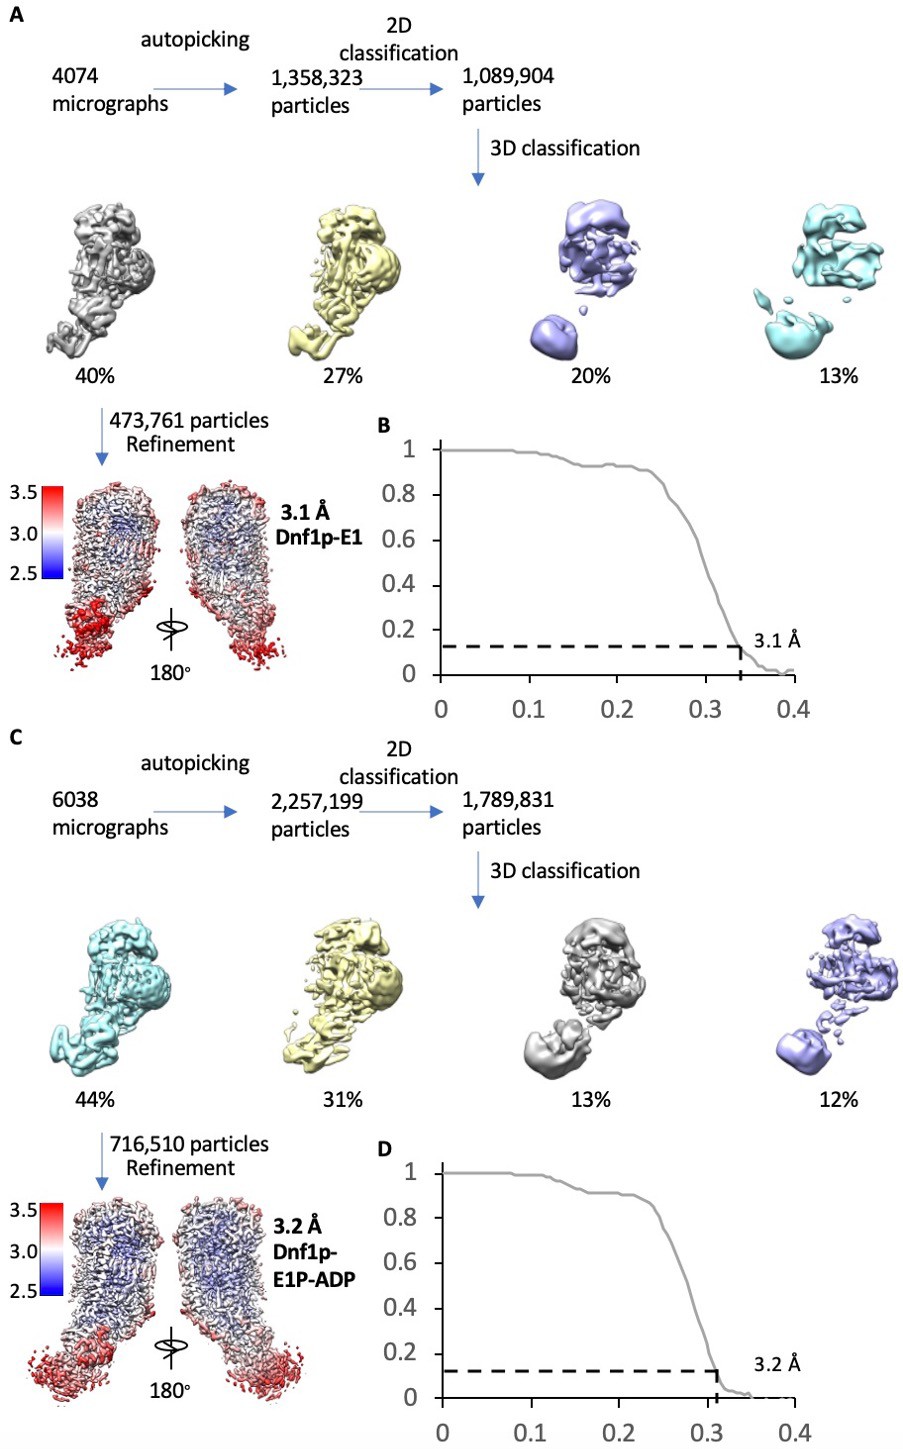
Cryo-EM data processing and validation of the Dnf1–Lem3 in the E1 and E1P-ADP states.
(A) Cryo-EM data processing procedure of Dnf1 in the E1 state. (B) Gold-standard Fourier shell correlation of two independent half 3D maps in the E1 state. (C) Cryo-EM data processing procedure of Dnf1 in the E1P-ADP state. (D) Gold-standard Fourier shell correlations of two independent half 3D maps of Dnf1p in the E1P-ADP state. In (A) and (C), the bottom panel shows the final map colored according to the local resolution.
Figure 2—figure supplement 4
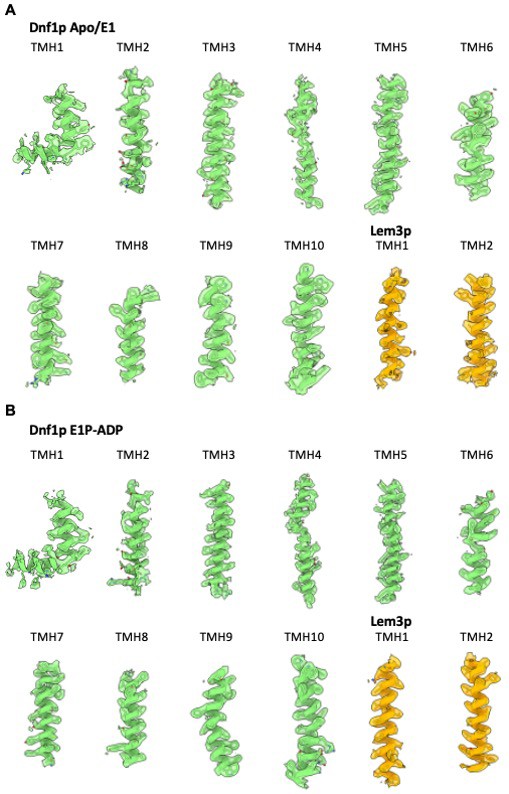
Transmembrane helices in the 3D map of Dnf1–Lem3 in the apo E1 state (A) and E1P-ADP state (B), superimposed on the atomic model.
Figure 2—figure supplement 5
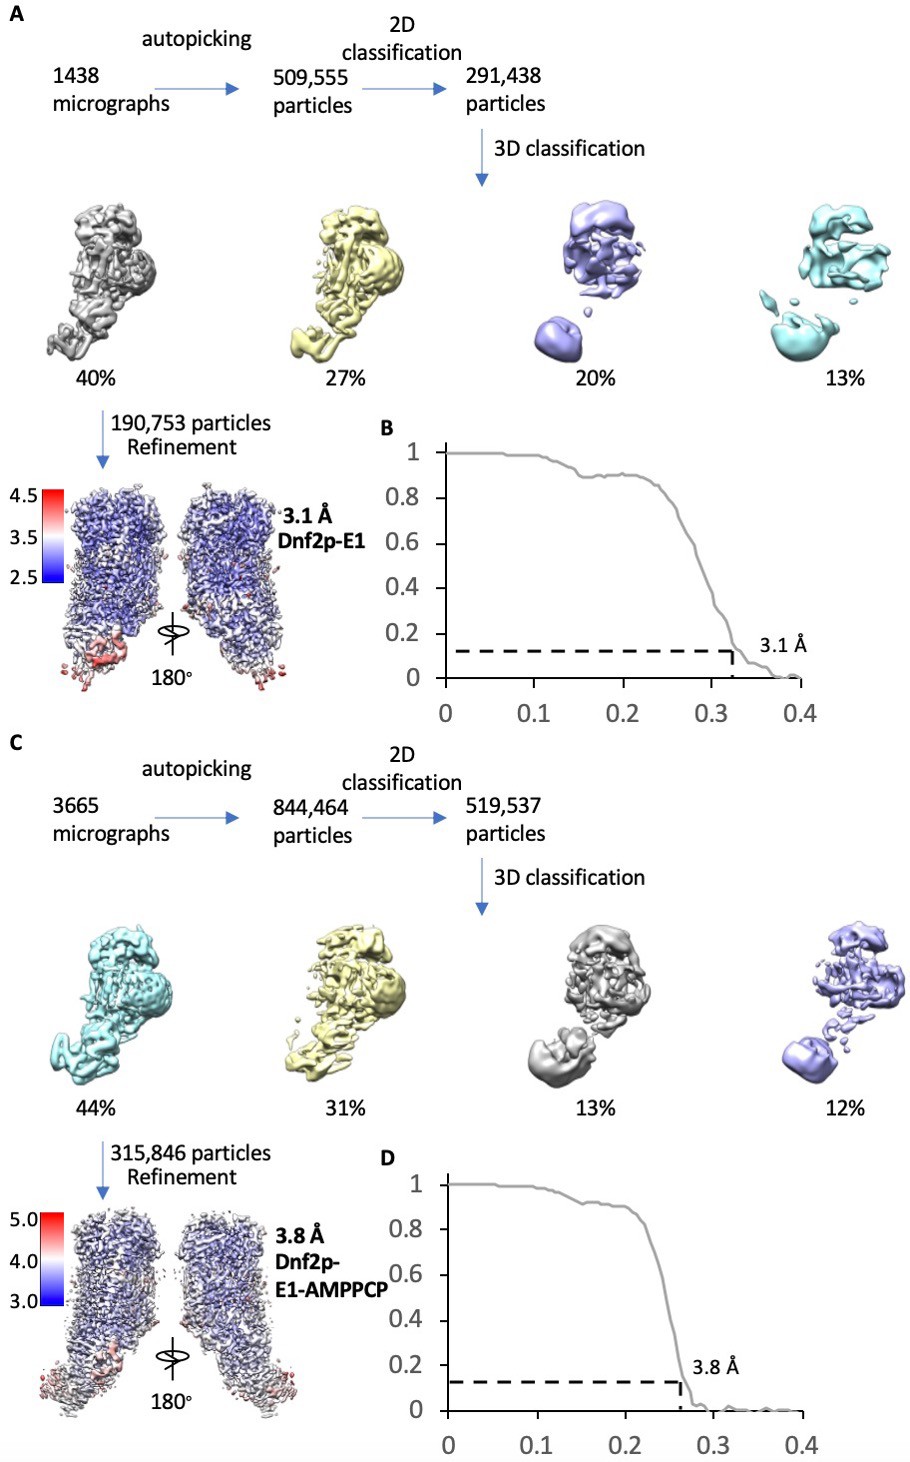
Cryo-EM data processing and resolution estimation of the Dnf2–Lem3 in the E1 and E1-ATP states.
(A) Cryo-EM data processing procedure of Dnf2 in the E1 state. (B) Gold-standard Fourier shell correlations of two independent half 3D maps in the E1 state. (C) Cryo-EM data processing procedure of Dnf2in the E1-ATP state. (D) Gold-standard Fourier shell correlations of two independent half maps of the Dnf2p-E1-ATP. In (A) and (C), the bottom panel shows the final map colored according to the local resolution.
Figure 2—figure supplement 6
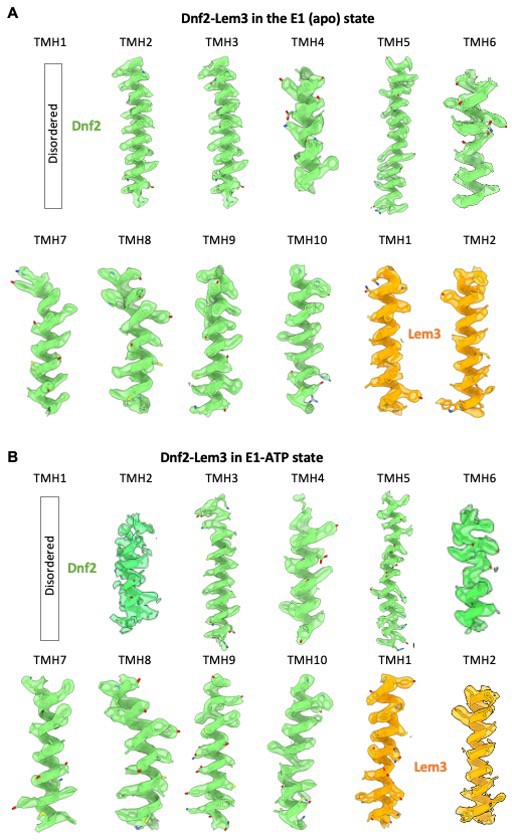
Transmembrane helices in the 3D map of Dnf2–Lem3 in the apo E1 state (A) and E1-ATP state (B), superimposed on the atomic model.
Figure 2—figure supplement 7
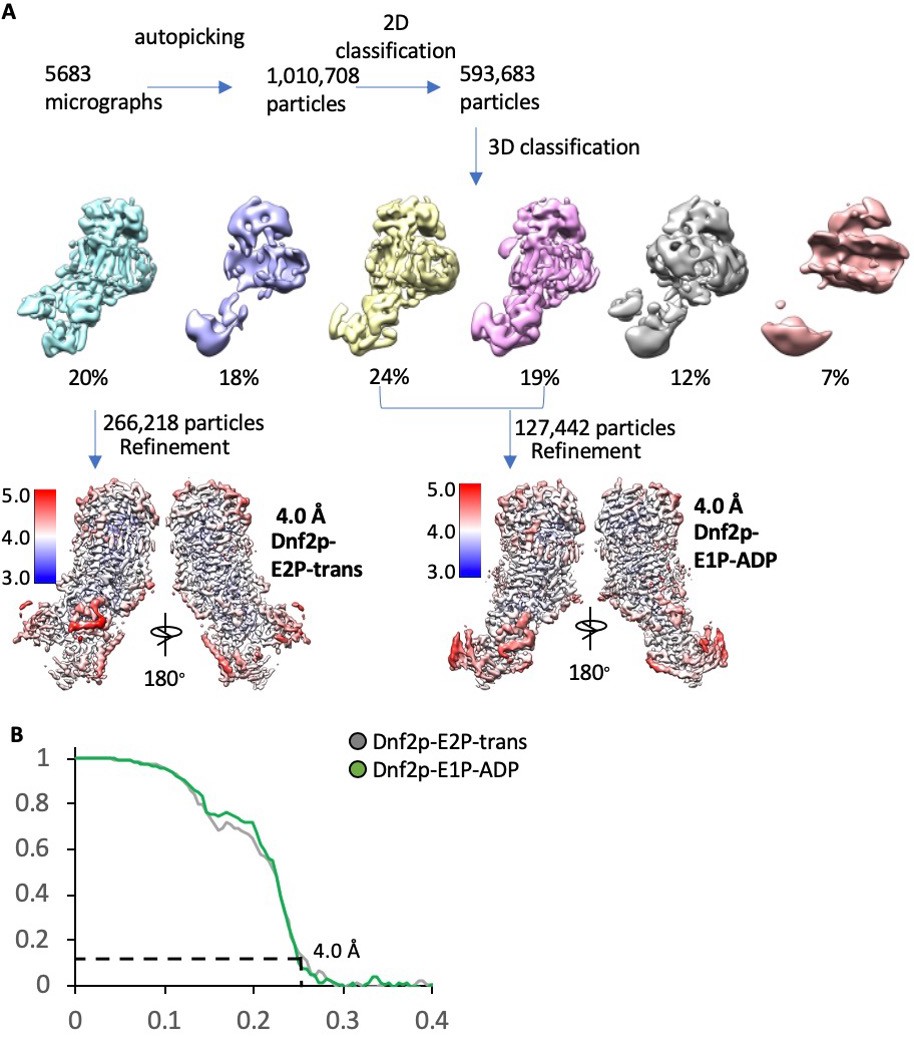
Cryo-EM data processing and validation of the Dnf2–Lem3 in the E2P-transition state and in the E1P-ADP state.
(A) Cryo-EM data processing procedure of the Dnf2–Lem3 datasets in the E2P-transition and the Dnf2p-E1P-ADP states. The two bottom panels show the two 3D maps colored according to their respective local resolutions. (B) Gold-standard Fourier shell correlations of two independent half 3D maps of Dnf2–Lem3 in the E2P-transition state and in the E1P-ADP state.
Figure 2—figure supplement 8
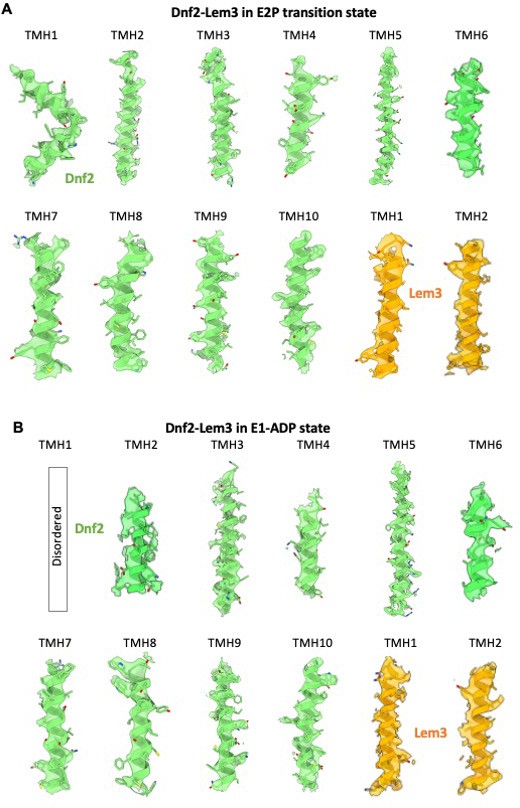
Transmembrane helices in the 3D map of Dnf2–Lem3 in the E2P-transition state (A) and E1-ADP state (B), superimposed on the atomic model.
Figure 2—figure supplement 9
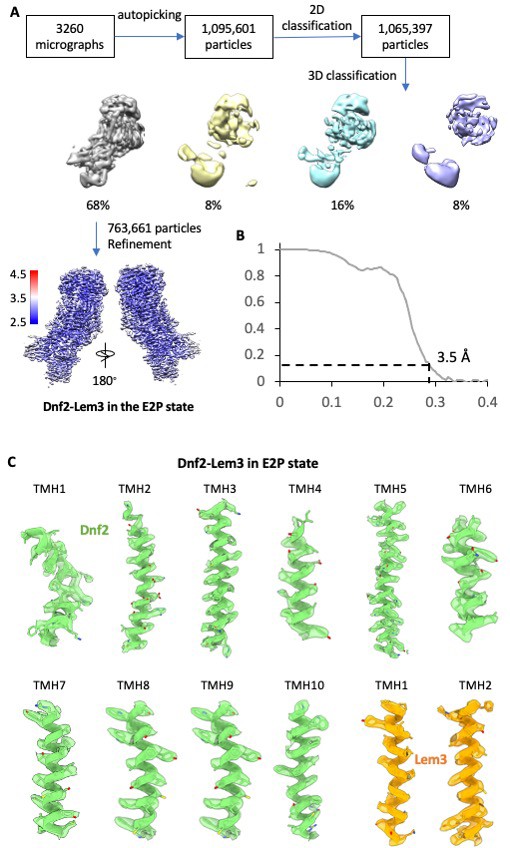
Cryo-EM data processing and validation of the Dnf2–Lem3 in the E2P state.
(A) Cryo-EM data processing procedure. The final 3D map shown at the bottom is colored coded by the local resolution. (B) Gold-standard Fourier shell correlation of two independent half 3D maps. (C) Transmembrane helices in the 3D map of Dnf2–Lem3 in the E2P state, superimposed on the atomic model.
Figure 2—figure supplement 10
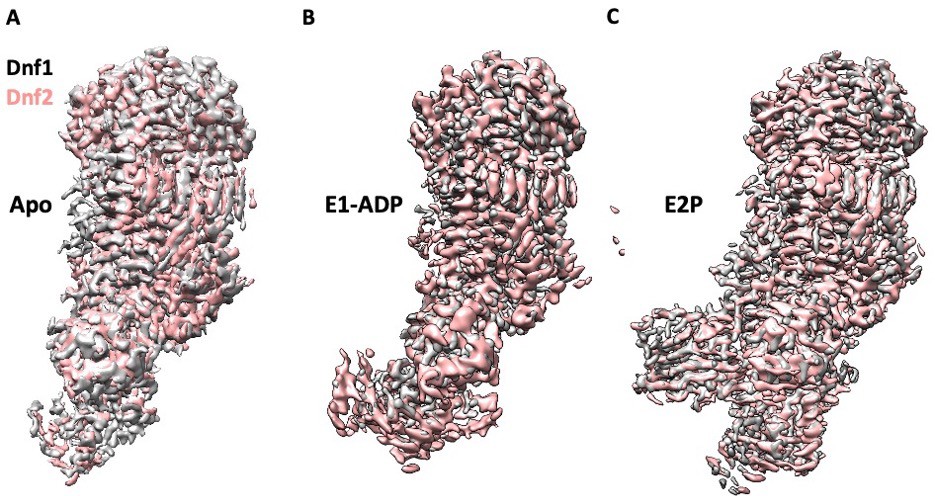
Structural alignments between the Dnf1 and Dnf2 in their corresponding E1 (apo) (A), the E1P-ADP (B), and the E2P states (C) show a high similarity.
Figure 2—figure supplement 11
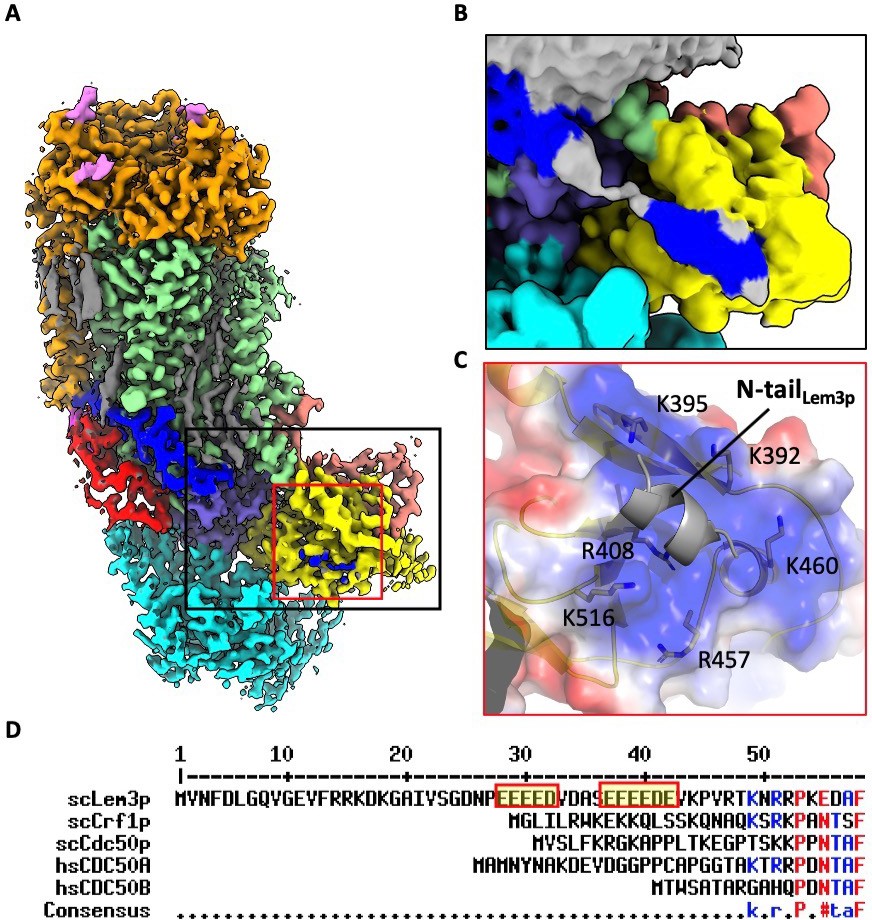
The N-terminal peptide of Lem3p is partially ordered in the 3D map of Dnf1–Lem3 in the E2P state.
(A) Cryo-EM 3D map of the Dnf1–Lem3 in the E2P state. The ordered Lem3 N-terminal peptide is highlighted by the black and red boxes. (B) An enlargement of the black box in panel A, shown at a lower display threshold to show the weaker density. (C) An enlarged view of the red box in panel A. The Lem3 N-terminal peptide interacts with the Dnf1 A domain. The interface is highly positive. (D). Sequence alignment of yeast Lem3 (ScLem3) and other CDC50 family proteins (yeast Crf1, yeast Cdc50, human CDC50A, and human CDC50B) shows the Lem3-specific, N-terminal, negatively charged motif.
Figure 3 with 1 supplement
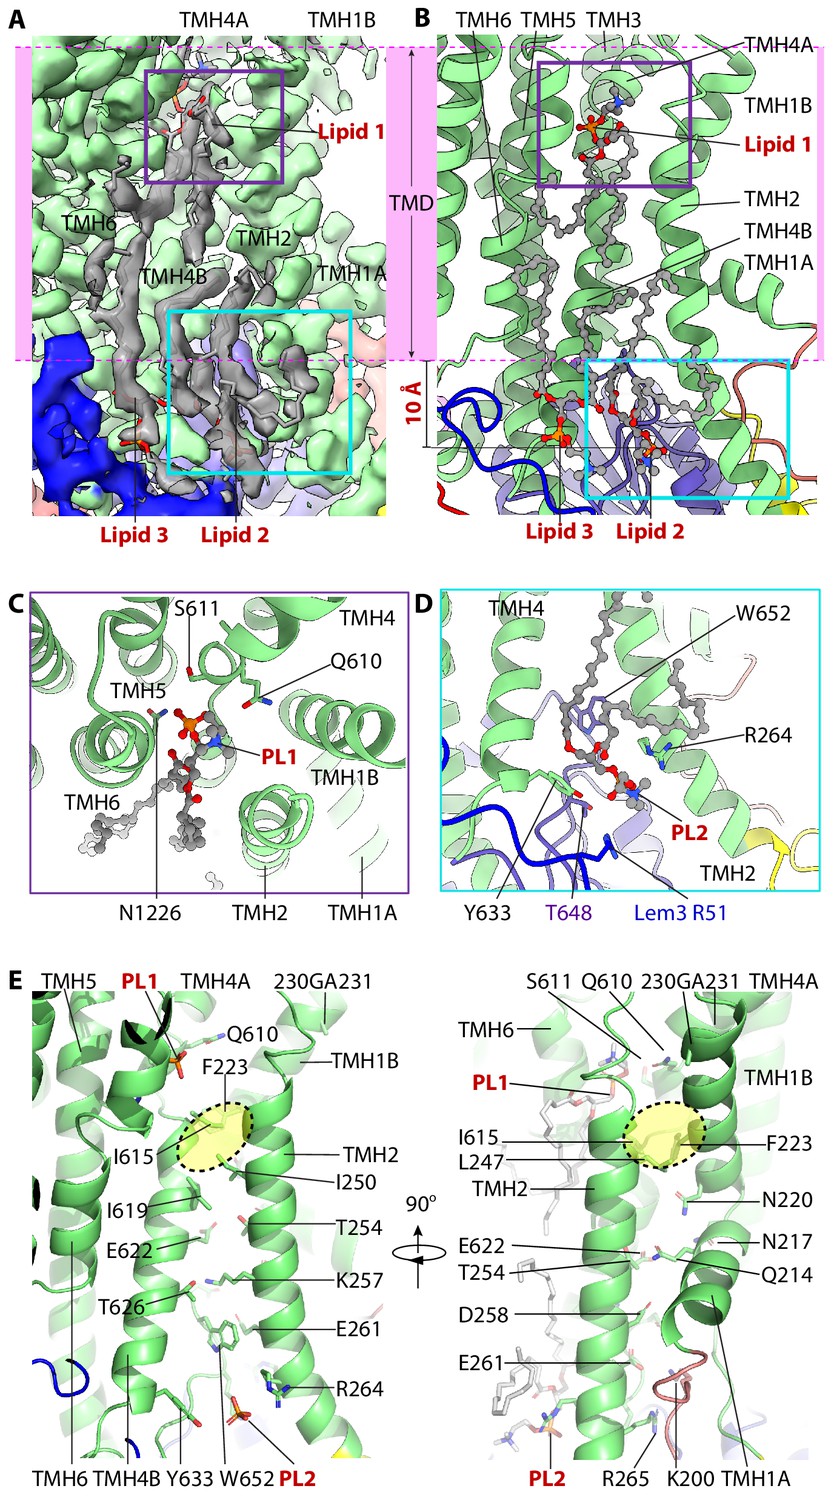
The lipid-binding sites and the putative substrate-transport path of Dnf1–Lem3.
(A) Cryo-EM 3D of the region around the putative substrate-transporting path. The transmembrane region is marked by the pink band. Three lipids densities are shown in gray. PL1 in the exoplasmic side and PL2 in the cytosolic side of the membrane are highlighted by a purple and a cyan box, respectively. (B) Cartoon view of the lipid-binding region in the Dnf1–Lem3 structure. The purple box in panel A and the cyan box in panel B are enlarged in panels C and D, respectively. Note that PL1 is about 10 Å below the lipid bilayer at the exoplasmic side, and PL2 and PL3 ingress into the cytosolic region by 10 Å. (C) Close-up and top view of PL1-binding site. (D) Close-up view of PL2-binding site. (E) Putative substrate-transport path of Dnf1p, with the residues lining the path and bound PL1 and PL2 shown as sticks. The hydrophobic gate in the lipid transport path is highlighted by the yellow oval. PL3 is removed in the left panel for clarity.
Figure 3—figure supplement 1
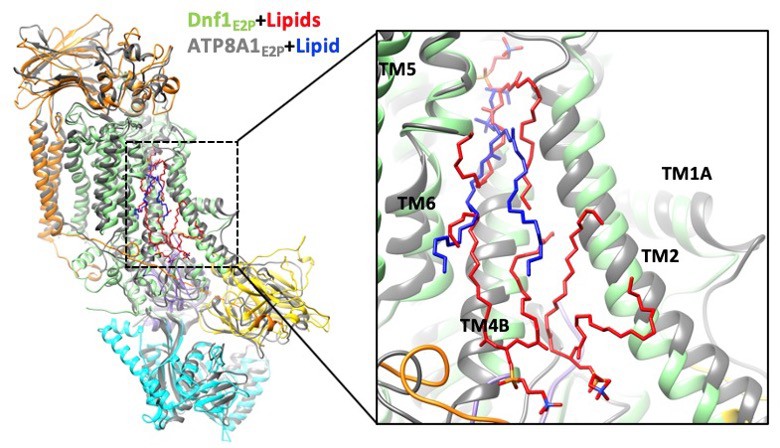
Structural comparison between Dnf1 (color) and the ATP8A1 (gray) in the E2P state.
Lipids in the Dnf1 structure are shown in red, while the only lipid in ATP8A1 is in blue. The PL- binding sites in the exoplasmic side of membrane of the two flippases are well aligned. The right panel is an enlargement of the substrate-transport path of the left panel.
Figure 4 with 2 supplements

Influence of lipid=-binding site mutations on Dnf1 transport activity and localization.
(A) NBD-lipid uptake catalyzed by Dnf1 variants expressed on a dnf1,2∆ strain background. (B) NBD-lipid uptake catalyzed by Lem3 variants expressed on a lem3∆ background, in which lipid transport is mediated primarily by Dnf2–Lem3. (C) NBD-lipid uptake catalyzed by Lem3 variants expressed on a lem3∆ dnf2∆ background to assay the influence of Lem3 mutations solely on Dnf1 activity. In (A–C), cells were incubated with NBD-lipids for 30 min and uptake was measured by flow cytometry. The value represents percentage uptake of NBD-lipid in comparison to WT Dnf1 (A) or WT Lem3 (B–C) for each substrate lipid. The variance was assessed with one-way ANOVAs, and comparison to WT was calculated with Tukey’s post hoc analysis. n ≥ 9,± SD, * indicates p<0.05, **p<0.01, ***p<0.001. (D) Localization of GFP-tagged Dnf1 variants expressed in dnf1,2∆ cells. (E) WT Dnf1-GFP co-expressed with Lem3 variants. Arrowheads indicate nuclear envelope/endoplasmic reticulum location. Scale bar = 2 μm (n = 40).
Figure 4—figure supplement 1
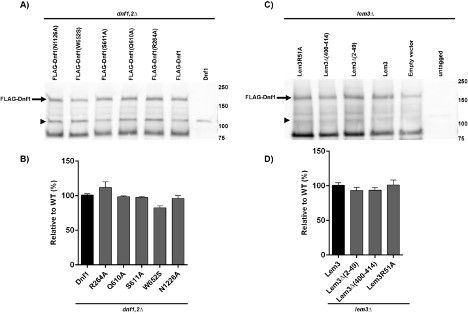
Expression levels of Dnf1 variants.
(A) Immunoblot of FLAG-tagged Dnf1, Dnf1 R264A, Dnf1 Q610A, Dnf1 S611A, Dnf1 W652S and Dnf1 N1226 expressed in the dnf1,2∆ strain. The arrow indicates the full-length FLAG-Dnf1 band and arrowhead indicates a background band present in S. cerevisiae cell lysates recognized by the anti-FLAG antibodies. (B) Quantification of mutant FLAG-Dnf1 expression in dnf1,2∆ relative to WT FLAG-Dnf1. Expression (C) and quantification (D) of FLAG-Dnf1 in a lem3∆ strain expressing mutant forms of Lem3. Empty vector indicates the strain lacks any Lem3 and untagged indicates expression of Dnf1 without the FLAG tag. For quantitation, the full-length FLAG-Dnf1 band was quantified using ImageJ and normalized to the amount of the background band indicated with the arrowheads for each lane, and each mutant Dnf1 variant was plotted as the % of the WT FLAG-Dnf1 band intensity (n = 3).
Figure 4—figure supplement 2
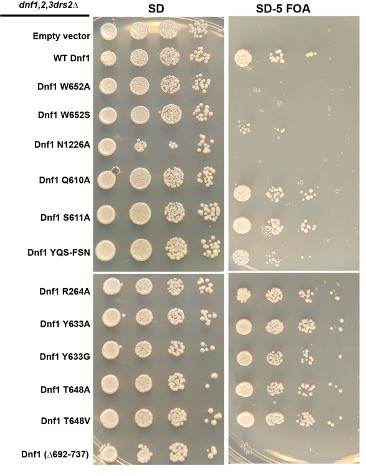
Ability of Dnf1 variants to support viability of flippase-deficient cells.
HIS3-marked plasmids (pRS313) carrying the indicated Dnf1 variants were used to transform a dnf1,2,3∆drs2∆ pRS416-DRS2 strain. Strains were spotted onto minimal media plates (SD) selecting for both plasmids, and pRS416-DRS2 was counter-selected on medium containing 5-fluoroorotic acid (SD-FOA). Strains were incubated at 30°C for 2 d and imaged. The growth phenotype on SD-FOA is an indicator of how well the Dnf1 variant functions in vivo.
Figure 5 with 2 supplements
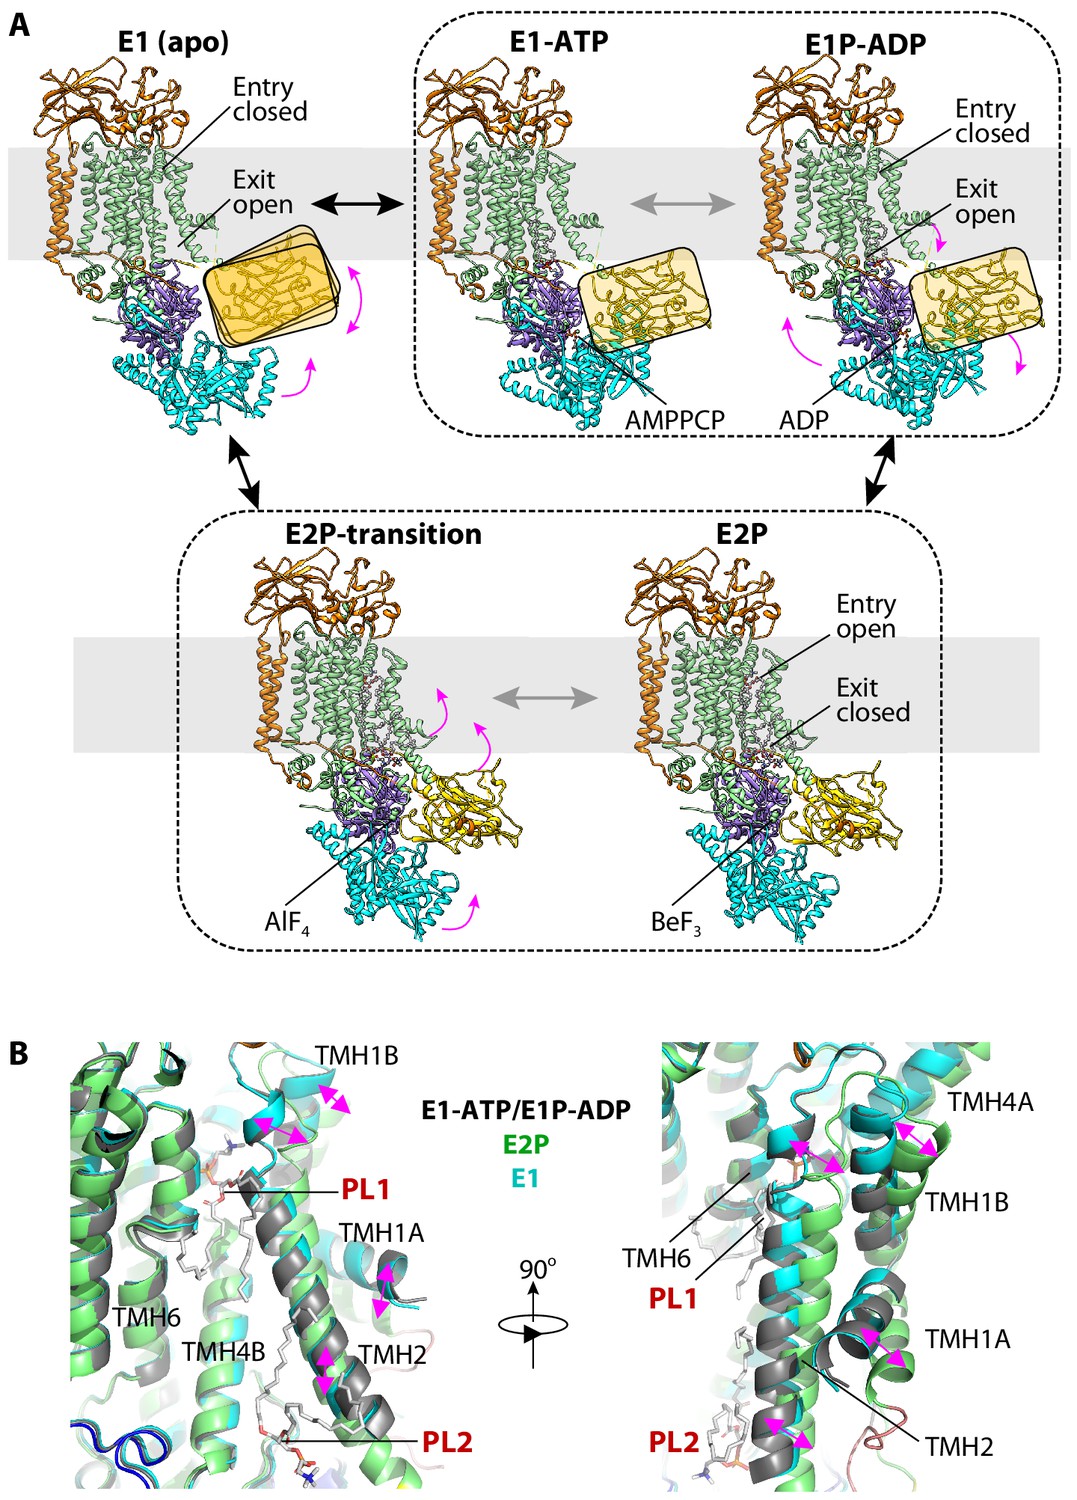
The ATP-dependent transport cycle of Dnf1–Lem3 and Dnf2–Lem3.
(A) The five structures of Dnf1 and Dnf2 in the E1 (apo), E1-ATP (AMPPCP), E1P-ADP (AlF4−-ADP), E2P-transition (AlF4−), and E2P (BeF3−) states. The A domain in the E1, E1-ATP, and E1P-ADP states is flexible and is shown here as a ribbon in the yellow rectangle to indicate its position. The structures of the E1-ATP and E1P-ADP states within the black dashed box are almost identical. The structures of the E2P and E2P-transition states are similarly grouped for the same reason. Magenta arrows indicate the domain movement during the Post–Albers cycle in the order E1 to E1-ATP to E1P-ADP to E2P/E2P-transition. (B) Structural comparison of the substrate-binding sites in the E1, E1P-ADP, and E2P states. TMH1-2 in the E1 and E1P-ADP states tilt with respect to that in the E2P state; this movement closes the PL1 site and opens the PL2 site.
Figure 5—figure supplement 1
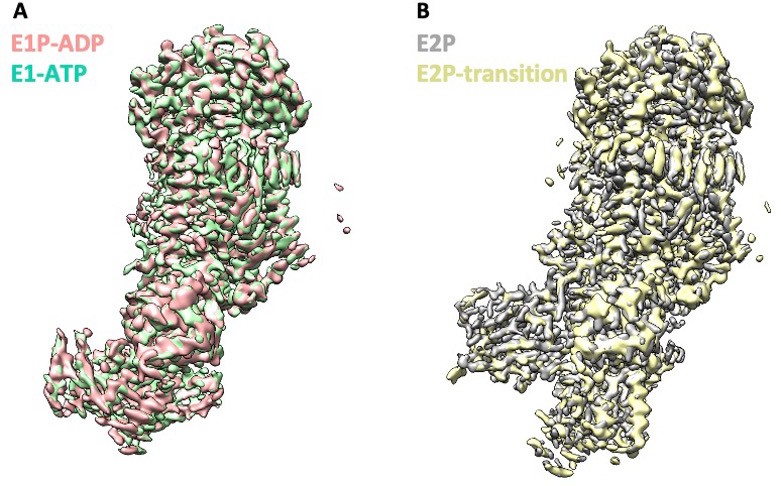
High structural similarity between Dnf1 and Dnf2 in the corresponding substrate-transport states.
(A) Structural alignments 3D maps of Dnf2–Lem3 in the E1-ATP and E1P-ADP states. (B) Structural alignments of 3D maps of Dnf2 in the E2P and E2P-transition states.
Figure 5—figure supplement 2
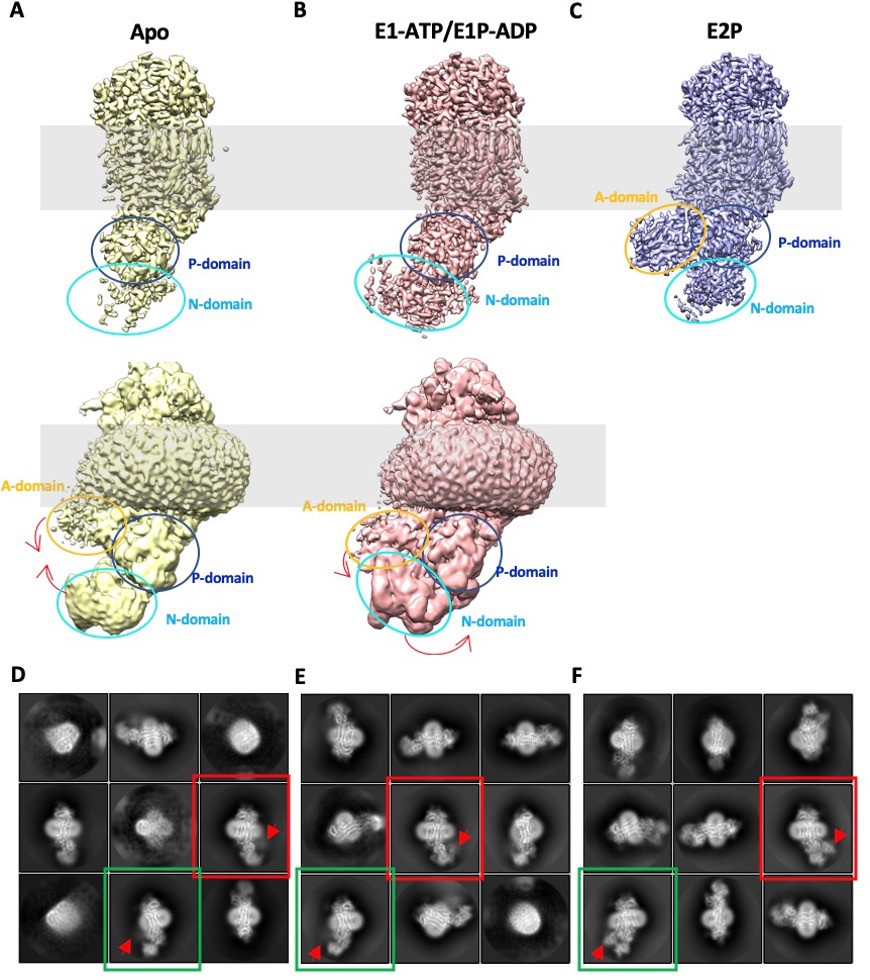
The N and A domain densities are weak in the 3D maps of Dnf1–Lem3 in the E1 and E1P-ADP states, indicating their high flexibility.
(A) Cryo-EM 3D map of the Dnf1-Lem3 in the E1 state displayed at a high (top panel) and a low threshold (bottom panel). Red arrows indicate the domain movement from the E1 state to the E1-ATP state. (B) Cryo-EM 3D map of the Dnf1–Lem3 in the E1-ATP state displayed at a high (top panel) and a low threshold (bottom panel). Red arrows indicate the domain movement from the E1P-ADP state to the E2P state. (C) Cryo-EM 3D map of the Dnf1–Lem3 in the E2P state. (D–F), Selected reference-free 2D class averages of the Dnf1–Lem3 in the E1 state (D), in the E1P-ADP state (E), and in the E2P state (F). The averages in red or green boxes belong in the same views. The A domain locations are labeled by red arrowheads. The weak and blurry A domain density indicates its flexibility in the E1 and E1P-ADP states.
Figure 6
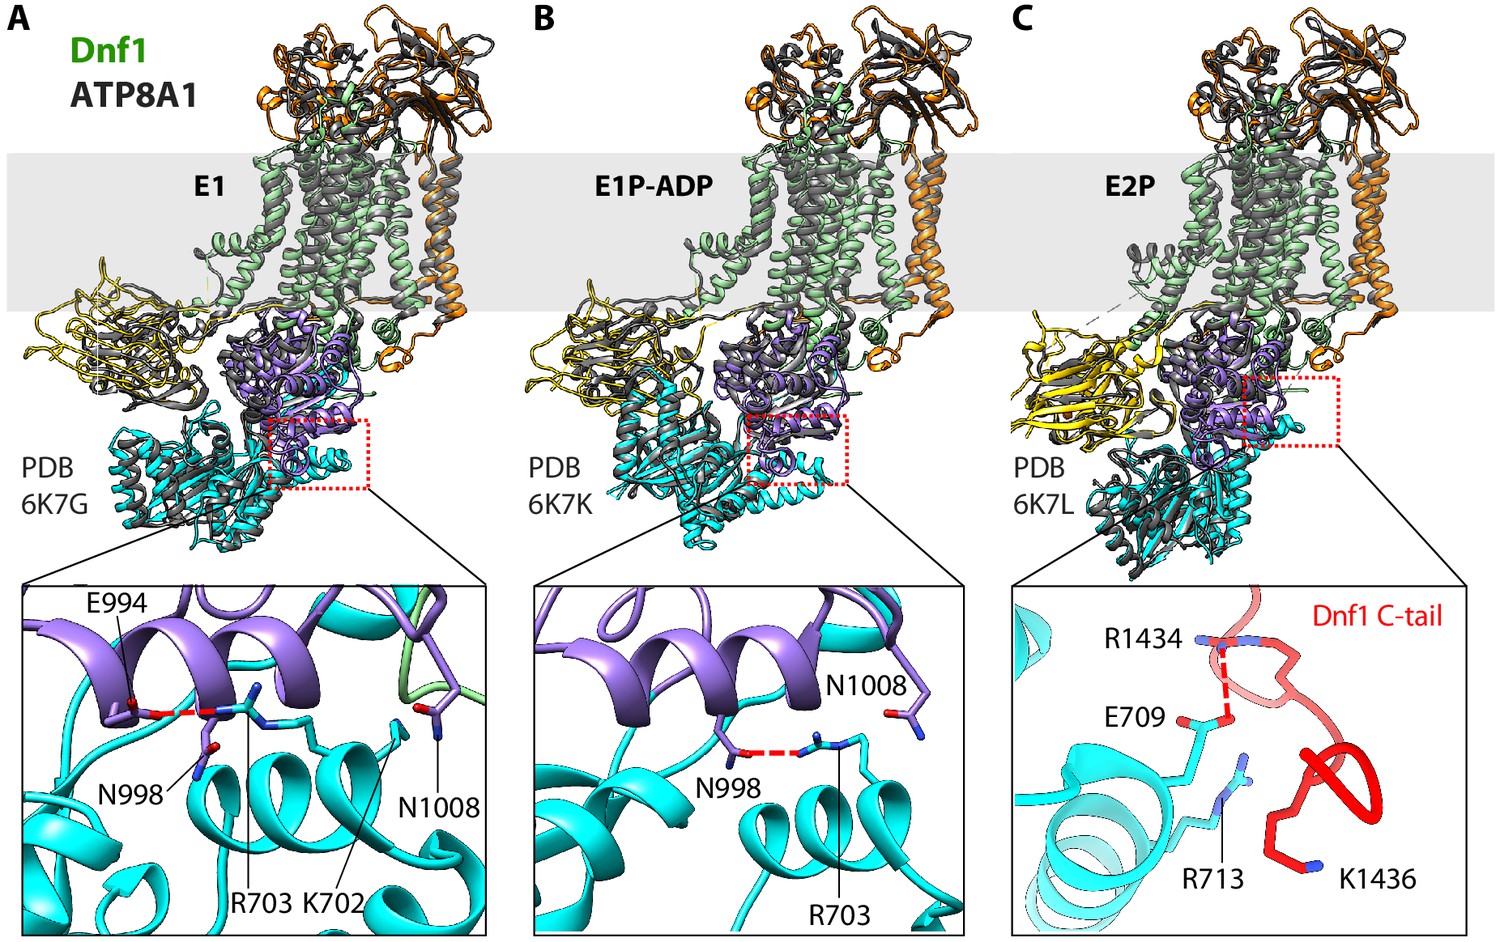
Structural comparison between Dnf1 (color) and the ATP8A1 (gray) in the E1 (A), E1P-ADP (B), and E2P (C) states.
Bottom panels are close-up views of the boxed regions in the top panels. These panels highlight the unique helix-turn-helix motif in the N domain of Dnf1, which interacts with different regions in different states.
Additional files
-
Supplementary file 1
Cryo-EM data collection, refinement, and validations.
- https://cdn.elifesciences.org/articles/62163/elife-62163-supp1-v2.docx
-
Supplementary file 2
List of plasmids used in the study.
- https://cdn.elifesciences.org/articles/62163/elife-62163-supp2-v2.docx
-
Supplementary file 3
List of strains used in the study (knockouts are KanMX replacements unless otherwise indicated).
- https://cdn.elifesciences.org/articles/62163/elife-62163-supp3-v2.docx
-
Transparent reporting form
- https://cdn.elifesciences.org/articles/62163/elife-62163-transrepform-v2.docx
Download links
A two-part list of links to download the article, or parts of the article, in various formats.
Downloads (link to download the article as PDF)
Open citations (links to open the citations from this article in various online reference manager services)
Cite this article (links to download the citations from this article in formats compatible with various reference manager tools)
Transport mechanism of P4 ATPase phosphatidylcholine flippases
eLife 9:e62163.
https://doi.org/10.7554/eLife.62163


