Microglial trogocytosis and the complement system regulate axonal pruning in vivo
- Department of Neurology & Neurosurgery, Montreal Neurological Institute-Hospital, McGill University, Canada
Figures
Figure 1
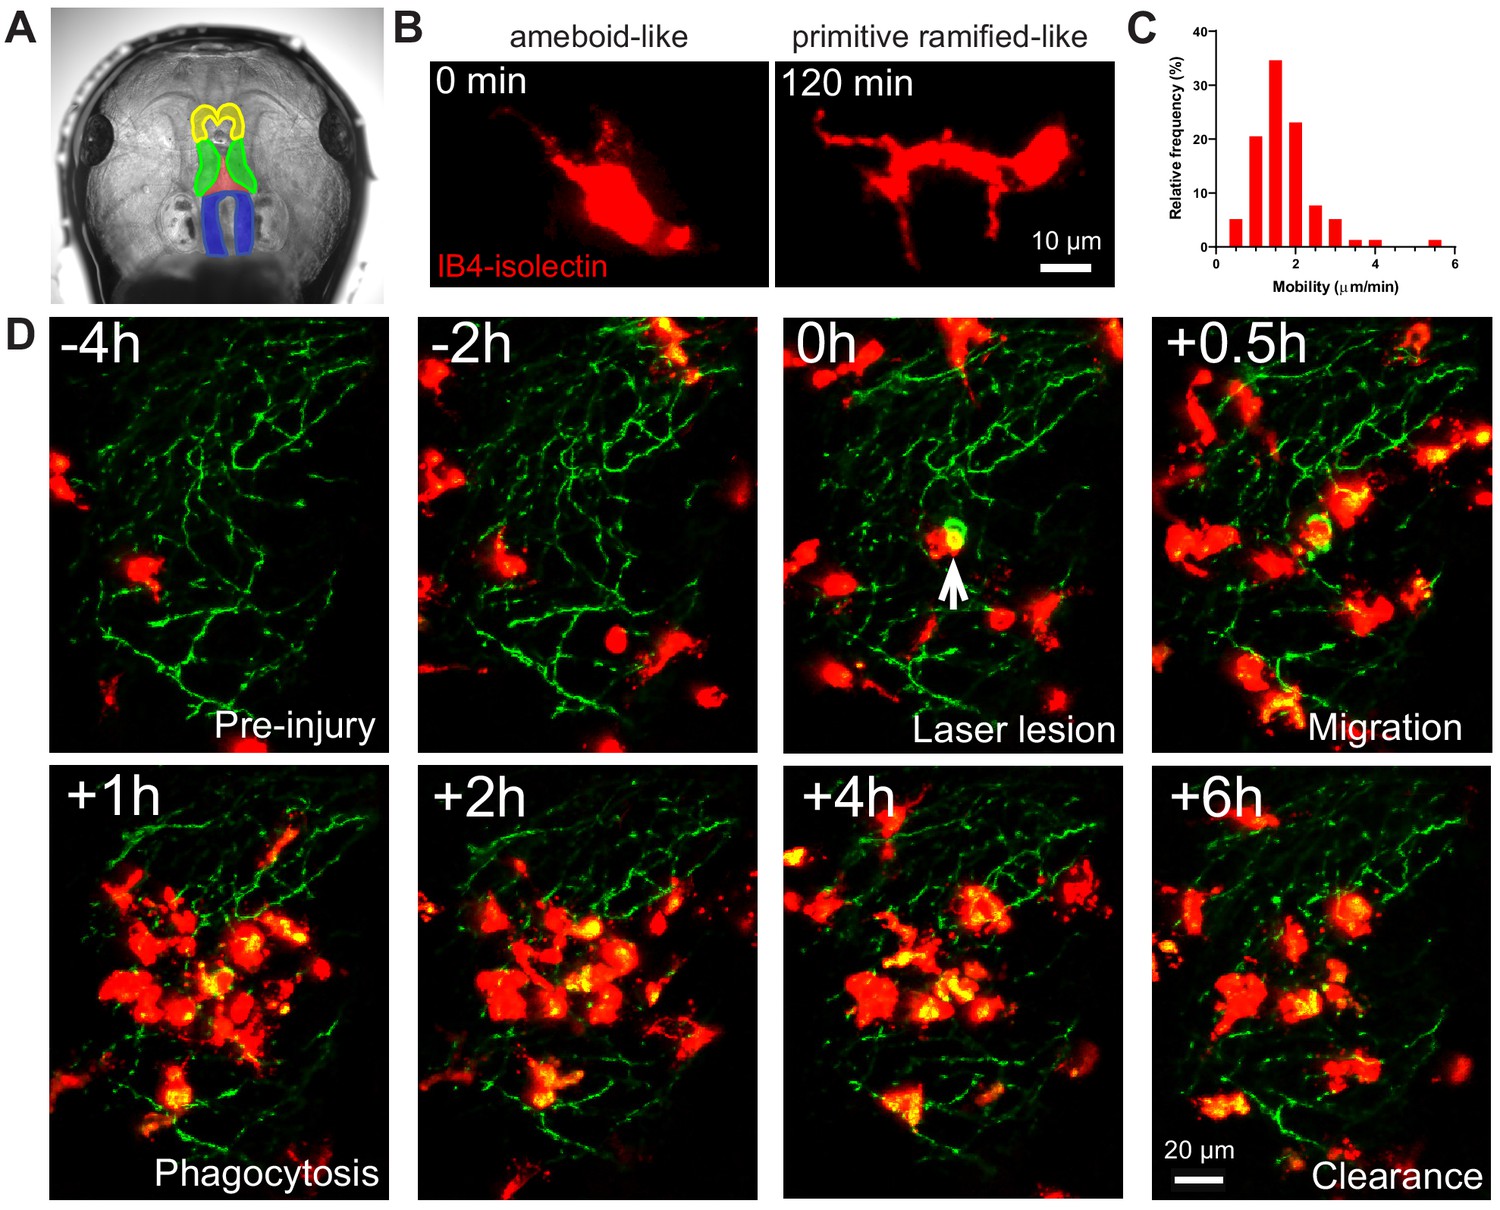
IB4-isolectin-conjugated fluorophores label microglial cells in developing Xenopus laevis tadpoles.
(A) The tadpole brain colorized for identification (yellow = olfactory bulb and forebrain, green = optic tectum, blue = hindbrain). To label microglia, IB4-isolectin conjugated fluorophores are injected into the 3rd ventricle (red). (B) Dynamic cells with both ameboid-like and primitive ramified-like morphologies are labeled by IB4-isolectin. (C) The distribution in mobility of IB4-isolectin-labeled cells under normal conditions. Average velocity is 1.8 ± 0.5 μm/min (mean ± SD, n = 5). (D) Laser irradiation injury of the neuropil and response by IB4-isolectin-labeled cells. Laser irradiation injury induced a region of damaged, autofluorescent, tissue. IB4-isolectin-labeled cells mobilize to the injury site and remove the injured tissue by phagocytosis. IB4-isolectin-labeled cells are shown in red, and eGFP-labeled RGC axons are shown in green.
-
Figure 1—source data 1
Microglia mobility measurements in Figure 1C.
- https://cdn.elifesciences.org/articles/62167/elife-62167-fig1-data1-v1.xlsx
Figure 2 with 1 supplement

Microglia surveil the tectal neuropil, contact RGC axons, and increase in green fluorescence following an interaction with pHtdGFP-labeled axons in real-time.
(A) A diagram of the developing Xenopus laevis retinotectal circuit. (B) The tectal neuropil does not exclude microglia in Xenopus laevis. The yellow dotted line indicates the border of the cell body layer and the neuropil region. Microglia (red) can be observed migrating in and out of the neuropil region from the cell body layer. A single registered optical section is shown. (C) Microglia surveil the neuropil. A microglial cell is followed over time as it traversed different depths in the tectum. (D) Microglia extend processes (white arrows) into the neuropil. Contact duration varied between minutes and hours. (E) A microglial cell (blue arrow) interacts with a pHtdGFP-labeled RGC axon and increases in green fluorescence in real-time. The colocalization of green and red is colorized as white.
Figure 2—figure supplement 1
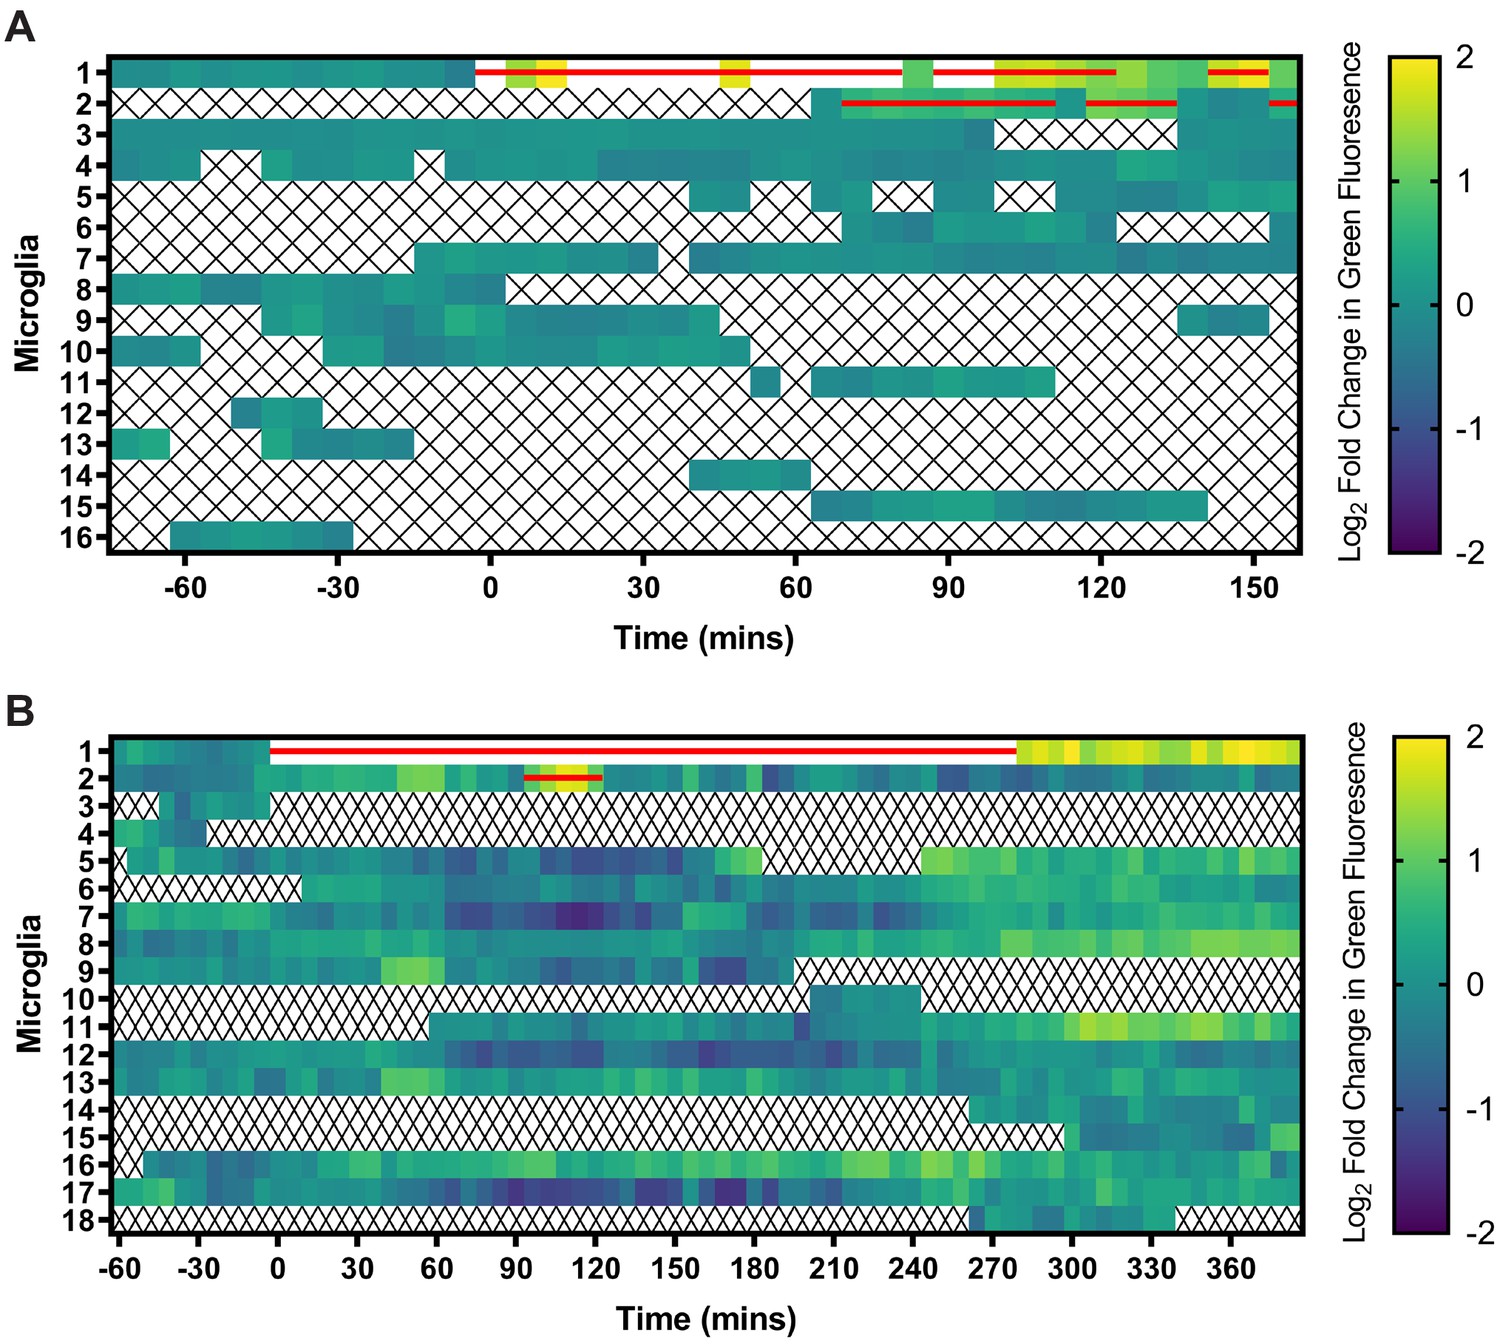
Green fluorescence in microglial cells increases in real-time following interaction with pHtdGFP-labeled axons.
Population level visualization of green fluorescence changes in the microglial cells during real-time imaging sessions. Log2 normalized fluorescence values of individual microglial cells are illustrated on each row. White regions indicate log2 fold changes in green fluorescence greater than 2. The red bar signifies timepoints when the microglial cell overlapped spatially with the pHtdGFP-labeled axon. X symbols represent timepoints when the microglial cell was outside of the imaging field. (A) This heatmap analyses the fluorescence changes in microglial cells in the imaging session shown in Video 4A. Microglia #1 is the interacting microglial cell highlighted in the video. (B) This heatmap analyses the fluorescence changes in microglial cells in the imaging session shown in Video 4B. Microglia #1 is the interacting microglial cell highlighted in the video.
-
Figure 2—figure supplement 1—source data 1
Fluorescence changes in microglial cells in time lapse imaging experiments from Figure 2—figure supplement 1.
- https://cdn.elifesciences.org/articles/62167/elife-62167-fig2-figsupp1-data1-v1.xlsx
Figure 3 with 2 supplements
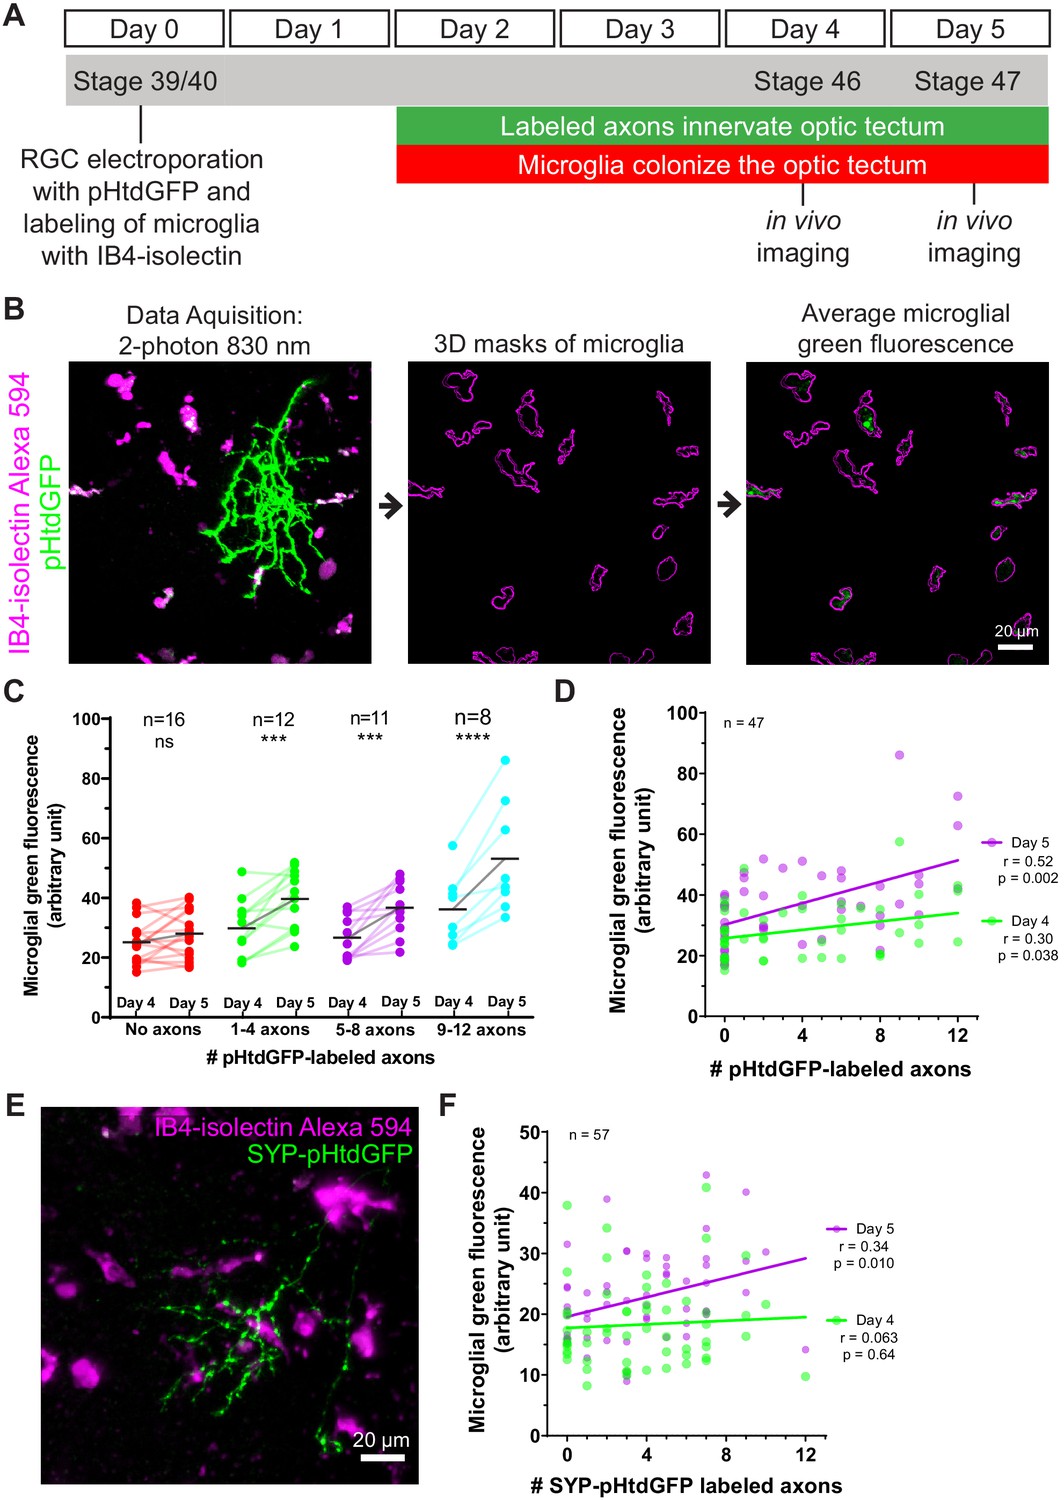
Microglia accumulate green fluorescence label from axons expressing pHtdGFP or SYP-pHtdGFP.
(A) Timeline of trogocytosis assay. Axons were labeled with pH-stable GFP (pHtdGFP). 2-photon imaging was performed on day 4 and day 5 post-labeling. (B) Measurement of green fluorescence signal from microglia. pHtdGFP-labeled axons (green) were imaged concurrently with microglia (magenta). 3D microglia ROIs were automatically generated (magenta outlines). The average microglial green fluorescence was quantified from the population of microglia sampled in the z-stack. (C) Presence of pHtdGFP-labeled axons in the optic tectum increases microglial green fluorescence between day 4 and day 5. Two-way RM ANOVA interaction F(3,43) = 6.14, p=0.0014. Sidak’s multiple comparison test ***p<0.001, ****p<0.0001. (D) Microglial green fluorescence weakly correlates with the number of pHtdGFP-labeled axons in the optic tectum on day 4 (n = 47, Pearson’s r = 0.30, p=0.038) and moderately correlates on day 5 (n = 47, Pearson’s r = 0.52, p=0.0002). The same dataset is analyzed in C. (E) SYP-pHtdGFP fusion protein localizes pHtdGFP to presynaptic puncta. (F) Microglial green fluorescence does not significantly correlate with the number of SYP-pHtdGFP-labeled axons in the optic tectum on day 4 (n = 57, Pearson’s r = 0.063, p=0.64), and weakly correlates on day 5 (n = 57, Pearson’s r = 0.34, p=0.010).
-
Figure 3—source data 1
Mean microglial-associated green fluorescence as a function of axon number measured over 24 hr.
- https://cdn.elifesciences.org/articles/62167/elife-62167-fig3-data1-v1.xlsx
Figure 3—figure supplement 1
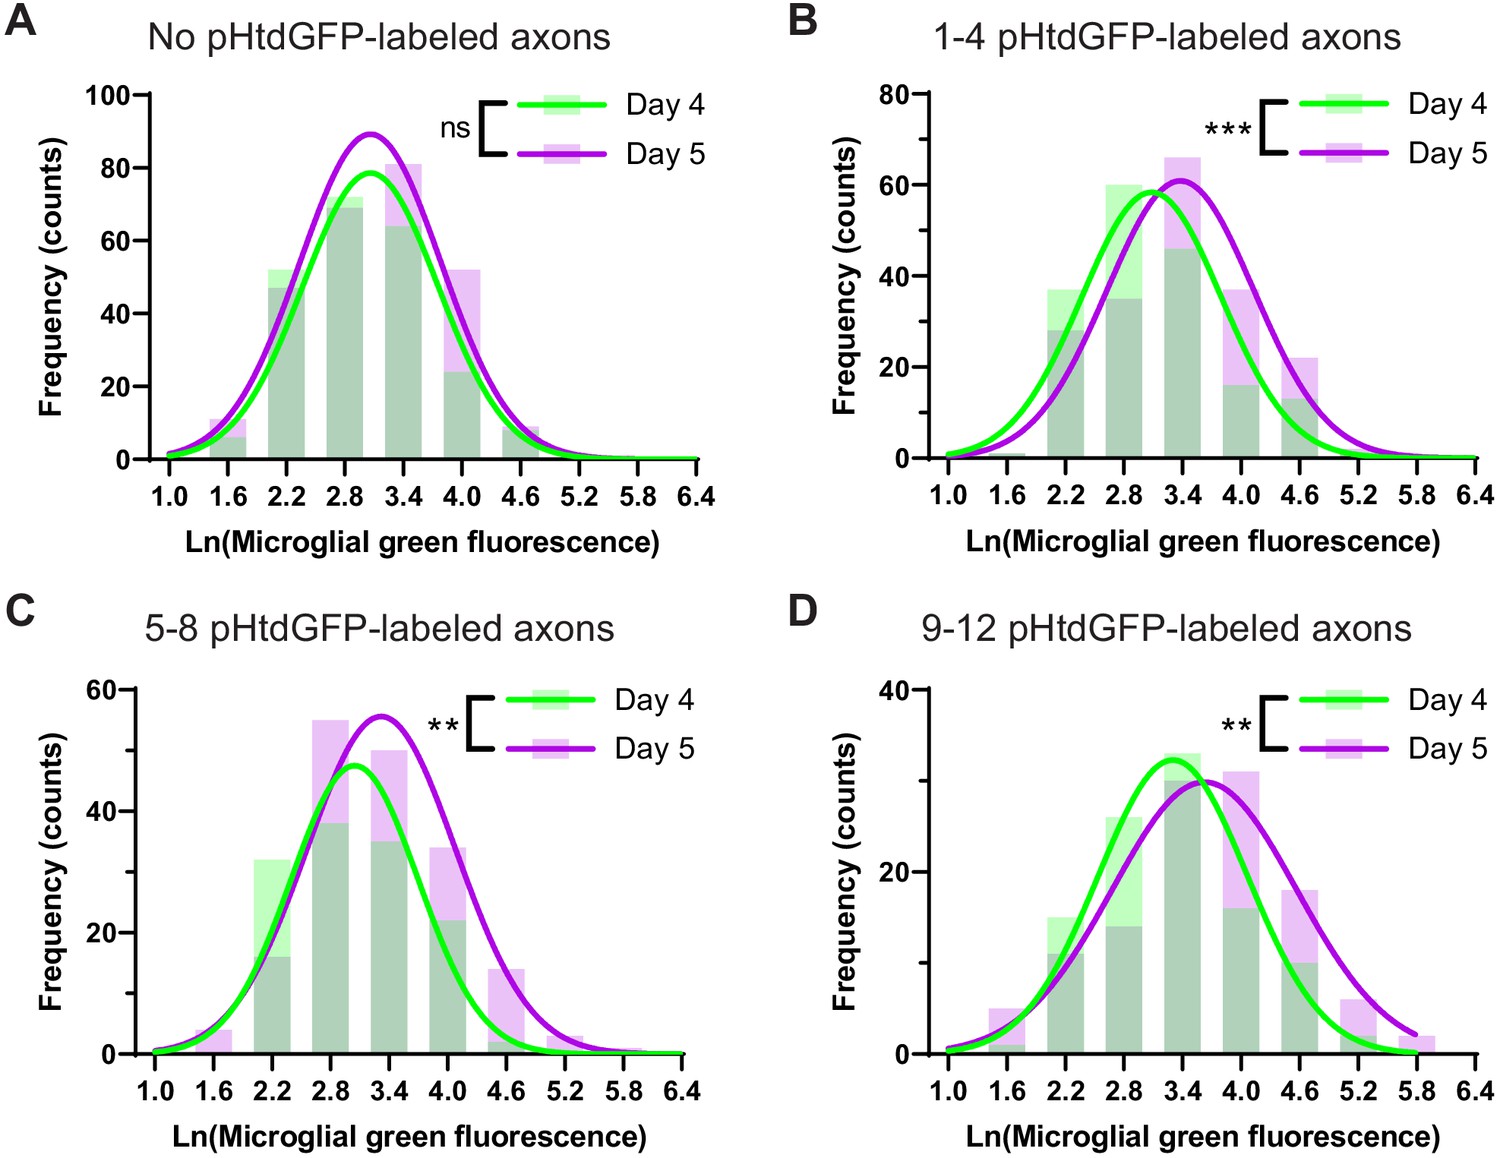
The presence of pHtdGFP-labeled axons significantly increases microglial green fluorescence between day 4 and day 5.
Green fluorescence values from individual microglial cells in the dataset analyzed in Figure 3C and D were pooled to produce frequency histograms (bars). Best fits of frequency distributions (lines) were obtained by nonlinear Poisson regression. (A) In animals with no pHtdGFP-labeled axons, the best-fit mean on day 4 (3.0) was not significantly different from the best-fit mean on day 5 (3.1). Likelihood-ratio test, p=0.063. (B) In animals with 1–4 pHtdGFP-labeled axons, the best-fit mean on day 4 (3.1) was significantly different from the best-fit mean on day 5 (3.4). Likelihood-ratio test, p=0.0001. (C) In animals with 5–8 pHtdGFP-labeled axons, the best-fit mean on day 4 (3.0) was significantly different from the best-fit mean on day 5 (3.3). Likelihood-ratio test, p=0.0009. (D) In animals with 9–12 pHtdGFP-labeled axons, the best-fit mean on day 4 (3.3) was significantly different from the best-fit mean on day 5 (3.6). Likelihood-ratio test, p=0.0059.
-
Figure 3—figure supplement 1—source data 1
Histograms of microglial-associated green fluorescence as a function of axon number measured over 24 hr from Figure 3—figure supplement 1.
- https://cdn.elifesciences.org/articles/62167/elife-62167-fig3-figsupp1-data1-v1.xlsx
Figure 3—figure supplement 2
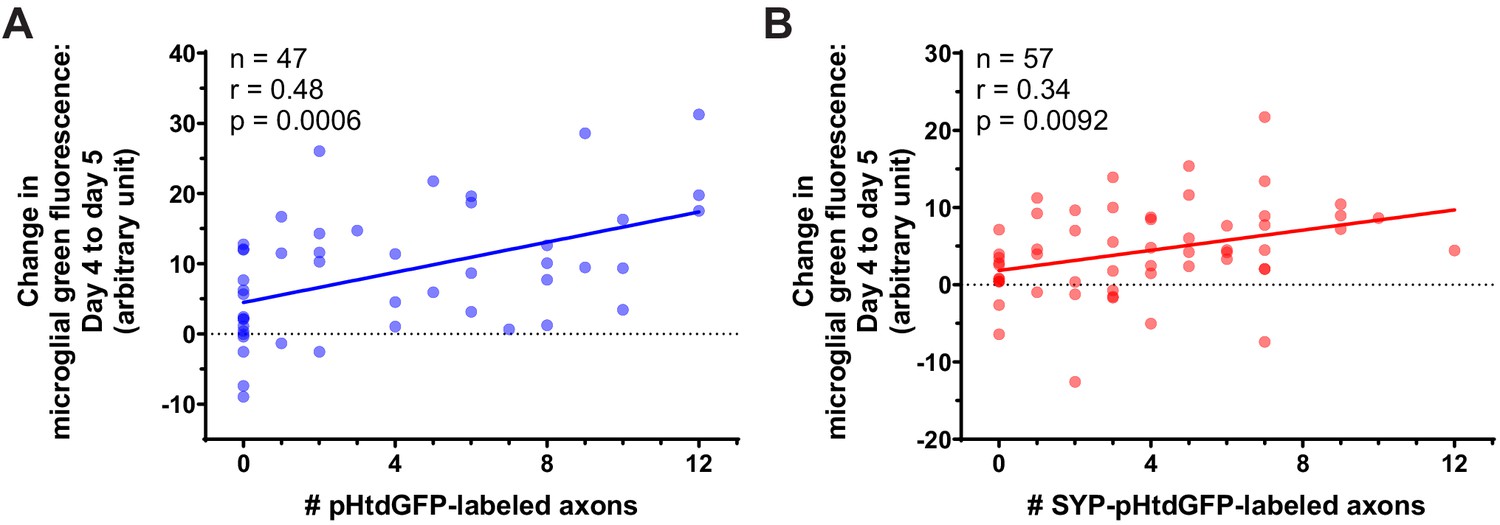
Correlation between the change in microglial green fluorescence from day 4 to day 5 and the number of pHtdGFP-labeled and SYP-pHtdGFP-labeled axons.
(A) The change in microglial green fluorescence from day 4 to day 5 post-labeling correlates with the number of pHtdGFP-labeled axons in the optic tectum. The same dataset is analyzed in Figure 3C and Figure 3D. (n = 47, Pearson’s r = 0.48, p=0.0006). (B) The change in microglial green fluorescence from day 4 to day 5 post-labeling correlates with the number of SYP-pHtdGFP-labeled axons in the optic tectum (n = 57, Pearson’s r = 0.34, p=0.0092). The same dataset is analyzed in Figure 3F.
Figure 4
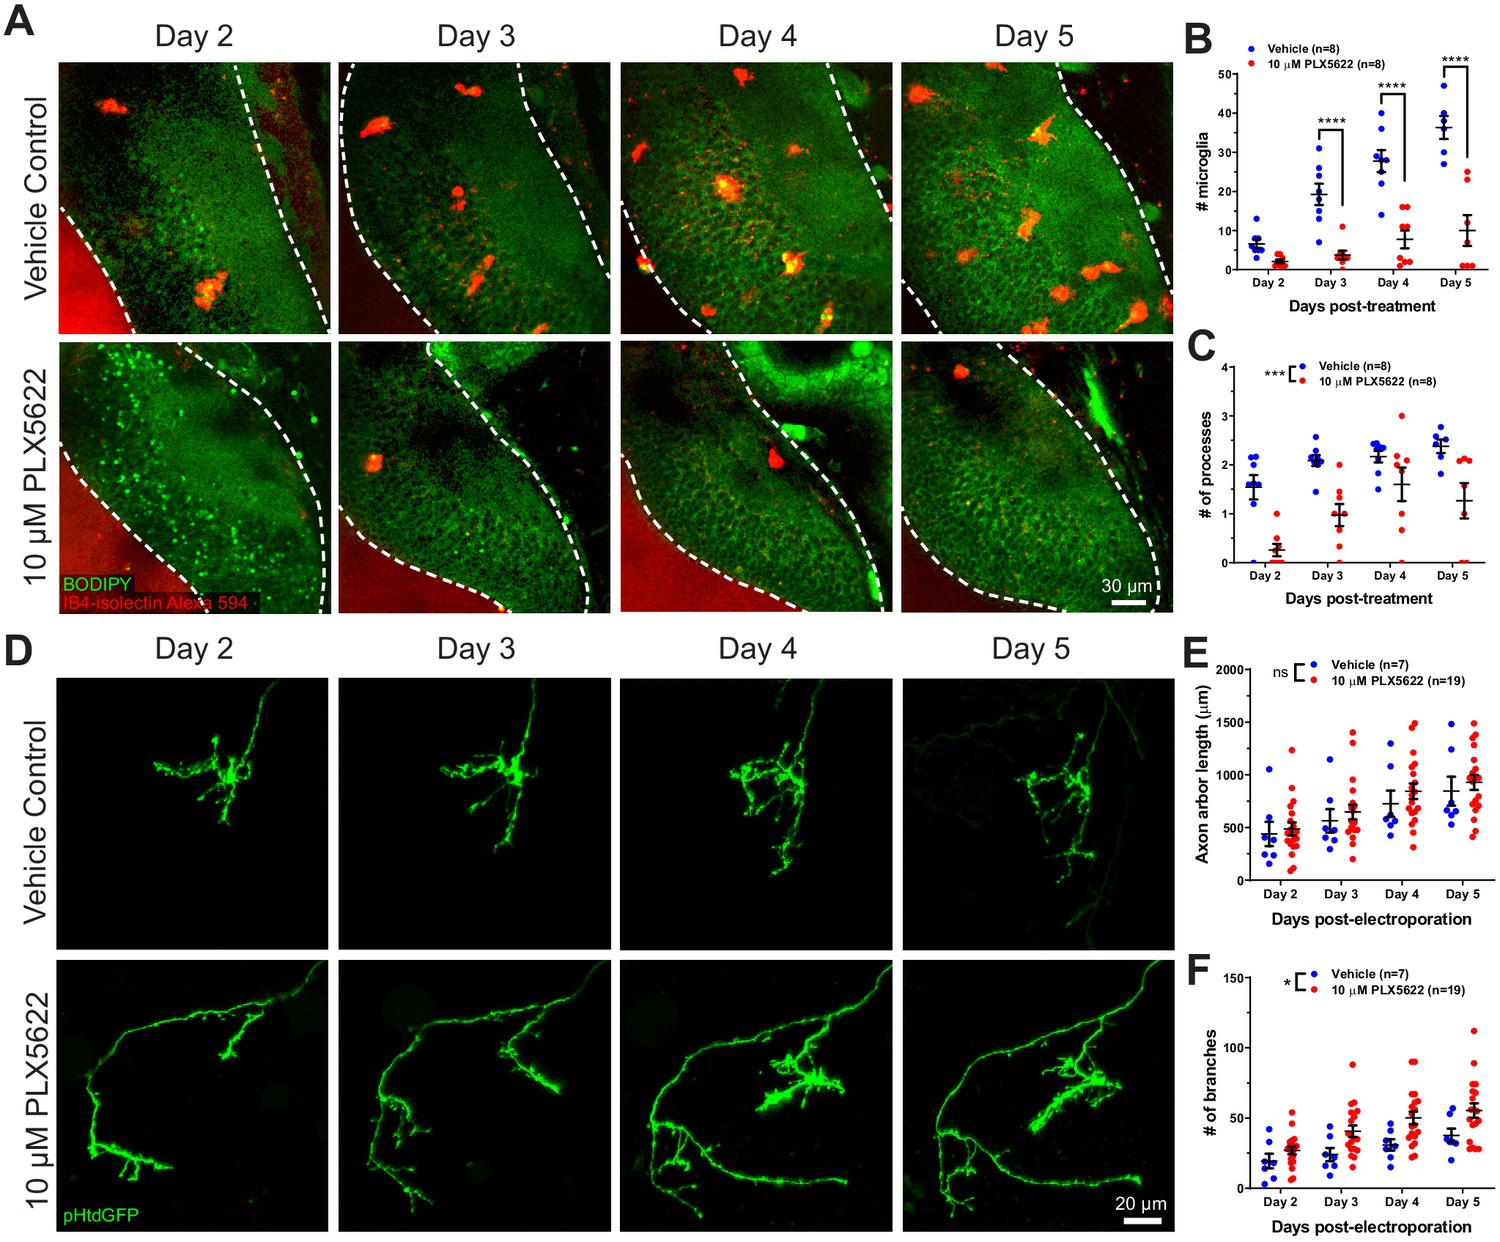
CSF1R antagonism depletes microglia from the optic tectum and increases axon arbor branch number.
(A) Animals were treated with vehicle or 10 μM PLX5622. Brain structures and microglia were labeled using CellTracker Green BODIPY (green) and IB4-isolectin (red), respectively. The white dotted line indicates the border of the optic tectum. Single optical sections are shown. (B) PX5622 depletes microglia in the optic tectum. Mixed-effects REML model interaction F(3,39) = 14.23, p<0.0001. Sidak’s multiple comparison post-hoc test ****p<0.0001. Data are shown as mean ± SEM. (C) PLX5622 reduces the number of processes per microglia. Mixed-effects REML model main effect F(1,14)=18.42, ***p<0.001. Data are shown as mean ± SEM. (D) Monitoring of individual RGC axons in vehicle control and PLX5622-treated animals. (E) Microglial depletion with PLX5622 did not affect axon arbor length. Two-way RM ANOVA main effect F(1,24)=0.4141, p=0.53. Data are shown as mean ± SEM. (F) Microglial depletion with PLX5622 increased axon branch number. Two-way RM ANOVA main effect F(1,24)=5.581, p=0.027. Data are shown as mean ± SEM.
-
Figure 4—source data 1
Microglia and axon morphometric properties from time lapse imaging over 4 days.
- https://cdn.elifesciences.org/articles/62167/elife-62167-fig4-data1-v1.xlsx
Figure 5 with 1 supplement
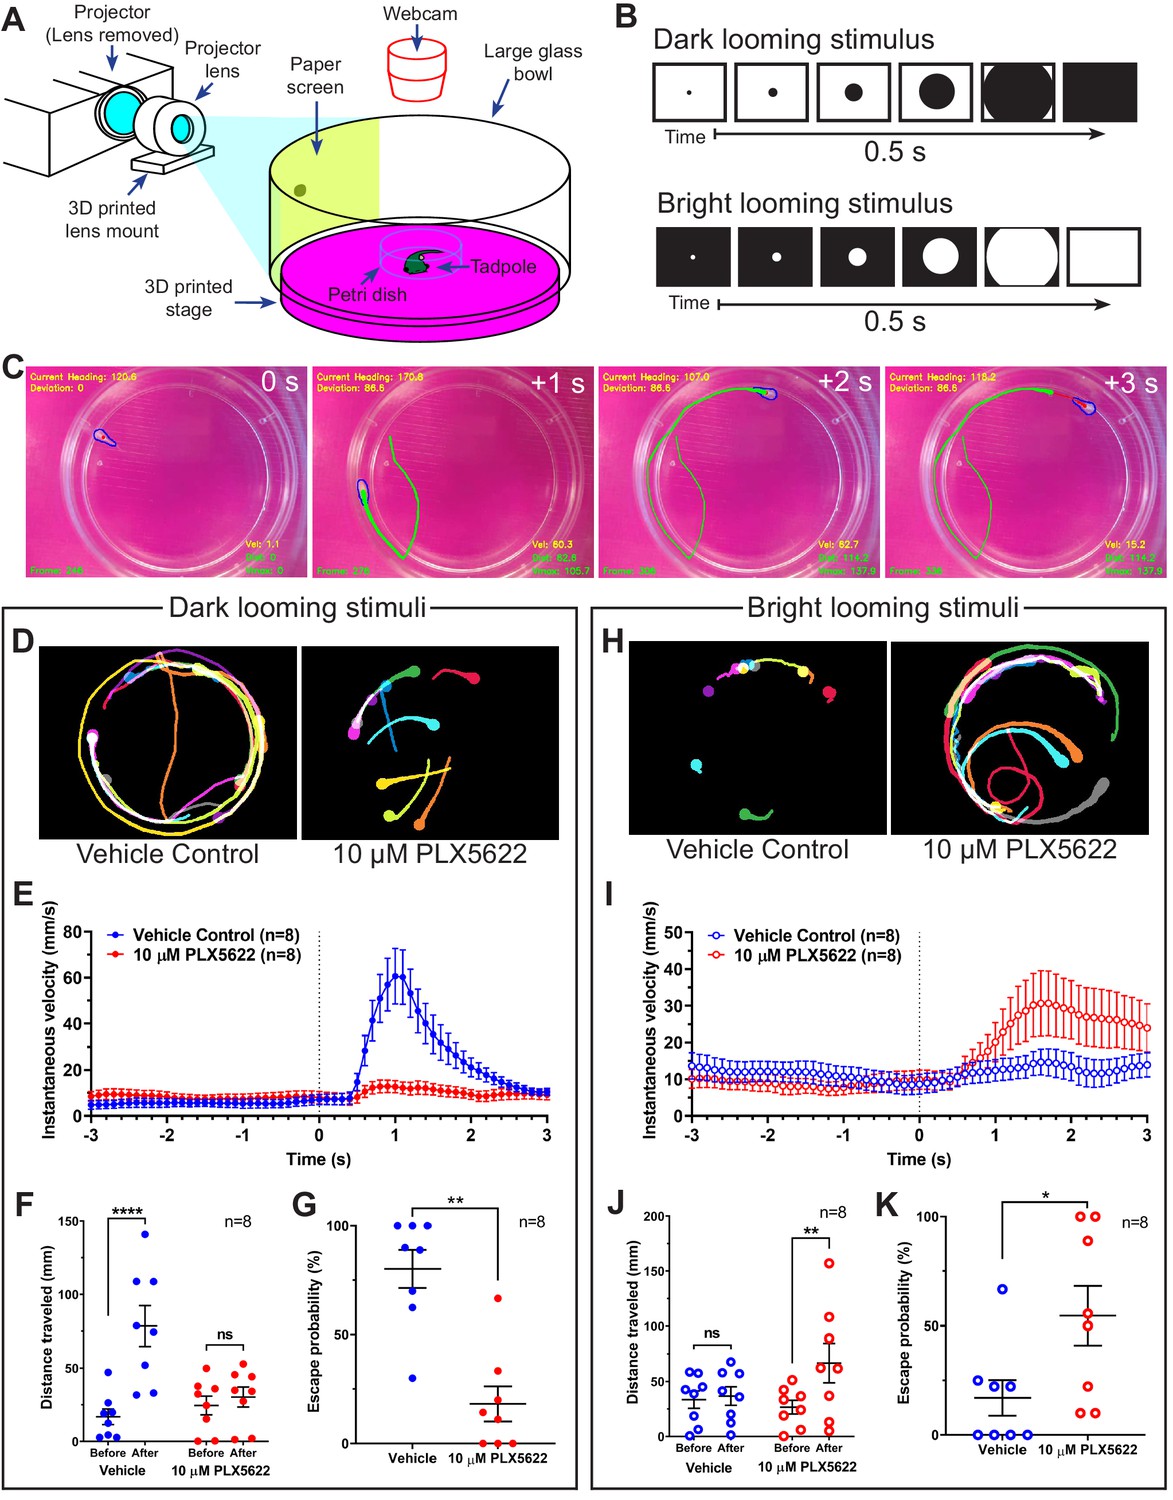
Microglial depletion reverses the expected behavioral response to both dark and bright looming stimuli.
(A) Schematic of a looming behavioral task to assess visuomotor responses in Xenopus laevis tadpoles. Stage 47 animals were presented looming stimuli and free-swimming escape responses were recorded. (B) Exponentially expanding dark and bright circles were presented as looming stimuli. (C) Representative response to dark looming stimulus (presented at 0 s) in a vehicle-treated animal. A contrail is drawn from 0 to 2 s post-stimulus. (D) Representative contrails of the escape responses to dark looming stimuli in a single animal (10 trials). (E) After the dark looming stimulus is presented (0 s), vehicle-treated animals (blue) increase in velocity, whereas microglia-depleted animals (red) do not. n = 8. Data are shown as mean ± SEM. (F) Presentation of dark looming stimuli increases distance traveled over 3 s in vehicle-treated animals (blue) but not microglia-depleted animals (red). 2-way RM ANOVA interaction F(1,14) = 15.82, p=0.0014. Sidak’s multiple comparisons test ****p<0.0001. Data are shown as mean ± SEM. (G) Microglia depletion reduces the escape probability to dark looming stimuli. Mann-Whitney test **p<0.01, n = 8. Data are shown as mean ± SEM. (H) Representative contrails to bright looming stimuli. (I) After the bright looming stimulus is presented (0 s), microglia-depleted animals (red) increase in velocity, whereas vehicle-treated animals (blue) do not. n = 8. Data are shown as mean ± SEM. (J) Presentation of bright looming stimuli increases distance traveled over 3 s in microglia-depleted animals (red) but not vehicle-treated animals (blue). Two-way RM ANOVA interaction F(1,14) = 5.291, p=0.037. Sidak’s multiple comparisons test **p<0.01. Data are shown as mean ± SEM. (K) Microglia depletion increases the escape probability to bright looming stimuli. Mann-Whitney test *p<0.05, n = 8. Data are shown as mean ± SEM.
-
Figure 5—source data 1
Effects of microglial depletion on escape behavior induced by looming stimuli.
- https://cdn.elifesciences.org/articles/62167/elife-62167-fig5-data1-v1.xlsx
Figure 5—figure supplement 1
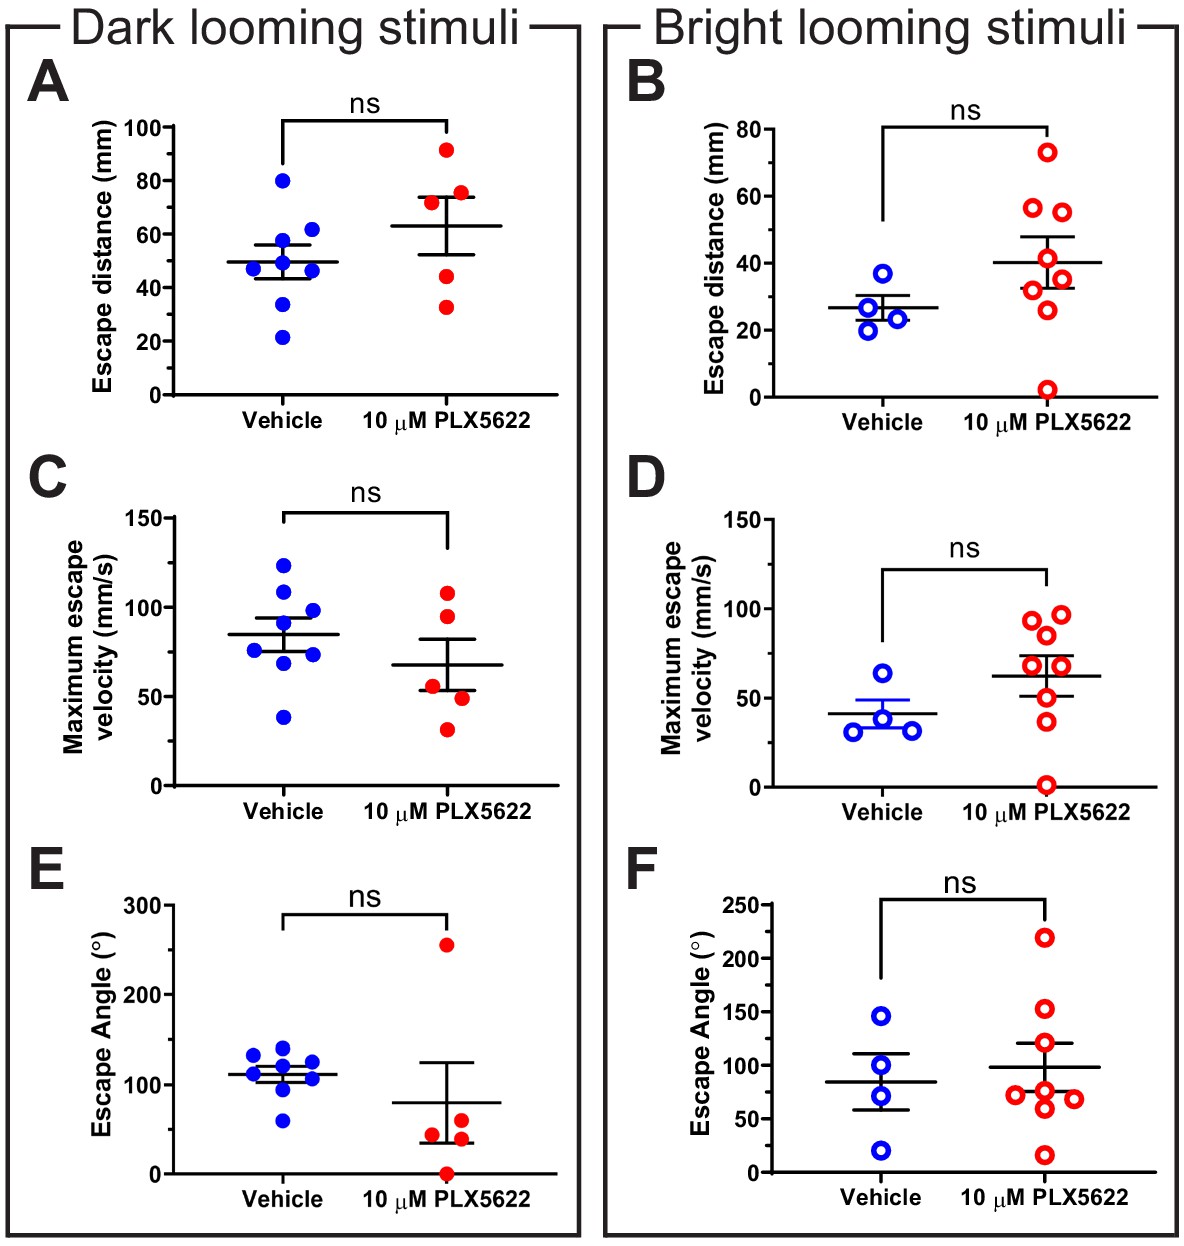
Motor characteristics of escape behavior are not significantly altered by PLX5622-induced microglial depletion.
A-F analyze all trials where defensive behavior was exhibited to looming stimuli. Data was collected from eight animals per group. Data are shown as mean ± SEM. (A) Microglial depletion did not significantly alter escape distance to dark looming stimuli. Unpaired t-test p=0.27. (B) Microglial depletion did not significantly alter escape distance to bright looming stimuli. Welch’s t-test p=0.15. (C) Microglial depletion did not significantly alter maximum escape velocity to dark looming stimuli. Unpaired t-test p=0.32. (D) Microglial depletion did not significantly alter maximum escape velocity to bright looming stimuli. Welch’s t-test p=0.15. (E) Microglial depletion did not significantly alter escape angle to dark looming stimuli. Welch’s t-test p=0.52. (F) Microglial depletion did not significantly alter escape angle to bright looming stimuli. Welch’s t-test p=0.71.
Figure 6
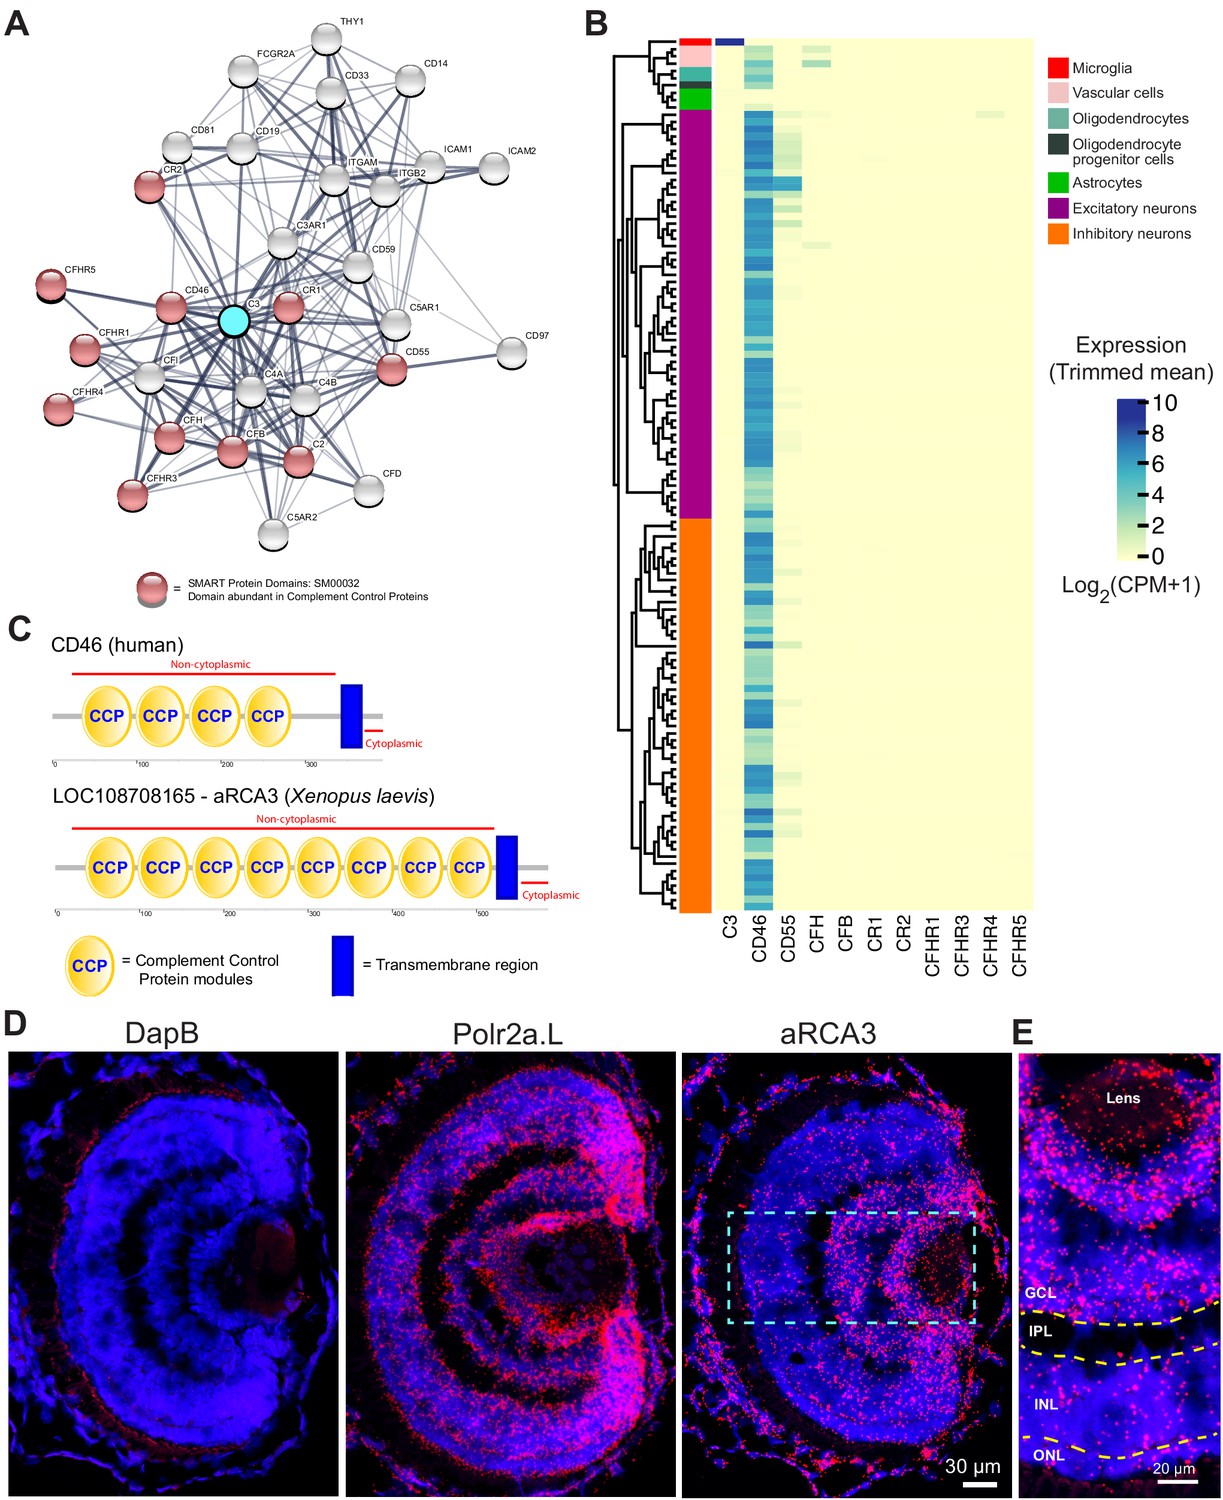
Identification of a neuronally expressed membrane-bound complement inhibitory protein, amphibian regulator of complement activation 3 (aRCA3), the predicted homolog of human CD46.
(A) Complement C3 was queried on the STRING Protein-Protein Association Network and the top 30 interaction partners are displayed. Red nodes represent proteins which contain complement control domains that inhibit complement activity. Line thickness indicates the strength of data supporting protein interaction. (B) Complement inhibitory proteins identified by STRING were screened for neuronal expression in the Allen Brain Map human cortical transcriptomics dataset. Cell type taxonomy and hierarchical clustering was determined according to previous analysis (Hodge et al., 2019). Only CD46 is highly expressed by neurons. Heat map color scale denotes log two expression levels as represented by trimmed mean (25–75%). CPM = counts per million. (C) Protein architecture of CD46 and the most similar Xenopus laevis homolog (aRCA3). Both human CD46 and Xenopus laevis aRCA3 are type I transmembrane proteins, with a non-cytoplasmic region that contains many complement control protein modules, and a transmembrane anchor near the C-terminus. (D) Fluorescent RNAscope in situ hybridization on retina sections shows that aRCA3 is endogenously expressed in the retina. Negative control probe DapB was not detected in the retina. Housekeeping gene Polr2a.L was expressed ubiquitously. (E) High magnification of the highlighted region in Figure 5D. aRCA3 is highly expressed in the GCL, and is present at lower levels in the INL and ONL. GCL = Ganglion Cell Layer; IPL = Inner Plexiform Layer; INL = Inner Nuclear Layer; ONL = Outer Nuclear Layer.
-
Figure 6—source data 1
Human cell type expression profiles from the Allen Human Brain database for probable complement inhibitory proteins identified by STRING.
- https://cdn.elifesciences.org/articles/62167/elife-62167-fig6-data1-v1.xlsx
Figure 7 with 1 supplement

RGC overexpression of synapse-associated aRCA3 inhibits microglial trogocytosis and increases axon arborization.
(A) An aRCA3-mCherry fusion protein was co-expressed with SYP-pHtdGFP in RGC axons. (B) Representative RGC axon expressing aRCA3-mCherry and SYP-pHtdGFP. SYP-pHtdGFP is concentrated at synaptic puncta. aRCA3-mCherry colocalizes with SYP-pHtdGFP. (C) Colocalization analysis of the axon shown in B. Scatterplot of pixel intensities shows a high degree of association between aRCA3-mCherry and SYP-pHtdGFP. After applying Costes threshold, Pearson’s r = 0.90. (D) Microglial green fluorescence is not significantly correlated with the number of pHtdGFP-labeled axons in the optic tectum on day 4 (n = 40, Pearson’s r = 0.23, p=0.16), and moderately correlated on day 5 (n = 40, Pearson’s r = 0.56, p=0.0002). (E) When aRCA3 is overexpressed, microglial green fluorescence is not significantly correlated with the number of pHtdGFP-labeled axons in the optic tectum on either day 4 (n = 41, Pearson’s r = 0.019, p=0.91) or on day 5 (n = 41, Pearson’s r = 0.017, p=0.92). (F) Individual control and aRCA3 overexpressing RGC axons were imaged over several days. (G) aRCA3 overexpression increases axon arbor length. Two-way RM ANOVA interaction F(3,102) = 5.43, p=0.0017. Sidak’s multiple comparison test *p<0.05, **p<0.01. Data are shown as mean ± SEM. (H) aRCA3 overexpression increases axon branch number. Two-way RM ANOVA interaction F(3,102) = 4.73, p=0.0039. Sidak’s multiple comparison test **p<0.01, ***p<0.001, ****p<0.0001. Data are shown as mean ± SEM.
-
Figure 7—source data 1
Colocalization analysis for aRCA3-mCherry and SYP-pHtdGFP.
- https://cdn.elifesciences.org/articles/62167/elife-62167-fig7-data1-v1.xlsx
-
Figure 7—source data 2
Changes in green fluorescence associated with microglia and axonal morphometric analysis comparing control and aRCA3 overexpressing axons.
- https://cdn.elifesciences.org/articles/62167/elife-62167-fig7-data2-v1.xlsx
Figure 7—figure supplement 1
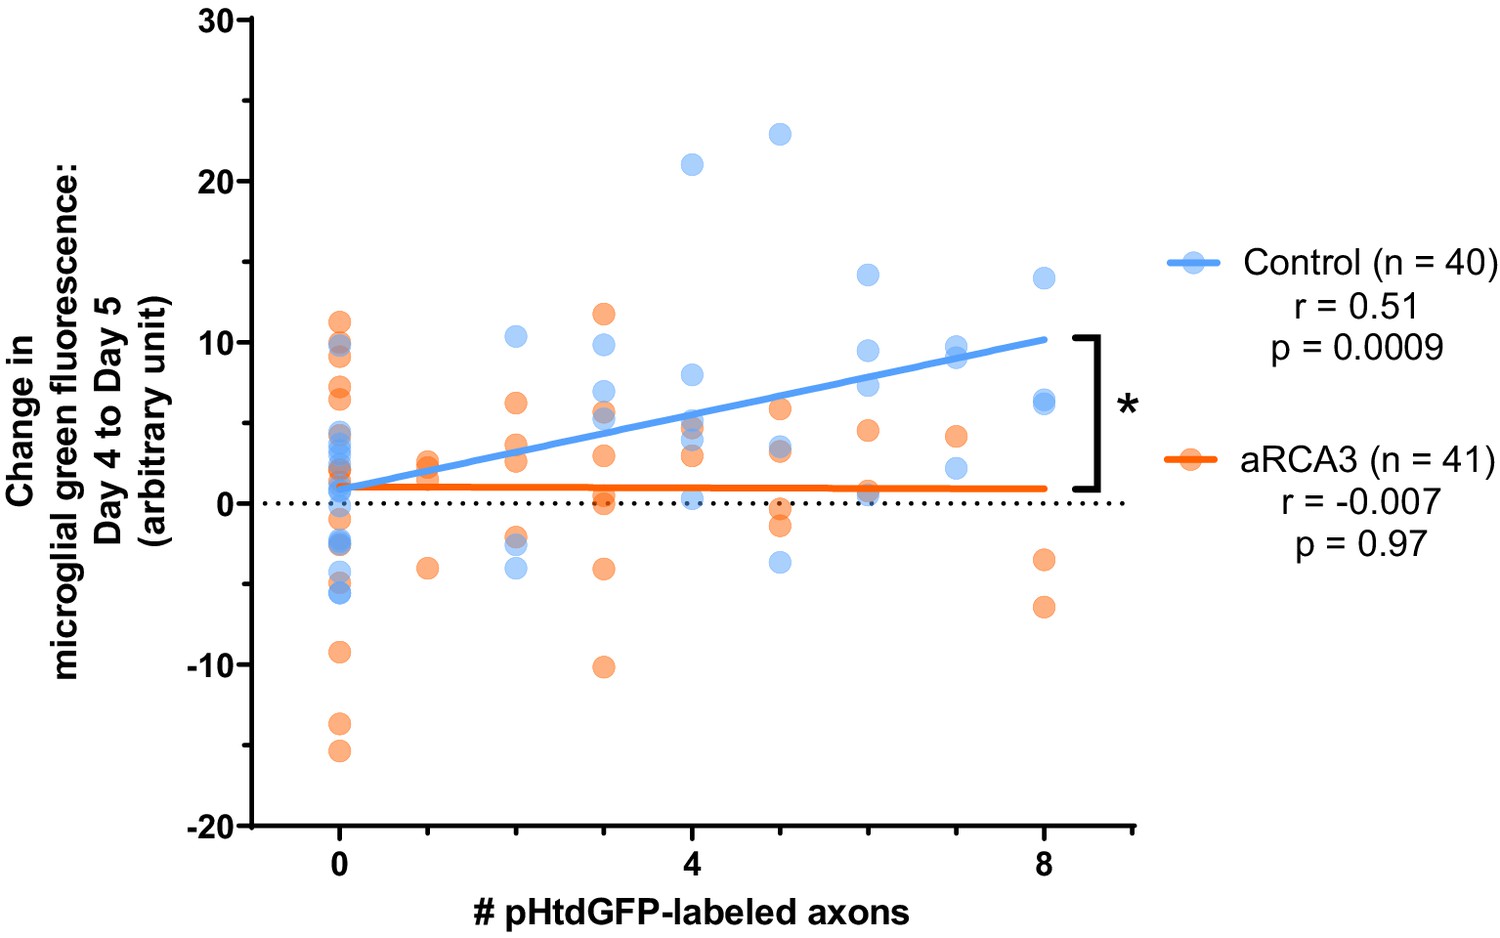
Correlation between the change in microglial green fluorescence from day 4 to day 5 and the number of pHtdGFP-labeled axons with and without aRCA3 overexpression.
Overexpression of aRCA3 significantly reduced the correlation coefficient between the change in microglial green fluorescence from day 4 to day 5 and the number of pHtdGFP-labeled axons in the optic tectum. Fisher’s z transformation *p=0.015. Control correlation (n = 40, Pearson r = 0.51, p=0.0009). aRCA3 overexpression correlation (n = 41, Pearson’s r = −0.007, p=0.97). The same datasets are shown in Figure 7D and Figure 7E.
Figure 8

Expressing VAMP2-C3 fusion protein in RGC neurons reduces axon arbor size and branch number.
(A) Complement C3 was fused to the C-terminus of VAMP2 to create a complement enhancing molecule which is targeted to the axon surface and synapses. (B) Axons from control, VAMP2-C3 expressing, and VAMP2 overexpressing RGC neurons were imaged over several days. (C) Expression of VAMP2-C3 reduces RGC axon arbor length compared to control and VAMP2 overexpression. Two-way RM ANOVA interaction F(6,75)=3.48, p=0.0044. Sidak’s multiple comparison test *p<0.05, **p<0.01, ***p<0.001. Data are shown as mean ± SEM. (D) Expression of VAMP2-C3 reduces RGC branch number compared to control and VAMP2 overexpression. Two-way RM ANOVA interaction F(6,75)=4.15, p=0.0012. Sidak’s multiple comparison test *p<0.05, ***p<0.001, ****p<0.0001. Data are shown as mean ± SEM.
-
Figure 8—source data 1
Morphometric analyses comparing control, VAMP2-C3 and VAMP2 expressing axons over 4 days.
- https://cdn.elifesciences.org/articles/62167/elife-62167-fig8-data1-v1.xlsx
Figure 9

The complement system and microglia regulate axonal pruning at the single axon level.
(A) Inhibiting complement activity through overexpression of a membrane-bound complement inhibitory molecule results in impaired axonal pruning; conversely, increasing complement activity through expression of a membrane-bound complement enhancing molecule results in excessive axonal pruning. (B) During normal development, microglia actively trogocytose and prune axons. Disrupting microglial function via microglial depletion increases axonal arborization and also disrupts the proper response to dark and bright looming stimuli.
Videos
Video 1
IB4-isolectin-labeled cells in Xenopus laevis tadpoles are morphologically dynamic and highly mobile.
(A) IB4-isolectin cells are highly mobile. Timestamp = HH:MM. (B) IB4-isolectin labeled cells have a dynamic morphology, switching back and forth between ameboid-like and primitive ramified-like morphologies.
Video 2
Response of IB4-isolectin-labeled cells to injury.
IB4-isolectin-labeled cells respond to tissue injury by mobilization to the injury site and phagocytosis of injured tissues. Also shown in Figure 1D. Timestamp = HH:MM.
Video 3
Microglia surveil the tectal neuropil in developing Xenopus laevis.
(A) Microglia associate with the tectal neuropil in Xenopus laevis. Timestamp = HH:MM. (B) The neuropil does not exclude microglia. Microglia can mobilize into the neuropil region from the cell body layer and can freely move through the neuropil region. Timestamp = HH:MM. (C) Microglia surveil the tectal neuropil by extending processes into the neuropil from the cell body layer. Timestamp = HH:MM.
Video 4
In vivo real-time trogocytosis in Xenopus laevis tadpoles imaged by 2-photon microscopy.
(A) A microglial cell increases in green fluorescence in real-time after an interaction with a pHtdGFP-labeled axon. The colocalization of green and red is colorized as white. Timestamp = HH:MM. (B) Another example of a microglial cell increasing in green fluorescence following an interaction with a pHtdGFP-labeled axon. This example is shown in Figure 2E. Timestamp = HH:MM.
Video 5
Representative responses to dark looming stimuli in control and microglia-depleted animals.
(A) Representative response to dark looming stimuli in a vehicle control animal. (B) Representative response to dark looming stimuli in a microglia-depleted animal.
Video 6
Representative responses to bright looming stimuli in control and microglia-depleted animals.
(A) Representative response to bright looming stimuli in a vehicle control animal. (B) Representative response to bright looming stimuli in a microglia-depleted animal.
Video 7
Predicted tertiary protein structure of CD46 and aRCA3.
(A) The predicted tertiary protein structure of CD46. (B) The predicted tertiary protein structure of aRCA3.
Tables
Table 1
Top three most similar proteins to human CD46 in the Xenopus laevis genome.
| Protein name | Query coverage | Percent identity | E-value | |
|---|---|---|---|---|
| 1 | Amphibian Regulator of Complement Activation 3 (aRCA3) | 64% | 34.77% | three × 10−41 |
| 2 | Complement Receptor Type 2 | 70% | 31.77% | four × 10−35 |
| 3 | Complement Component 4 Binding Protein | 76% | 31.17% | four × 10−35 |
Key resources table
| Reagent type (species) or resource | Designation | Source or reference | Identifiers | Additional information |
|---|---|---|---|---|
| Gene (Xenopus laevis) | aRCA3 | NCBI | NCBI:XM_018246573.1 | |
| Gene (Xenopus laevis) | VAMP2 | Xenbase | Xenbase:vamp2.S | |
| Gene (Xenopus laevis) | C3 | Xenbase | Xenbase:c3.L | |
| Strain, strain background (Escherichia coli) | DH5α competent cells | Invitrogen | Cat#:18265017 | |
| Biological sample (Xenopus laevis) | Albino Xenopus laevis tadpoles | Nasco | RRID:XEP_Xla200 | |
| Recombinant DNA reagent | pEGFP-N1 | Clontech | Cat#: 6085–1 | |
| Recombinant DNA reagent | pFA6a pH-tdGFP | PMID:27324986 | RRID:Addgene_74322 | |
| Recombinant DNA reagent | pEF1α P2A-pHtdGFP | This paper | Available from Edward Ruthazer upon request | |
| Recombinant DNA reagent | SYP-GFP plasmid | PMID:16571768 | ||
| Recombinant DNA reagent | pEF1α SYP-pHtdGFP | This paper | Available from Edward Ruthazer upon request | |
| Recombinant DNA reagent | pEF1α aRCA3-Myc-P2A-pHtdGFP | This paper | Available from Edward Ruthazer upon request | |
| Recombinant DNA reagent | pEF1α aRCA3-mCherry-Myc-P2A-SYP-pHtdGFP | This paper | Available from Edward Ruthazer upon request | |
| Recombinant DNA reagent | pEF1α pHtdGFP-P2A-VAMP2 | This paper | Available from Edward Ruthazer upon request | |
| Recombinant DNA reagent | pEF1α pHtdGFP-P2A-Myc-VAMP2-C3 | This paper | Available from Edward Ruthazer upon request | |
| Sequenced-based reagent | RNAscope Probe against Xenopus laevis polr2a.L | Advanced Cell Diagnostics | RNAscope probe: Xl-polr2aL | |
| Sequenced-based reagent | RNAscope Probe against Xenopus laevis aRCA3 | Advanced Cell Diagnostics | RNAscope probe: Xl-LOC108708165 | |
| Commercial assay or kit | RNAscope Multiplex Fluorescent Reagent Kit v2 | Advanced Cell Diagnostics | Cat#:323136 | |
| Chemical compound, drug | PLX5622 | Plexxikon | N/A | |
| Chemical compound, drug | Polyethylene glycol 400 | Sigma | SKU:P3265 | |
| Chemical compound, drug | Poloxamer 407 | Sigma | SKU:16758 | |
| Chemical compound, drug | D-α-Tocopherol polyethylene glycol 1000 succinate | Sigma | SKU:57668 | |
| Chemical compound, drug | Isolectin GS-IB4 FromGriffonia simplicifolia, Alexa Fluor 594 Conjugate | Thermo Fisher Scientific | Cat#:I21413 | |
| Chemical compound, drug | CellTracker Green BODIPY | Thermo Fisher Scientific | Cat#:C2102 | |
| Software, algorithm | STRING v11.0 protein-protein association networks | PMID:30476243 | RRID:SCR_005223 | |
| Software, algorithm | SMART protein domain annotation resource 8.0 | PMID:29040681 | RRID:SCR_005026 | |
| Software, algorithm | Phobius transmembrane topology tool | PMID:17483518 | RRID:SCR_015643 | |
| Software, algorithm | PyMOL 2.4 | Schrödinger, LLC. | RRID:SCR_000305 | Schrödinger, LLC, 2020 |
| Software, algorithm | trRosetta | PMID:31896580 | ||
| Software, algorithm | ProBLM | PMID:25126110 | ||
| Software, algorithm | NetPhos 3.1 | PMID:15174133 | RRID:SCR_017975 | |
| Software, algorithm | R 4.0.0 | R Core Team | RRID:SCR_001905 | |
| Software, algorithm | RColorBrewer | Erich Neuwirth | RRID:SCR_016697 | |
| Software, algorithm | ComplexHeatmap | PMID:27207943 | RRID:SCR_017270 | |
| Software, algorithm | Bioconductor 3.11 | PMID:25633503 | RRID:SCR_006442 | |
| Software, algorithm | Serial Cloner 2.6.1 | SerialBasics | RRID:SCR_014513 | |
| Software, algorithm | Imaris 6 | Oxford Instruments | RRID:SCR_007370 | |
| Software, algorithm | Fluoview 5.0 | Olympus | RRID:SCR_014215 | |
| Software, algorithm | ThorImage LS | Thorlabs | ||
| Software, algorithm | Leica LAS X | Leica | RRID:SCR_013673 | |
| Software, algorithm | FIJI ImageJ | PMID:22743772 | RRID:SCR_002285 | Schindelin et al., 2012 |
| Software, algorithm | 3D Objects Counter plugin | PMID:17210054 | RRID:SCR_017066 | |
| Software, algorithm | 3D ROI Manager plugin | PMID:23681123 | RRID:SCR_017065 | |
| Software, algorithm | TrackMate plugin | PMID:27713081 | ||
| Software, algorithm | Descriptor-based series registration plugin | PMID:20508634 | ||
| Software, algorithm | 3D hybrid median filter plugin | Christopher Philip Mauer and Vytas Bindokas | ||
| Software, algorithm | ScatterJ plugin | PMID:25515182 | ||
| Software, algorithm | MATLAB | MathWorks | RRID:SCR_001622 | |
| Software, algorithm | CANDLE | PMID:22341767 | ||
| Software, algorithm | Graphpad Prism 9 | GraphPad Software | RRID:SCR_002798 | |
| Software, algorithm | Fisher r-to-z transformation calculator | VassarStats | RRID:SCR_010263 | |
| Software, algorithm | Cura 4 | Ultimaker | RRID:SCR_018898 | |
| Software, algorithm | TinkerCAD | Autodesk | ||
| Software, algorithm | Psychopy 3.0 | PMID:30734206 | RRID:SCR_006571 | |
| Software, algorithm | XenLoom (beta): Looming Stimulus Presentation and Tracking of Xenopus laevis tadpoles | This paper | github.com/tonykylim/XenLoom_beta; Lim, 2021; copy archived at swh:1:rev:b487791d1d91a5950eebfd1e7640e0c3db761cf5 | |
| Other | Allen Brain Map Human Multiple Cortical Areas SMART-seq data set | Allen Institute for Brain Science | ||
| Other | Estink 2000 lumens mini LED projector | Amazon.ca | ASIN#:B07F7RT9XZ | |
| Other | 96 white 20 lb bond copy paper | Staples.ca | Item#:380480 | |
| Other | Custom 3D printed mount for projector lens | This paper | http://www.thingiverse.com/thing:4335379 | |
| Other | Custom 3D printed stage for Xenopus laevis behavior | This paper | http://www.thingiverse.com/thing:4335395 | |
| Other | 8-inch soda lime 1500 ml culture dish | Carolina | Item#:741006 | |
| Other | 60 mm petri dish | Fisher Scientific Canada | Cat#:FB0875713A | |
| Other | PLA 1.75 mm 3D printing filament | iPrint-3D | Transparent purple | |
| Other | Logitech C920 webcam | Logitech | Model#:960–000764 | |
| Other | Anycubic i3 mega 3D printer | Amazon.ca | ASIN#:B07NY5T1LJ |
Additional files
-
Supplementary file 1
Table of all plasmids used and generated.
- https://cdn.elifesciences.org/articles/62167/elife-62167-supp1-v1.docx
-
Transparent reporting form
- https://cdn.elifesciences.org/articles/62167/elife-62167-transrepform-v1.docx
Download links
A two-part list of links to download the article, or parts of the article, in various formats.
Downloads (link to download the article as PDF)
Open citations (links to open the citations from this article in various online reference manager services)
Cite this article (links to download the citations from this article in formats compatible with various reference manager tools)
Microglial trogocytosis and the complement system regulate axonal pruning in vivo
eLife 10:e62167.
https://doi.org/10.7554/eLife.62167


