Iron derived from autophagy-mediated ferritin degradation induces cardiomyocyte death and heart failure in mice
- The School of Cardiovascular Medicine and Sciences, King’s College London British Heart Foundation Centre of Excellence, United Kingdom
- Department of Pharmacology, Faculty of Medicine, Osaka Medical College, Japan
- Department of Cardiovascular Medicine, Graduate School of Medicine, Osaka University, Japan
Figures
Figure 1 with 3 supplements
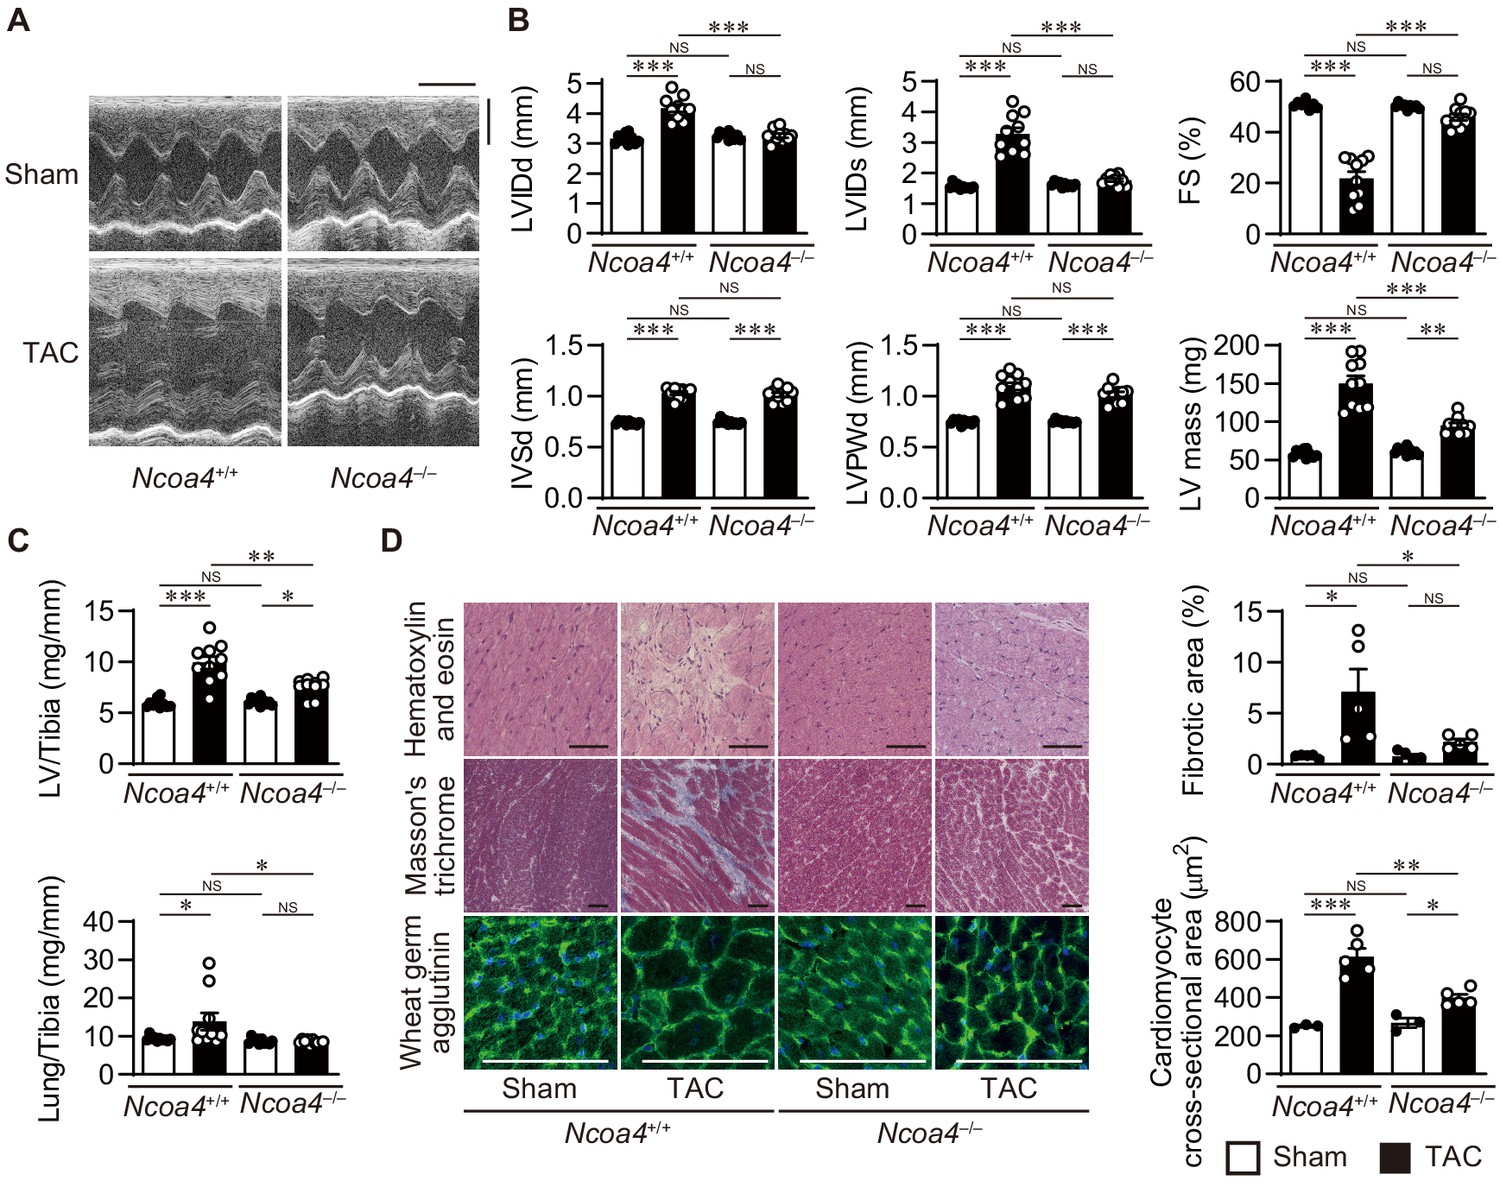
Cardiomyocyte-specific Ncoa4 ablation attenuated the development of pressure overload-induced heart failure.
The Ncoa4+/+ and Ncoa4–/– mice were subjected to pressure overload by transverse aortic constriction (TAC) and analyzed 4 weeks after the operation. (A) Representative images of transthoracic M-mode echocardiographic tracing. Scale bars, 0.1 s and 2 mm, respectively. (B) Echocardiographic parameters of the mice (n = 10 biologically independent samples). LVIDd and LVIDs, end-diastolic and end-systolic left ventricular (LV) internal dimensions; IVSd, end-diastolic interventricular septum thickness; LVPWd, end-diastolic LV posterior wall thickness; FS, fractional shortening. (C) Physiological parameters of the mice (n = 10 biologically independent samples). (D) Representative images of the hematoxylin-eosin-stained (upper), Masson’s trichrome-stained (middle), and wheat germ agglutinin-stained (lower) heart sections. Scale bar, 50 μm. The upper and lower right graphs show the ratio of the fibrotic area to whole heart section and the cross-sectional area of cardiomyocytes, respectively (n = 5 biologically independent samples). The data were evaluated by one-way analysis of variance (ANOVA), followed by Tukey–Kramer’s post hoc test. *p<0.05, **p<0.001, ***p<0.0001. NS, p>0.05. Exact p-values are provided in Supplementary file 1.
-
Figure 1—source data 1
Source data for Figure 1.
- https://cdn.elifesciences.org/articles/62174/elife-62174-fig1-data1-v1.xlsx
-
Figure 1—source data 2
Physiological and echocardiographic parameters in 8- to 10-week-old Ncoa4+/+ and Ncoa4–/– mice at baseline.
BP, blood pressure; TL, tibia length; LV, left ventricle; LVIDd, end-diastolic left ventricular internal dimension; LVIDs, end-systolic left ventricular internal dimension; IVSd, end-diastolic interventricular septum thickness; LVPWd, end-diastolic left ventricular posterior wall thickness; FS, fractional shortening. The data are the mean ± SEM. n indicates the number of biologically independent samples. The data were evaluated by unpaired, two-tailed Student’s t-test.
- https://cdn.elifesciences.org/articles/62174/elife-62174-fig1-data2-v1.docx
-
Figure 1—source data 3
Source data for data table provided in Figure 1—source data 2.
- https://cdn.elifesciences.org/articles/62174/elife-62174-fig1-data3-v1.xlsx
Figure 1—figure supplement 1
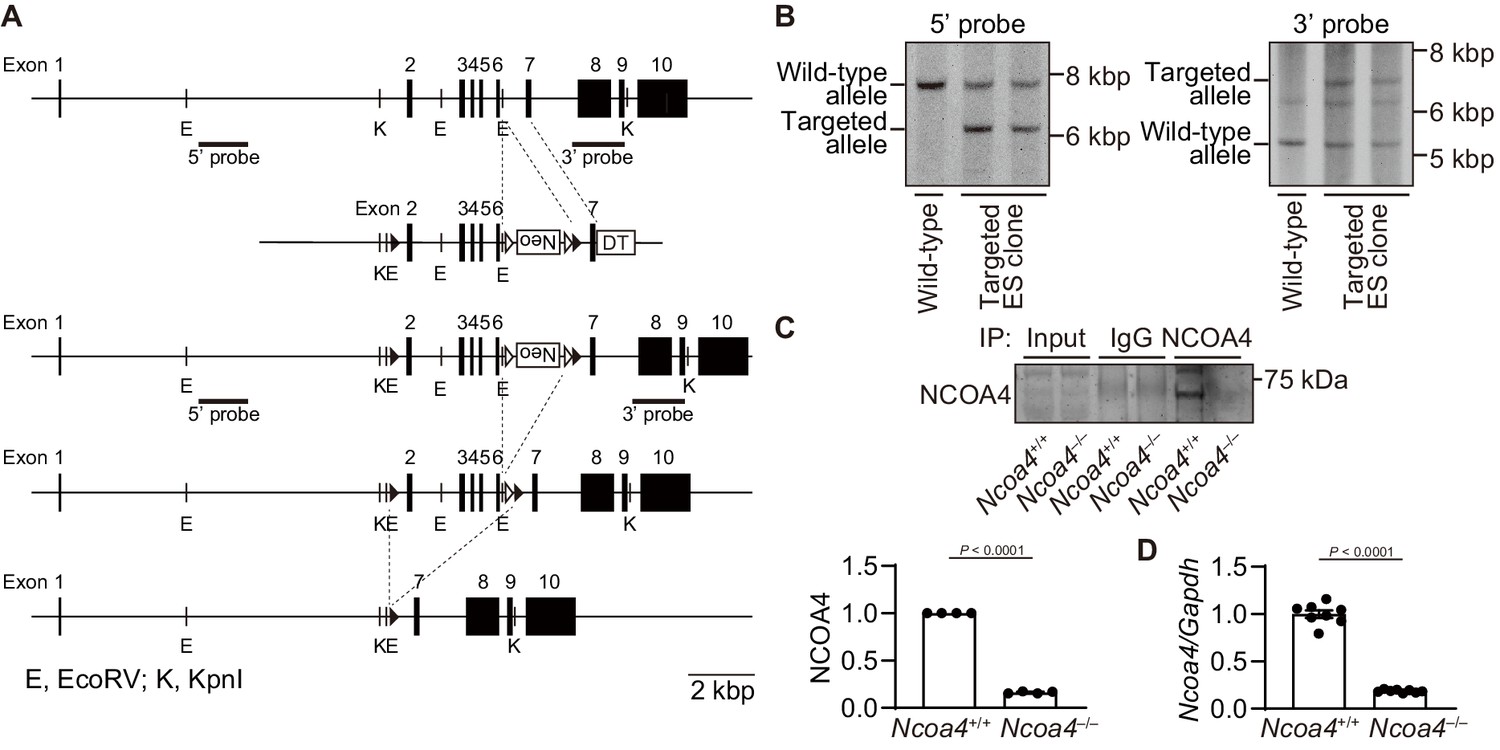
Generation of cardiomyocyte-specific nuclear receptor coactivator 4 (NCOA4)-deficient mice.
(A) Targeted modification of the Ncoa4 gene. Schematic structures of the wild-type genomic Ncoa4 sequence, the targeting construct, the targeted allele, the floxed allele after flippase recognition target site (FRT)-mediated neomycin-resistance gene (Neo) deletion, and the deleted allele after Cre-mediated recombination are indicated from top to bottom. The black and white arrowheads indicate loxP and FRT sites, respectively. The neomycin resistance gene (PGK-Neo cassette) was inserted between exon six and the downstream loxP site. The diphtheria toxin A (DT) gene was positioned at the 3’ end of the targeting construct for negative selection. The bar labelled as ‘probe’ corresponds to the sequence used for Southern blotting. The scale bar indicates two kbp. (B) Genomic analysis of embryonic stem (ES) cells. To identify homologous recombinants, genomic DNA extracted from ES cells was digested with EcoRV and analyzed by Southern blotting with the 5’ and 3’ probe, respectively. Wild-type and targeted allele respectively showed 7748 and 6,172 bp using the 5’ probe (left) and 5269 and 6,924 bp using the 3’ probe (right). The ES cells with Ncoa4-floxed allele were injected into blastocysts to obtain Ncoa4flox/ mice. (C) Protein expression levels of NCOA4 in Ncoa4+/+ and Ncoa4–/– hearts. Left ventricular homogenates from Ncoa4+/+ and Ncoa4–/– mice were immunoprecipitated with anti-NCOA4 antibody, followed by Western blotting with the antibody. Densitometric analysis is shown. (D) mRNA expression levels of Ncoa4. The average value of NCOA4 (C) or Ncoa4-to-Gapdh ratio (D) in Ncoa4+/+ was set equal to 1. The values are presented as the mean ± SEM of 4 mice for protein expression and eight mice for mRNA expression in each group. The data were evaluated by unpaired, two-tailed Student’s t-test.
-
Figure 1—figure supplement 1—source data 1
Source data for Figure 1—figure supplement 1.
- https://cdn.elifesciences.org/articles/62174/elife-62174-fig1-figsupp1-data1-v1.xlsx
Figure 1—figure supplement 2
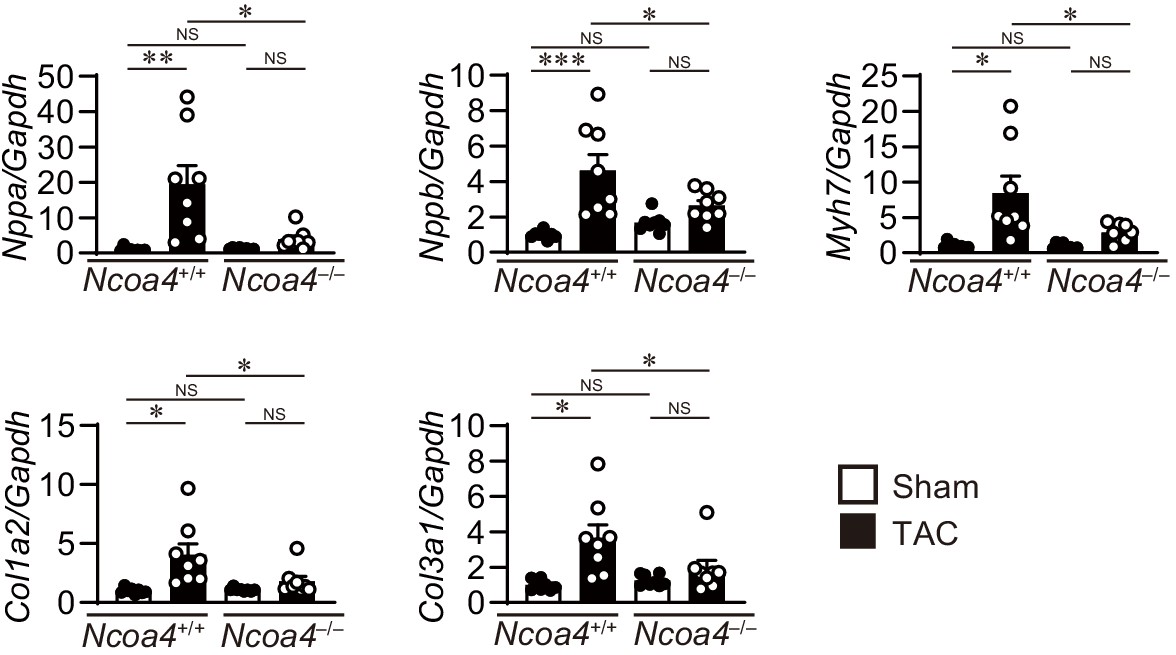
Cardiac remodeling markers in transverse aortic constriction (TAC)-operated Ncoa4–/– mice.
The Ncoa4+/+ and Ncoa4–/– mice were subjected to TAC. The levels of mRNA were analyzed 4 weeks after the operation (n = 8 biologically independent samples). Gapdh mRNA was used as the loading control. The values are presented as the mean ± SEM. The data were evaluated by one-way analysis of variance (ANOVA), followed by Tukey–Kramer’s post hoc test. *p<0.05, **p<0.001, ***p<0.0001. NS, p>0.05. Exact p-values are provided in Supplementary file 1.
-
Figure 1—figure supplement 2—source data 1
Source data for Figure 1—figure supplement 2.
- https://cdn.elifesciences.org/articles/62174/elife-62174-fig1-figsupp2-data1-v1.xlsx
Figure 1—figure supplement 3
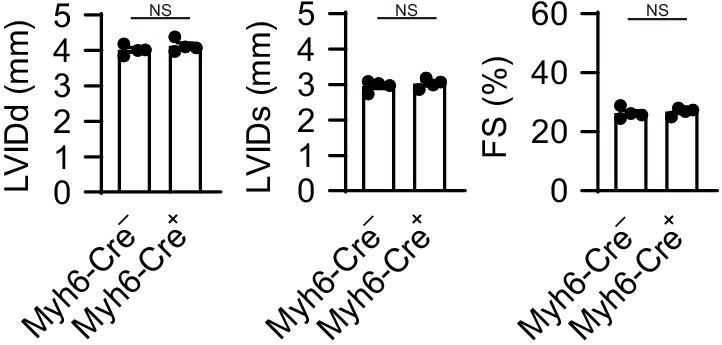
Myh6-Cre transgene does not alter the heart response to pressure overload stress.
The Myh6-Cre– and Myh6-Cre mice were subjected to TAC and analyzed 4 weeks after the operation. Echocardiographic parameters of the mice (n = 4 biologically independent samples) are shown. LVIDd and LVIDs, end-diastolic and end-systolic left ventricular (LV) internal dimensions; FS, fractional shortening. The values are presented as the mean ± SEM. The data were evaluated by unpaired, two-tailed Student’s t-test. NS, p>0.05. Exact p-values are provided in Supplementary file 1.
-
Figure 1—figure supplement 3—source data 1
Source data for Figure 1—figure supplement 3.
- https://cdn.elifesciences.org/articles/62174/elife-62174-fig1-figsupp3-data1-v1.xlsx
Figure 2 with 1 supplement
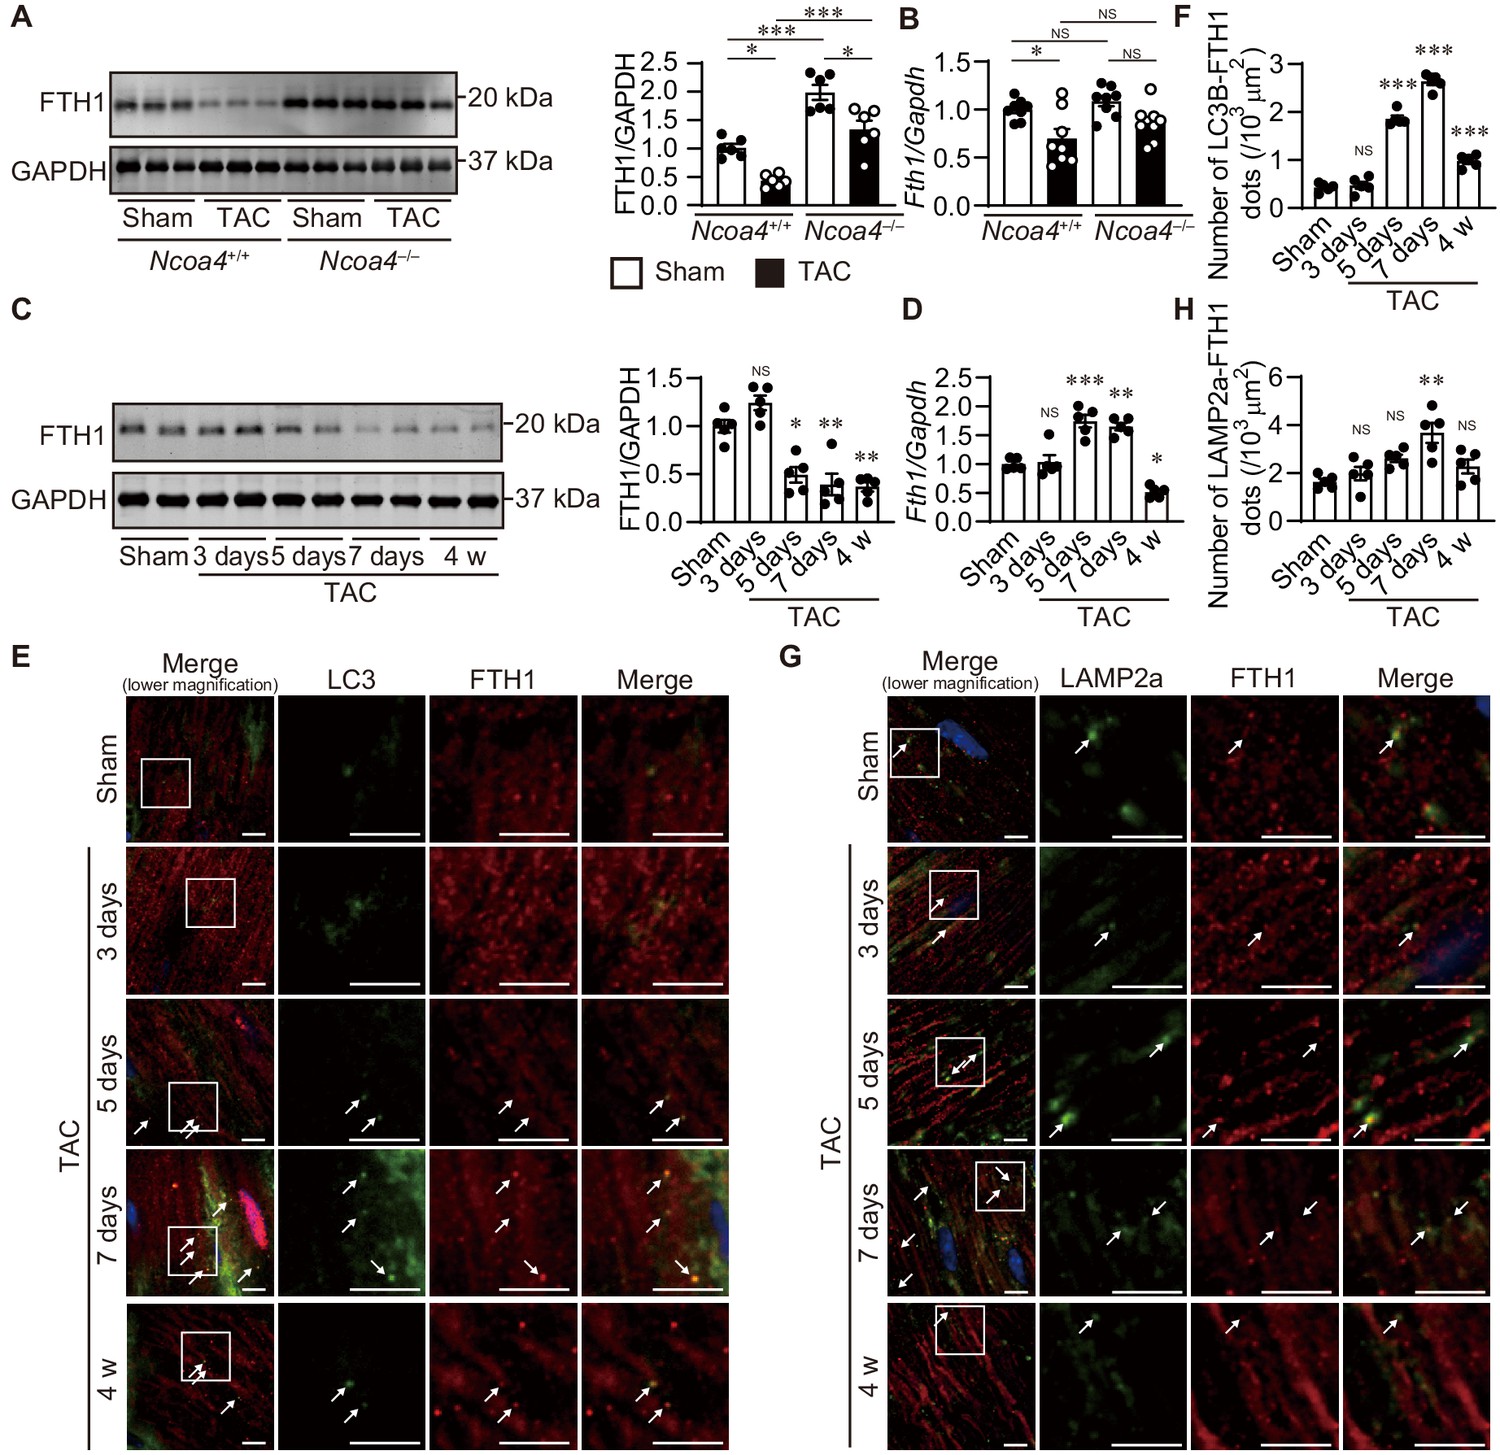
The time course of ferritinophagy in the heart after transverse aortic constriction (TAC).
(A) Western blot analysis of FTH1 in Ncoa4+/+ and Ncoa4–/– hearts 4 weeks after TAC. GAPDH was used as the loading control. The right-hand graphs show the densitometric analysis. The average value for sham-operated Ncoa4+/+ hearts was set to 1 (biologically independent samples: n = 6). (B) mRNA expression of Fth1 in the heart 4 weeks after TAC. Gapdh mRNA was used as the loading control. The average value for sham-operated Ncoa4+/+ hearts was set to 1 (biologically independent samples: n = 8). (C–H) The Ncoa4+/+ mice were subjected to TAC and analyzed 3 days after sham operation and 3, 5, and 7 days and 4 weeks after the operation. (C) Heart homogenates after TAC were subjected to western blot analysis using anti-FTH1 antibody (n = 5 biologically independent samples for each group). GAPDH was used as the loading control. (D) Cardiac Fth1 mRNA levels after TAC (n = 5 biologically independent samples). Gapdh mRNA was used as the loading control. (E and F) Immunofluorescence analysis of LC3B (green) and FTH1 (red) in the heart after TAC (n = 5 biologically independent samples). (G and H) Immunofluorescence analysis of LAMP2a (green) and FTH1 (red) in the heart after TAC (n = 5 biologically independent samples). Scale bar, 5 μm in (E) and (G). Arrows indicate double-positive dots. The values are presented as the mean ± SEM. The data were evaluated by one-way analysis of variance (ANOVA), followed by Tukey–Kramer’s post hoc test. *p<0.05, **p<0.001, ***p<0.0001. NS, p>0.05 versus sham-operated group. Exact p-values are provided in Supplementary file 1.
-
Figure 2—source data 1
Source data for Figure 2.
- https://cdn.elifesciences.org/articles/62174/elife-62174-fig2-data1-v1.xlsx
Figure 2—figure supplement 1
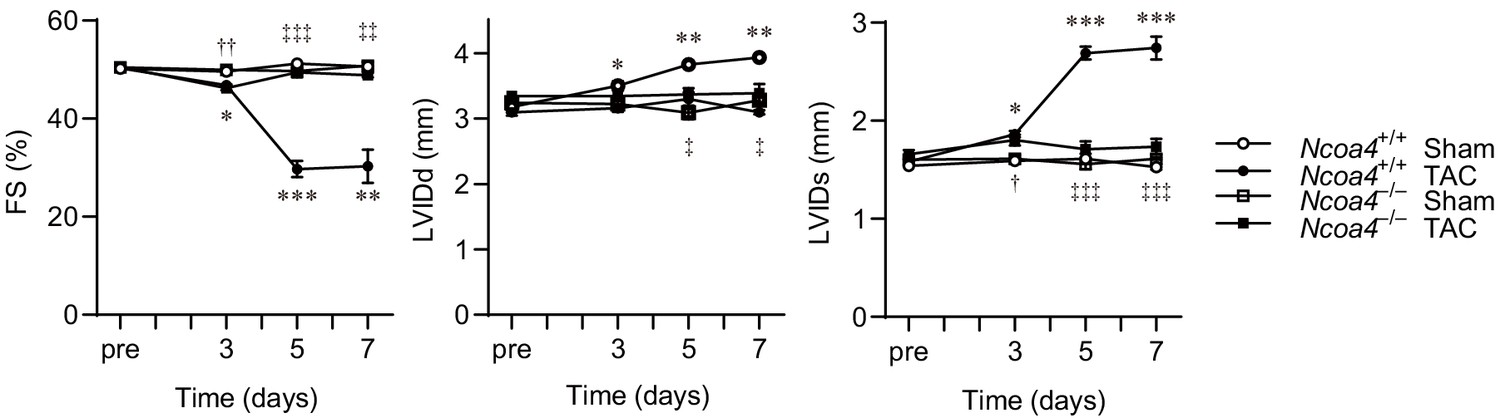
Echocardiographic parameter aftertransverse aortic constriction (TAC).
Time course of changes in the echocardiographic parameters of left ventricular (LV) fractional shortening (FS), the end-diastolic LV internal dimension (LVIDd) and the end-systolic LV internal dimension (LVIDs). Echocardiographic analysis on Ncoa4+/+ and Ncoa4–/– mice were performed before (pre) and 3, 5, and 7 days after TAC (n = 3 biologically independent samples). The values are presented as the mean ± SEM. Two-way analysis of variance (ANOVA) followed by Tukey's multiple comparisons test was used. *p<0.05, **p<0.001, ***p<0.0001. p>0.05, sham-operated Ncoa4+/+ versus TAC-operated Ncoa4+/+. †p<0.05, ††p<0.001, †††p<0.0001. p>0.05, sham-operated Ncoa4–/– versus TAC-operated Ncoa4–/–. ‡p<0.05, ‡‡p<0.001, ‡‡‡p<0.0001. p>0.05, TAC-operated Ncoa4+/+ versus TAC-operated Ncoa4–/–. Exact p-values are provided in Supplementary file 1.
-
Figure 2—figure supplement 1—source data 1
Source data for Figure 2—figure supplement 1.
- https://cdn.elifesciences.org/articles/62174/elife-62174-fig2-figsupp1-data1-v1.xlsx
Figure 3
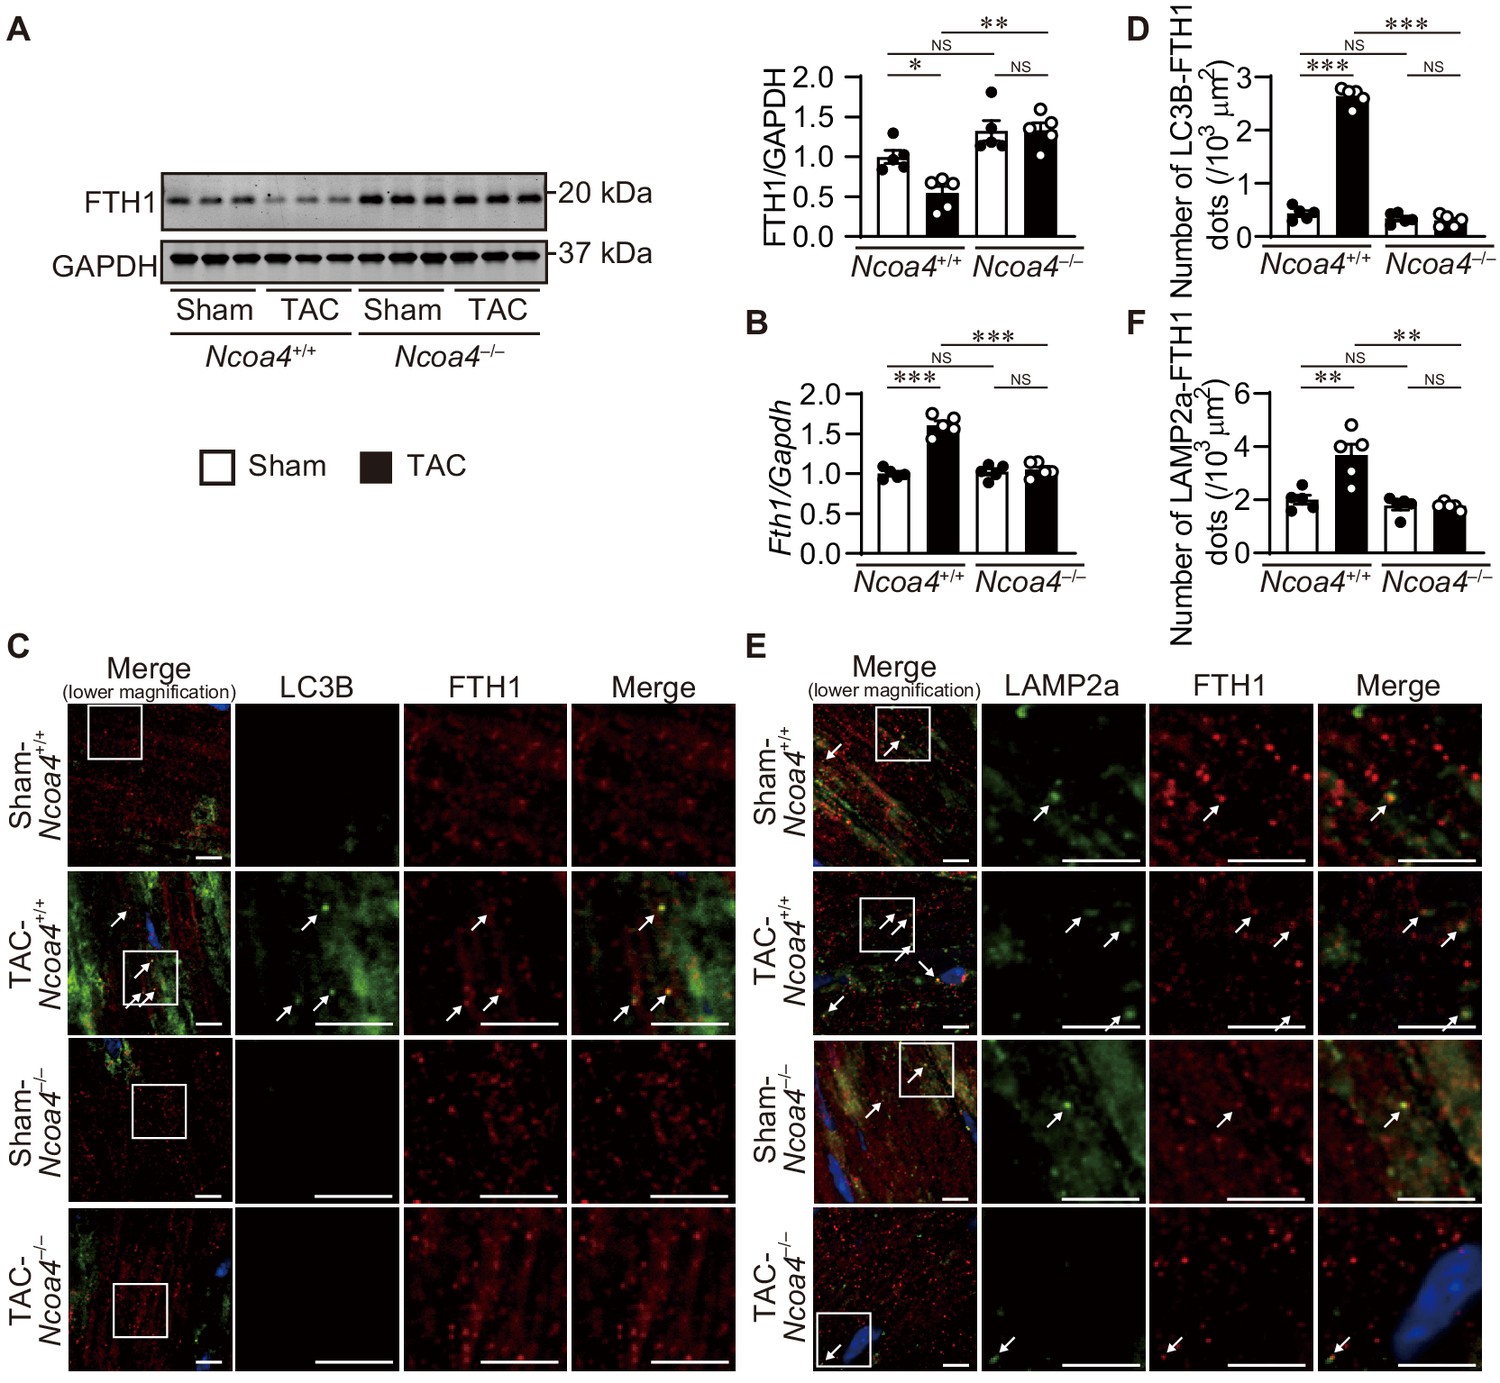
Ablation of Ncoa4 in cardiomyocytes showed defective ferritinophagy.
(A) Western blot analysis of FTH1 in Ncoa4+/+ and Ncoa4–/– hearts 1 week after transverse aortic constriction (TAC). GAPDH was used as the loading control. The right-hand graphs show the densitometric analysis. The average value for sham-operated Ncoa4+/+ hearts was set to 1 (biologically independent samples: n = 5). (B) mRNA expression of Fth1 in the heart 1 week after TAC. Gapdh mRNA was used as the loading control. The average value for sham-operated Ncoa4+/+ hearts was set to 1 (biologically independent samples: n = 5). (C and D) Immunofluorescence analysis of LC3B (green) and FTH1 (red) in the heart 1 week after TAC. The number of LC3B- and FTH1-positive dots is shown in (D). (E and F) Immunofluorescence analysis of LAMP2a (green) and FTH1 (red) in the heart 1 week after TAC. The number of LAPM2a- and FTH1-positive dots is shown in (F). In (C) and (E), images of the square in the merged images are shown at higher magnification in the right three columns. Scale bar, 5 μm. Arrows indicate double-positive dots. The data were evaluated by one-way analysis of variance (ANOVA), followed by Tukey–Kramer’s post hoc test. *p<0.05, **p<0.001, ***p<0.0001. NS, p>0.05. Exact p-values are provided in Supplementary file 1.
-
Figure 3—source data 1
Source data for Figure 3.
- https://cdn.elifesciences.org/articles/62174/elife-62174-fig3-data1-v1.xlsx
Figure 4 with 4 supplements
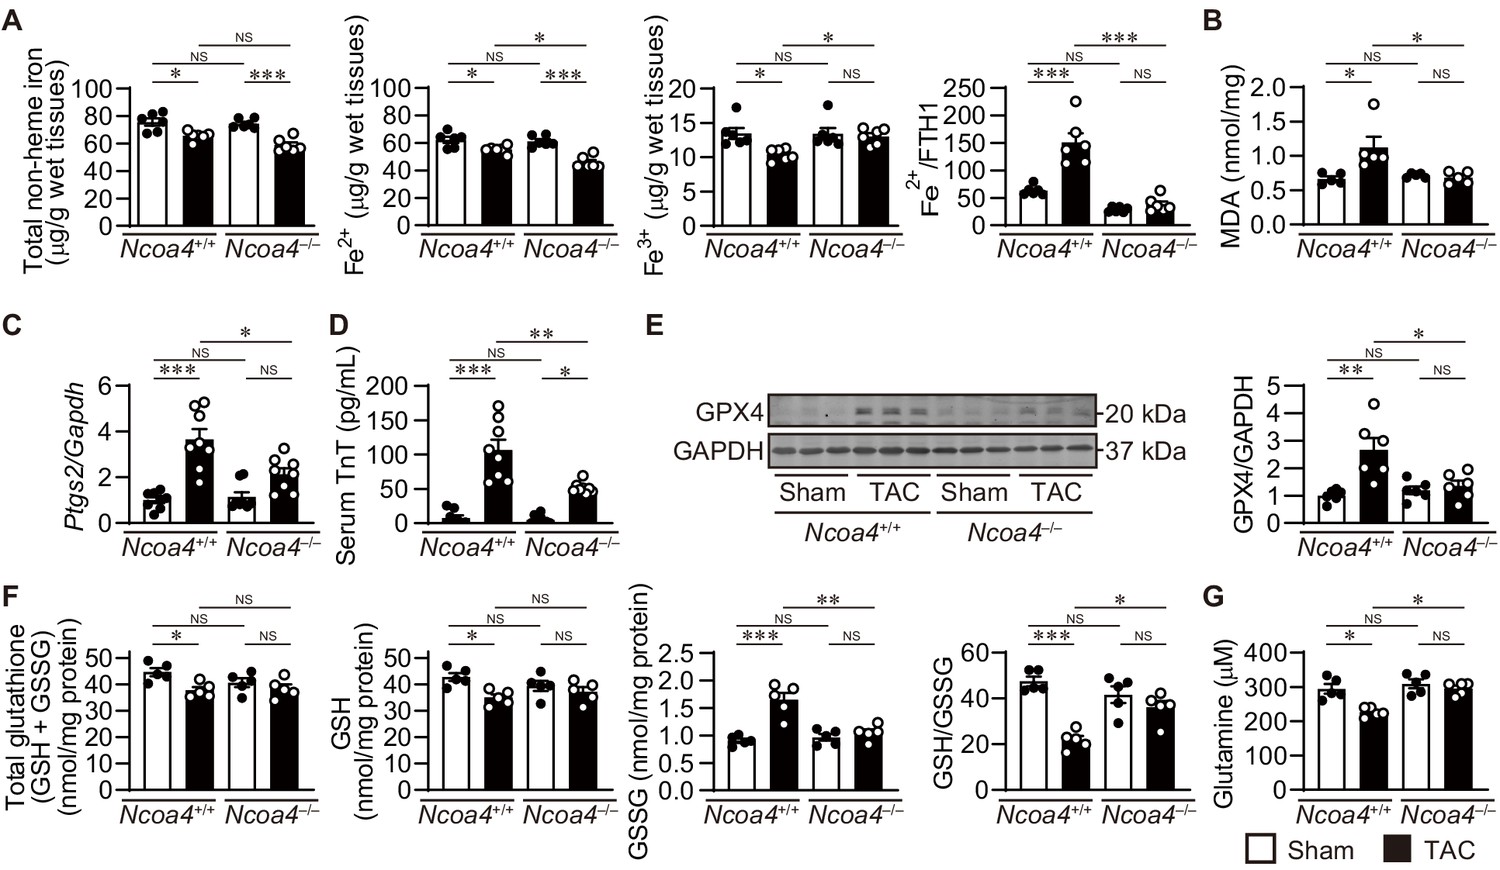
The effect of Ncoa4 ablation on the pathways to iron-dependent cell death.
(A) Tissue levels of total non-heme, ferrous, and ferric iron in Ncoa4+/+ and Ncoa4–/– hearts 4 weeks after transverse aortic constriction (TAC) (n = 6 biologically independent samples). The ratio of the ferrous iron level to the FTH1 protein level is shown in the right-most panel. The FTH1 protein level for sham-operated Ncoa4+/+ estimated as Western blot analysis in hearts was set to 1. (B) Malondialdehyde (MDA) levels in heart homogenates (n = 5 biologically independent samples). (C) Ptgs2 mRNA levels in the heart (n = 8 biologically independent samples). (D) Serum troponin T (TnT) levels (n = 8 biologically independent samples). (E) Glutathione peroxidase 4 (GPX4) levels in the heart homogenates. The right panel shows the ratio of GPX4 to GAPDH (n = 6 biologically independent samples). (F) The levels of total glutathione (GSH+GSSG), reduced (GSH) and oxidized (GSSG) glutathione and the ratio of GSH to GSSG in heart homogenates (n = 5 biologically independent samples). GSH levels were calculated by subtracting GSSG from total glutathione. (G) Cardiac glutamine levels (n = 5 biologically independent samples). The data were evaluated by one-way analysis of variance (ANOVA), followed by Tukey–Kramer’s post hoc test. *p<0.05, **p<0.001, ***p<0.0001. NS, p>0.05. Exact p-values are provided in Supplementary file 1.
-
Figure 4—source data 1
Source data for Figure 4.
- https://cdn.elifesciences.org/articles/62174/elife-62174-fig4-data1-v1.xlsx
-
Figure 4—source data 2
Hematological parameters and red cell indices in Ncoa4+/+ and Ncoa4–/– mice.
PCV, packed cell volume; MCV, mean corpuscular volume; MCH, mean corpuscular hemoglobin; MCHC, mean corpuscular hemoglobin concentration; CH, hemoglobin concentration. Data are the mean ± SEM. n indicates the number of biologically independent samples. The data were evaluated by one-way analysis of variance (ANOVA), followed by Tukey–Kramer’s post hoc test. *p=0.0418 and **p=0.0108 versus the corresponding sham-operated group. Exact p-values are provided in Supplementary file 1.
- https://cdn.elifesciences.org/articles/62174/elife-62174-fig4-data2-v1.docx
-
Figure 4—source data 3
Source data for data table provided in Figure 4—source data 2.
- https://cdn.elifesciences.org/articles/62174/elife-62174-fig4-data3-v1.xlsx
Figure 4—figure supplement 1
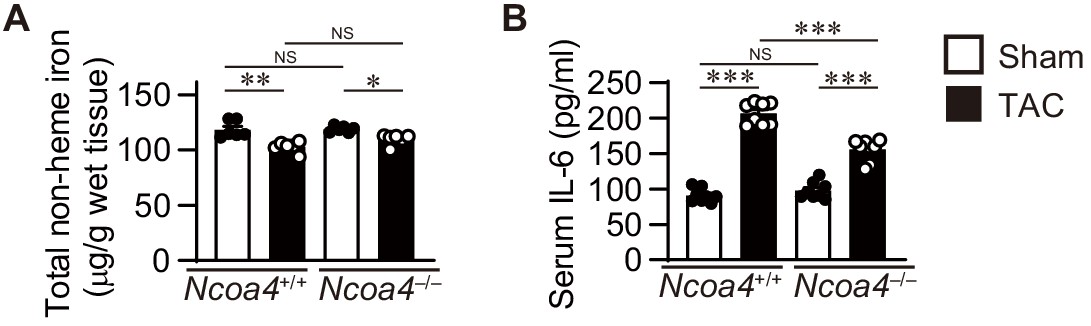
Liver iron store and serum inflammatory cytokine in Ncoa4+/+ and Ncoa4–/– mice.
(A) Tissue levels of total non-heme iron in Ncoa4+/+ and Ncoa4–/– livers 4 weeks after TAC (n = 6 biologically independent samples). (B) Serum interleukin 6 (IL-6) levels (n = 8 biologically independent samples). The values are presented as the mean ± SEM. The data were evaluated by one-way analysis of variance (ANOVA), followed by Tukey–Kramer’s post hoc test. *p<0.05, **p<0.001, ***p<0.0001. NS, p>0.05. Exact p-values are provided in Supplementary file 1.
-
Figure 4—figure supplement 1—source data 1
Source data for Figure 4—figure supplement 1.
- https://cdn.elifesciences.org/articles/62174/elife-62174-fig4-figsupp1-data1-v1.xlsx
Figure 4—figure supplement 2
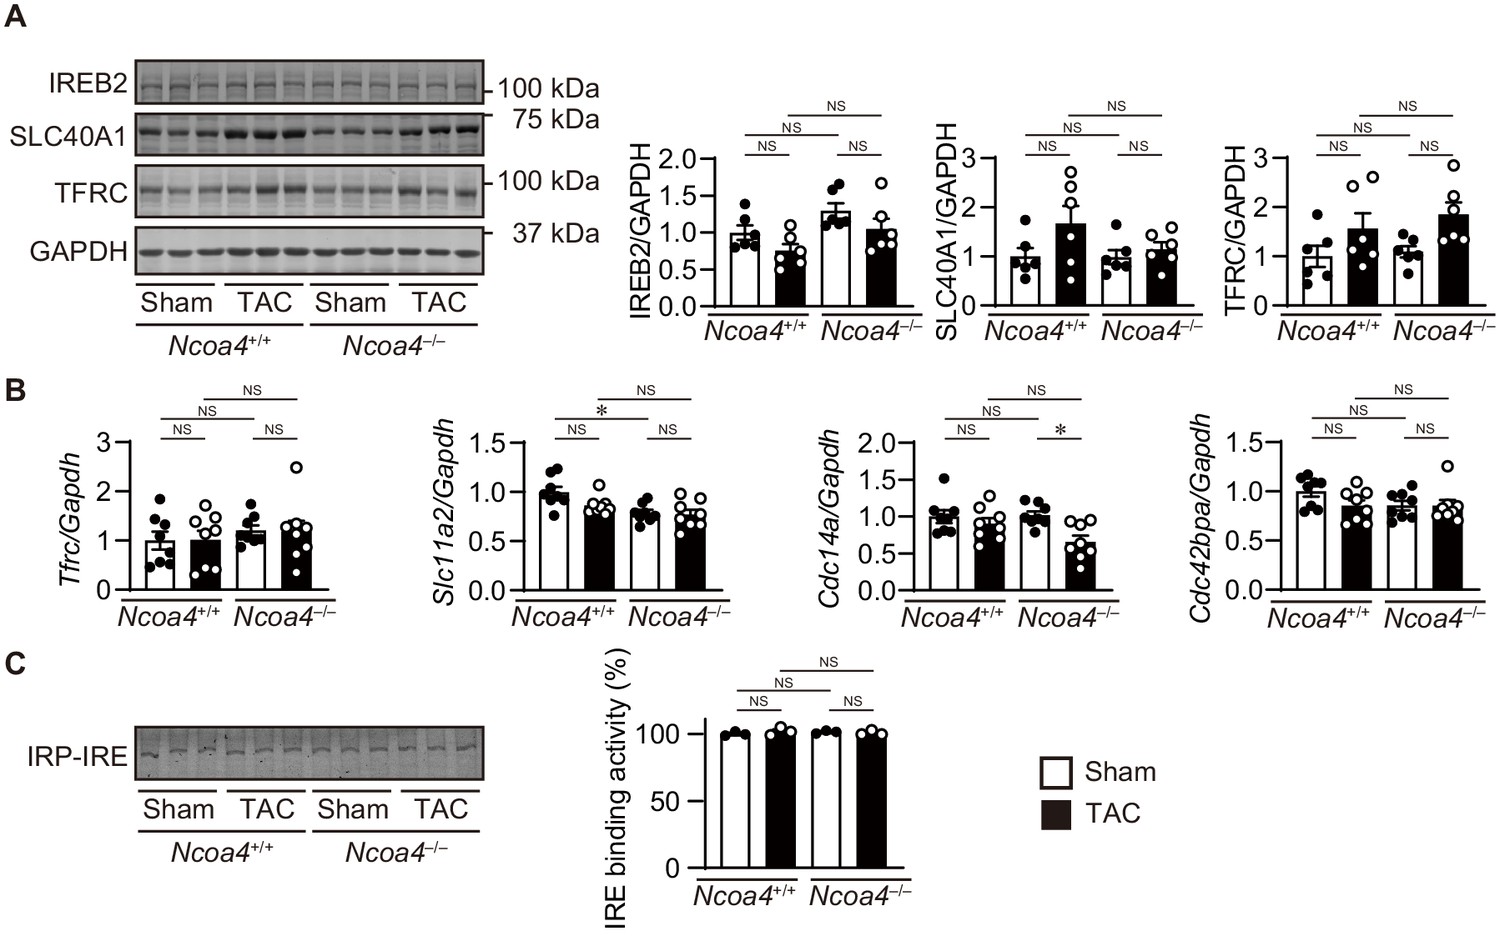
Iron regulating proteins in transverse aortic constriction (TAC)-operated Ncoa4–/– hearts.
(A) Homogenates from the heart 4 weeks after TAC were subjected to western blot analysis using antibodies against iron-responsive element-binding protein 2 (IREB2), ferroportin 1 (SLC40A1), and transferrin receptor 1 (TFRC) (n = 6 biologically independent samples). GAPDH was used as the loading control. (B) The levels of mRNA were analyzed 4 weeks after the operation (n = 8 biologically independent samples). Gapdh mRNA was used as the loading control. (C) IRP activation in Ncoa4+/+ and Ncoa4–/– hearts. The activation of IRP was analyzed by EMSA. Protein homogenates from mouse heart were incubated with the 5’ UTR of mouse Slc40a1 containing IRE and subjected to electrophoresis. (n = 3 biologically independent samples). The values are presented as the mean ± SEM. The data were evaluated by one-way analysis of variance (ANOVA), followed by Tukey–Kramer’s post hoc test. NS, p>0.05. Exact p-values are provided in Supplementary file 1.
-
Figure 4—figure supplement 2—source data 1
Source data for Figure 4—figure supplement 2.
- https://cdn.elifesciences.org/articles/62174/elife-62174-fig4-figsupp2-data1-v1.xlsx
Figure 4—figure supplement 3
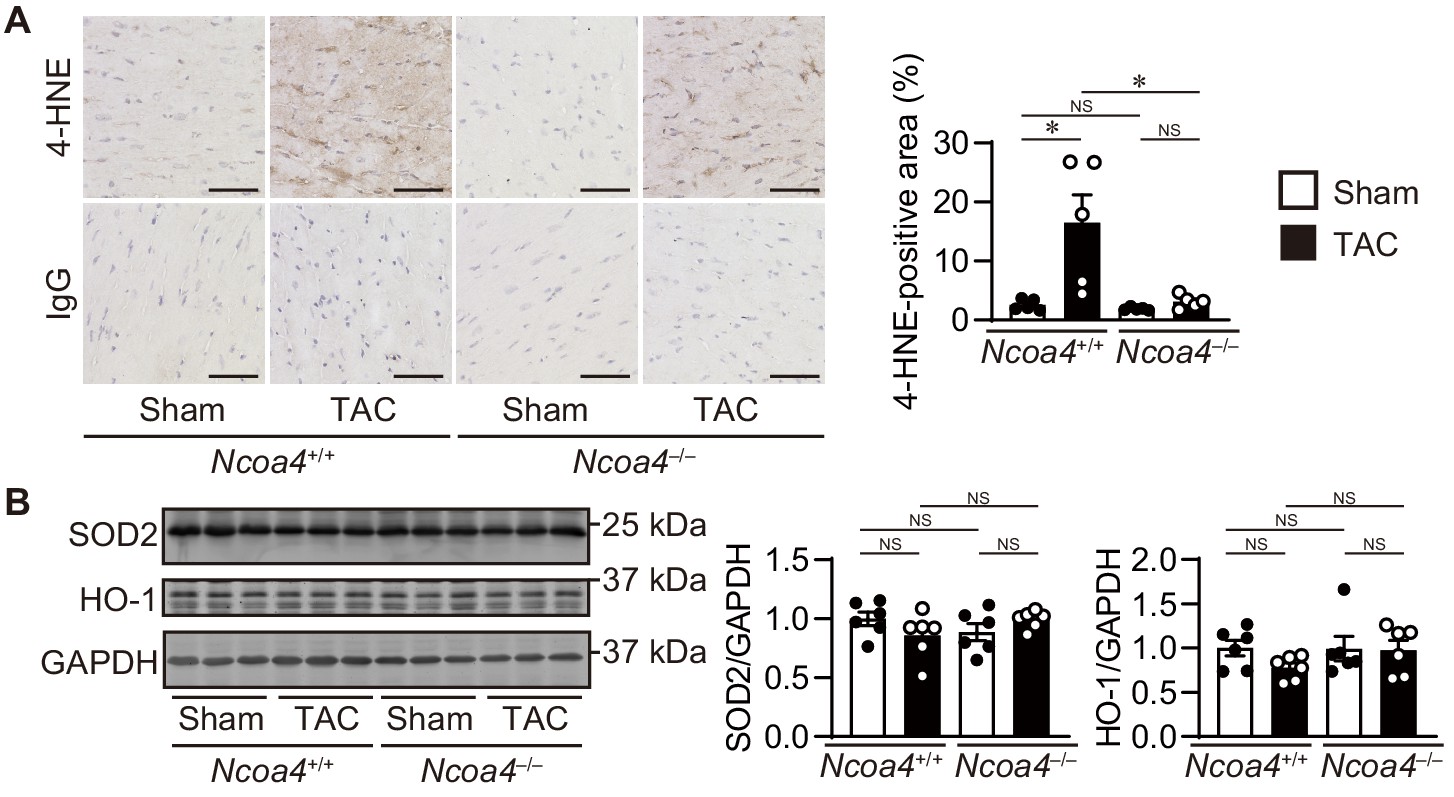
Lipid reactive oxygen species and anti-oxidant proteins in Ncoa4–/– hearts 4 weeks after transverse aortic constriction (TAC).
(A) 4-Hydroxy-2-noneal (HNE) staining of heart sections. Scale bar, 50 μm. The right panel shows the quantitative analysis of 4-HNE-positive area to whole heart section (n = 5 biologically independent samples). (B) Homogenates from the heart were subjected to western blot analysis using antibodies against superoxide dismutase 2 (SOD2) and heme oxygenase 1 (HO-1) (n = 6 biologically independent samples). GAPDH was used as the loading control. The values are presented as the mean ± SEM. The data were evaluated by one-way analysis of variance (ANOVA), followed by Tukey–Kramer’s post hoc test. *p<0.05. NS, p>0.05. Exact p-values are provided in Supplementary file 1.
-
Figure 4—figure supplement 3—source data 1
Source data for Figure 4—figure supplement 3.
- https://cdn.elifesciences.org/articles/62174/elife-62174-fig4-figsupp3-data1-v1.xlsx
Figure 4—figure supplement 4
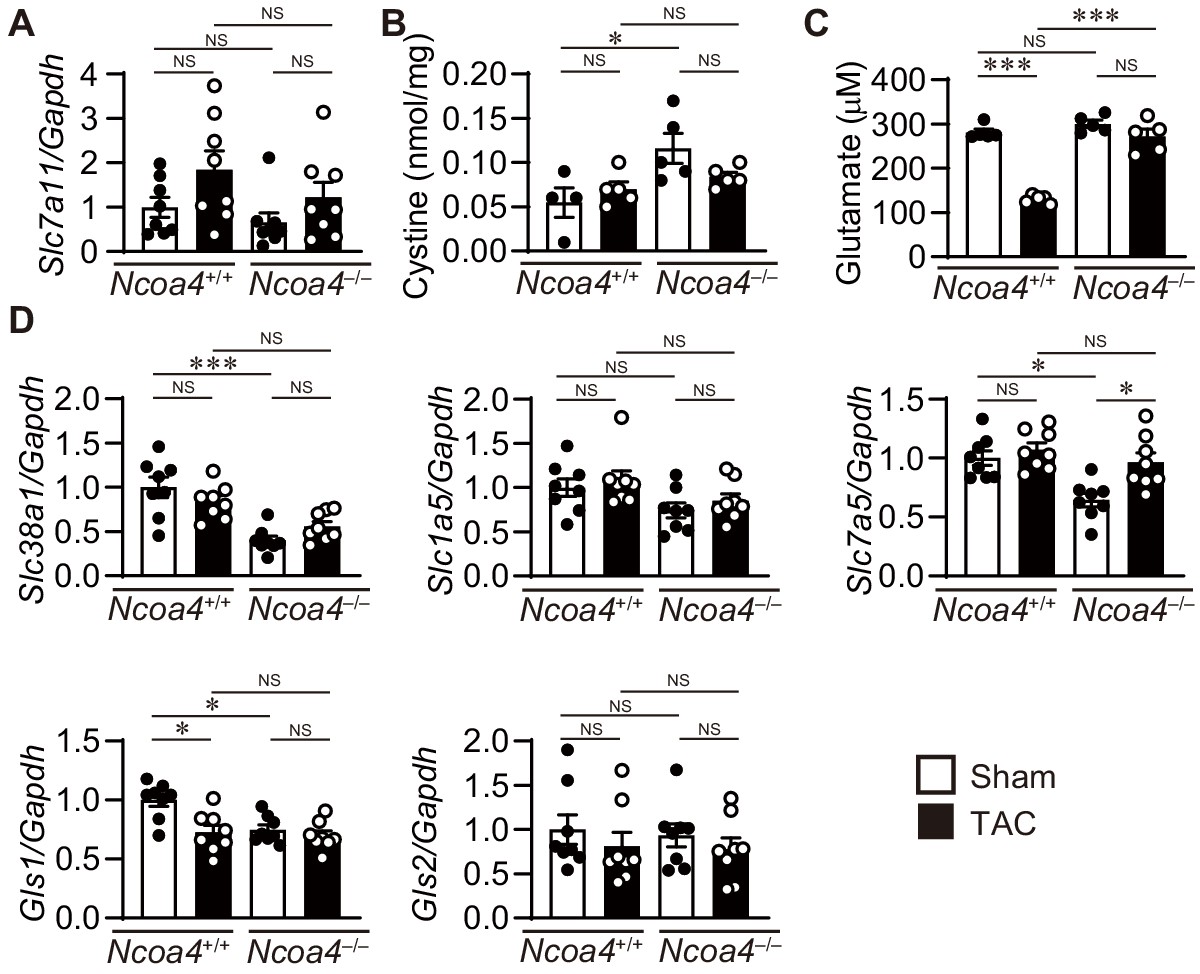
The system Xc-/glutathione axis and glutaminolysis pathway in transverse aortic constriction (TAC)-operated Ncoa4–/– hearts.
(A) The mRNA expression level of Slc7a11 in the heart 4 weeks after TAC (n = 8 biologically independent samples). Gapdh mRNA was used as the loading control. (B) The cystine concentration in the heart was analyzed by high–performance liquid chromatography (HPLC) (n = 4 for sham-operated Ncoa4+/+, n = 5 for TAC-operated Ncoa4+/+, sham-operated Ncoa4–/–, and TAC-operated Ncoa4–/– biologically independent samples). (C) Cardiac glutamate levels (n = 5 biologically independent samples). (D) The mRNA expression levels of Slc38a1, Slc1a5, Slc7a5, Gls1, and Gls2 in the hearts 4 weeks after TAC (n = 8 biologically independent samples). Gapdh mRNA was used as the loading control. The values are presented as the mean ± SEM. The data were evaluated by one-way analysis of variance (ANOVA), followed by Tukey–Kramer’s post hoc test. *p<0.05, ***p<0.0001. NS, p>0.05. Exact p-values are provided in Supplementary file 1.
-
Figure 4—figure supplement 4—source data 1
Source data for Figure 4—figure supplement 4.
- https://cdn.elifesciences.org/articles/62174/elife-62174-fig4-figsupp4-data1-v1.xlsx
Figure 5 with 2 supplements
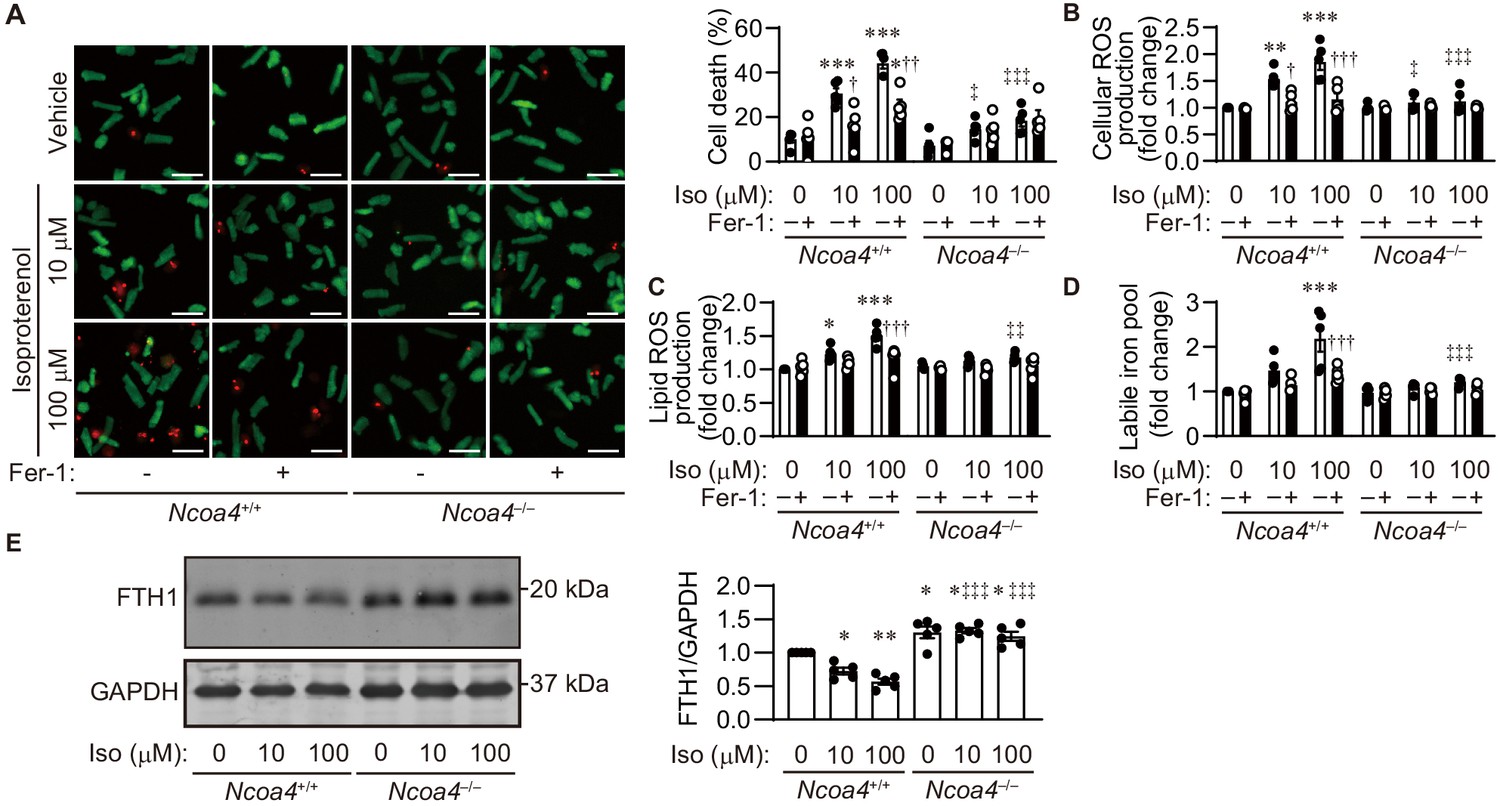
Isoproterenol induces iron-dependent cell death in isolated cardiomyocytes.
(A) Cell death assay. Cell death was estimated using a Live/Dead Viability/Cytotoxicity Assay Kit. Isolated mouse cardiomyocytes from Ncoa4+/+ and Ncoa4–/– hearts were treated with the indicated concentrations of isoproterenol (Iso) with or without ferrostatin-1 (Fer-1) for 4 hr. Calcein-AM (green) is retained in live cells, while ethidium homodimer produces red fluorescence in dead cells. Scale bar, 100 μm. The percentage of dead cells is shown in the middle left-hand graphs (n = 5 biologically independent samples). (B and C) The accumulation of cellular (B) and lipid (C) reactive oxygen species (ROS) were assessed by H2DCFDA and C11-BODIPY, respectively (n = 5 biologically independent samples). (D) The labile iron pool was measured using the calcein-AM method in isolated mouse cardiomyocytes (n = 5 biologically independent samples). (E) Western blot analysis of FTH1 in isolated mouse cardiomyocytes from Ncoa4+/+ and Ncoa4–/– hearts. GAPDH was used as the loading control. The right-hand graphs show the densitometric analysis (n = 5 biologically independent samples). The average value for vehicle-treated without ferrostatin-1 Ncoa4+/+ cardiomyocytes was set to 1. The values are presented as the mean ± SEM. Two-way analysis of variance (ANOVA) followed by Tukey's multiple comparisons test was used. *p<0.05, **p<0.001, ***p<0.0001. NS, p>0.05 versus Ncoa4+/+ control without ferrostatin-1 treatment. †p<0.05, ††p<0.001, †††p<0.0001. NS, p>0.05 versus the corresponding group without ferrostatin-1 treatment. ‡p<0.05, ‡‡p<0.001, ‡‡‡p<0.0001. NS, p>0.05 versus the corresponding Ncoa4+/+. Exact p-values are provided in Supplementary file 1.
-
Figure 5—source data 1
Source data for Figure 5.
- https://cdn.elifesciences.org/articles/62174/elife-62174-fig5-data1-v1.xlsx
Figure 5—figure supplement 1
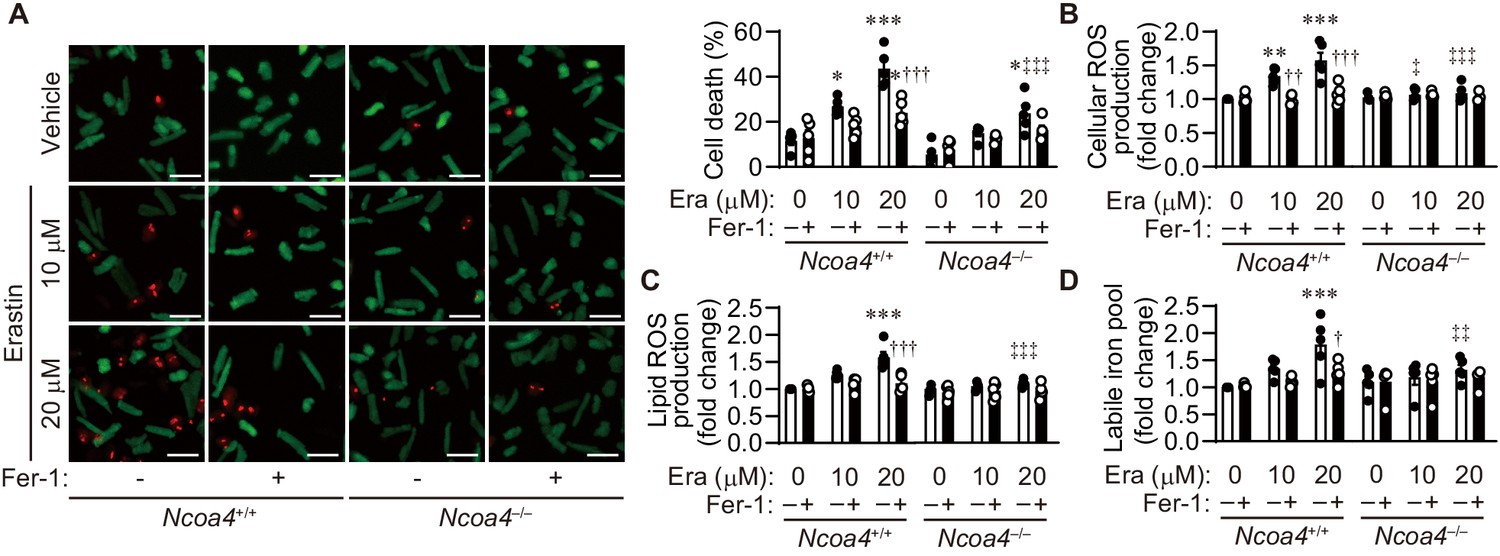
Erasin induces cell death in isolated cardiomyocytes.
(A) Cell death assay. Cell death was estimated using a Live/Dead Viability/Cytotoxicity Assay Kit. Isolated mouse cardiomyocytes from Ncoa4+/+ and Ncoa4–/– hearts were treated with the indicated concentrations of erastin (Era) with or without ferrostatin-1 (Fer-1) for 4 hr. Calcein-AM (green) is retained in live cells, while ethidium homodimer produces red fluorescence in dead cells. Scale bar, 100 μm. The percentage of dead cells is shown in the middle left-hand graphs (n = 5 biologically independent samples). (B and C) The accumulation of cellular (B) and lipid (C) reactive oxygen species (ROS) were assessed by H2DCFDA and C11-BODIPY, respectively (n = 5 biologically independent samples). (D) The labile iron pool was measured using the calcein-AM method in isolated mouse cardiomyocytes (n = 5 biologically independent samples). The average value for vehicle-treated without ferrostatin-1 Ncoa4+/+ cardiomyocytes was set to 1. The values are presented as the mean ± SEM. Two-way analysis of variance (ANOVA) followed by Tukey's multiple comparisons test was used. *p<0.05, **p<0.001, ***p<0.0001. NS, p>0.05 versus Ncoa4+/+ control without ferrostatin-1 treatment. †p<0.05, ††p<0.001, †††p<0.0001. NS, p>0.05 versus the corresponding group without ferrostatin-1 treatment. ‡p<0.05, ‡‡p<0.001, ‡‡‡p<0.0001. NS, p>0.05 versus the corresponding Ncoa4+/+. Exact p-values are provided in Supplementary file 1.
-
Figure 5—figure supplement 1—source data 1
Source data for Figure 5—figure supplement 1.
- https://cdn.elifesciences.org/articles/62174/elife-62174-fig5-figsupp1-data1-v1.xlsx
Figure 5—figure supplement 2
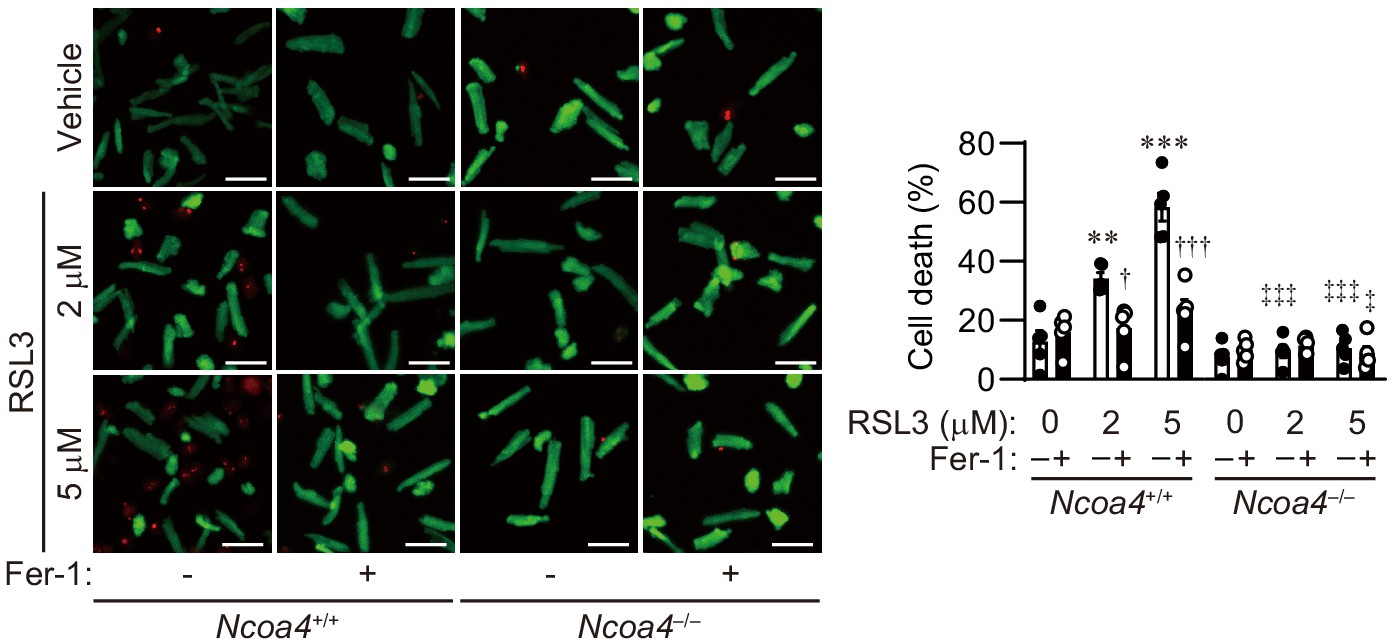
RSL3 induces cell death in isolated cardiomyocytes.
Cell death assay. Cell death was estimated using a Live/Dead Viability/Cytotoxicity Assay Kit. Isolated mouse cardiomyocytes from Ncoa4+/+ and Ncoa4–/– hearts were treated with the indicated concentrations of RSL3 with or without ferrostatin-1 (Fer-1) for 4 hr. Calcein-AM (green) is retained in live cells, while ethidium homodimer produces red fluorescence in dead cells. Scale bar, 100 μm. The percentage of dead cells is shown in the graphs (n = 5 biologically independent samples). The values are presented as the mean ± SEM. Two-way analysis of variance (ANOVA) followed by Tukey's multiple comparisons test was used. *p<0.05, **p<0.001, ***p<0.0001. NS, p>0.05 versus Ncoa4+/+ control without ferrostatin-1 treatment. †p<0.05, ††p<0.001, †††p<0.0001. NS, p>0.05 versus the corresponding group without ferrostatin-1 treatment. ‡p<0.05, ‡‡p<0.001, ‡‡‡p<0.0001. NS, p>0.05 versus the corresponding Ncoa4+/+. Exact p-values are provided in Supplementary file 1.
-
Figure 5—figure supplement 2—source data 1
Source data for Figure 5—figure supplement 2.
- https://cdn.elifesciences.org/articles/62174/elife-62174-fig5-figsupp2-data1-v1.xlsx
Figure 6 with 2 supplements
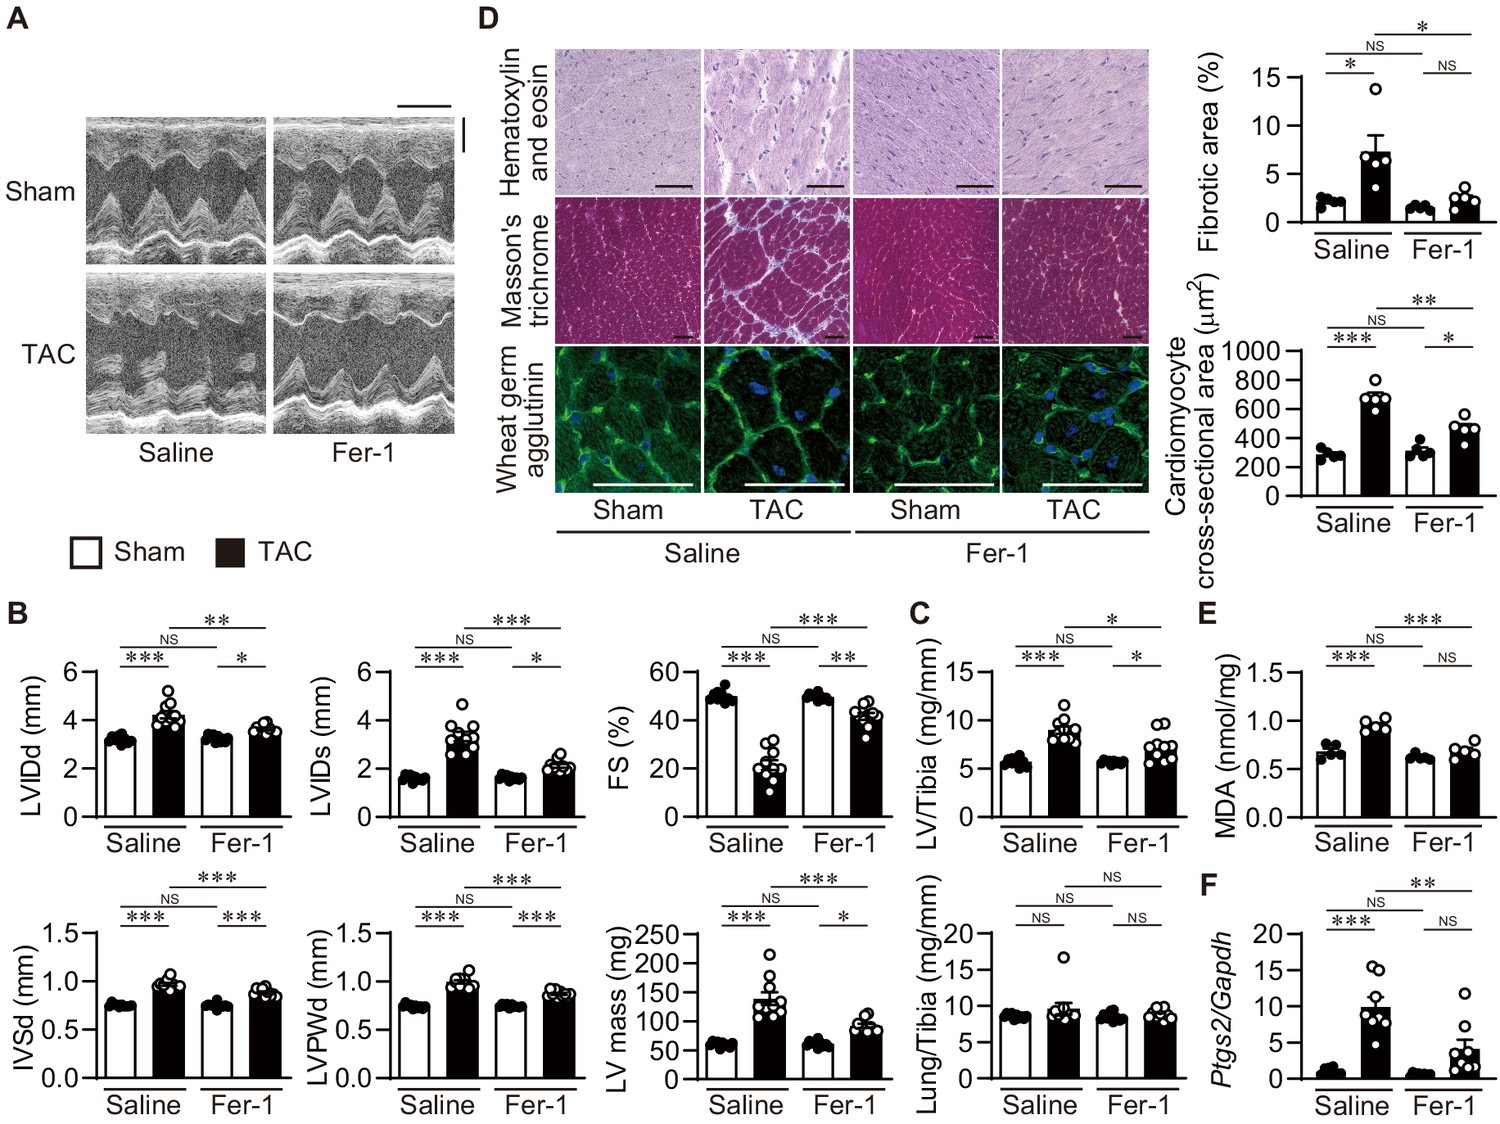
Inhibition of lipid peroxidation protects hearts from pressure overload.
Wild-type C57BL/6J mice were subjected to transverse aortic constriction (TAC) and analyzed 4 weeks after the operation. Ferrostatin-1 (Fer-1) or saline was intraperitoneally administered daily starting 1 day before TAC. (A) Representative images of transthoracic M-mode echocardiographic tracing. Scale bars, 0.1 s and 2 mm, respectively. (B) Echocardiographic parameters of the mice (n = 10 biologically independent samples). (C) Physiological parameters of the mice (n = 10 biologically independent samples). (D) Histological analysis of the heart. Scale bar, 50 μm. The upper and lower right graphs show the ratio of the fibrotic area to whole heart section and the cross-sectional area of cardiomyocytes, respectively (n = 5 biologically independent samples). (E) Cardiac MDA levels (n = 5 biologically independent samples). (F) Ptgs2 mRNA levels in the hearts (n = 8 biologically independent samples). The data were evaluated by one-way analysis of variance (ANOVA) followed by Tukey–Kramer’s post hoc test. *p<0.05, **p<0.001, ***p<0.0001. NS, p>0.05. Exact p-values are provided in Supplementary file 1.
-
Figure 6—source data 1
Source data for Figure 6.
- https://cdn.elifesciences.org/articles/62174/elife-62174-fig6-data1-v1.xlsx
Figure 6—figure supplement 1
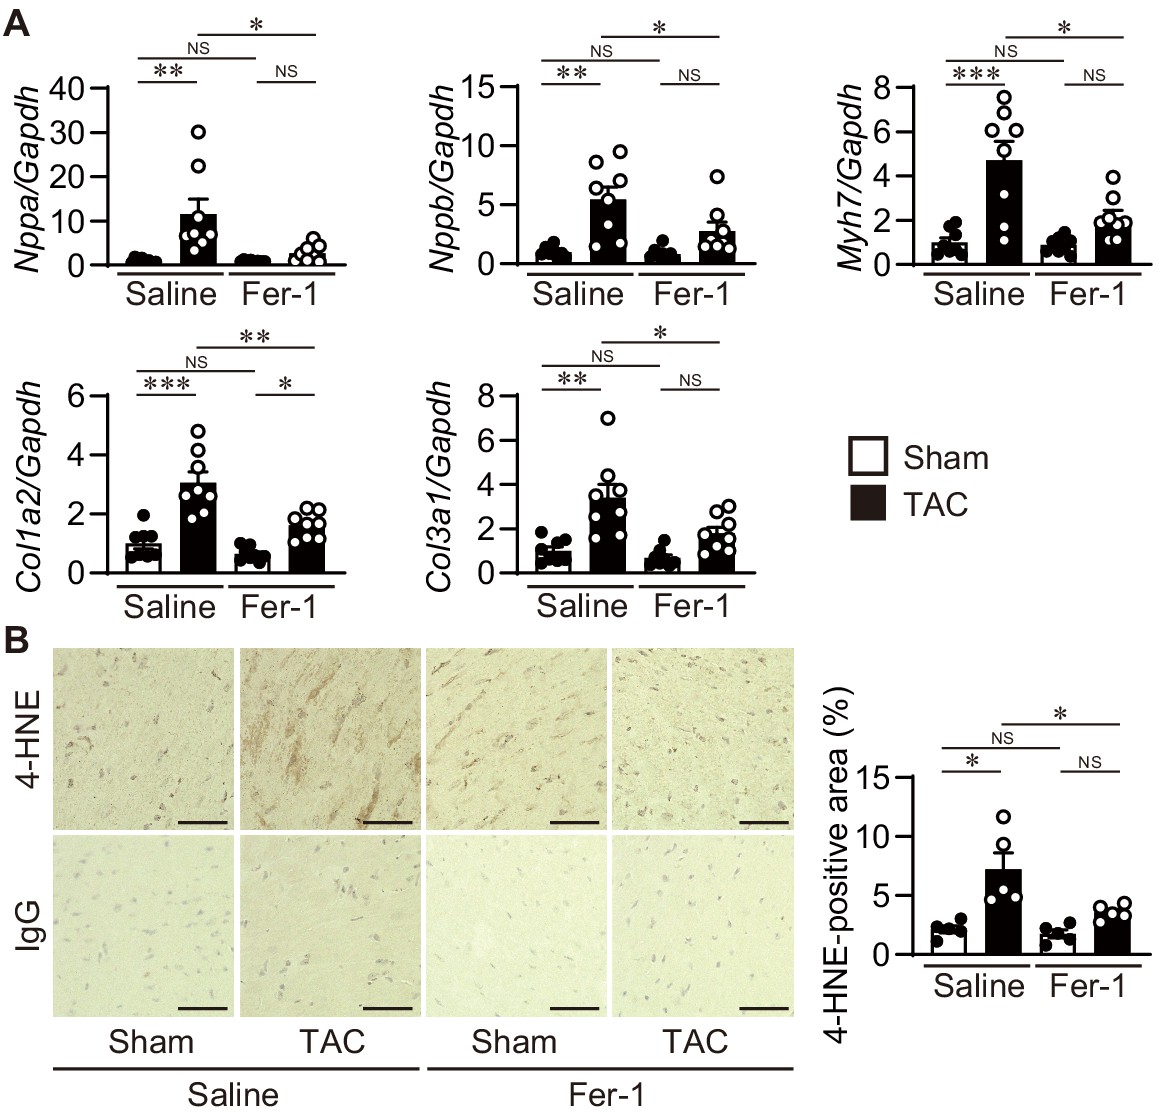
Cardiac remodeling markers and 4-HNE staining in ferrostatin-1-treated transverse aortic constriction (TAC)-operated wild-type hearts.
The wild-type C57BL/6J mice were subjected to TAC. Ferrostatin-1 (Fer-1) was intraperitoneally administered daily starting one day before TAC. (A) The levels of mRNA were analyzed 4 weeks after the operation (n = 8 biologically independent samples). Gapdh mRNA was used as the loading control. (B) 4-Hydroxy-2-noneal (4-HNE) staining of heart sections. Scale bar, 50 μm. The right panel shows the quantitative analysis of 4-HNE-positive area (n = 5 biologically independent samples). The values are presented as the mean ± SEM. The data were evaluated by one-way analysis of variance (ANOVA) followed by Tukey–Kramer’s post hoc test. *p<0.05, **p<0.001, ***p<0.0001. NS, p>0.05. Exact p-values are provided in Supplementary file 1.
-
Figure 6—figure supplement 1—source data 1
Source data for Figure 6—figure supplement 1.
- https://cdn.elifesciences.org/articles/62174/elife-62174-fig6-figsupp1-data1-v1.xlsx
Figure 6—figure supplement 2
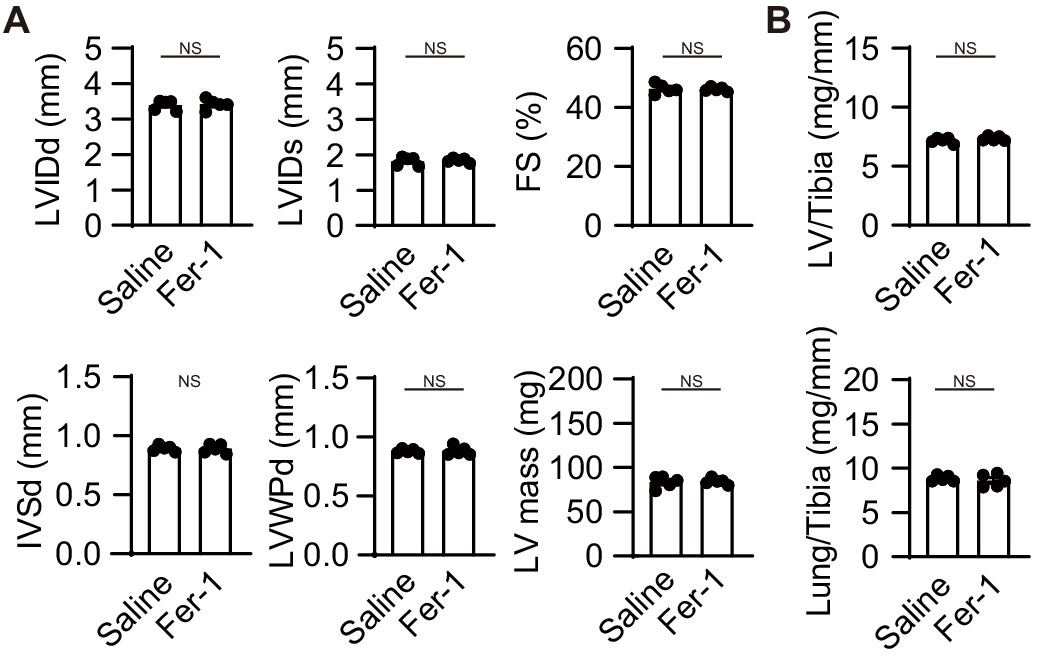
Ferrostatin-1 does not provide additional protection from cardiac remodeling in Ncoa4–/– mice.
The Ncoa4–/– mice were subjected to TAC. Ferrostatin-1 (Fer-1) or saline was intraperitoneally administered daily starting one day before TAC. (A) Echocardiographic parameters of the mice (n = 5 biologically independent samples). LVIDd and LVIDs, end-diastolic and end-systolic left ventricular (LV) internal dimensions; IVSd, end-diastolic interventricular septum thickness; LVPWd, end-diastolic LV posterior wall thickness; FS, fractional shortening. (B) Physiological parameters of the mice (n = 5 biologically independent samples). The values are presented as the mean ± SEM. The data were evaluated by unpaired, two-tailed Student’s t-test. NS, p>0.05. Exact P p-values are provided in Supplementary file 1.
-
Figure 6—figure supplement 2—source data 1
Source data for Figure 6—figure supplement 2.
- https://cdn.elifesciences.org/articles/62174/elife-62174-fig6-figsupp2-data1-v1.xlsx
Tables
Key resources table
| Reagent type (species) or resource | Designation | Source or reference | Identifiers | Additional information |
|---|---|---|---|---|
| Strain, strain background (male Mus musculus) | C57BL/6J | Envigo UK | C57BL/6OlaHsd | |
| Strain, strain background (male Mus musculus) | Ncoa4flox/flox;Myh6-Cre+ | This paper | See Materials and methods | |
| Strain, strain background (male Mus musculus) | Ncoa4flox/flox;Myh6-Cre– | This paper | See Materials and methods | |
| Strain, strain background (male Mus musculus) | Myh6-Cre+ | Nishida et al., 2004 | See Materials and methods | |
| Antibody | Mouse monoclonal antibody to NCOA4 | Sigma-Aldrich | SAB1404569, Lot: HC071-1F11, RRID:AB_10759525 | (1:1000) |
| Antibody | Rabbit polyclonal antibody to FTH1 | Cell Signaling Technology | 3998, Lot: 2, RRID:AB_1903974 | for western blots, (1:1000); for immunofluorescence, (1:100) |
| Antibody | Mouse monoclonal antibody to LC3B | Cell Signaling Technology | 83506, Lot: 1, RRID:AB_2800018 | (1:100) |
| Antibody | Rat monoclonal antibody to LAMP2a | Abcam | ab13524, Lot: GR3317907-1, RRID:AB_2134736 | (1:100) |
| Antibody | Rat monoclonal antibody to GPX4 | Millipore | MABS1274, Lot: Q2633070, RRID:AB_2885039 | (1:1000) |
| Antibody | Rabbit polyclonal antibody to 4-HNE | Millipore | 393207, Lot: 3167038, RRID:AB_566310 | (1:500) |
| Antibody | Rabbit polyclonal antibody to IREB2 | Thermo Fisher Scientific | PA1-16543, Lot: TK2666362A, RRID:AB_2126583 | (1:250) |
| Antibody | Rabbit polyclonal antibody to SLC40A1 | Alpha Diagnostic International | MTP11-A, Lot: 1169899A3-L, RRID:AB_1619475 | (1:1000) |
| Antibody | Mouse monoclonal antibody to TFRC | Thermo Fisher Scientific | 13–6800, Lot: TI275369, RRID:AB_2533029 | (1:1000) |
| Antibody | Rabbit polyclonal antibody to SOD2 | Abcam | ab13534, Lot: GR33618-66, RRID:AB_2191667 | (1:1000) |
| Antibody | Rabbit polyclonal antibody to HO-1 | Enzo Life Sciences | ADI-SPA-895, Lot: 03301708, RRID:AB_10618757 | (1:1000) |
| Antibody | Mouse monoclonal antibody to GAPDH | Sigma-Aldrich | G8795, Lot: 056M4856V, RRID:AB_1078991 | (1:10000) |
| Antibody | Mouse immunoglobulin | Santa Cruz biochemistry | sc-2025, RRID:AB_737182 | |
| Antibody | Rabbit IgG | Abcam | ab37415, RRID:AB_2631996 | |
| Antibody | Fluorescein isothiocyanate-conjugated lectin | Sigma-Aldrich | L4895 | |
| Antibody | Alexa Fluor 488 donkey-anti-mouse | Thermo Fisher Scientific | A21202, RRID:AB_141607 | (1:500) |
| Antibody | Alexa Fluor 568 donkey-anti-rabbit | Thermo Fisher Scientific | A10042, RRID:AB_2534017 | (1:500) |
| Antibody | Alexa Fluor 488 goat-anti-rat | Thermo Fisher Scientific | A11006, RRID:AB_2534074 | (1:500) |
| Antibody | IRDye 680LT Donkey anti-Mouse IgG Secondary Antibody | LI-COR Biosciences | 926–68020, RRID:AB_10706161 | (1:10,000) |
| Antibody | IRDye 680LT Donkey anti-Rabbit IgG Secondary Antibody | LI-COR Biosciences | 926–68023, RRID:AB_10706167 | (1:10,000) |
| Antibody | IRDye 680LT Goat anti-Rat IgG Secondary Antibody | LI-COR Biosciences | 926–68029, RRID:AB_10715073 | (1:10,000) |
| Commercial assay or kit | Pierce Protein G Magnetic Beads | Thermo Scientific | 88848 | |
| Commercial assay or kit | RNeasy Fibrous Tissue Mini Kit | QIAGEN | 74704 | |
| Commercial assay or kit | SuperScript IV First-Strand Synthesis System | Thermo Fisher Scientific | 18091050 | |
| Commercial assay or kit | PowerUp SYBR Green Master Mix | Thermo Fisher Scientific | A25742 | |
| Commercial assay or kit | Masson's Trichrome Stain Kit | Polysciences, Inc | 25088–1 | |
| Commercial assay or kit | VECTASTAIN Elite ABC-HRP Kit, Peroxidase (Rabbit IgG) | Vector Laboratories Inc | PK-6101 | |
| Commercial assay or kit | DAB Substrate Kit, Peroxidase (HRP), with Nickel, (3,3'-diaminobenzidine) | Vector Laboratories Inc | SK-4100 | |
| Commercial assay or kit | normal donkey serum | Abcam | ab7475, RRID:AB_2885042 | |
| Commercial assay or kit | normal goat serum | Abcam | ab7481, RRID:AB_2716553 | |
| Commercial assay or kit | ProLong Gold Antifade Reagent with DAPI | Life Technologies | P36935 | |
| Commercial assay or kit | Mouse Ferritin ELISA Kit (FTL) | Abcam | ab157713 | |
| Commercial assay or kit | Pointe Scientific Iron/TIBC Reagents | Pointe Scientific | 23-666-320 | |
| Commercial assay or kit | ELISA Kit for Troponin T Type 2, Cardiac (TNNT2) | Cloud-Clone | SED232Mu | |
| Commercial assay or kit | Mouse IL-6 Quantikine ELISA Kit | R and D Systems | M6000B | |
| Commercial assay or kit | Iron Assay Kit | Abcam | ab83366 | |
| Commercial assay or kit | Lipid Peroxidation (MDA) Assay Kit | Abcam | ab118970 | |
| Commercial assay or kit | GSSG/GSH Quantification Kit | Dojindo | G257 | |
| Commercial assay or kit | Glutamine Assay Kit | Abcam | ab197011 | |
| Commercial assay or kit | Glutamate Assay Kit | Abcam | ab83389 | |
| Commercial assay or kit | Electrophoretic Mobility-Shift Assay (EMSA) Kit | Invitrogen | E33075 | |
| Commercial assay or kit | Zero Blunt TOPO PCR Cloning Kit | Invitrogen | 451245 | |
| Commercial assay or kit | HiScribe T7 Quick High Yield RNA Synthesis Kit | New England Biolabs | E2050S | |
| Chemical compound, drug | Ferrostatin-1 | Sigma Aldrich | SML0583 | |
| Chemical compound, drug | Isoprenaline hydrochloride | Sigma Aldrich | I5627 | |
| Chemical compound, drug | Erastin | Sigma Aldrich | E7781 | |
| Chemical compound, drug | 1S,3R-RSL 3 | Sigma Aldrich | SML2234 | |
| Chemical compound, drug | calcein-AM | Invitrogen | C1430 | |
| Chemical compound, drug | ethidium homodimer-1 | Invitrogen | E1169 | |
| Chemical compound, drug | 2’, 7’-dichlorodihydrofluorescein diacetate (H2DCFDA) | Invitrogen | D399 | |
| Chemical compound, drug | C11-BODIPY | Invitrogen | D3861 | |
| Chemical compound, drug | pyridoxal isonicotinoyl hydrazine (PIH) | Abcam | ab145871 | |
| Software, algorithm | ImageJ | National Institutes of Health | Version 1.51 r, RRID:SCR_003070 | |
| Software, algorithm | GraphPad Prism 8 | GraphPad Software | RRID:SCR_002798 | |
| Software, algorithm | EZChrom Elite | Agilent Technologies | Version 3.3.2. |
Additional files
-
Supplementary file 1
Quantification and statistical analysis.
The number of independent biological repeats (n) is shown in the figure legends. P values are shown below.
- https://cdn.elifesciences.org/articles/62174/elife-62174-supp1-v1.docx
-
Transparent reporting form
- https://cdn.elifesciences.org/articles/62174/elife-62174-transrepform-v1.docx
Download links
A two-part list of links to download the article, or parts of the article, in various formats.
Downloads (link to download the article as PDF)
Open citations (links to open the citations from this article in various online reference manager services)
Cite this article (links to download the citations from this article in formats compatible with various reference manager tools)
Iron derived from autophagy-mediated ferritin degradation induces cardiomyocyte death and heart failure in mice
eLife 10:e62174.
https://doi.org/10.7554/eLife.62174


