Social fluidity mobilizes contagion in human and animal populations
- Department of Biology, Georgetown University, United States
- Roslin Institute, University of Edinburgh, United Kingdom
- INSERM, Sorbonne Université, Institut Pierre Louis d’Épidémiologie et de Santé Publique (IPLESP UMRS 1136), F75012, France
- Department of Statistics, Eberly College of Science, Penn State University, United States
- Department of Entomology, College of Agricultural Sciences, Penn State University, United States
Figures
Figure 1 with 1 supplement
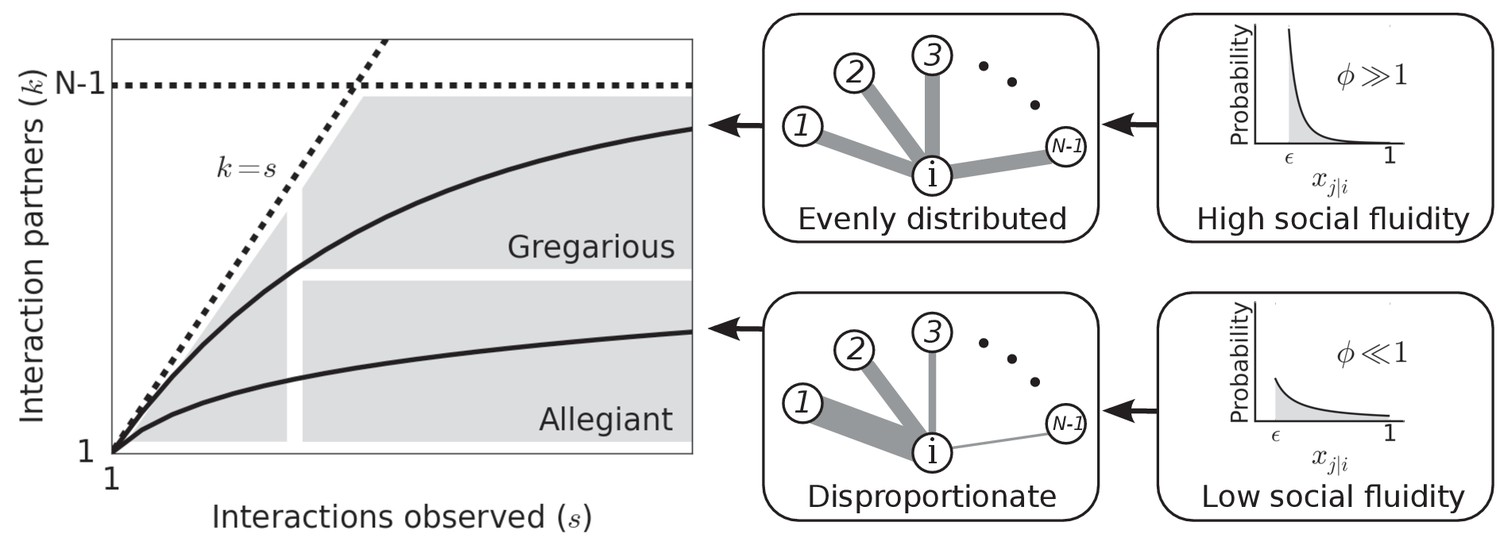
Left: Each individual can be represented as a single point on this plot.
Dashed lines mark the boundary of the region where data points can feasibly be found. The mean degree is plotted for two values of representing two possible types of social behavior; as the number of observed interactions grows, the set of social contacts increases; the rate at which it increases influences how we categorize their social behavior. Middle: The weight of the edges between and the other nodes represents the propensity of to interact with each of the other individuals in the group. Right: Probability distributions that correspond to the different levels of evenness in the contact propensities, both distributions are expressed by Equation (2).
Figure 1—figure supplement 1
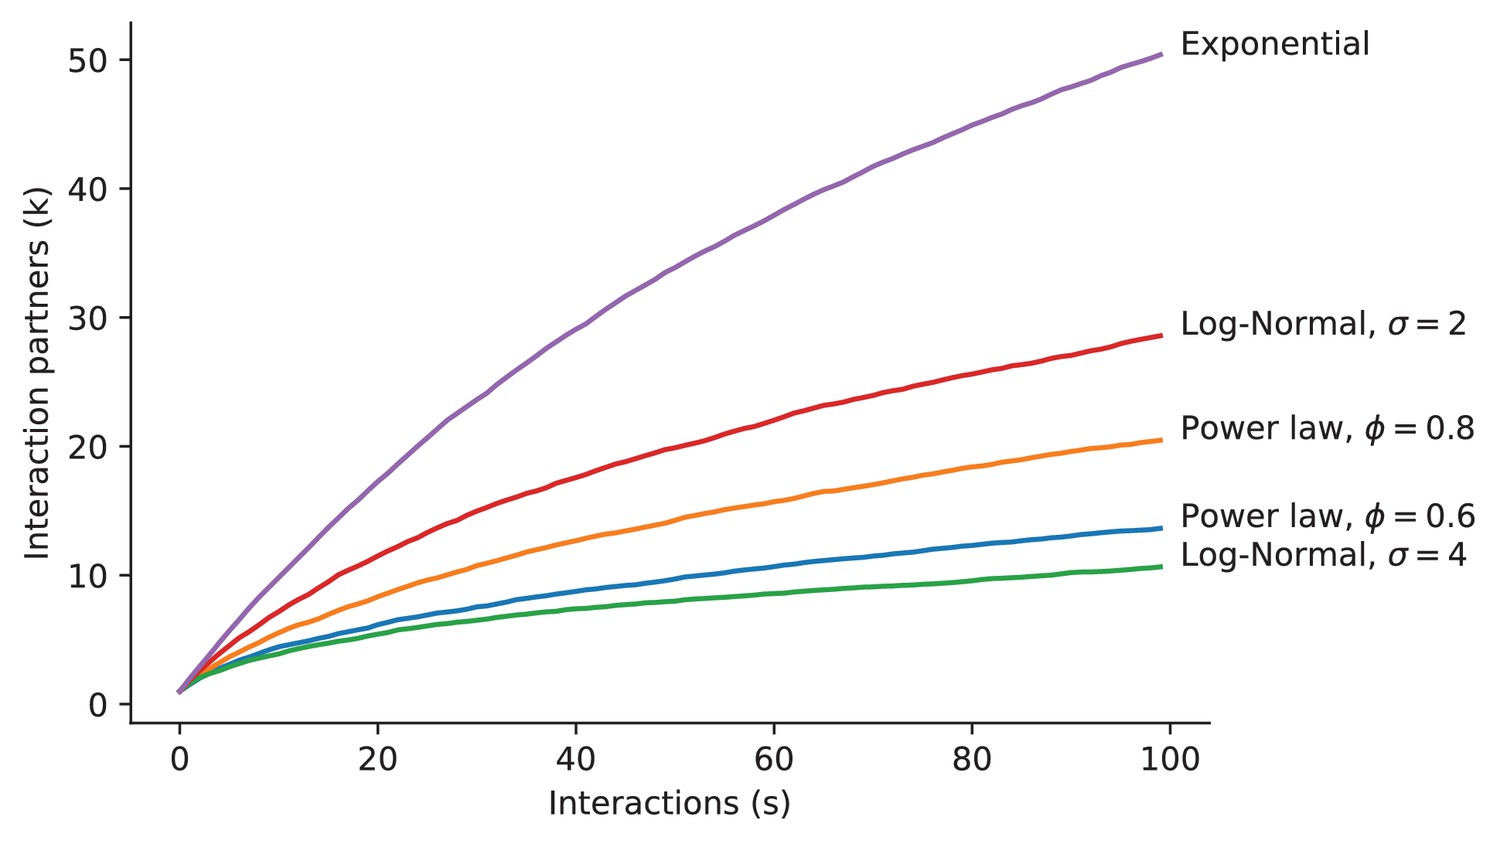
Outcomes using different forms of .
Node degree as a function of node strength produced using a range of distributions . For each distribution, contact probabilities were drawn for the focal individual and 100 other group members . Contact was simulated by selecting the interaction partner, , with probability . This was repeated 100 times and the number of distinct interaction partners was counted at each iteration. This process was repeated 100 times to get a stable average. The parameter σ is the standard deviation of the normally distributed logarithm of the random variable . Since the exponential has only one parameter, and the mean of is fixed at , there is no way to vary the exponential distribution.
Figure 2 with 2 supplements

Each point represents a human or animal system for which social fluidity was estimated.
Colors correspond to the species and the setting in the case of human networks. Different shapes are used as a visual aid. Lines represent the 95% bootstrap confidence interval. Results are organized by interaction type: aggression includes fighting and displays of dominance, food sharing refers to mouth-to-mouth passing of food, antennation is when the antenna of one insect touches any part of another, space sharing interactions occur with spatial proximity during foraging, face-to-face refers to close proximity interactions that require individuals to be facing each other, association is defined as co-membership of the same social group, and grooming is when one individual cleans another with their hand or other body part.
Figure 2—figure supplement 1
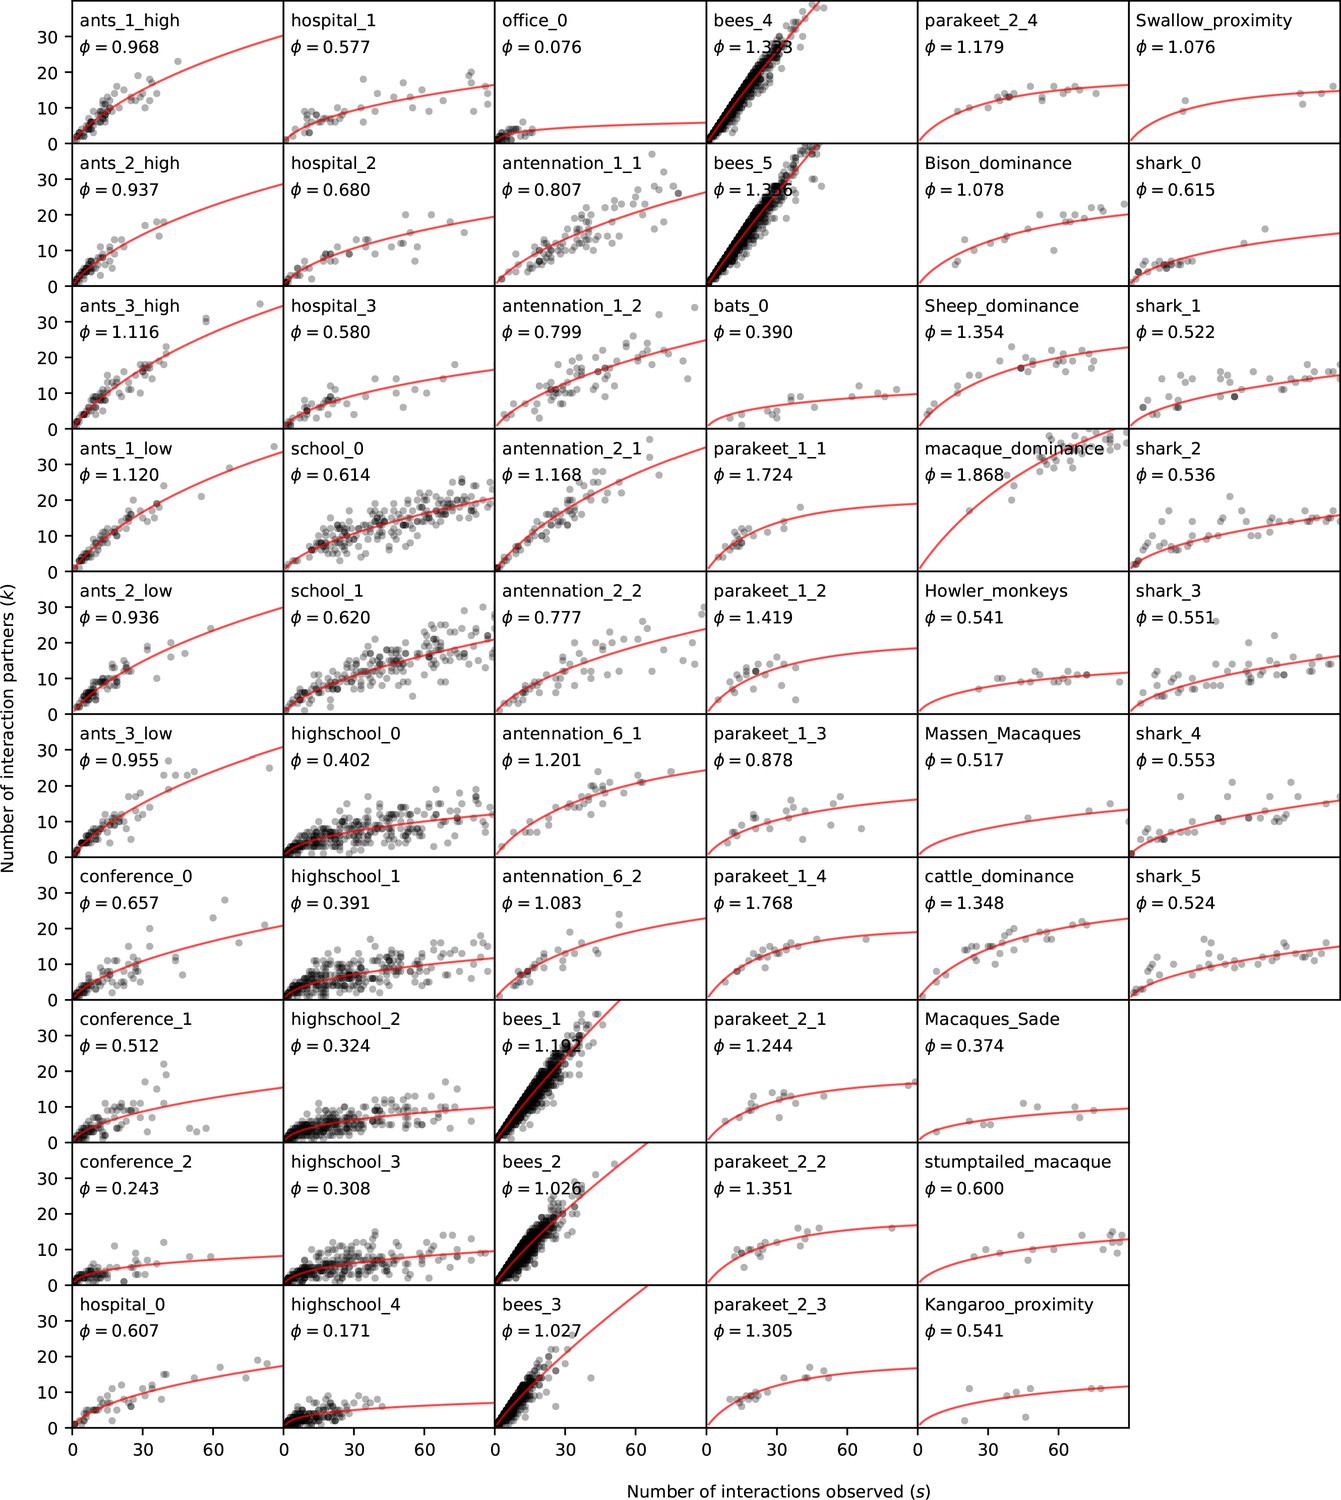
All data and fitted curves.
Raw data and least squares estimate for all networks used in this study. Each point represents one individual individual. Those who interacted more than 90 times are excluded from the figure but not from the inference of . The curve shows the expected degree (according to the model) of an individual as a function of the number of interactions.
Figure 2—figure supplement 2
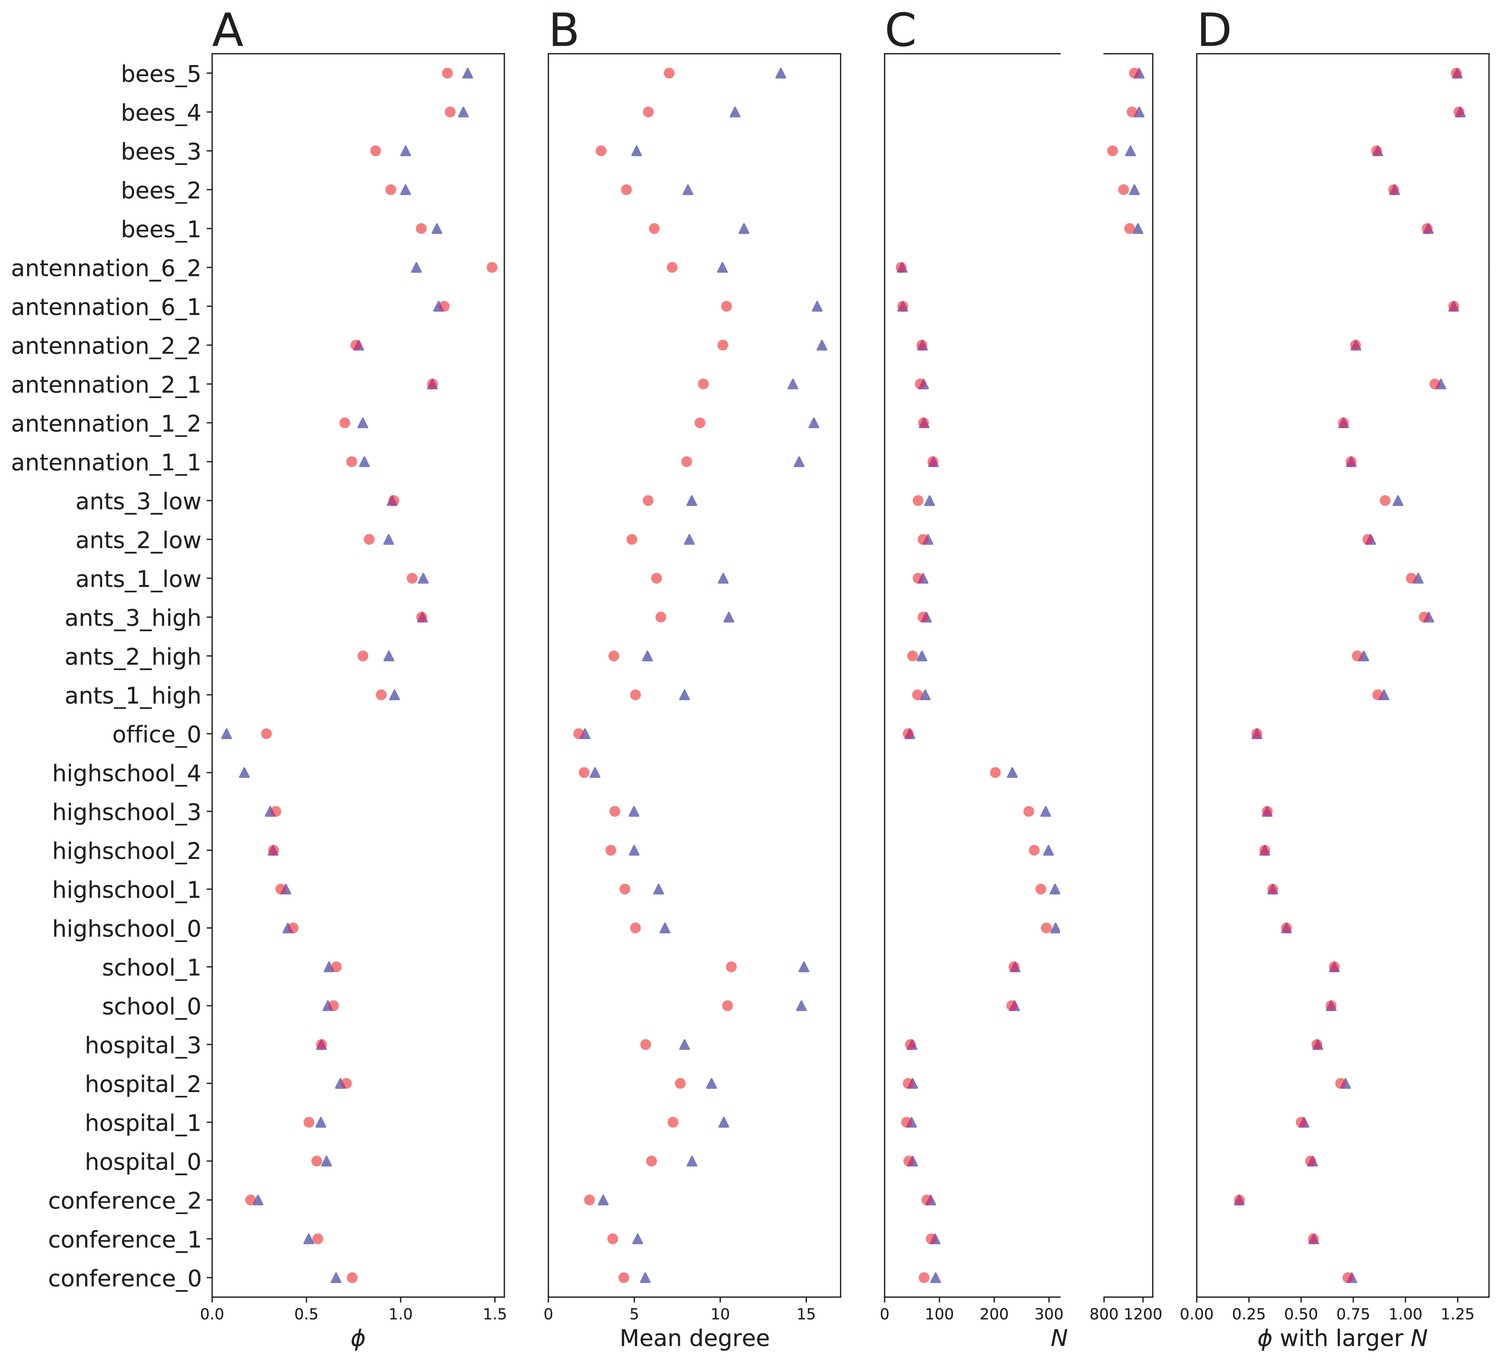
Sensitivity to changes in time frame.
Sensitivity to length of time frame of sampling. Network properties were recalculated using only the first 50% of the interactions on all network data sets for which temporal information are provided. (A) Social fluidity as estimated in the main text is shown as blue triangles, and estimated using only the first 50% of interactions is shown as red circles. In one network (highschool 4), the process for computing did not converge to a solution, this is an issue that occurs when the number of interaction partners remains very low. (B and C), mean degree of the network and number of nodes (with degree ), respectively, calculated from the full data is shown as blue triangles, and using only the first 50% of interactions as red circles. (D) Social fluidity estimated using only the first 50% of interactions is shown as blue triangles. Red circles show the value of using the first 50% of the interactions but using the value of taken from observing all the interactions. Note that this value of will be larger as it contains nodes that will be isolates, i.e. have in the 50% subsample network.
Figure 3
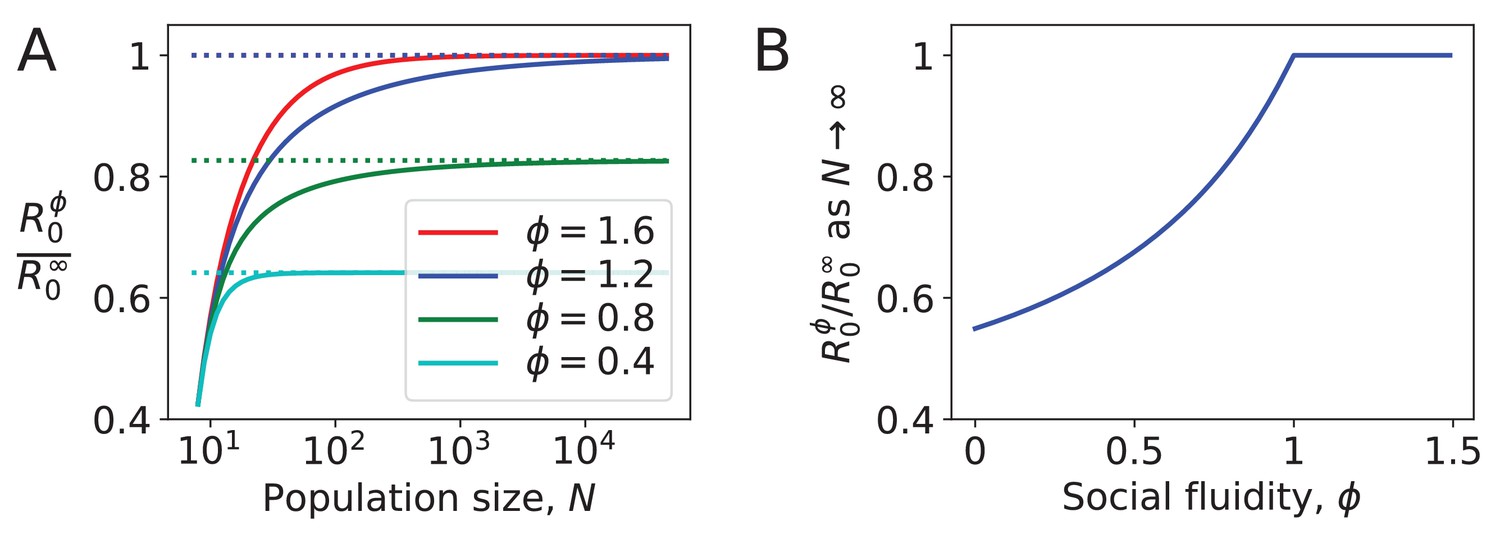
Density dependence in populations where every node has the same strength.
(A) For different values of social fluidity, , we show (from Equation (6)) as a function of (from Equation (4)) through their parametric relation with . Dashed lines show the limit for large . (B) In large populations increases with up to . Beyond this value, infections occur as frequently as they would if every new interaction occurs between a pair of individuals who have not previously interacted with each other.
Tables
Table 1
The Pearson correlation coefficient between quantities calculated on the network and the simulated disease outcomes (with ).
Results that are significant with are labeled with *. Adjusted mutual information is calculated between the variables after partitioning the set of networks into 10 equally sized rank-order classes.
| Corr. with | Adjusted MI | |
|---|---|---|
| 0.91* | 0.35 | |
| Social fluidity | 0.73* | 0.24 |
| Excess degree | 0.64* | 0.15 |
| Mean degree | 0.53* | 0.14 |
| Network size | 0.47* | 0.18 |
| Mean strength | -0.07 | -0.02 |
| Mean clustering | -0.15 | 0.12 |
| Mean edge weight | -0.45* | 0.10 |
| Edge weight heterogeneity | -0.48* | 0.21 |
| Modularity | -0.59* | 0.12 |
Additional files
-
Supplementary file 1
Supplementary tables.
- https://cdn.elifesciences.org/articles/62177/elife-62177-supp1-v1.pdf
-
Supplementary file 2
Results for all networks.
- https://cdn.elifesciences.org/articles/62177/elife-62177-supp2-v1.zip
-
Transparent reporting form
- https://cdn.elifesciences.org/articles/62177/elife-62177-transrepform-v1.docx
Download links
A two-part list of links to download the article, or parts of the article, in various formats.
Downloads (link to download the article as PDF)
Open citations (links to open the citations from this article in various online reference manager services)
Cite this article (links to download the citations from this article in formats compatible with various reference manager tools)
Social fluidity mobilizes contagion in human and animal populations
eLife 10:e62177.
https://doi.org/10.7554/eLife.62177


