Live-imaging of endothelial Erk activity reveals dynamic and sequential signalling events during regenerative angiogenesis
- Organogenesis and Cancer Program, Peter MacCallum Cancer Centre, Australia
- Sir Peter MacCallum Department of Oncology, University of Melbourne, Australia
- Department of Anatomy and Physiology, University of Melbourne, Australia
- Institute for Molecular Bioscience, The University of Queensland, St Lucia, Australia
- School of Biochemistry, Biomedical Sciences Building, University Walk, University of Bristol, United Kingdom
- Department of Biology and Biochemistry, University of Bath, Claverton Down, United Kingdom
- Innovative Cancer Models, St Anna Kinderkrebsforschung, Children’s Cancer Research Institute, Austria
- Zebrafish Platform Austria for preclinical drug screening (ZANDR), Austria
Figures
Figure 1 with 1 supplement

The EC-EKC transgenic line enables quantification of vascular Erk activity during development.
(A) Schematic representation of the fli1aep:ERK-KTR-Clover (EKC) construct, and endothelial cells (ECs) with nuclear enriched EKC (bottom left, inactive Erk-signalling) and nuclear depleted EKC localisation (bottom right, active Erk-signalling). (B–E) Lateral confocal images of the EC-EKC (B,D) and Tg(fli1a:EGFP) (C,E) embryos/larvae at 24 hours post-fertilisation (hpf) (B,C) and 5 days post-fertilisation (dpf) (D,E). Blood vessel development is not altered in EC-EKC embryos/larvae. (F–H’’) Lateral spinning disc confocal images of ISV ECs in 28 hpf EC-EKC embryos treated for 1 hr with either 0.5% dimethyl sulfoxide (DMSO) (F–F’’), with active EC Erk-signalling, or 15 μM SL327 (G–G’’) or 4 μM SU5416 (H–H’’), all of which with inactive EC Erk-signalling. Images (F-H) show fli1aep:EKC expression, while images (F’-H’) show both fli1aep:EKC and fli1a:H2B-mCherry expression. Images (F’’-H’’) show the nuclear fli1aep:EKC expression with intensity difference represented in 16 colour LUT (Fiji). The fli1a:H2B-mCherry signal was used to mask the nucleus. (I) Quantification of nucleus/cytoplasm EKC intensity in ISV tip ECs of 28 hpf embryos treated with either 0.5% DMSO (0.881, 93 ISV tip ECs, n = 20 embryos), 15 μM SL327 (1.419, 114 ISV tip ECs, n = 27 embryos), or 4 μM SU5416 (1.591, 118 ISV tip ECs, n = 27 embryos). ISV: intersegmental vessel. Statistical test: Kruskal-Wallis test was conducted for graph (I). Error bars represent standard deviation. Scale bars: 200 μm for images (B) and (D), 25 μm for image (F).
-
Figure 1—source data 1
Nuclear/cytoplasm EKC measurements in leading ISV ECs of DMSO-, SL327-, and SU5416-treated 28 hpf embryos.
- https://cdn.elifesciences.org/articles/62196/elife-62196-fig1-data1-v2.xlsx
Figure 1—figure supplement 1
The EC-EKC transgenic line reports tip-cell-enriched and cell-state-dependent Erk-signalling during primary angiogenesis.
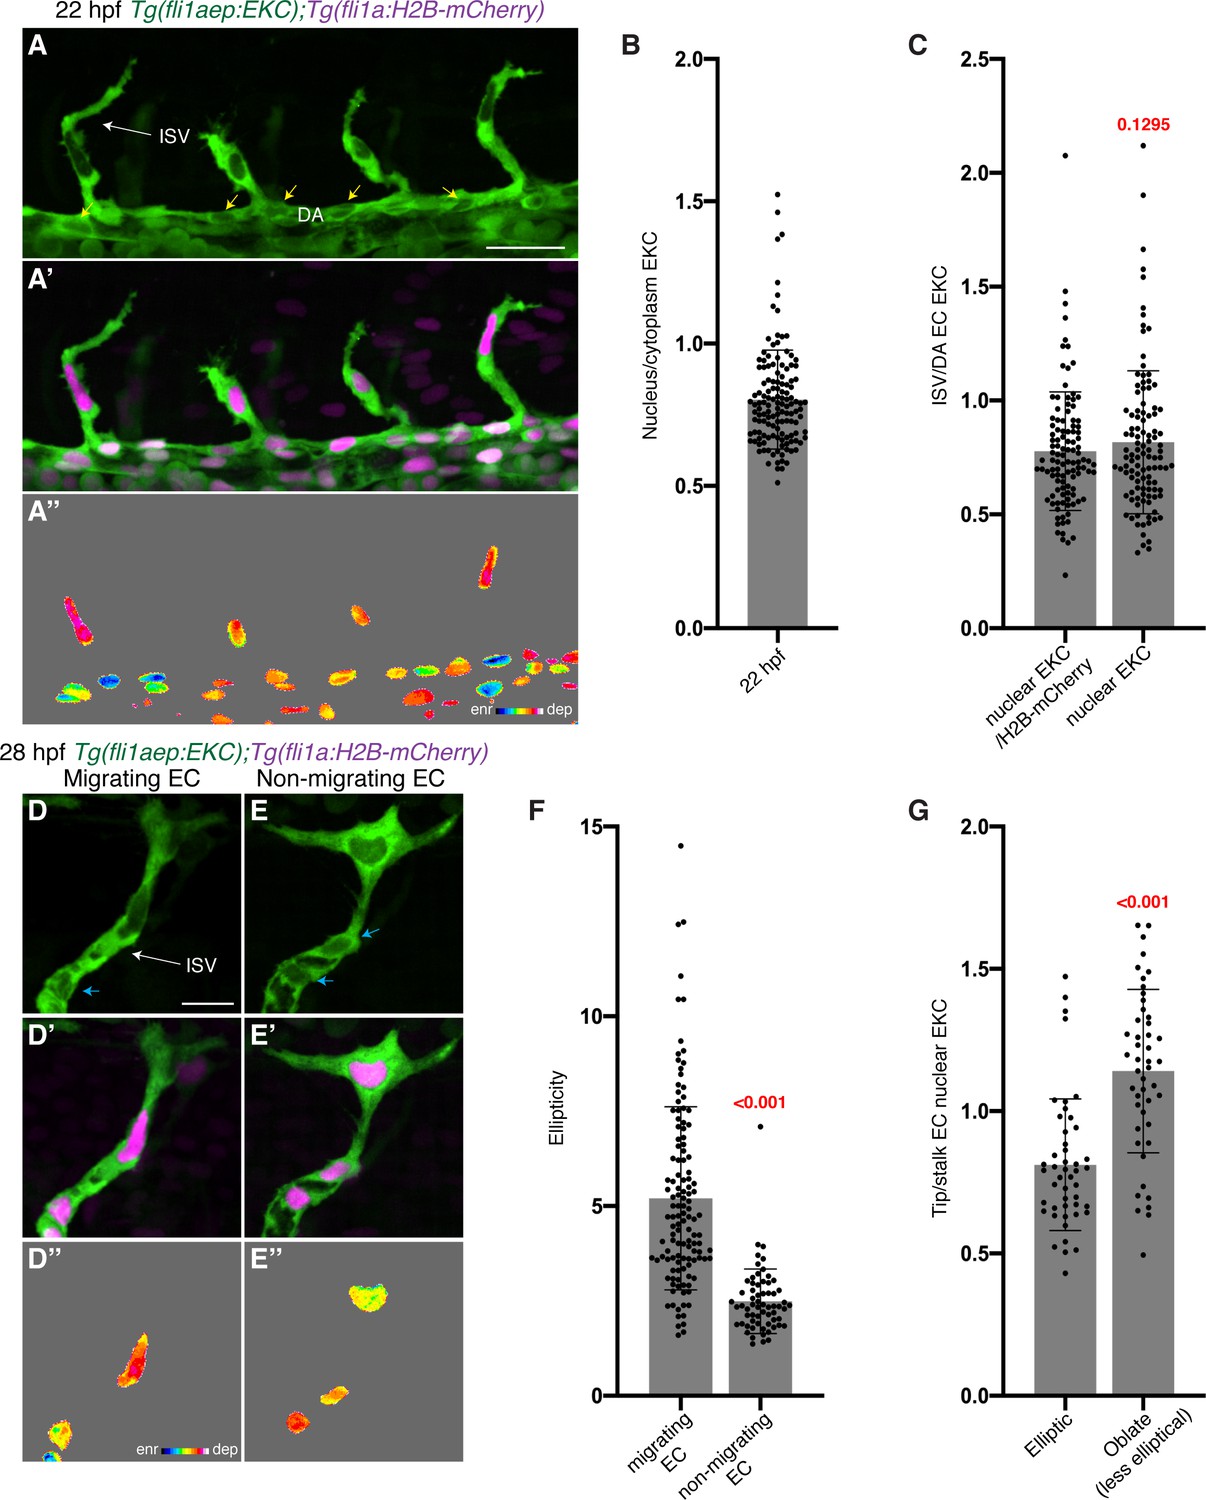
(A–A’’) Lateral spinning disc confocal images of budding ISVs in a 22 hours post-fertilisation (hpf) EC-EKC embryo show high Erk activity in ISV tip endothelial cells (ECs). Image (A) shows fli1aep:EKC expression, image (A’) shows both fli1aep:EKC and fli1a:H2B-mCherry expression, while image (A’’) shows the nuclear fli1aep:EKC expression intensity. Yellow arrows point to DA ECs with nuclear depleted EKC localisation. (B) Quantification of the nucleus/cytoplasm EKC intensity ratio in sprouting ISV tip ECs of 22 hpf embryos (0.803, 133 ECs, n = 37 embryos) showing consistently higher levels in cytoplasm. (C) Quantification of the sprouting ISV tip EC/DA stalk EC nuclear EKC intensity ratio with two different methods in 22 hpf embryos (109 ECs, n = 37 embryos). DA ECs closest to the sprouting ISV ECs were quantified. Ratios were calculated using a value of nuclear EKC/H2B-mCherry intensity in tip cells (0.777) or using a raw nuclear EKC intensity measurement alone in tip cells (0.817), both showed higher Erk activity in sprouting ISV tip ECs when compared to DA stalk ECs. (D–E’’) Nuclear ellipticity and Erk activity correlate. Lateral spinning disc confocal images of either an ISV with ‘migrating EC’ (D) or an ISV with ‘non-migrating EC’ (E) in 28 hpf EC-EKC embryos. Migrating or non-migrating determined by position relative to the dorsal longitudinal anastomotic vessel (DLAV) (D and E) fli1aep:EKC expression; (D’ and E’) fli1aep:EKC and fli1a:H2B-mCherry; (D’’ and E’’) nuclear fli1aep:EKC expression intensity. Light blue arrow shows ISV stalk ECs with nuclear depleted EKC localisation. (F) Quantification of EC ellipticity in ‘migrating’ (125 ECs, n = 45 embryos) and ‘non-migrating’ ISV leading ECs based on position relative to DLLV (63 ECs, n = 35 embryos) at 28 hpf. (G) More migratory ECs, with more elliptical nuclei, show higher Erk activity. Quantification of tip/stalk ISV EC nuclear EKC intensity for the most elliptic (47 ECs, n = 30 embryos) or less elliptic (oblate) nuclei (47 ECs, n = 29 embryos) in 28 hpf embryos. Most elliptic (upper quartile of all migrating ECs in F) and oblate (lower quartile of all non-migrating ECs in F) nuclei were quantified. ISV: intersegmental vessel; DA: dorsal aorta. Statistical test: Mann-Whitney test was conducted for graphs (C), (F), and (G). Error bars represent standard deviation. Scale bars: 25 μm for image (A), 15 μm for image (D).
-
Figure 1—figure supplement 1—source data 1
EKC measurements in ISV ECs at 22 and 28 hpf.
- https://cdn.elifesciences.org/articles/62196/elife-62196-fig1-figsupp1-data1-v2.xlsx
Figure 2
Tip cells show asymmetric Erk activity immediately following cell division.
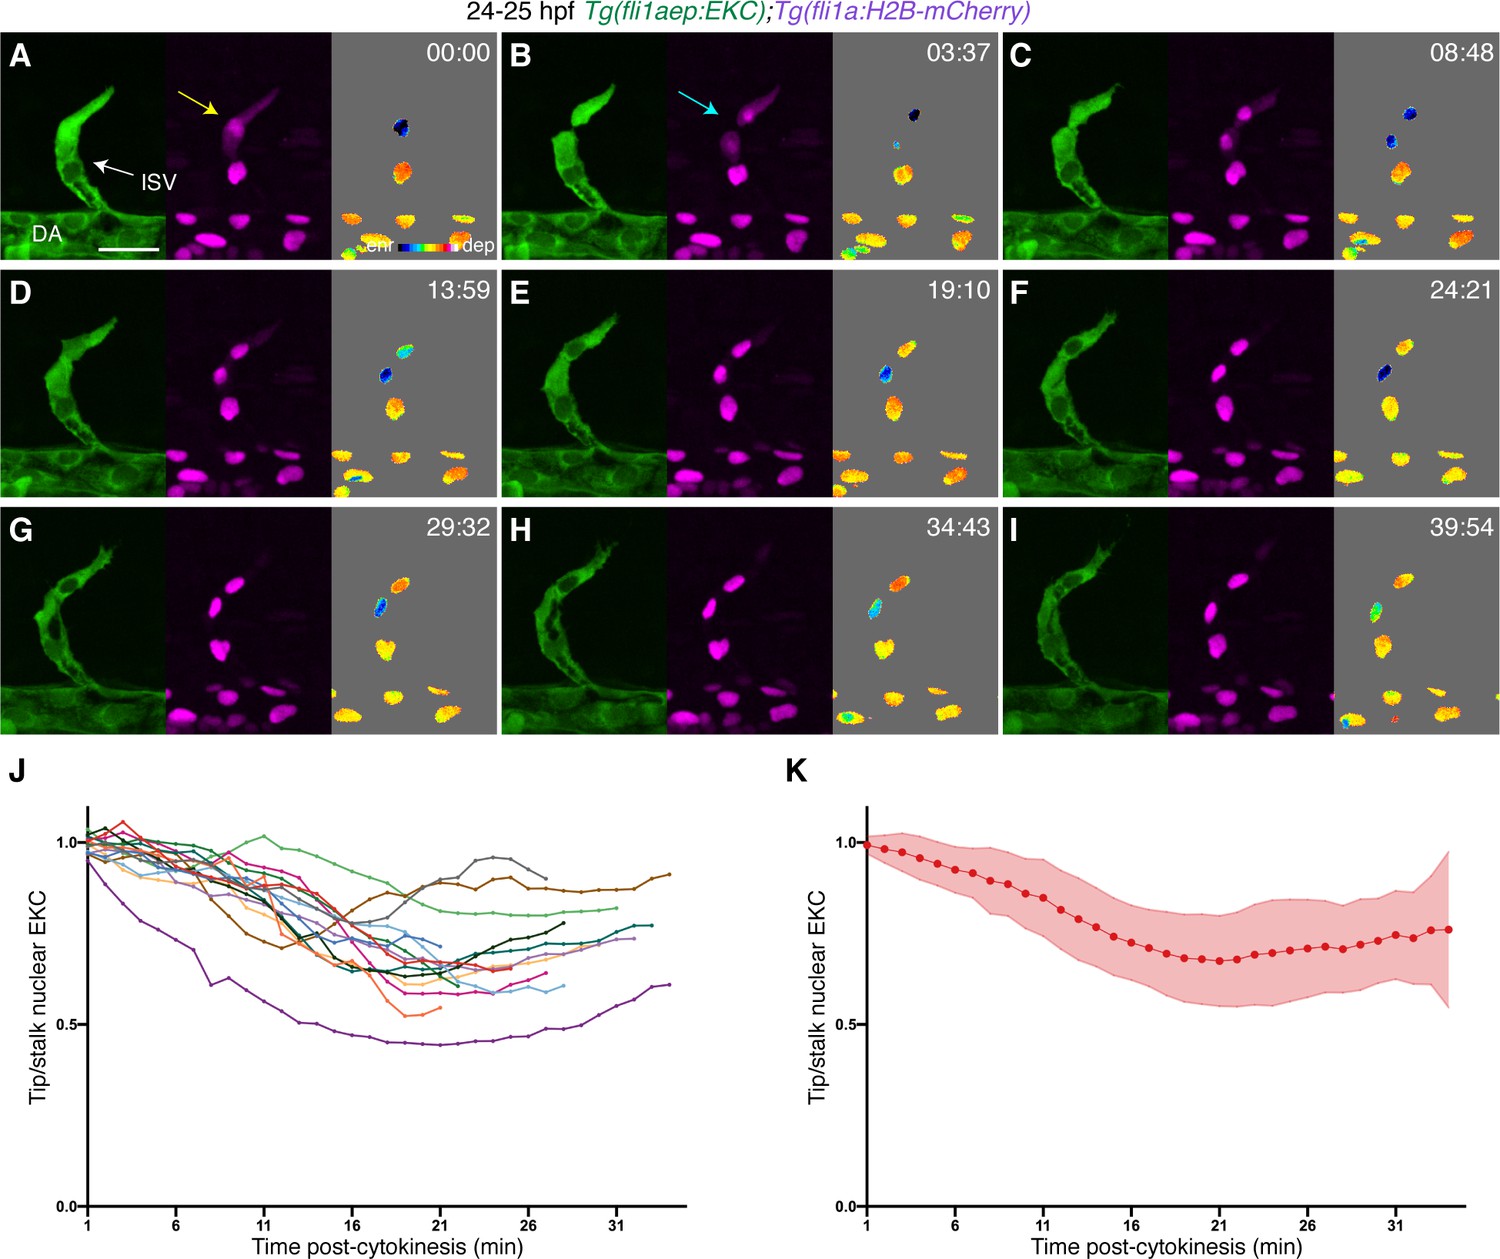
(A–I) Still images from Video 1 showing ISV endothelial cells (ECs) in a 24–25 hours post-fertilisation (hpf) EC-EKC embryo at indicated timepoints. The tip daughter cell has higher Erk activity when compared to the stalk daughter cell immediately after cell division. Left panels show fli1aep:EKC expression, middle panels show fli1a:H2B-mCherry expression, and right panels show the nuclear fli1aep:EKC intensity. The fli1a:H2B-mCherry signal was used to mask the nucleus. The yellow arrow indicates a tip ISV EC with cytoplasmic fli1a:H2B-mCherry expression. The light blue arrow indicates a tip ISV EC that has undergone cytokinesis. (J,K) Quantification of tip/stalk nuclear EKC intensity of daughter ECs post-cytokinesis (14 EC division events, n = 14 embryos). Graph (J) shows quantification of individual biological replicates and graph (K) shows the average of all biological replicates. ISV: intersegmental vessel; DA: dorsal aorta. Error bars represent standard deviation. Scale bar: 25 μm.
-
Figure 2—source data 1
Tip/stalk nuclear EKC measurements in ISV ECs following cell division.
- https://cdn.elifesciences.org/articles/62196/elife-62196-fig2-data1-v2.xlsx
Figure 3 with 3 supplements

Wounded vessels rapidly activate Erk independent of macrophages or Vegfr-signalling.
(A,B) Lateral confocal images of a 4 days post-fertilisation (dpf) Tg(kdrl:EGFP) larva following vessel wounding (post-ablation). Image (A) shows the kdrl:EGFP expression and image (B) shows the trans-light image of image (A). Ablated ISV, adjacent ISVs, and the wounded site are indicated with white arrows. (C) Schematic representation of imaging schedule for larvae in images (D-G) and Videos 3–5. (D–G’) Still images from Video 4 (D–E’) and Video 5 (F–G’) showing ISV endothelial cells (ECs) before (pre-ablation) and after vessel wounding. Ablated and adjacent ISV ECs rapidly activate Erk-signalling. (D-G) fli1aep:EKC expression; (D’-G’) nuclear intensity. (H,I) Quantification of post-/pre-ablation nuclear EKC intensity of ECs in non-ablated control ISVs (black, 24 ECs, n = 8 larvae), ablated ISVs (red, 27 ECs, n = 9 larvae), and adjacent ISVs (light blue, 27 ECs, n = 9 larvae). (H) shows quantification of individual ECs and (I) shows the average of all biological replicates. Green dotted line indicates 15 min post-ablation (mpa). (J) Quantification of post-/pre-ablation nuclear EKC intensity 15 mpa in ECs of non-ablated control ISVs (103 ECs, n = 34 larvae), ablated venous ISVs (75 ECs, n = 25 larvae), and ablated arterial ISVs (57 ECs, n = 19 larvae). Both venous and arterial ISV ECs activate Erk-signalling. (K) Quantification of post-/pre-ablation nuclear EKC intensity 15 mpa in ECs of non-ablated uninjected control ISVs (45 ECs, n = 15 larvae), non-ablated spi1/csf3r morphant ISVs (42 ECs, n = 14 larvae), uninjected control ISVs (45 ablated/adjacent ISV ECs, n = 15 larvae), and spi1/csf3r morphant ISVs (56 ablated ISV ECs and 57 adjacent ISV ECs, n = 19 larvae). Macrophages are not required to rapidly activate Erk-signalling in ablated or adjacent ISV ECs. (L) Quantification of post-/pre-ablation nuclear EKC intensity 15 mpa in ECs of 0.5% dimethyl sulfoxide (DMSO)-treated non-ablated control ISVs (33 ECs, n = 11 larvae) and ISVs of larvae treated with either 0.5% DMSO (42 ablated/adjacent ISV ECs, n = 14 larvae), 15 μM SL327 (39 ablated/adjacent ISV ECs, n = 13 larvae), 4 μM SU5416 (36 ablated/adjacent ISV ECs, n = 12 larvae), 10 μM SU5416 (42 ablated/adjacent ISV ECs, n = 14 larvae), or 500 nM AV951 (42 ablated/adjacent ISV ECs, n = 14 larvae). Vegfr-signalling is not required to rapidly activate Erk-signalling in ablated or adjacent ISV ECs. ISV: intersegmental vessel. Statistics: permutation test was conducted for graph (H). Kruskal-Wallis test was conducted for graphs (J-L). Error bars represent standard deviation. White dotted lines/circle shows the wounded sites of each larva. Scale bar: 100 μm for image (A), 20 μm for image (D).
-
Figure 3—source data 1
Post-/pre-ablation nuclear EKC measurements in control, ablated, and adjacent ISV ECs.
- https://cdn.elifesciences.org/articles/62196/elife-62196-fig3-data1-v2.xlsx
Figure 3—figure supplement 1
Rapid Erk activation is largely restricted to wounded and adjacent ISV ECs.
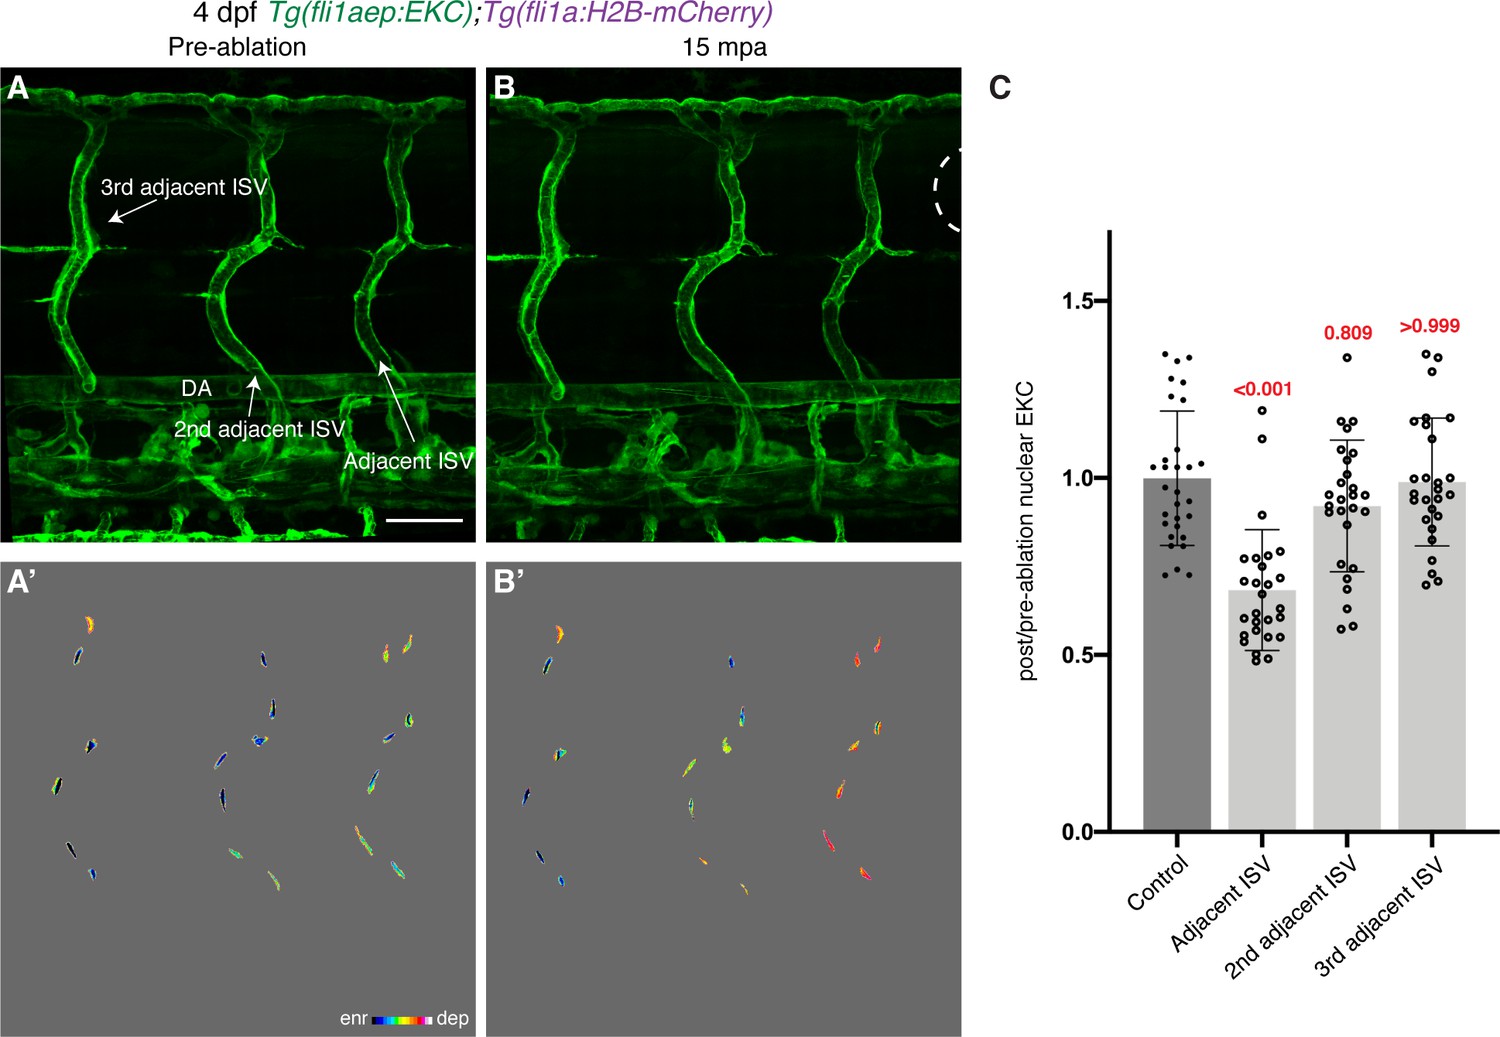
(A–B’) Lateral confocal images of 4 days post-fertilisation (dpf) EC-EKC larvae pre-ablation (A,A’) and 15 min post-ablation (mpa) (B,B’). Immediately adjacent ISV endothelial cells (ECs) show rapid Erk activation, while Erk activity in second and third adjacent ISV ECs is largely unchanged. White dotted line shows the wounded site. (C) Quantification of post-/pre-ablation nuclear EKC intensity at 15 mpa in ECs of non-ablated control ISVs (30 ECs, n = 10 larvae), and adjacent (27 ECs, n = 9 larvae), second adjacent (27 ECs, n = 9 larvae), and third adjacent ISVs (27 ECs, n = 9 larvae). DA, dorsal aorta; ISV: intersegmental vessel. Statistical test: Kruskal-Wallis test was conducted for graph (C). Error bars represent standard deviation. Scale bar: 50 μm for image (A).
-
Figure 3—figure supplement 1—source data 1
Post-/pre-ablation nuclear EKC measurements in adjacent, second adjacent, and third adjacent ISV ECs 15 mpa.
- https://cdn.elifesciences.org/articles/62196/elife-62196-fig3-figsupp1-data1-v2.xlsx
Figure 3—figure supplement 2
Macrophages are not required for rapid Erk activation following vessel wounding.
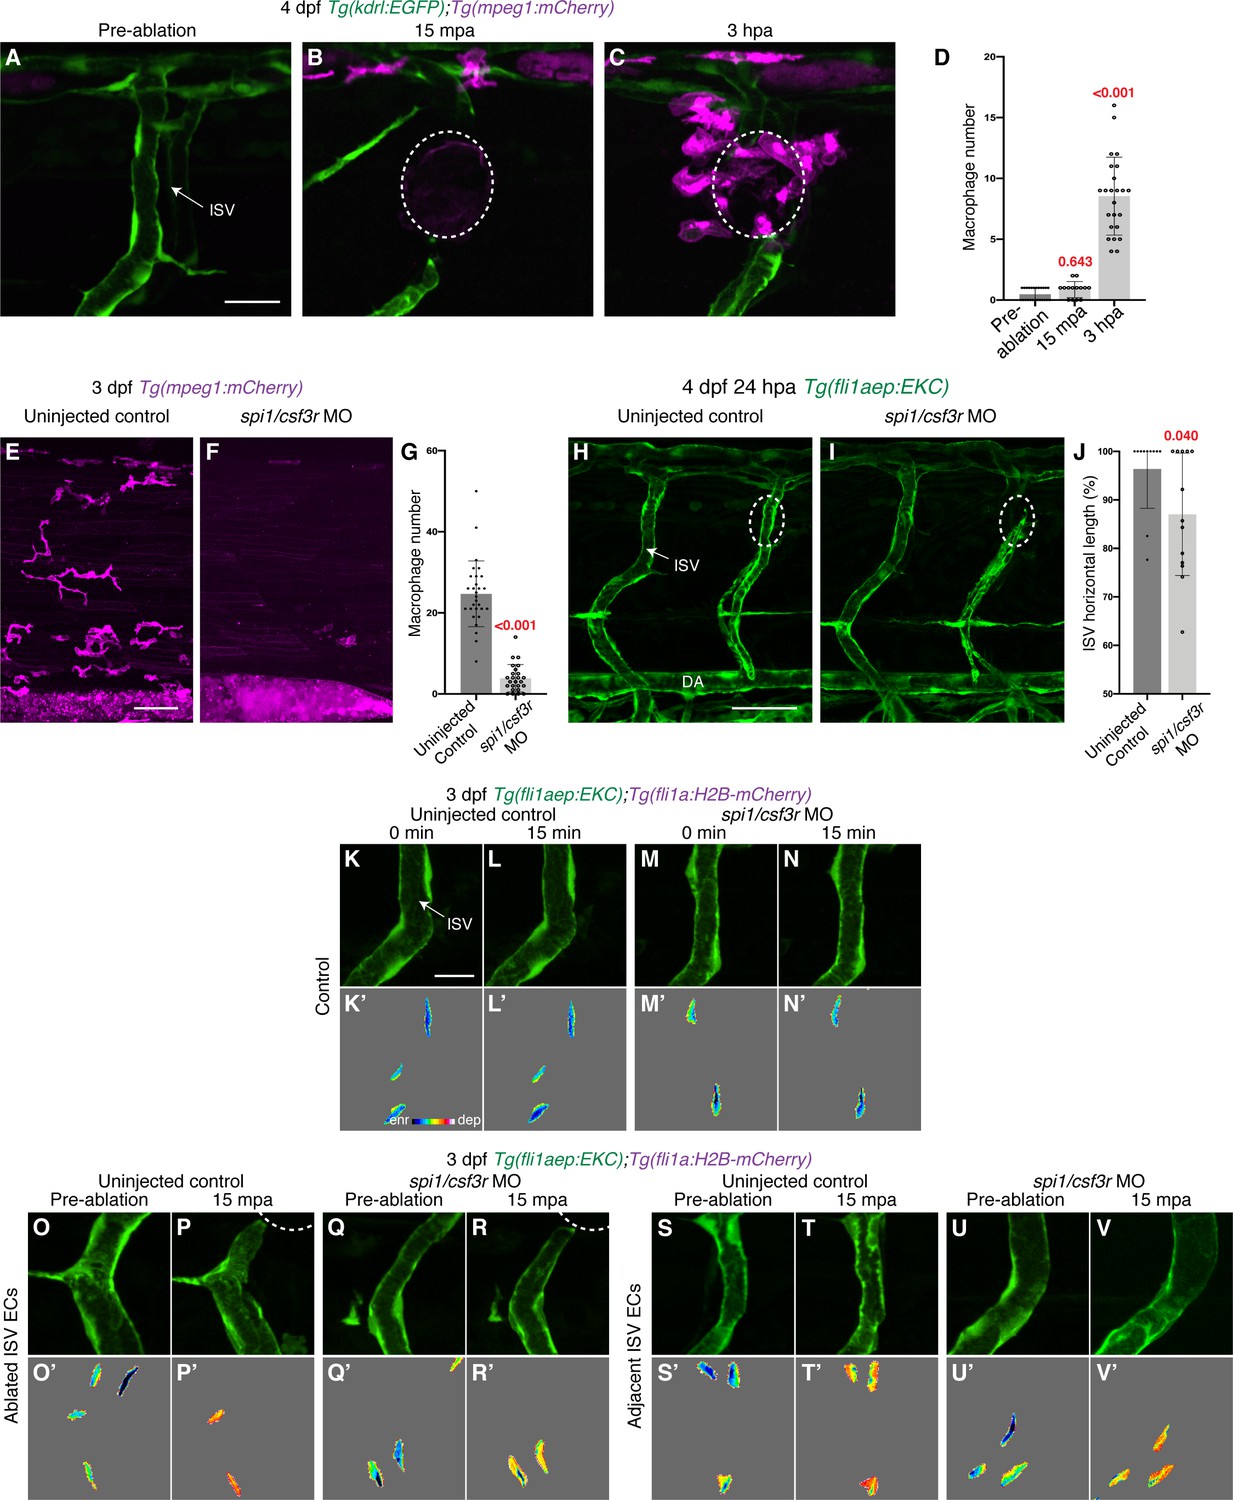
(A–C) Lateral spinning disc confocal images of 4 days post-fertilisation (dpf) Tg(kdrl:EGFP);Tg(mpeg1:mCherry) larvae pre-ablation (A), 15 min post-ablation (mpa) (B), or 3 hours post-ablation (hpa) (C). Macrophages are recruited to the wounded site by 3 hpa but not by 15 mpa. (D) Quantification of macrophage number recruited to the wounded site pre-ablation (n = 25 embryos), 15 mpa (n = 14 embryos), or 3 hpa (n = 24 embryos). (E, F) Lateral spinning disc confocal images of 3 dpf Tg(mpeg1:mCherry) uninjected control (E) or spi1/csf3r morphants (F). (G) Quantification of macrophage number within the trunk spanning three somites length in 3 dpf Tg(mpeg1:mCherry) uninjected control (n = 29 embryos) or spi1/csf3r morphants (n = 25 embryos). (H, I) Macrophages are required for vessel regeneration. Lateral confocal images of 24 hpa, 4 dpf, Tg(fli1aep:EKC) uninjected control (H) or spi1/csf3r morphants (I). (J) Quantification of ISV horizontal length (as percentage of control) for ablated ISVs in 24 hpa, 4 dpf, EC-EKC uninjected control (n = 11 larvae) or spi1/csf3r morphants (n = 13 larvae). (K–V’) Lateral spinning disc confocal images of ISV endothelial cells (ECs) in 3 dpf EC-EKC uninjected control (K–L’, O–P’, S–T’) and spi/csf3r morphants (M–N’, Q–R’, U–V’). Erk-signalling is rapidly activated in both ablated and adjacent ISV ECs in larvae with a reduced macrophage number. Images (K-N’) show non-ablated control ISV ECs, images (O-R’) show ablated ISV ECs, and images (S-V’) show adjacent ISV ECs. Images (O, Q, S, U) were taken pre-ablation and images (P, R, T, V) were taken 15 mpa. Images (K-V) show the fli1aep:EKC expression and images (K’-V’) show the nuclear fli1aep:EKC intensity. ISV: intersegmental vessel. Statistical test: Kruskal-Wallis test was conducted for graph (D) and Mann-Whitney test was conducted for graphs (G and J). Error bars represent standard deviation. White dotted lines/circles show the wounded sites of each embryo/larva. Scale bars: 20 μm for image (A), 50 μm for images (E) and (H), and 15 μm for image (K).
-
Figure 3—figure supplement 2—source data 1
Measurements of macrophage number and ISV length.
- https://cdn.elifesciences.org/articles/62196/elife-62196-fig3-figsupp2-data1-v2.xlsx
Figure 3—figure supplement 3
Vegfr-signalling is not required for rapid Erk activation following vessel wounding.
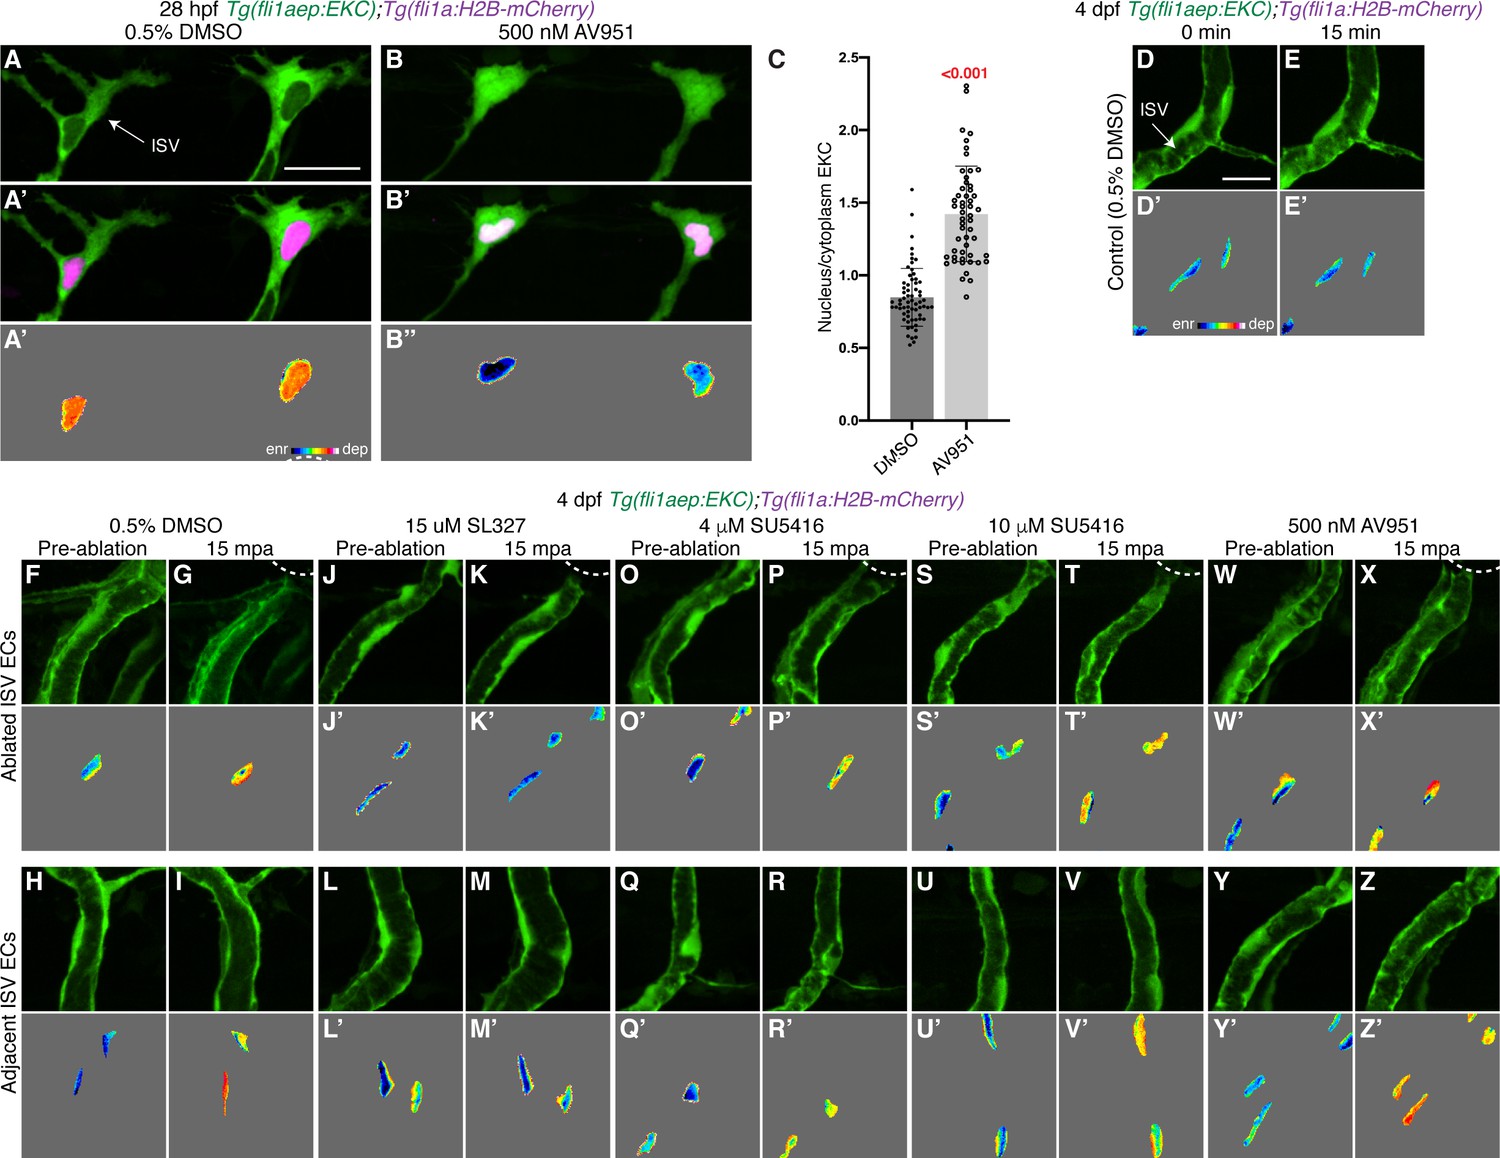
(A–B’’) Lateral spinning disc confocal images of ISV endothelial cells (ECs) in 28 hours post-fertilisation (hpf) EC-EKC embryos treated for an hour with either 0.5% dimethyl sulfoxide (DMSO) (A–A’’), with active EC Erk-signalling, or 500 nM AV951 (B–B’’), with inactive EC Erk-signalling. Images (A) and (B) show the fli1aep:EKC expression, while images (A’) and (B’) show both the fli1aep:EKC and the fli1a:H2B-mCherry expression. Images (A’’) and (B’’) show the nuclear fli1aep:EKC intensity. (C) Quantification of nucleus/cytoplasm EKC intensity in ISV tip ECs of 28 hpf embryos treated with either 0.5% DMSO (0.849, 65 ECs, n = 14 embryos) or 500 nM AV951 (1.423, 53 ECs, n = 12 embryos). (D–Z’) Vegfr-signalling inhibitors do not block rapid Erk-signalling activation in ablated and adjacent ISVs following vessel wounding. Lateral spinning disc confocal images of ISV ECs in 4 days post-fertilisation (dpf) EC-EKC larvae treated with either 0.5% DMSO (D–I’), 15 μM SL327 (J–M’), 4 μM SU5416 (O–R’), 10 μM SU5416 (S–V’), or 500 nM AV951 (W–Z’). Images (D-E’) show non-ablated control ISV ECs. Images (F-G’), (J-K’), (O-P’), (S-T’), and (W-X’) show ablated ISV ECs. Images (H-I’), (L-M’), (Q-R’), (U-V’), and (Y-Z’) show adjacent ISV ECs. Images (F, H, J, L, O, Q, S, U, W, Y) were taken pre-ablation and images (G, I, K, M, P, R, T, V, X, Z) were taken 15 min post-ablation (mpa). Images (D-Z) show the fli1aep:EKC expression and images (D’-Z’) show the nuclear fli1aep:EKC intensity. White dotted lines show the wounded sites of each larva. ISV: intersegmental vessel. Statistical test: Mann-Whitney test was conducted for graph (C). Error bars represent standard deviation. Scale bars: 25 μm for image (A), 15 μm for image (D).
-
Figure 3—figure supplement 3—source data 1
Nuclear/cytoplasm EKC measurements in leading ISV ECs of DMSO- and AV951-treated 28 hpf embryos.
- https://cdn.elifesciences.org/articles/62196/elife-62196-fig3-figsupp3-data1-v2.xlsx
Figure 4 with 2 supplements
Wounded but not adjacent vessels maintain high Erk activity as the regenerative response proceeds.
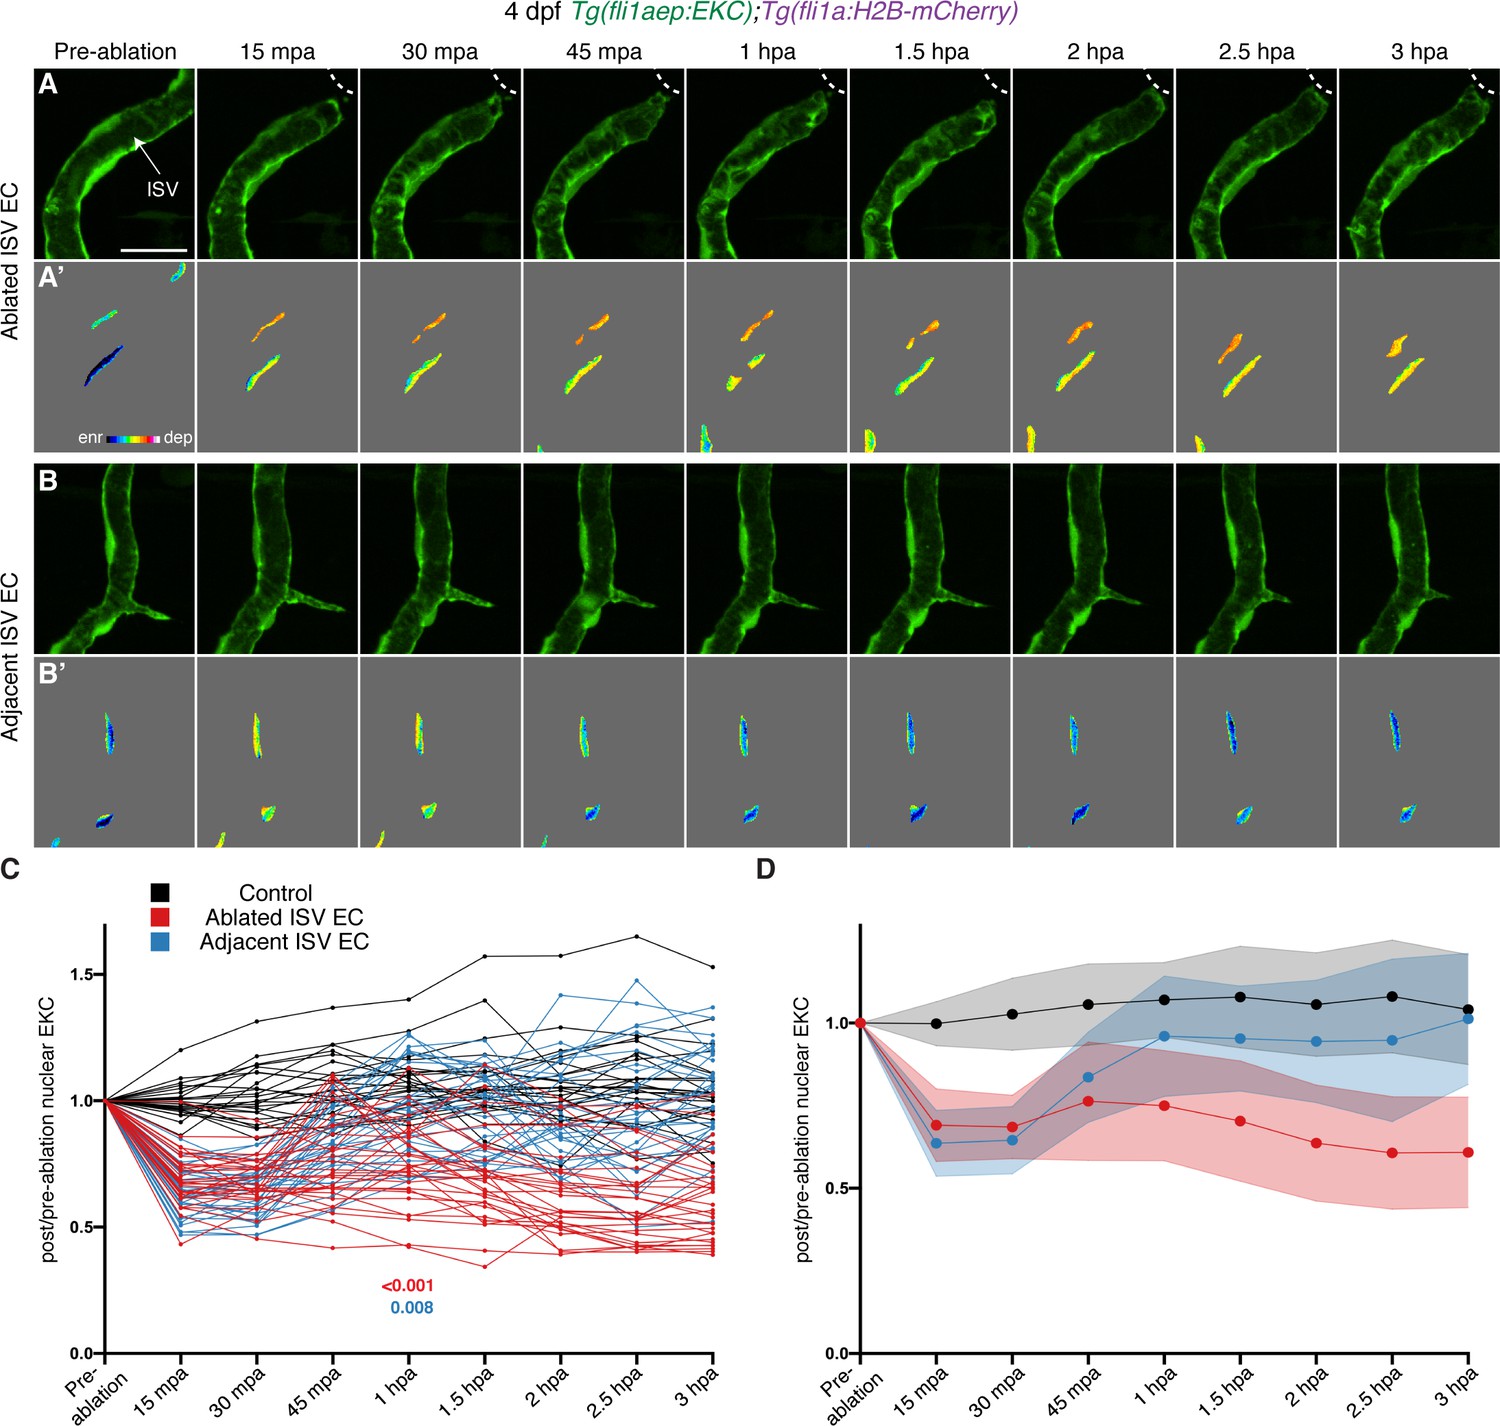
(A–B’) Lateral spinning disc confocal images of ablated (A) and adjacent ISVs (B) of a 4 days post-fertilisation (dpf) EC-EKC larva before and following vessel wounding at indicated timepoints. Erk activity is progressively lost in the adjacent but retained in the wounded ISV endothelial cells (ECs). Images (A) and (B) show fli1aep:EKC expression, and images (A’) and (B’) show nuclear fli1aep:EKC intensity. White dotted lines show the wounded site. (C,D) Quantification of post-/pre-ablation nuclear EKC intensity of ECs in non-ablated control ISVs (black, 24 ECs, n = 8 larvae), ablated ISVs (red, 30 ECs, n = 10 larvae), and adjacent ISVs (light blue, 30 ECs, n = 10 larvae) before and after vessel wounding at indicated timepoints. Graph (C) shows the quantification of individual ECs and graph (D) shows the average of all biological replicates. At 1 hour post-ablation (hpa): control vs ablated ISV ECs: p>0.001; control vs adjacent ISV ECs: p=0.108 (Kruskal-Wallis test). ISV: intersegmental vessel. Statistical test: permutation test was conducted for graph (C). Error bars represent standard deviation. Scale bar: 20 μm.
-
Figure 4—source data 1
Post-/pre-ablation nuclear EKC measurements in control, ablated, and adjacent ISV ECs from pre-ablation to 3 hpa.
- https://cdn.elifesciences.org/articles/62196/elife-62196-fig4-data1-v2.xlsx
Figure 4—figure supplement 1
Distinct Erk activity between ablated and adjacent ISV ECs 3 hpa.
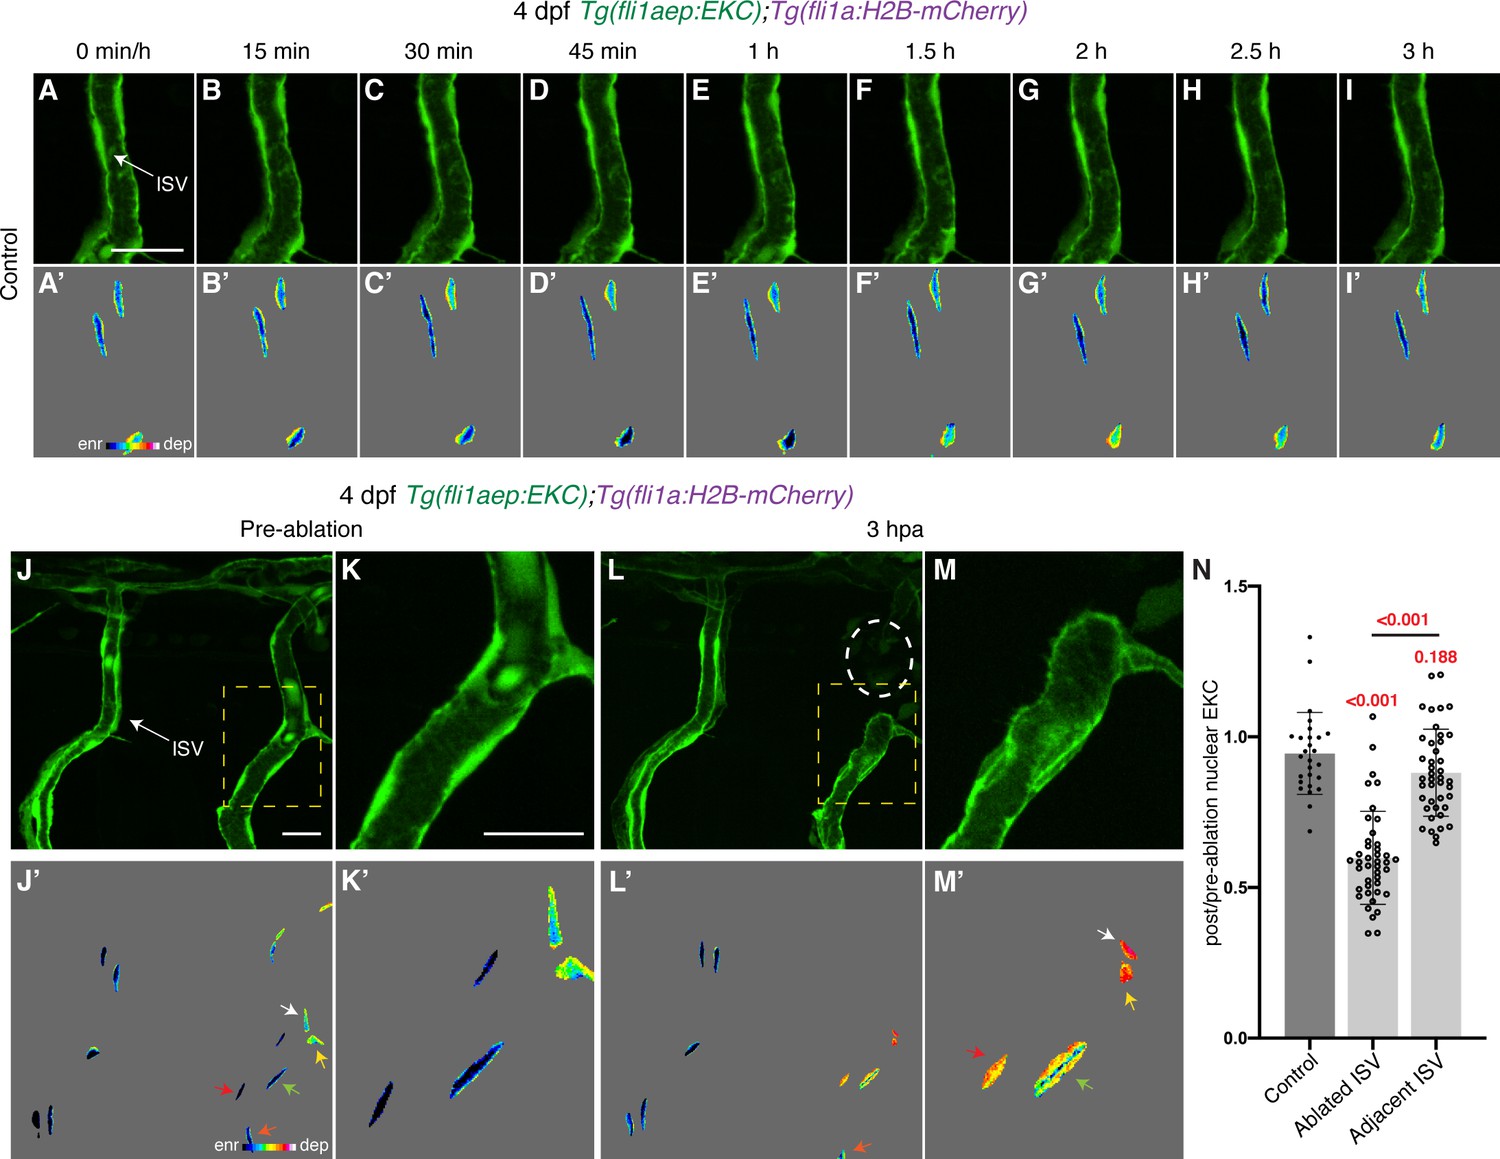
(A–I’) Lateral spinning disc confocal images of ISV endothelial cells (ECs) in 4 days post-fertilisation (dpf) EC-EKC larvae at indicated timepoints. Images (A-I) show fli1aep:EKC expression, while images (A’-I’) show the nuclear fli1aep:EKC intensity. (J–M’) Erk-signalling is activated in ablated, but not adjacent ISV endothelial cells (ECs) at 3 hours post-ablation (hpa). Lateral spinning disc confocal images of ablated and adjacent ISV ECs in 4 dpf EC-EKC larvae before (J–K’) and 3 hr following vessel wounding (L–M’). Images (J-M) show fli1aep:EKC expression, while images (J’-M’) show the nuclear fli1aep:EKC intensity. Images (K) and (M) are higher magnification images of the yellow boxes in images (J) and (L). White circle in image (L) shows the wounded site. Arrows indicate the first (white), second (yellow), third (green), fourth (red), and fifth (orange) ECs from the wounded site. (N) Quantification of post-/pre-ablation nuclear EKC intensity of ECs in non-ablated control ISVs (27 ECs, n = 9 larvae), ablated ISVs (42 ECs, n = 14 larvae), and adjacent ISVs (42 ECs, n = 14 larvae) 3 hpa. ISV: intersegmental vessel. Statistical test: Kruskal-Wallis test was conducted for graph (N). Error bars represent standard deviation. Scale bars: 20 μm for image (A), 20 μm for images (J) and (K).
-
Figure 4—figure supplement 1—source data 1
Post-/pre-ablation nuclear EKC measurements in control, ablated, and adjacent ISV ECs at 3 hpa.
- https://cdn.elifesciences.org/articles/62196/elife-62196-fig4-figsupp1-data1-v2.xlsx
-
Figure 4—figure supplement 1—source data 2
Post-/pre-ablation nuclear EKC measurements in control and control ablated ISV ECs at 15 mpa and 3 hpa.
- https://cdn.elifesciences.org/articles/62196/elife-62196-fig4-figsupp1-data2-v2.xlsx
Figure 4—figure supplement 2
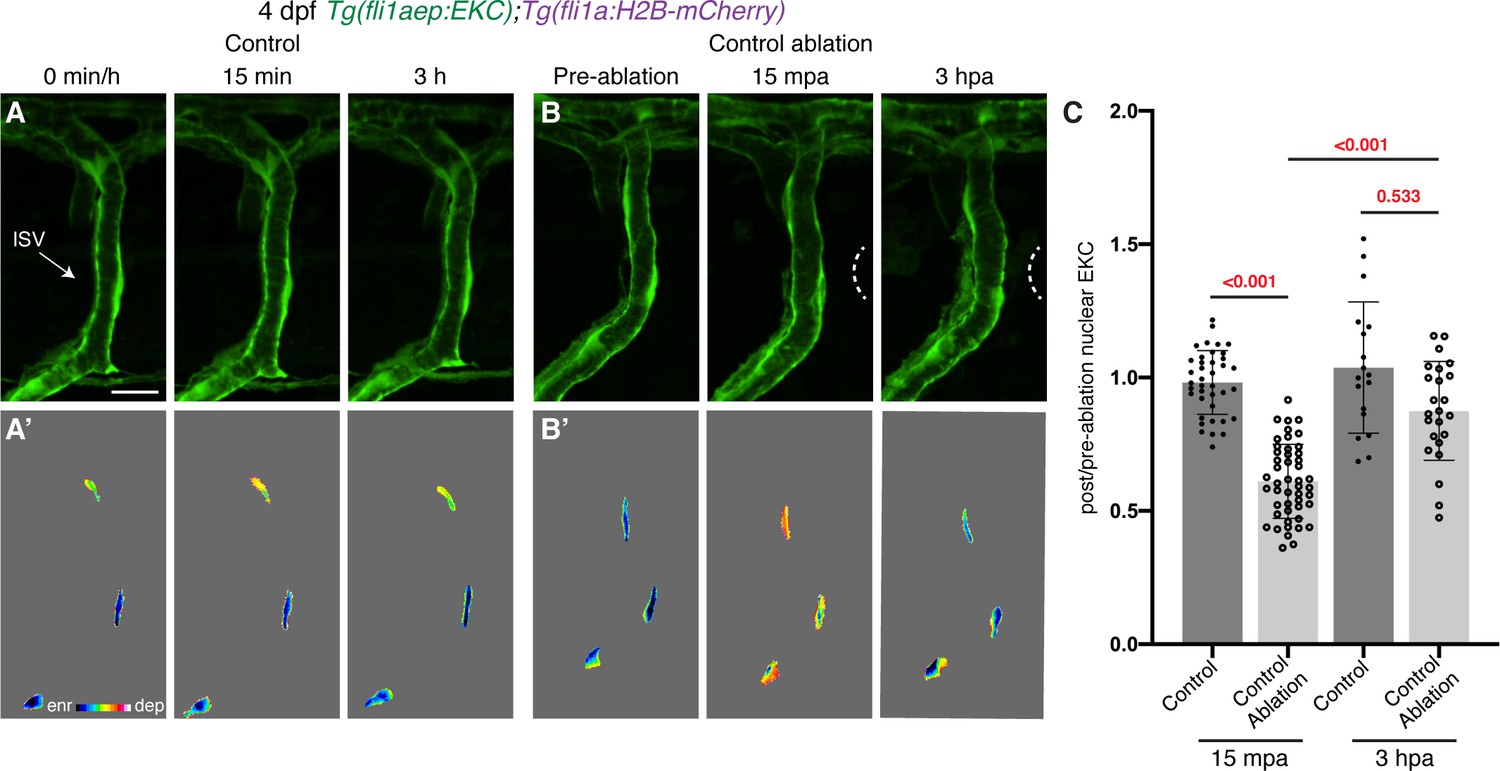
Vessel wounding is required for sustained Erk activity in ablated ISV ECs.
(A,B) Vessels that are not wounded do not sustain Erk activity. Lateral spinning disc confocal images of ISV endothelial cells (ECs) in 4 days post-fertilisation (dpf) EC-EKC larvae at 0 min/pre-ablation (left), 15 min/15 min post-ablation (mpa) (middle), or 3 hr/3 hours post-ablation (hpa) (right). Image (A) shows an ISV in a non-ablated control larva and image (B) shows an ISV in a larva with tissue ablated in between two ISVs (control ablation). Images (A) and (B) show fli1aep:EKC expression, while images (A’) and (B’) show the nuclear fli1aep:EKC intensity. White dotted lines show the wounded site. (C) Quantification of post-/pre-ablation nuclear EKC intensity of ECs in either non-ablated control ISVs or control ablation ISVs at 15 mpa (control, 39 ECs, n = 13 larvae; control ablation, 48 ECs, n = 16 larvae) or 3 hpa (control, 18 ECs, n = 6 larvae; control ablation, 24 ECs, n = 8 larvae). ISV: intersegmental vessel. Statistical test: Kruskal-Wallis test was conducted for graph (C). Error bars represent standard deviation. Scale bar: 15 μm.
Figure 5 with 2 supplements
Erk activity in ablated vessels is maintained through the Vegfr pathway.
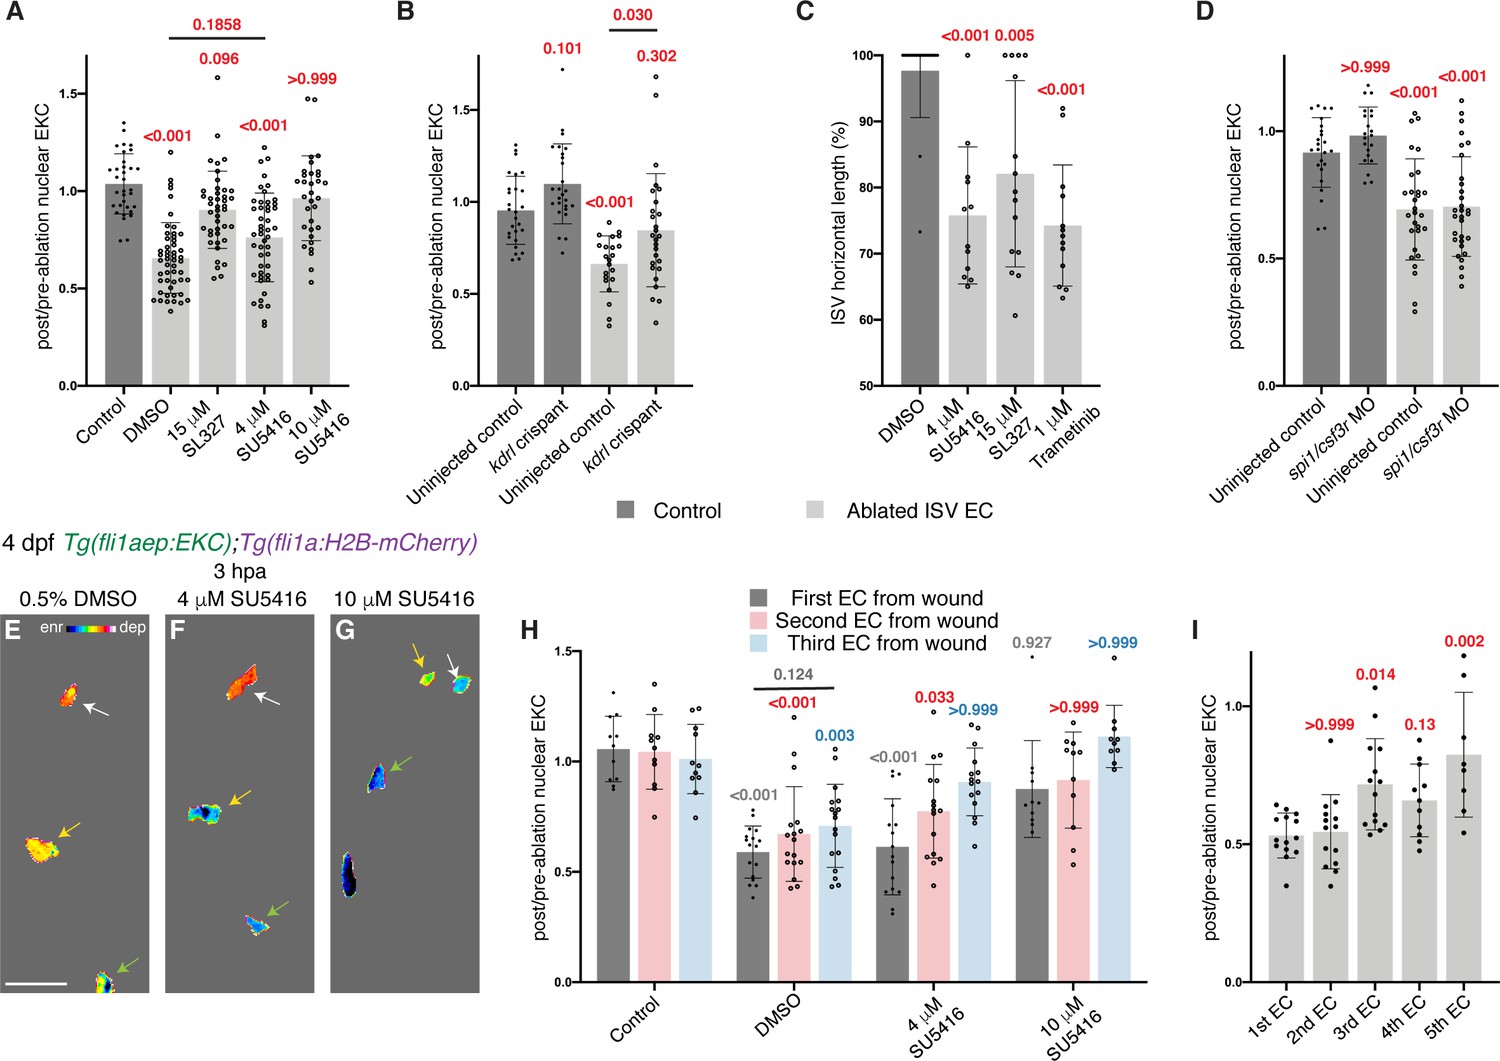
(A) Ongoing Erk-signalling requires Vegfr and Mek activity. Quantification of post-/pre-ablation nuclear EKC intensity 3 hours post-ablation (hpa) in endothelial cells (ECs) of 0.5% dimethyl sulfoxide (DMSO)-treated non-ablated control ISVs (33 ECs, n = 11 larvae) and ablated ISVs of larvae treated with either 0.5% DMSO (51 ECs, n = 17 larvae), 15 μM SL327 (42 ECs, n = 14 larvae), 4 μM SU5416 (47 ECs, n = 16 larvae), or 10 μM SU5416 (32 ECs, n = 11 larvae). (B) Kdrl is required for full induction of Erk activity in ablated ISV ECs. Quantification of post-/pre-ablation nuclear EKC intensity 3 hpa in non-ablated control ISV ECs of uninjected control (27 ECs, n = 9 larvae) and kdrl crispants (26 ECs, n = 9 larvae), and ablated ISV ECs of uninjected control (22 ECs, n = 8 larvae) and kdrl crispants (27 ECs, n = 9 larvae). (C) Quantification of ISV horizontal length (as percentage of control) for ablated ISVs in 24 hpa, 5 days post-fertilisation (dpf), EC-EKC larvae treated with either 0.5% DMSO (n = 18 larvae), 4 μM SU5416 (n = 12 larvae), 15 μM SL327 (n = 15 larvae), or 1 μM Trametinib (n = 13 larvae). (D) Macrophages are not required for maintaining Erk activity in ablated ISV ECs. Quantification of post-/pre-ablation nuclear EKC intensity 3 hpa in non-ablated control ISV ECs of uninjected control (24 ECs, n = 8 larvae) and spi1/csf3r morphants (21 ECs, n = 7 larvae), and ablated ISV ECs of uninjected control (29 ECs, n = 10 larvae) and spi1/csf3r morphants (31 ECs, n = 11 larvae). (E–G) Lateral spinning disc confocal images of ablated ISV ECs in 4 dpf, 3 hpa, EC-EKC larvae treated with either 0.5% DMSO (E), 4 μM SU5416 (F), or 10 μM SU5416 (G). EC Erk activity was consistently higher and more Vegfr-dependent closer to the wound. Arrows indicate first (white), second (yellow), and third (green) ECs from the wounded site. Full images: Figure 5—figure supplement 1D’,H’,J’. (H) Quantification of post-/pre-ablation nuclear EKC intensity at 3 hpa in first (dark grey), second (red), and third (light blue) ECs from wound. Treatments were 0.5% DMSO-treated non-ablated control ISVs (11 first, second, and third ECs, n = 11 larvae), and ablated ISVs of larvae treated with either 0.5% DMSO (17 first, second, and third ECs, n = 17 larvae), 4 μM SU5416 (16 first and second ECs, and 15 third ECs, n = 16 larvae), or 10 μM SU5416 (11 first and second ECs, and 10 third ECs, n = 11 larvae). The same embryos were used in (A). (I) Quantification of post-/pre-ablation nuclear EKC intensity at 3 hpa in first (14 ECs, n = 14 larvae), second (14 ECs, n = 14 larvae), third (14 ECs, n = 14 larvae), forth (11 ECs, n = 11 larvae), and fifth (8 ECs, n = 8 larvae) ECs from the wounded site of ablated ISVs in 4 dpf EC-EKC larvae. Data for the first, second, and third ECs were taken from Figure 4—figure supplement 1N. ISV: intersegmental vessel; DA: dorsal aorta. Statistical test: Kruskal-Wallis test was conducted for graphs (A, C, D, H, I). Ordinary one-way ANOVA test was conducted for graph (B). Error bars represent standard deviation. 15 μm for image (E).
-
Figure 5—source data 1
Post-/pre-ablation nuclear EKC measurements in control, ablated, and adjacent ISV ECs at 3 hpa.
- https://cdn.elifesciences.org/articles/62196/elife-62196-fig5-data1-v2.xlsx
Figure 5—figure supplement 1
Vegfr-signalling is required to sustain Erk activity in ablated ISV ECs following vessel wounding.
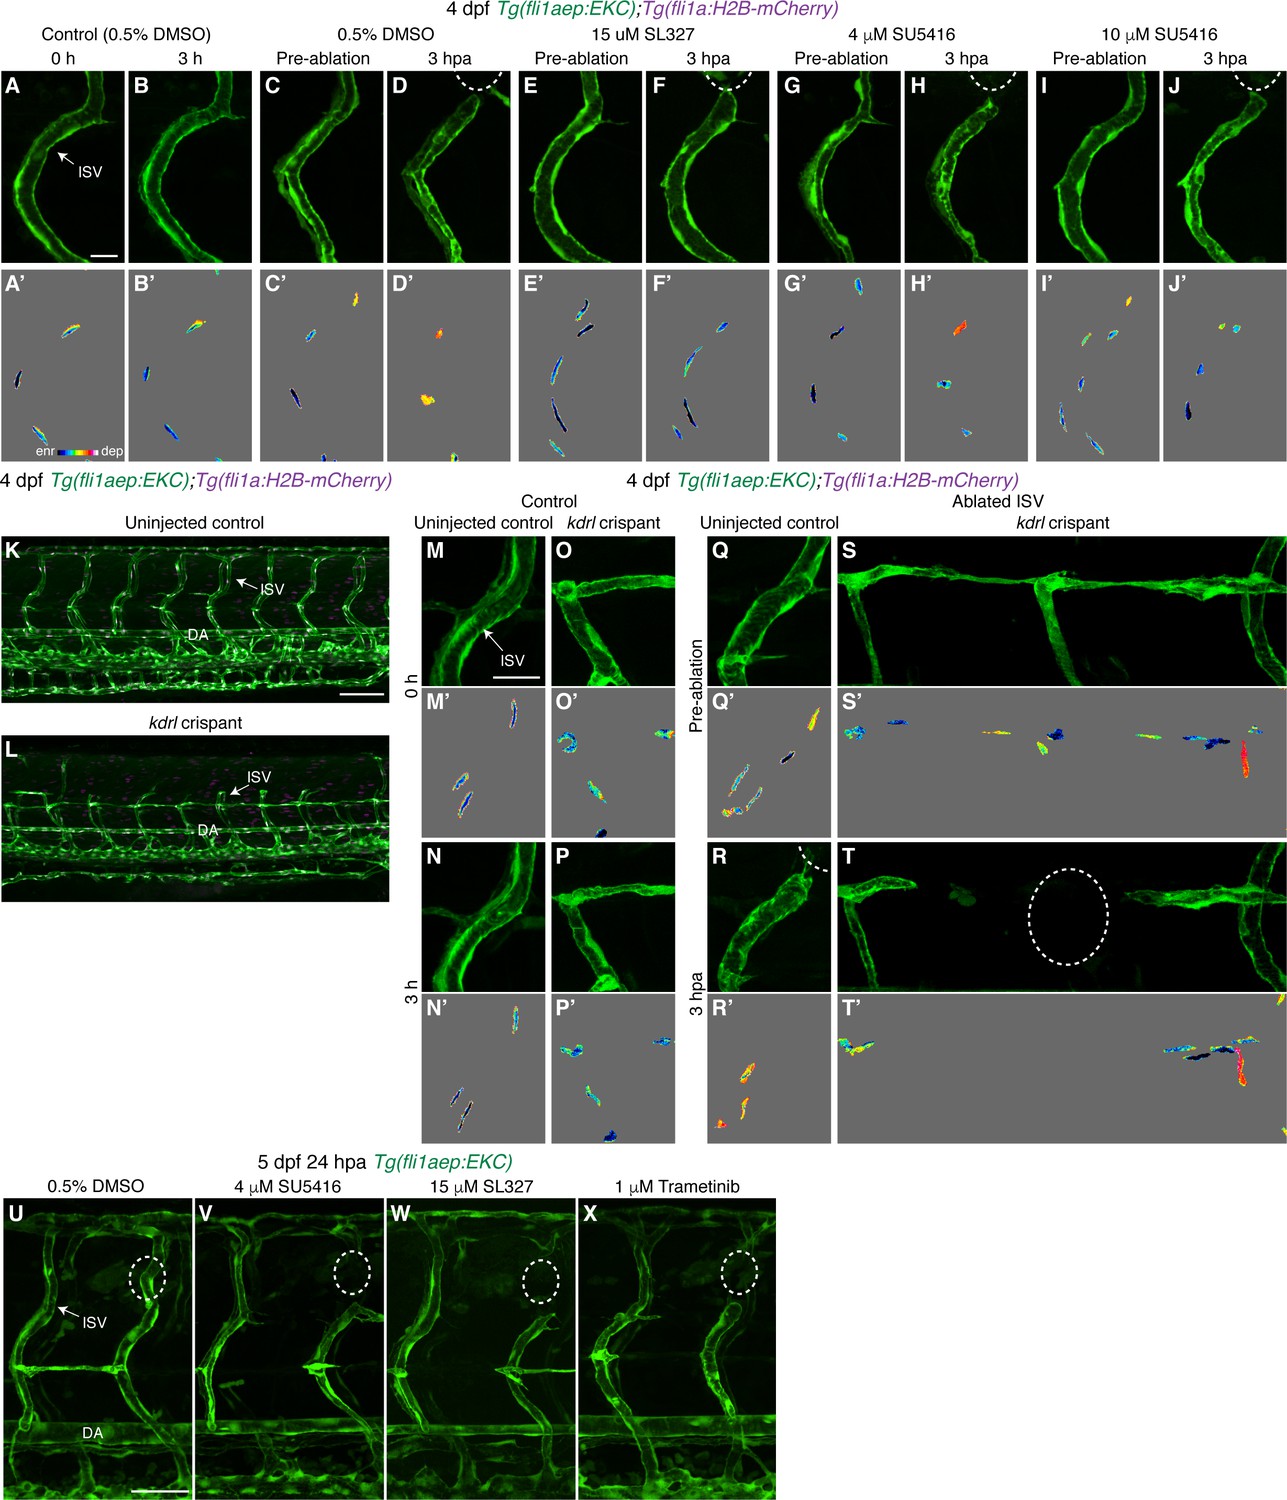
(A–J’) Lateral spinning disc confocal images of ISV endothelial cells (ECs) in 4 days post-fertilisation (dpf) EC-EKC larvae treated with either 0.5% dimethyl sulfoxide (DMSO) (A–D’), 15 μM SL327 (E–F’), 4 μM SU5416 (G–H’), or 10 μM SU5416 (I–J’). A higher concentration of SU5416 (10 μM) is required to block the Erk activity in ablated ISV ECs 3 hours post-ablation (hpa) immediately adjacent to the wound. Images (A-B’) show non-ablated control ISV ECs. Images (C, E, G, I) were taken pre-ablation and images (D, F, H, J) were taken 3 hpa. Images (A-J) show fli1aep:EKC expression, and images (A’-J’) show the nuclear fli1aep:EKC intensity. (K,L) Lateral confocal images of 4 dpf EC-EKC uninjected control (n = 100/100) (K) and kdrl crispant (n = 98/103 larvae displayed, phenotype indicated) (L). kdrl crispants phenocopy previously published kdrl mutant/morphant vascular phenotypes. (M–T’) High Erk activity is not maintained in kdrl crispants 3 hpa. Lateral confocal images of ISV ECs in 4 dpf EC-EKC uninjected control (M–N’, Q–R’) and kdrl crispants (O–P’, S–T’). Images (M-P’) show non-ablated control ISV ECs, and images (Q-T’) show ablated ISV ECs. Images (Q) and (S) were taken pre-ablation, and images (R) and (T) were taken 3 hpa. Images (M-T) show fli1aep:EKC expression, and images (M’-T’) show the nuclear fli1aep:EKC intensity. (U–X) Erk-signalling is required for vessel regeneration. Lateral spinning disc confocal images of 24 hpa, 5 dpf, EC-EKC larvae treated with either 0.5% DMSO (U), showing a regenerated ISV, or 4 μM SU5416 (V), 15 μM SL327 (W), or 1 μM Trametinib (X), all of which blocked ISV regeneration. DA, dorsal aorta; ISV: intersegmental vessel. White dotted lines/circles show the wounded site of each larva. Scale bars: 15 μm for image (A), 100 μm for image (K), 20 μm for image (A), and 50 μm for image (U).
Figure 5—figure supplement 2
Macrophages are not required to sustain Erk activity in ablated ISV ECs following vessel wounding.
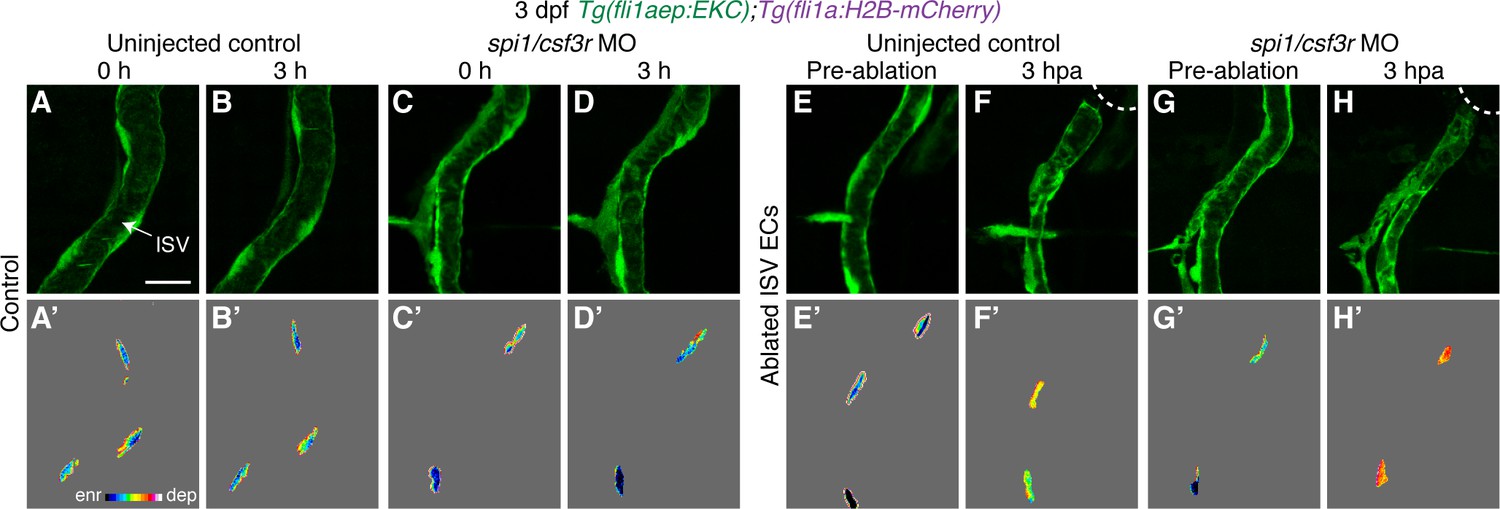
(A–H’) Lateral confocal images of ISV endothelial cells (ECs) in 3 days post-fertilisation (dpf) EC-EKC uninjected control (A–B’, E–F’) and spi1/csf3r morphants (C–D’, G–H’). Images (A-D’) show non-ablated control ISV ECs. Images (E) and (G) were taken pre-ablation and images (F) and (H) were taken 3 hours post-ablation (hpa). Images (A-H) show fli1aep:EKC expression, and images (A’-H’) show the nuclear fli1aep:EKC intensity. White dotted lines show the wounded site of each embryo. ISV: intersegmental vessel. Scale bar: 20 μm.
Figure 6 with 2 supplements
Ca2+ signalling is required for rapid Erk activation in ablated vessels.
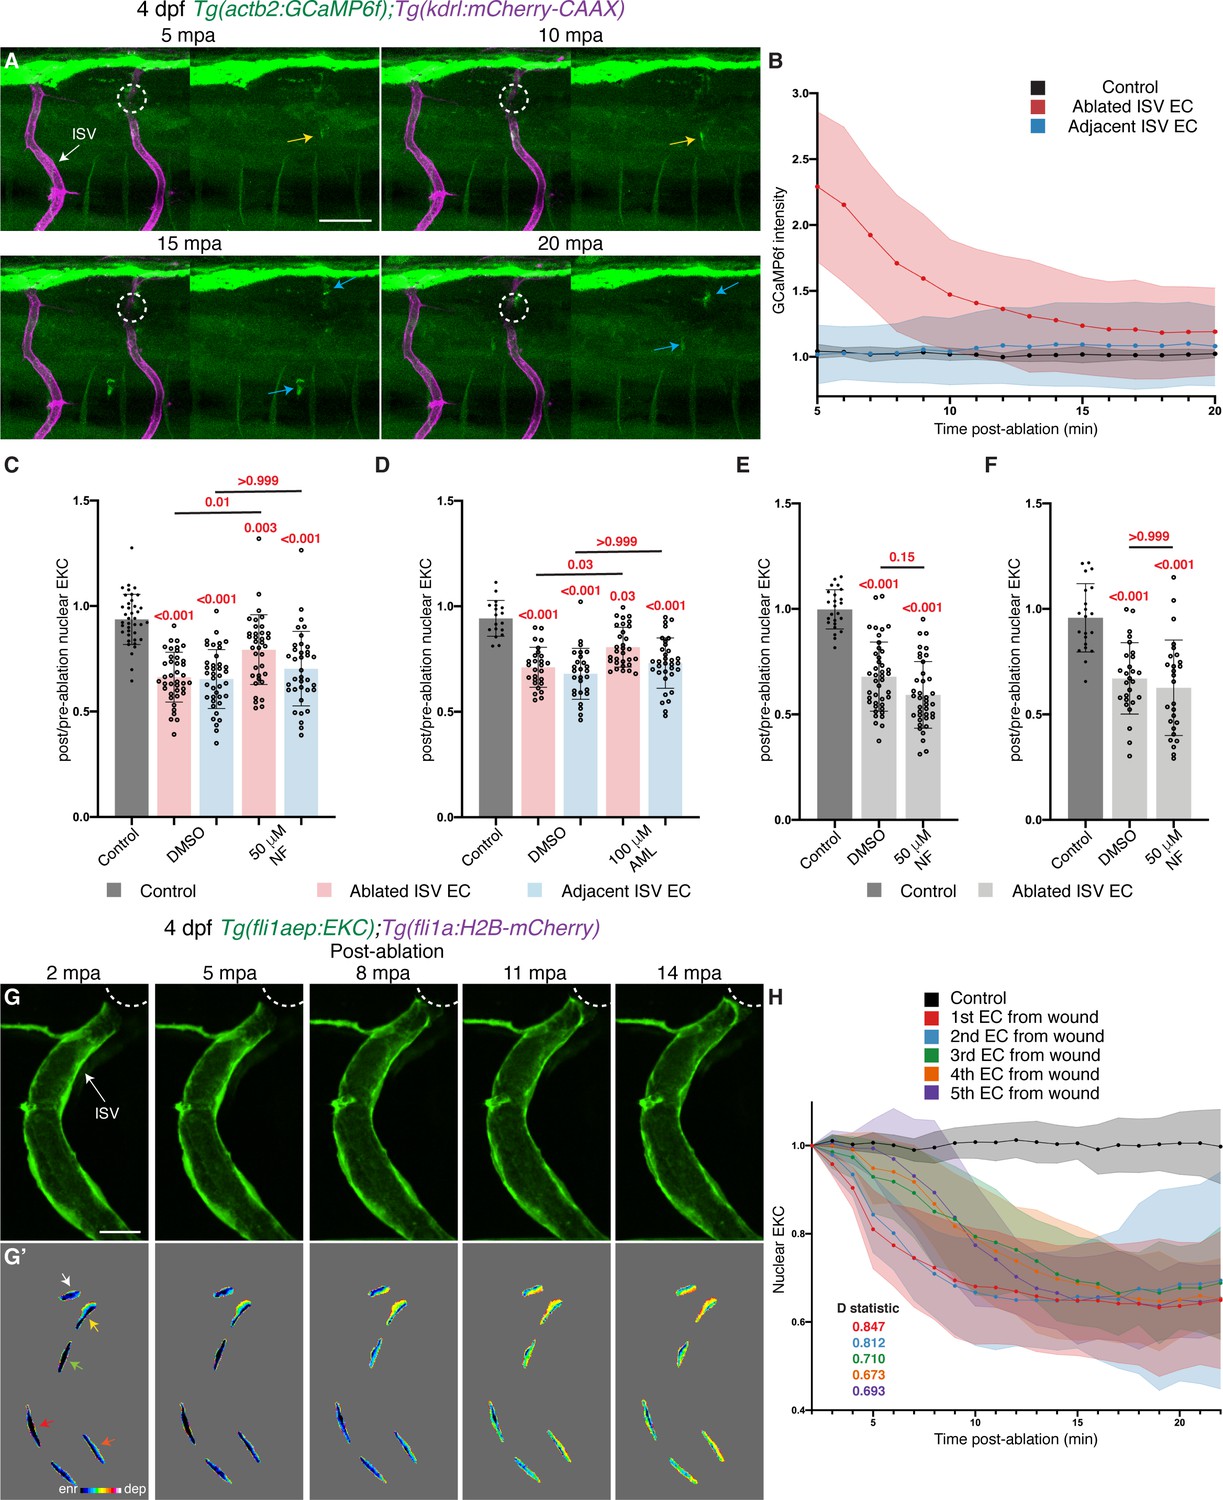
(A) Still images from Video 8 demonstrating a pulse of Ca2+ signalling immediately adjacent to the wound (4 days post-fertilisation (dpf)). Left panels show actb2:GCaMP6f and kdrl:mCherry-CAAX, and right panels show actb2:GCaMP6f. Yellow arrows show ISV endothelial cells (ECs) with active Ca2+ signalling. Blue arrows show Ca2+ signalling in recruited immune cells. (B) Quantification of actb2:GCaMP6f intensity in unablated control ISVs (black, n = 4 larvae), ablated (red, n = 10 larvae) and adjacent (light blue, n = 10 larvae) ISVs following wounding. Intensity was normalised to actb2:GCaMP6f intensity in unablated tissue in the same larvae. (C) Ca2+ signalling is required for rapid activation of Erk-signalling in ablated ISV ECs. Quantification of post-/pre-ablation nuclear EKC intensity at 15 min post-ablation (mpa) in ECs of 1% dimethyl sulfoxide (DMSO)-treated non-ablated control ISVs (39 ECs, n = 13 larvae), and ISVs of larvae treated with either 1% DMSO (39 ablated/adjacent ISV ECs, n = 13 larvae) or 50 μM Nifedipine (36 ablated/adjacent ISV ECs, n = 12 larvae). (D) Quantification of post-/pre-ablation nuclear EKC intensity at 15 mpa in ECs of 1% DMSO-treated non-ablated control ISVs (18 ECs, n = 6 larvae), and ISVs of larvae treated with either 1% DMSO (27 ablated/adjacent ISV ECs, n = 9 larvae) or 100 μM Amplopidine (31 ablated ISV ECs and 33 adjacent ISV ECs, n = 11 larvae). (E) Ca2+ signalling is not required for sustaining Erk activity in ablated ISV ECs. Quantification of post-/pre-ablation nuclear EKC intensity at 3 hours post-ablation (hpa) in ECs of 1% DMSO-treated non-ablated control ISVs (24 ECs, n = 8 larvae), and ablated ISVs of larvae treated with either 1% DMSO (42 ECs, n = 14 larvae) or 50 μM Nifedipine (39 ECs, n = 13 larvae) for 30 min before 3 hpa (Figure 6—figure supplement 2A). (F) Quantification of post-/pre-ablation nuclear EKC intensity at 3 hpa in ECs of 1% DMSO-treated non-ablated control ISVs (21 ECs, n = 7 larvae), and ablated ISVs of larvae treated with either 1% DMSO (27 ECs, n = 9 larvae) or 50 μM Nifedipine (27 ECs, n = 9 larvae) for 30 min after vessel wounding (Figure 6—figure supplement 2H). (G, G’) Still images from Video 3 showing ablated ISV ECs of a 4 dpf EC-EKC larva after vessel wounding. Activation of Erk progresses from the wound to the vessel base. Image (G) shows fli1aep:EKC expression, and (G’) shows nuclear fli1aep:EKC intensity. Arrows indicate first (white), second (yellow), third (green), forth (red), and fifth (orange) ECs from the wounded site. (H) Quantification of nuclear EKC intensity (normalised to nuclear EKC intensity at 2 mpa) in ECs of ISVs in non-ablated control larvae (black, 24 ECs, n = 8 larvae), and the first (red, 9 ECs, n = 9 larvae), second (blue, 9 ECs, n = 9 larvae), third (green, 9 ECs, n = 9 larvae), fourth (orange, 8 ECs, n = 8 larvae), and fifth (purple, 5 ECs, n = 5 larvae) ablated ISV ECs from the wounded site following vessel wounding. ISV: intersegmental vessel. Statistical test: Kruskal-Wallis test was conducted for graphs (C-F). Two-sample Kolmogorov-Smirnov test was conducted for graph (H). Error bars represent standard deviation. Scale bars: 50 μm for image (A), 15 μm for image (G).
-
Figure 6—source data 1
GCaMP6f intensity measurements and post-/pre-ablation nuclear EKC measurements in control, ablated, and adjacent ISV ECs.
- https://cdn.elifesciences.org/articles/62196/elife-62196-fig6-data1-v2.xlsx
Figure 6—figure supplement 1
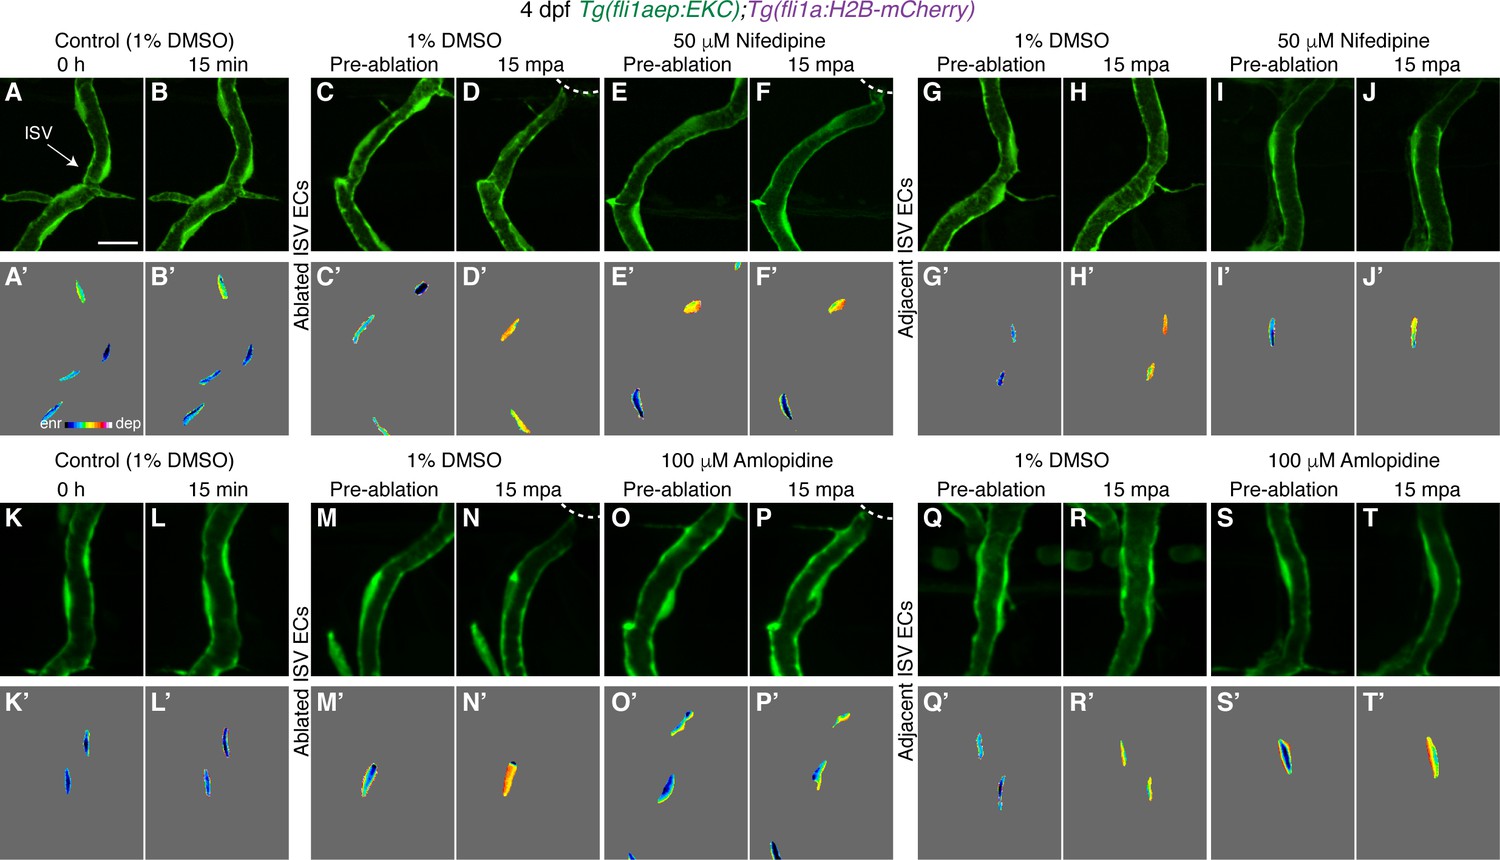
Ca2+ signalling is required for rapid Erk activation in ablated ISV ECs.
(A–T’) Ca2+ signalling is required for rapid Erk activation. Lateral spinning disc confocal images of ISV endothelial cells (ECs) in 4 days post-fertilisation (dpf) EC-EKC larvae treated with either 1% dimethyl sulfoxide (DMSO) (A–D’, G–H’ ,K–N’, Q–R’), 50 μM Nifedipine (E–F’, I–J’), or 100 μM Amlopidine (O–P’, S–T’). Images (A-B’) and (K-L’) show non-ablated control ISV ECs. Images (C, E, G, I, M, O, Q, S) were taken pre-ablation and images (D, F, H, J, N, P, R, T) were taken 15 min post-ablation (mpa). Images (A-T) show fli1aep:EKC expression, and images (A-T’) show the nuclear fli1aep:EKC intensity. White dotted lines show the wounded site of each larva. ISV: intersegmental vessel. Scale bar: 15 μm.
Figure 6—figure supplement 2
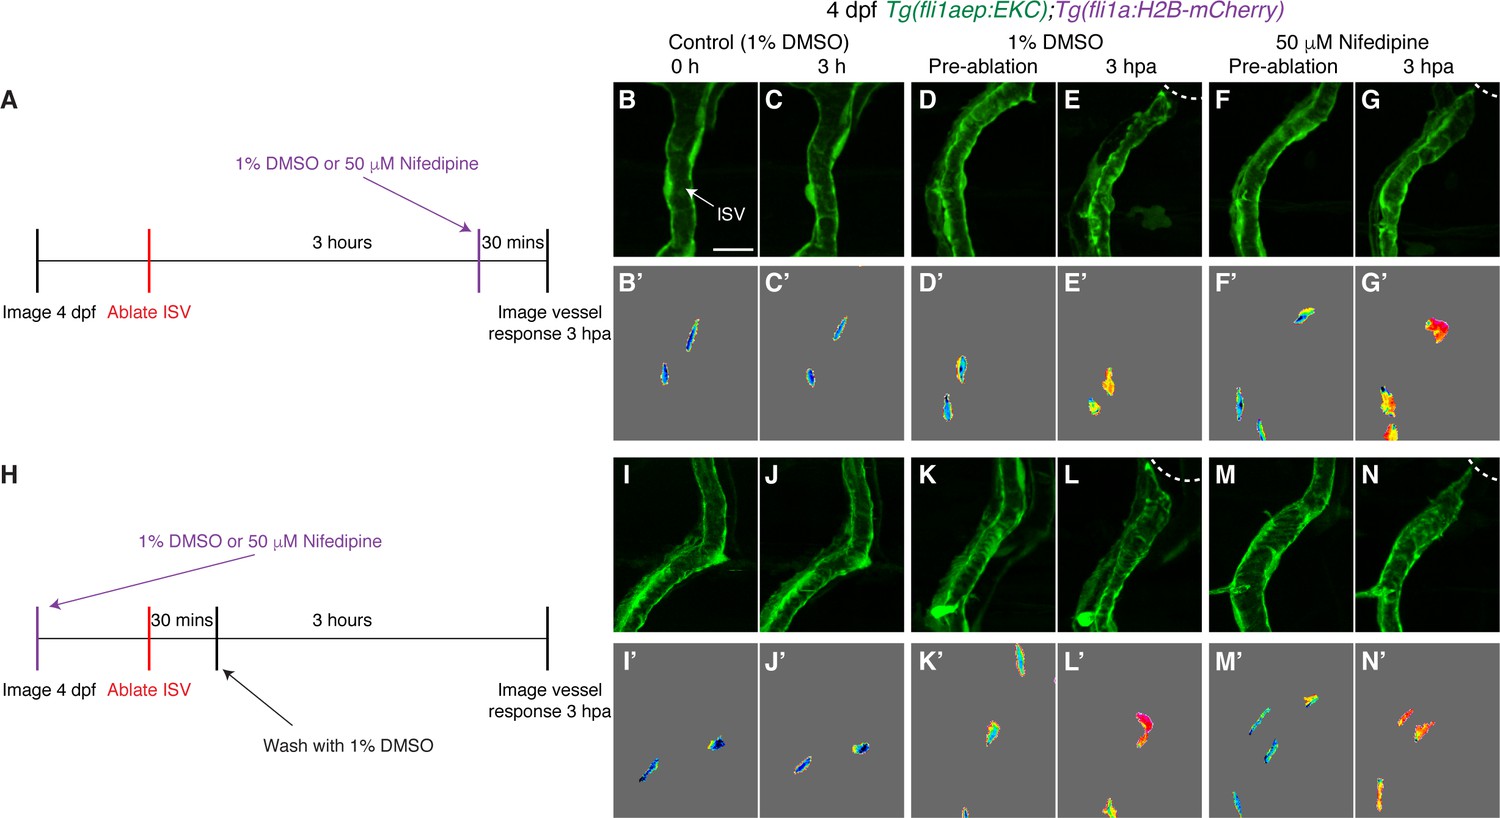
Ca2+ signalling is not required for sustained Erk activation in ablated ISV ECs.
(A) Schematic representation of imaging schedule for larvae in images (B-G). (B–G’) Ca2+ signalling is not required for sustaining Erk activation in ablated ISV endothelial cells (ECs). Lateral spinning disc confocal images of ISV ECs in 4 days post-fertilisation (dpf) EC-EKC larvae treated with either 1% dimethyl sulfoxide (DMSO) (B–E’) or 50 μM Nifedipine (F–G’). Images (B-C’) show non-ablated control ISV ECs. Images (D) and (F) were taken pre-ablation and images (E) and (G) were taken 3 hours post-ablation (hpa). Images (B-G) show fli1aep:EKC expression, and images (B-G’) show the nuclear fli1aep:EKC intensity. (H) Schematic representation of imaging schedule for larvae in images (I-N). (I–N’) Lateral confocal images of ISV ECs in 4 dpf EC-EKC larvae treated with either 1% DMSO (I–L’) or 50 μM Nifedipine (M–N’). Images (I-J’) show non-ablated control ISV ECs. Images (K) and (M) were taken pre-ablation and images (L) and (N) were taken 3 hpa. Images (I-N) show fli1aep:EKC expression, and images (I-N’) show the nuclear fli1aep:EKC intensity. ISV: intersegmental vessel. White dotted lines show the wounded site of each larva. Scale bar: 15 μm.
Figure 7
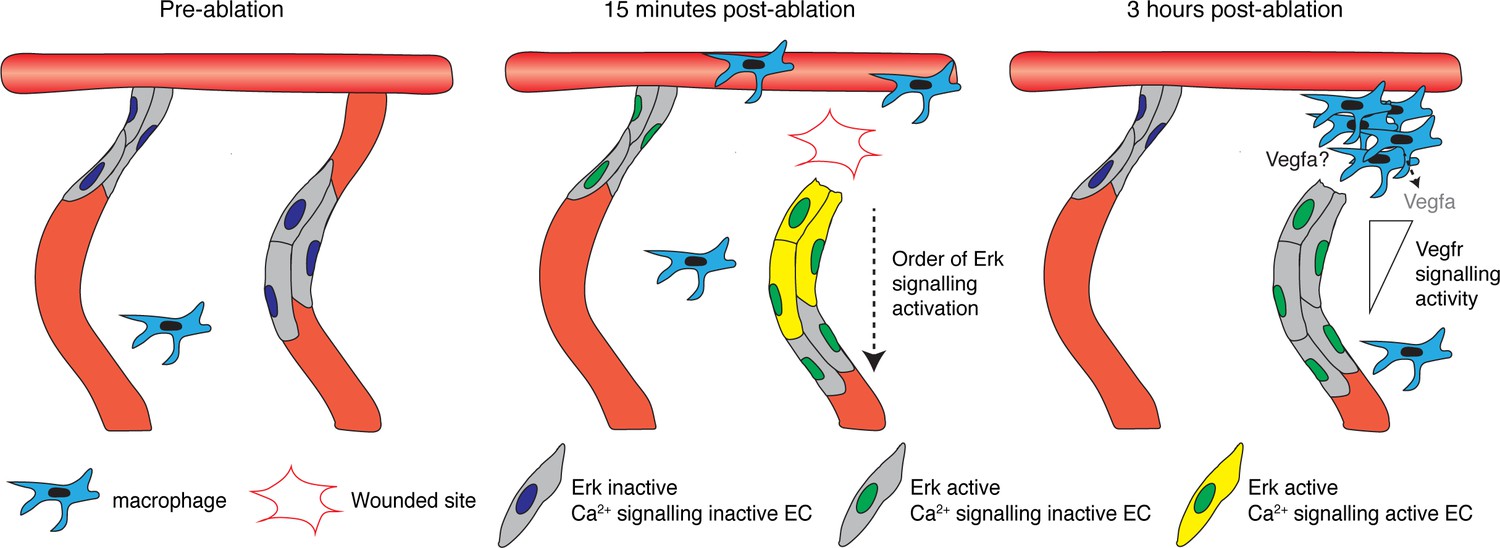
A two-step mechanism for activating and maintaining Erk activity in regenerating vessels.
Schematic representation of the two-step mechanism employed by endothelial cells (ECs) to activate Erk-signalling following vessel wounding. Pre-ablation (left), the majority of ECs are Erk-signalling inactive. Following vessel wounding (middle), both ablated and adjacent intersegmental vessel (ISV) ECs rapidly activate Erk-signalling. Ca2+ signalling is also rapidly activated following vessel wounding but only in ablated ISV ECs, particularly in ECs close to the wounded site. Ca2+ signalling activity contributes to the activation of Erk-signalling in ablated ISV ECs in a sequential manner, starting from ECs close to the wounded site. Erk-signalling in adjacent ISV ECs has returned to pre-wound levels by 3 hours post-ablation (hpa) (right). Erk activity in ablated vessel ISV ECs is sustained through Vegfr-signalling. ECs closer to the wounded site are less sensitive to Vegfr-signalling inhibition, with higher signalling compared to ECs farther away. Recruited macrophages are essential for vessel regeneration but not the sole source of Vegfs at 3 hpa.
Videos
Video 1
ISV daughter ECs show asymmetric Erk activity following cytokinesis.
Time-lapse video of an ISV tip endothelial cell (EC) undergoing mitosis in a 24–25 hours post-fertilisation (hpf) EC-EKC embryo. Left panel shows the fli1aep:EKC expression, middle panel shows the fli1a:H2B-mCherry expression, and the right panel shows the nuclear fli1aep:EKC intensity. Z stacks were acquired every 15.5 s for 40 min using an Andor Dragonfly Spinning Disc Confocal microscope. Photobleaching was minimised using the bleach correction tool (correction method: histogram matching) in FIJI.
ISV: intersegmental vessel; DA: dorsal aorta. Scale bar: 25 μm.
Video 2
ISV ECs in 4 dpf larvae have minimal Erk activity.
Time-lapse video of the trunk vessels in a 4 days post-fertilisation (dpf) EC-EKC larva at indicated timepoints. Endothelial cells (ECs) in functional vessels at 4 dpf have low Erk activity. Left panel shows the fli1aep:EKC expression, middle panel shows both fli1aep:EKC and fli1a:H2B-mCherry expression, and the right panel shows the nuclear fli1aep:EKC intensity. Z stacks were acquired every minute for 41 min using an Andor Dragonfly Spinning Disc Confocal microscope. Photobleaching was minimised using the bleach correction tool (correction method: histogram matching) in FIJI.
ISV: intersegmental vessel; DA: dorsal aorta. Scale bar: 20 μm.
Video 3
Both ablated and adjacent ISV ECs rapidly activate Erk-signalling following vessel wounding.
Time-lapse video of the trunk vessels in a 4 days post-fertilisation (dpf) EC-EKC larva before (pre-ablation) and after (post-ablation) vessel wounding at indicated timepoints. Vessel wounding rapidly activates Erk-signalling in both ablated and adjacent ISV endothelial cells (ECs). Post-ablation video starts at 2 min post-ablation due to the time taken to transfer the larvae between microscopes and for preparation of imaging. Left panel shows the fli1aep:EKC expression, middle panel shows both fli1aep:EKC and fli1a:H2B-mCherry expression, and the right panel shows the nuclear fli1aep:EKC intensity. Z stacks were acquired every 1 min for 20 min before and after vessel wounding using an Andor Dragonfly Spinning Disc Confocal microscope. Photobleaching was minimised using the bleach correction tool (correction method: histogram matching) in FIJI.
ISV: intersegmental vessel; DA: dorsal aorta. Scale bar: 20 μm.
Video 4
Ablated ISV ECs rapidly activate Erk-signalling following vessel wounding.
Time-lapse video of the ablated ISV in a 4 days post-fertilisation (dpf) EC-EKC larva before (pre-ablation) and after (post-ablation) vessel wounding at indicated timepoints. Post-ablation video starts at 2 min post-ablation due to the time taken to transfer the larvae between microscopes and for preparation of imaging. Left panel shows the fli1aep:EKC expression and the right panel shows the nuclear fli1aep:EKC intensity. Z stacks were acquired every 1 min for 20 min before and after vessel wounding using an Andor Dragonfly Spinning Disc Confocal microscope. Photobleaching was minimised using the bleach correction tool (correction method: histogram matching) in FIJI.
ISV: intersegmental vessel. Scale bar: 20 μm.
Video 5
Adjacent ISV ECs rapidly activate Erk-signalling following vessel wounding.
Time-lapse video of the adjacent ISV in a 4 days post-fertilisation (dpf) EC-EKC larva before (pre-ablation) and after (post-ablation) vessel wounding at indicated timepoints. Post-ablation video starts at 2 min post-ablation due to the time taken to transfer the larvae between microscopes and for preparation of imaging. Left panel shows the fli1aep:EKC expression and the right panel shows the nuclear fli1aep:EKC intensity. Z stacks were acquired every 1 min for 20 min before and after vessel wounding using an Andor Dragonfly Spinning Disc Confocal microscope. Photobleaching was minimised using the bleach correction tool (correction method: histogram matching) in FIJI.
ISV: intersegmental vessel. Scale bar: 20 μm.
Video 6
Skin epithelial and muscle cells do not maintain high Erk activity for 3 hr following muscle wounding.
Time-lapse video of the trunk in a 30 hours post-fertilisation (hpf) Tg(ubb:Mmu.Elk1-KTR-mCherry) embryo following muscle wounding. The white circle shows the wounded site. Skin epithelial and muscle cells surrounding the wounded site do not sustain Erk activity (examples of Erk-active cells, with nuclear excluded EKC expression indicated with white arrows). Z stacks were acquired nevery 21 min from 5 min post-ablation (mpa) until 3 hours post-ablation (hpa) using a Leica SP8 X WLL confocal microscope (n = 6 embryos).
Scale bar: 20 μm.
Video 7
ISVs in 4 dpf larvae do not have active Ca2+ signalling.
Time-lapse video of ISVs in a 4 days post-fertilisation (dpf) Tg(actb2:GCaMP6f);Tg(kdrl:mCherry-CAAX) larva. Functional vessels at 4 dpf have low or undetectable Ca2+ signalling. Left panel shows both the actb2:GCaMP6f and the kdrl:mCherry-CAAX expression and the right panel shows the actb2:GCaMP6f expression. Z stacks were acquired every minute for 15 min using a Leica SP8 confocal microscope.
ISV: intersegmental vessel. Scale bar: 50 μm.
Video 8
ISVs rapidly activate Ca2+ signalling following vessel wounding.
Time-lapse video of both ablated and adjacent ISVs in a 4 days post-fertilisation (dpf) Tg(actb2:GCaMP6f);Tg(kdrl:mCherry-CAAX) larva following vessel wounding. Only the wounded ISV activates Ca2+ signalling. Left panel shows both the actb2:GCaMP6f and the kdrl:mCherry-CAAX expression, and the right panel shows the actb2:GCaMP6f expression. Z stacks were acquired every minute from 5 min post-ablation (mpa) until 20 mpa using a Leica SP8 confocal microscope.
ISV: intersegmental vessel. Scale bar: 50 μm.
Tables
Key resources table
| Reagent type (species) or resource | Designation | Source or reference | Identifiers | Additional information |
|---|---|---|---|---|
| Genetic reagent (Danio rerio) | Tg(fli1a:H2B-mCherry)uq37bh | Baek et al., 2019 | RRID:ZFIN_ZDB-ALT-191011-5 | Ben M Hogan (Organogenesis and Cancer Program, Peter MacCallum Cancer Centre, Australia) |
| Genetic reagent (D. rerio) | Tg(fli1a:EGFP)y1 | Lawson and Weinstein, 2002 | RRID:ZFIN_ZDB-ALT-011017-8 | Brant M Weinstein (National Institute of Child Health and Human Development, Bethesda, USA) |
| Genetic reagent (D. rerio) | Tg(fli1aep:ERK-KTR-Clover)uq39bh | This study | Ben M Hogan (Organogenesis and Cancer Program, Peter MacCallum Cancer Centre, Australia) | |
| Genetic reagent (D. rerio) | Tg(ubb:Mmu.Elk1-KTR-mClover)vi1 | Mayr et al., 2018 | ZFIN ID: ZDB-ALT-190211–6 | Martin Distel (Children’s Cancer Research Institute, Austria) |
| Genetic reagent (D. rerio) | Tg(actb2:GCaMP6f)zf3076 | Herzog et al., 2019 | ZFIN ID: ZDB-ALT-200610–2 | Leah Herrgen (Centre for Discovery Brain Sciences, University of Edinburgh, Germany) |
| Genetic reagent (D. rerio) | Tg(kdrl:mCherry-CAAX)y171 | Fujita et al., 2011 | RRID:ZFIN_ZDB-ALT-110429-3 | Brent M Weinstein (National Institute of Child Health and Human Development, Bethesda, USA) |
| Genetic reagent (D. rerio) | Tg(mpeg1:mCherry)gl23 | Ellett et al., 2011 | RRID:ZFIN_ZDB-ALT-120117-2 | Graham Lieschke (Australian Regenerative Medicine Institute, Monash University, Australia) |
| Genetic reagent (D. rerio) | Tg(kdrl:EGFP)s843 | Beis et al., 2005 | RRID:ZFIN_ZDB-ALT-050916-14 | Didier Stainier (Max Planck Institute for Heart and Lung Research, Germany) |
| Sequence-based reagent | MO1-spi1b | Rhodes et al., 2005 | ZFIN ID: ZDB-MRPHLNO-050224–1 | Genetools, LLC, OR, USA |
| Sequence-based reagent | MO3-csf3r | Ellett et al., 2011 | ZFIN ID: ZDB-MRPHLNO-111213–1 | Genetools, LLC, OR, USA |
| Software, algorithm | FIJI | ImageJ (http://imagej.nih.gov/ij/) | RRID:SCR_002285 | Image processing and analysis, Version Fiji version 1 |
| Software, algorithm | Imaris x64 | Bitplane, Belfast, UK | RRID:SCR_007370 | Image processing and analysis, Version 9.5.1 |
| Software, algorithm | GraphPad Prism | GraphPad Prism (http://graphpad.com) | RRID:SCR_002798 | Statistics, Prism8: Version 8.3.0 |
| Software, algorithm | R/R Studio | R project (r-project.org) | RRID:SCR_001905 | Statistics, R version 4.0.2 |
| Chemical compound, drug | SL327 (MEK signalling inhibitor) | Merck, Darmstadt, Germany | S4069 | Diluted in DMSO |
| Chemical compound, drug | Trametinib (MEK signalling inhibitor) | Selleck chemicals, TX, USA | S2673 | Diluted in DMSO |
| Chemical compound, drug | SU5416 | Merck, Darmstadt, Germany | S8442 | Diluted in DMSO |
| Chemical compound, drug | AV951 | Adooq Bioscience, CA, USA | 475108-18-0 | Diluted in DMSO |
| Chemical compound, drug | Nifedipine | Bio-Techne, MN, USA | 1075 | Diluted in DMSO |
| Chemical compound, drug | Amlodipine | Merck, Darmstadt, Germany | A5605 | Diluted in DMSO |
Additional files
Download links
A two-part list of links to download the article, or parts of the article, in various formats.
Downloads (link to download the article as PDF)
Open citations (links to open the citations from this article in various online reference manager services)
Cite this article (links to download the citations from this article in formats compatible with various reference manager tools)
Live-imaging of endothelial Erk activity reveals dynamic and sequential signalling events during regenerative angiogenesis
eLife 10:e62196.
https://doi.org/10.7554/eLife.62196


