Asymmetric localization of the cell division machinery during Bacillus subtilis sporulation
- Division of Biological Sciences, University of California San Diego, United States
Figures
Figure 1
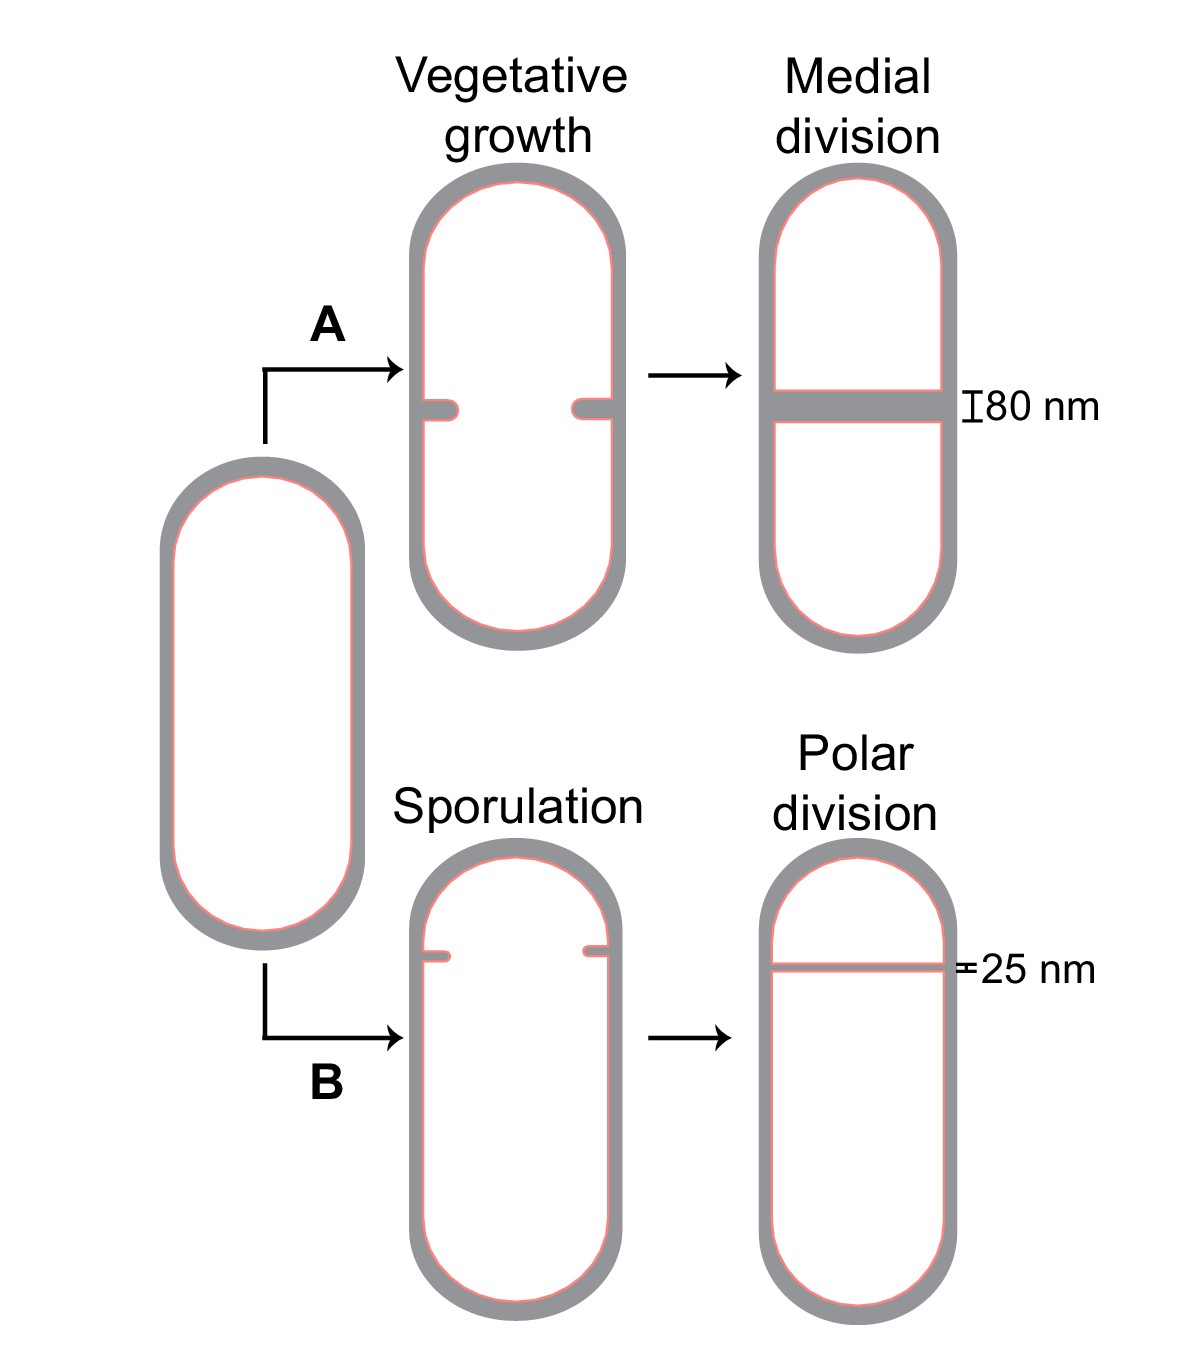
Cell division in Bacillus subtilis.
Schematic of cell division in B. subtilis during (A) vegetative growth and (B) sporulation. The thickness of septa upon their closure is indicated for both cases.
Figure 2 with 1 supplement
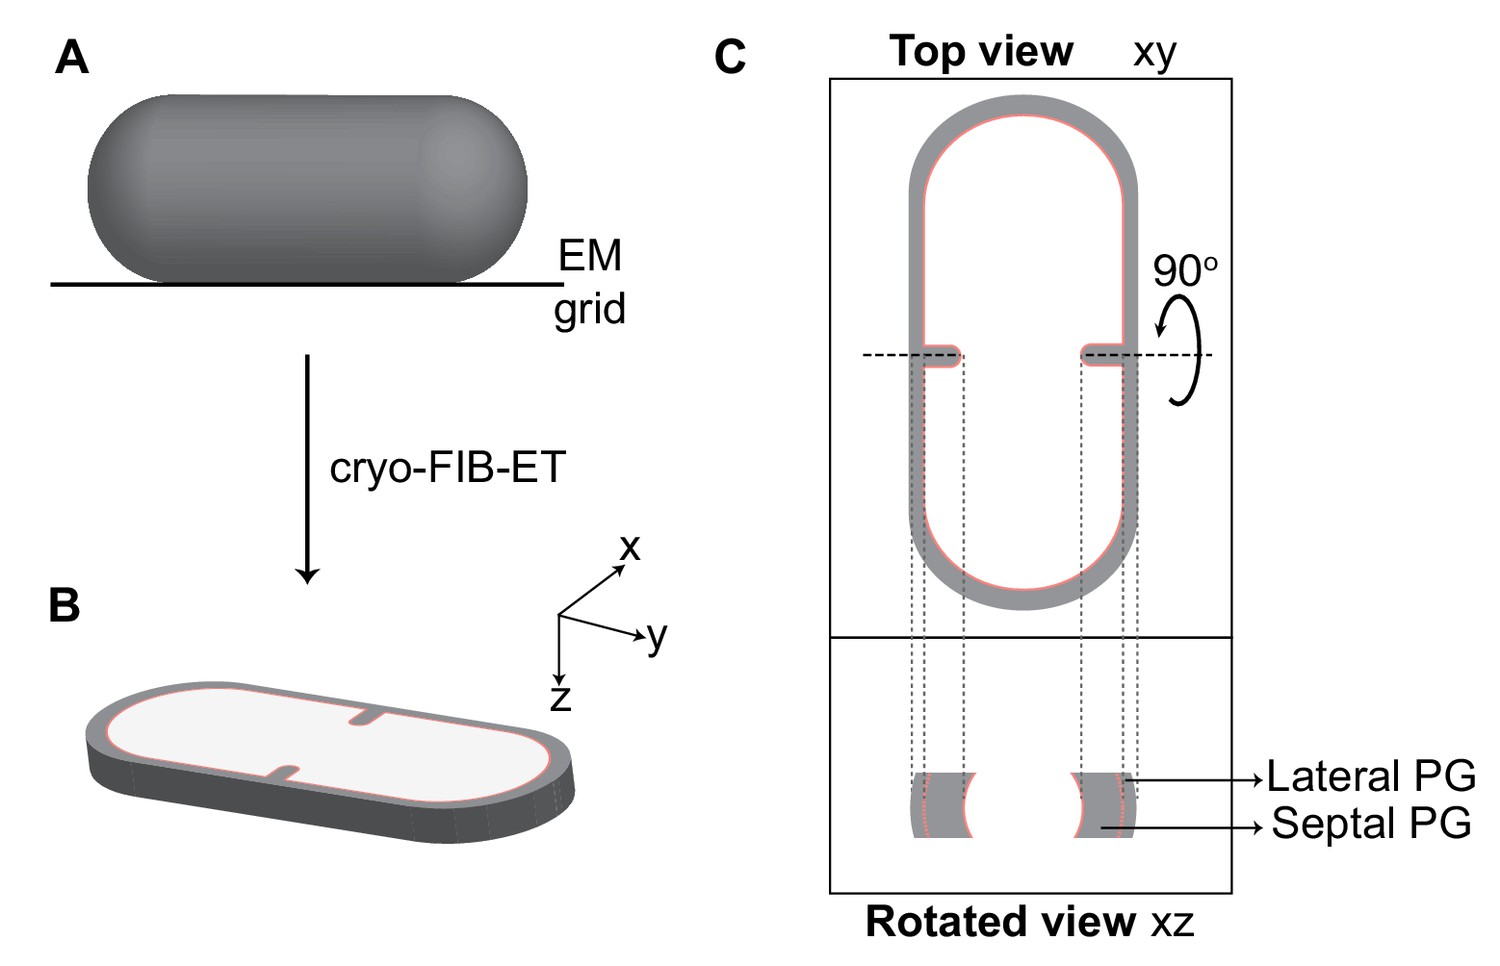
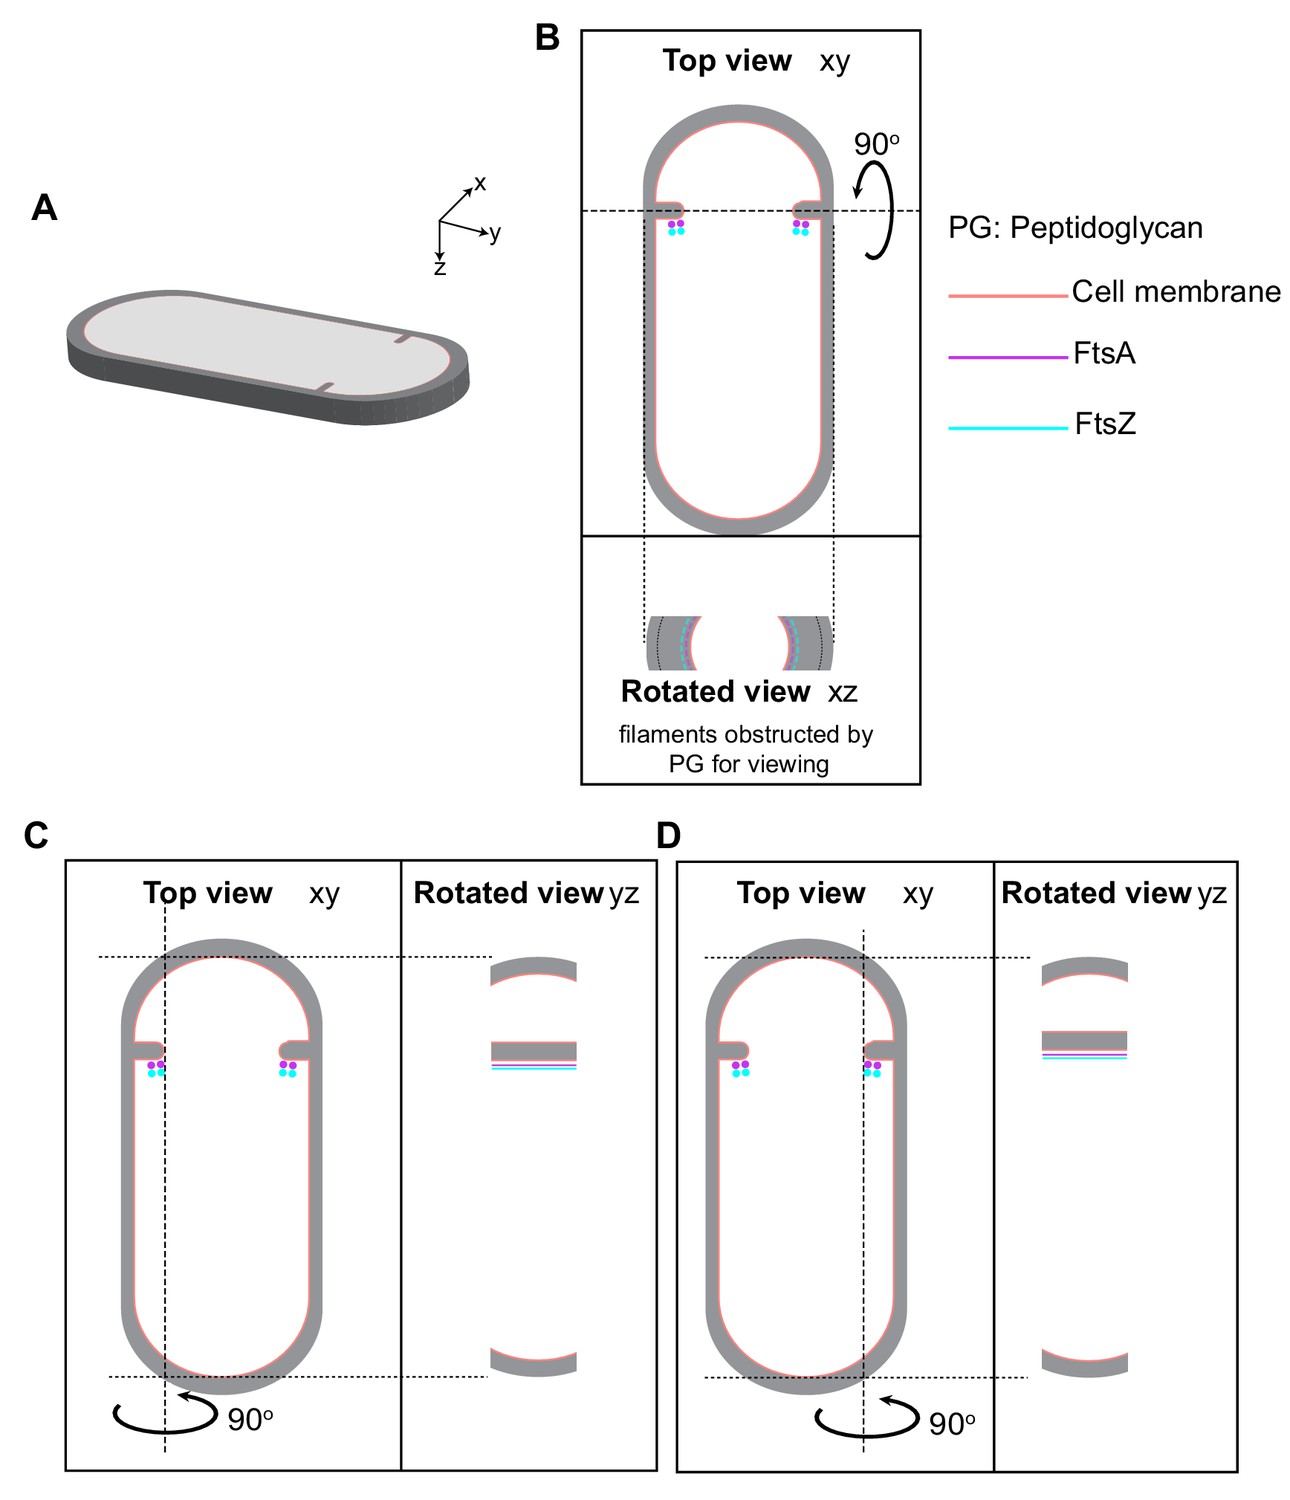
Visualization of cellular cross-sections in dividing cells.
Schematic explaining visualization of cells in different planes in three-dimension (3D). (A) Initially, the rod-shaped Bacillus lies flat on an electron microscopy (EM) grid. (B) Representation of 3D view of a cellular section obtained by cryo-FIB-ET in the xyz coordinate axis. x axis represents the length along the short axis of the cell, y axis represents the length along the long axis of the cell and z axis represents the height of the cellular specimen. (C) Top panel: projection image of the cell in the xy coordinate plane (top view). Bottom panel: the corresponding projection image in the xz coordinate plane when the cell is rotated about its short axis by 90° (side/rotated view). The lateral and septal peptidoglycan (PG) are also indicated. See also Figure 2—figure supplement 1.
Figure 2—figure supplement 1
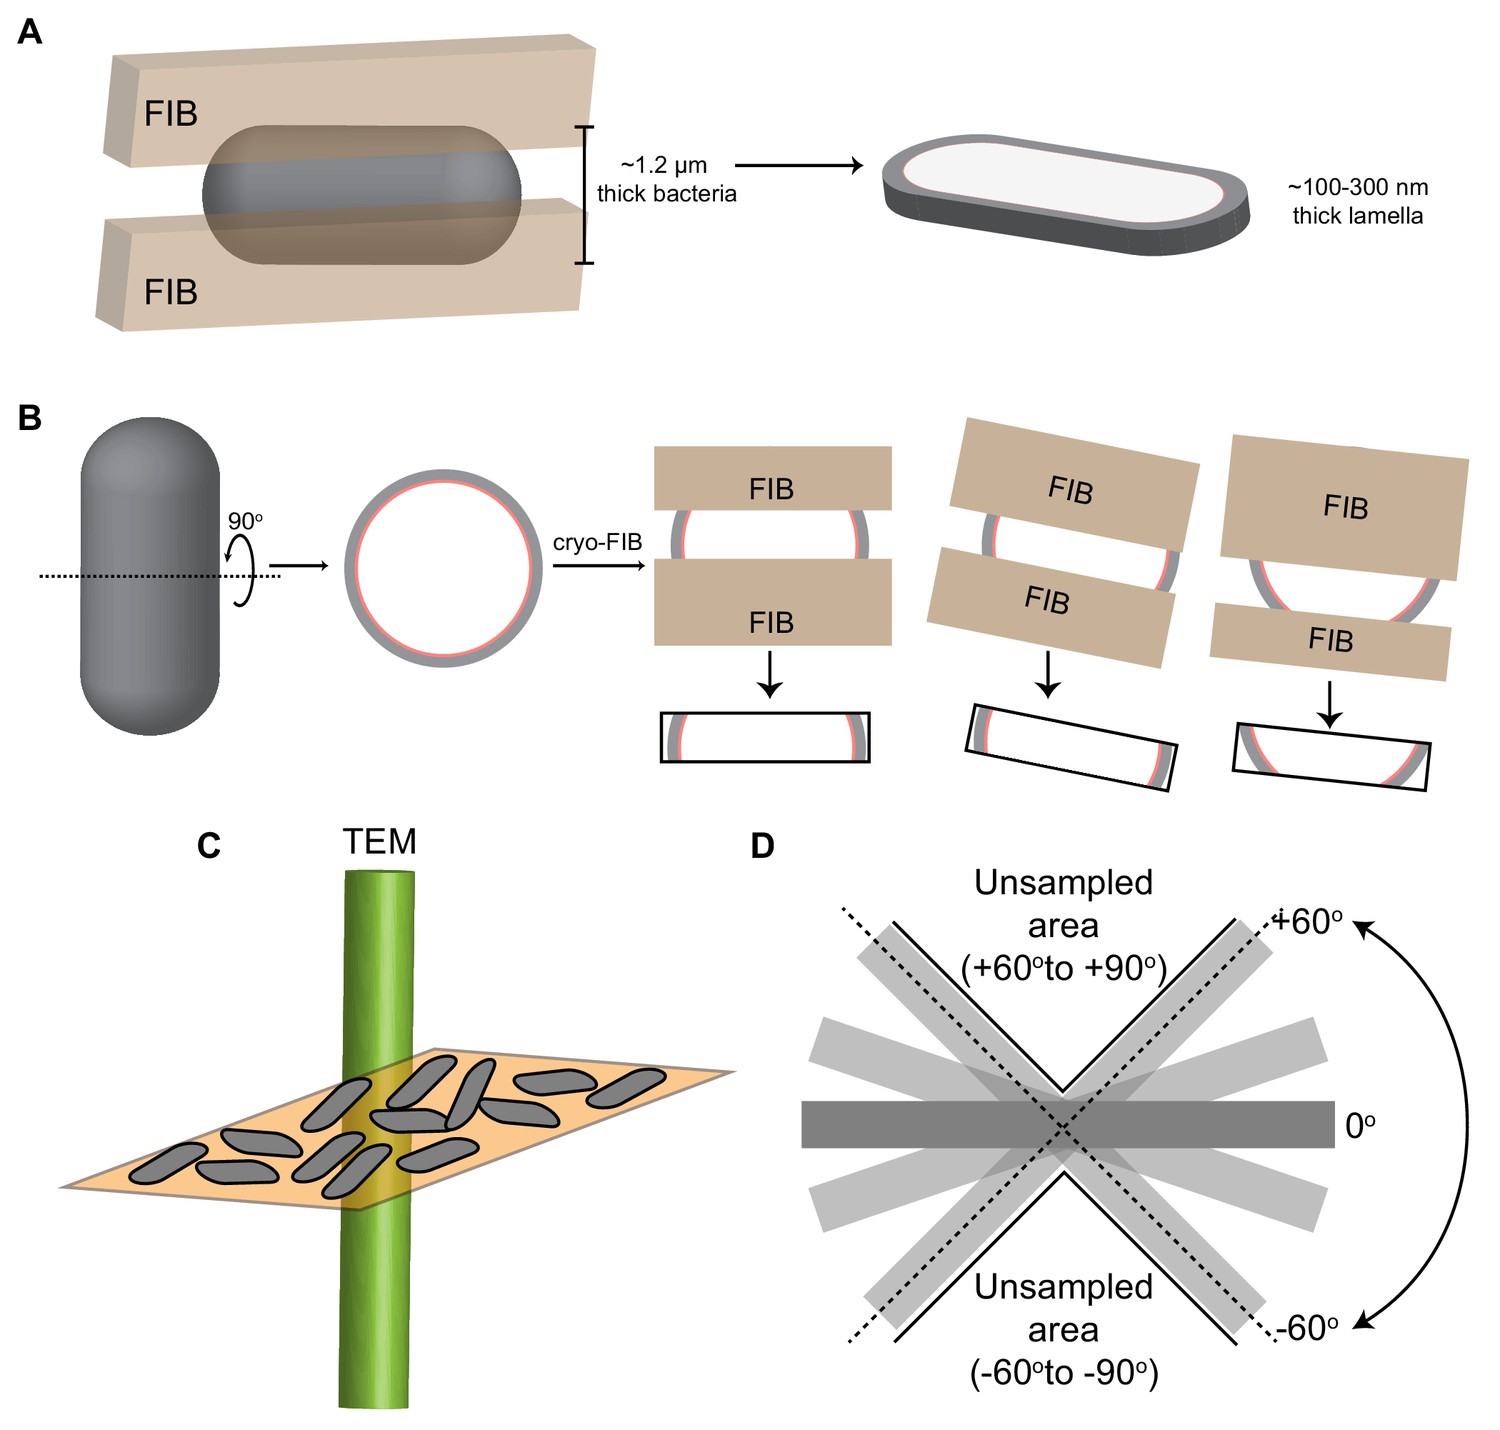
Cryo-FIB milling workflow and analysis.
(A) Schematic of a rod-shaped cell (gray) subjected to cryo-FIB milling. Two parallel beams of gallium ions (brown) ablate the cellular material from the top and the bottom, leaving a thin slice (~100–300 nm thick) for imaging using cryo-ET. (B) Schematic depicting different sections of the septal disc that can be captured when a rod-shaped cell is FIB-milled depending on the milling angle, orientation of the cell on the electron microscopy grid and orientation of the cell with respect to the tilt axis. (C) Schematic illustrating the orientation of bacterial cells (gray) on a grid square (orange). Since all cells lie flat on the grid with their xy axis parallel to the grid (as shown in Figure 2), the missing wedge is always in a direction that is perpendicular to the xy plane. (D) Schematic depicting the missing wedge issue in cryo-ET workflow. Since we are only able to image from ~ ± 60o, the areas from −60o to −90o and from +60o to +90o remain unsampled, leading to missing information for these areas.
Figure 3 with 5 supplements
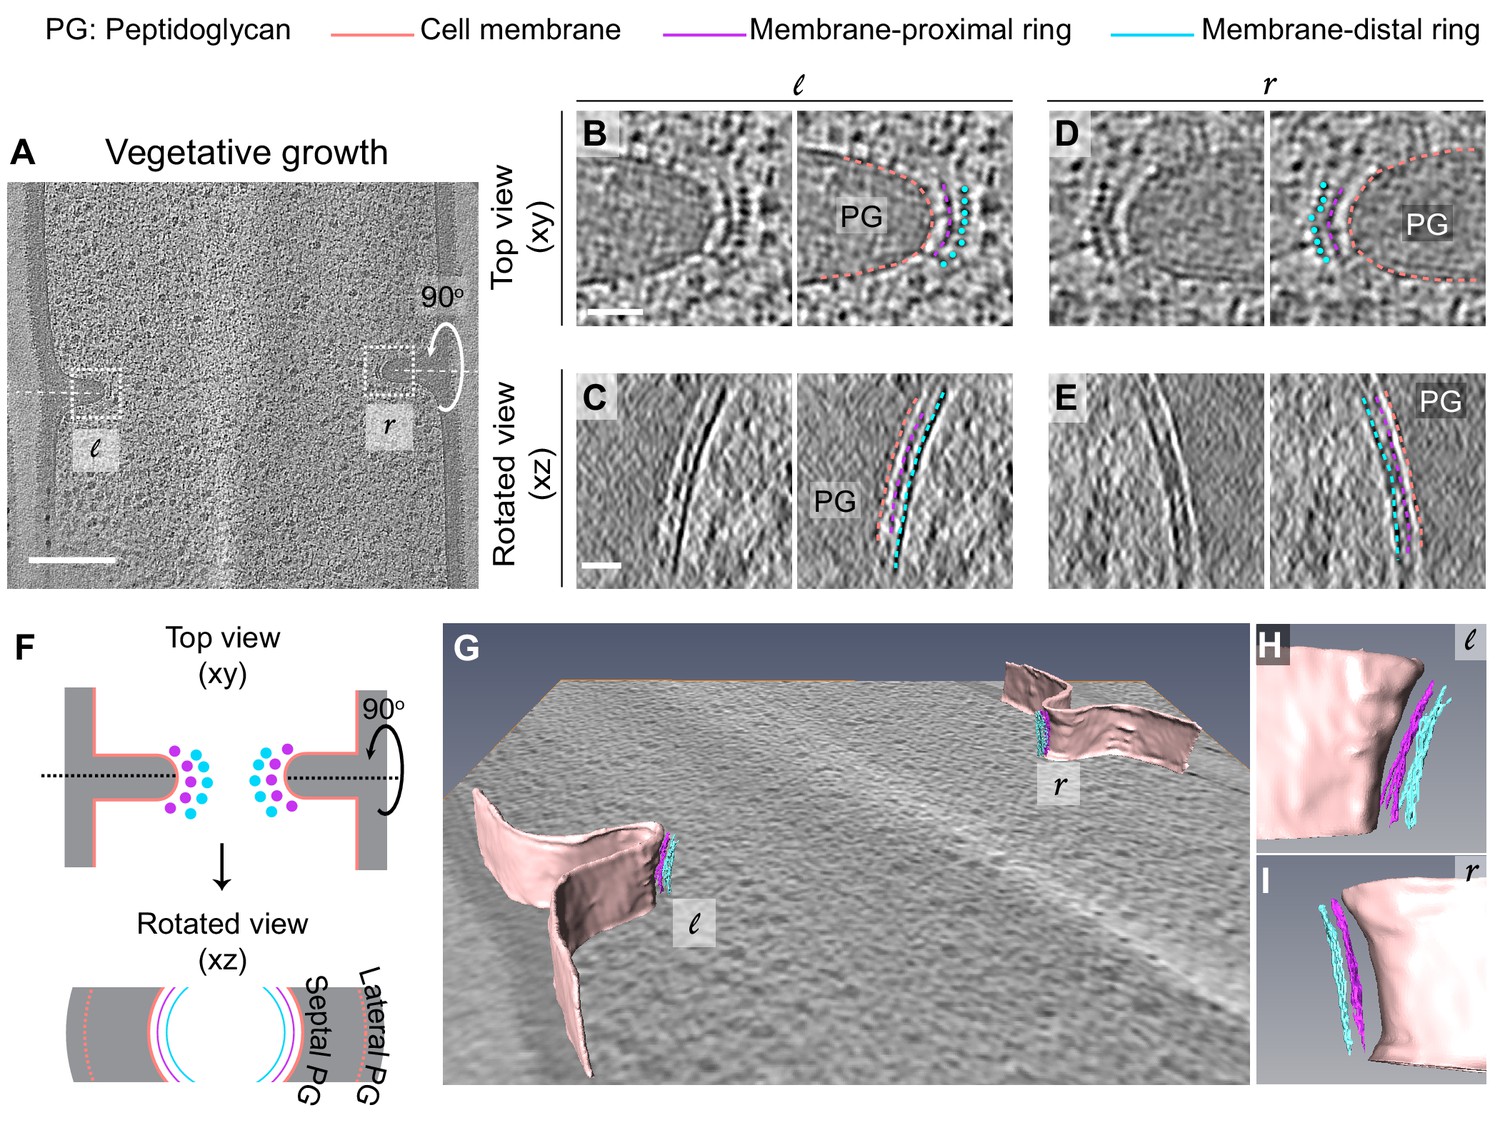
Architecture of divisome in vegetative B. subtilis cells.
(A) Slice through a tomogram of a dividing vegetative cell. The insets (l for left and r for right side of the septum) highlight the leading edges of the invaginating septum. (B) Left panel: zoomed-in view of the ‘l’ inset in (A) in the xy coordinate plane. Right panel: same as left with peptidoglycan (PG; gray), cell membrane (peach), membrane-proximal series of dots (pink) and membrane-distal series of dots (blue) highlighted. The same color scheme is followed throughout. (C) Left panel: view of the septal disc corresponding to (B) in the xz coordinate plane obtained by rotating the cell around its short axis by 90°. Right panel: same as left with PG, cell membrane, membrane-proximal ring and membrane-distal ring highlighted. (D) Left panel: zoomed-in view of the inset ‘r’ in (A) in the xy coordinate plane. Right panel: same as left with cellular parts highlighted. (E) Left panel: view of the septal disc corresponding to (D) in the xz coordinate plane obtained by rotating the cell around its short axis by 90°. Right panel: same as left with cellular parts highlighted. (F) Schematic of the arrangement of the cytoskeletal machinery in dividing vegetative cells as seen in the xy and xz coordinate planes. All cellular parts detailed previously are highlighted in the same color scheme. (G) Annotation of the cell membrane and filaments corresponding to the membrane-proximal and the membrane distal rings for the tomogram shown in (A). (H and I) represent zoomed-in views of the left (l) side and the right (r) side of the invaginating septum of the segmentation in (G), respectively. Scale bars: (A) 200 nm, (B–E) 25 nm. Scale bars are omitted from (G–I) owing to their perspective nature. See also Figure 3—figure supplements 1 and 2. * A note regarding annotation of cytoskeletal filaments. In this and in subsequent figures, we have annotated membrane-distal bundle with dots in xy views, and in slices where we could not resolve them unambiguously, we have depicted them as dashed lines. We have depicted membrane-proximal bundle as dashed lines in xy views since in many instances it was not possible to resolve individual dots corresponding to the membrane-proximal bundle with full certainty. We used dashed lines to represent both the membrane-distal and the membrane-proximal cytoskeletal rings in rotated views (xz/yz slices) due to missing wedge issues and the quality of tomograms at times that made it difficult to assign continuity at the pixel level for all images.
Figure 3—figure supplement 1
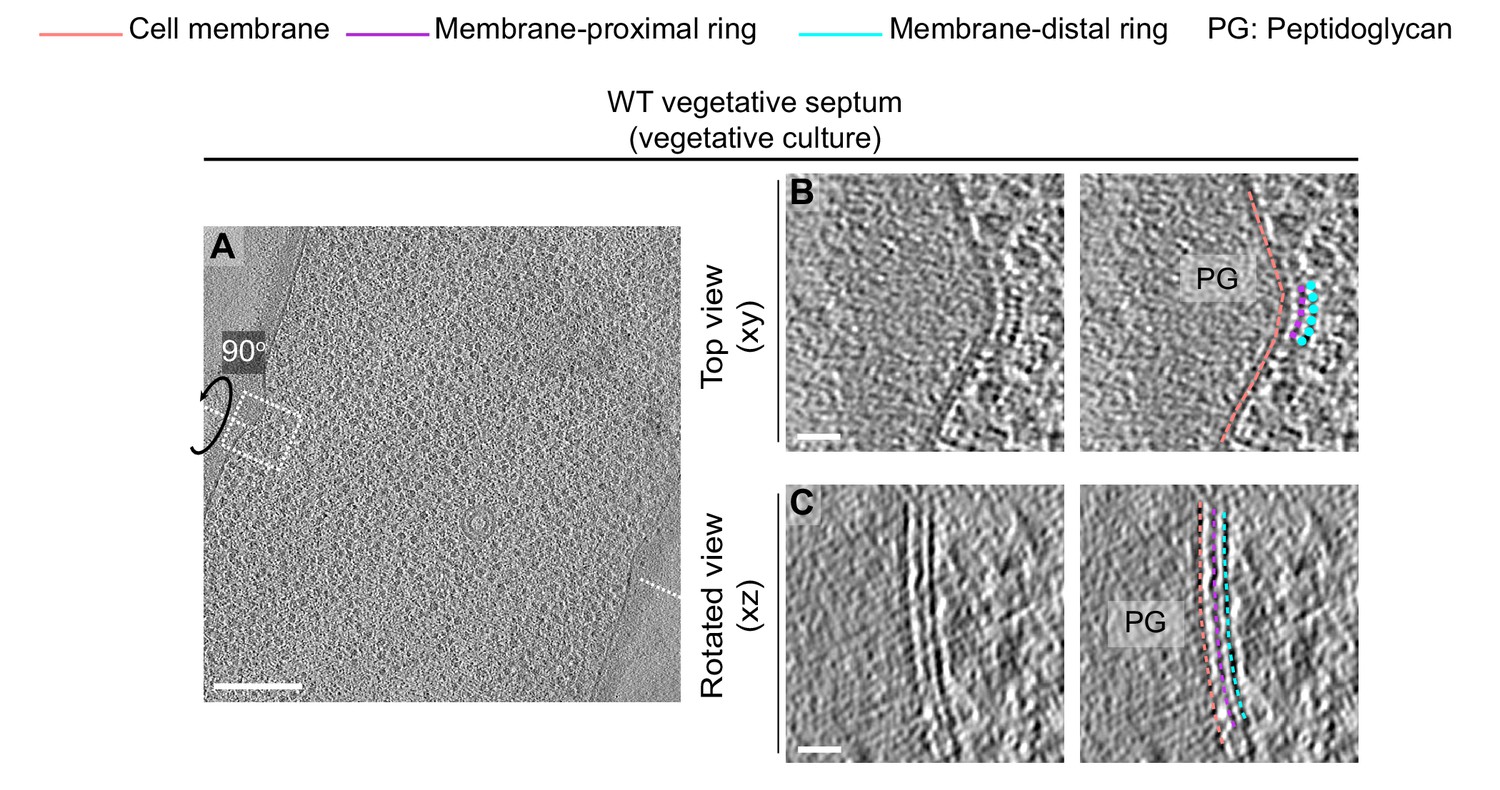
Cytoskeletal filaments in vegetative cells during exponential growth.
(A) Slice through a tomogram of a dividing vegetative cell under vegetative culture conditions (see Materials and methods). The inset highlights the left side of the leading edge of the invaginating septum. (B) Left panel: zoomed-in view of the inset in (A) in the xy coordinate plane. Right panel: same as left with peptidoglycan (gray), cell membrane (peach), membrane-proximal series of dots (pink) and membrane distal series of dots (blue) highlighted. The same color scheme for labeling cellular parts is followed throughout. (C) Left panel: view of the septal disc corresponding to (B) in the xz coordinate plane obtained by rotating the cell around its short axis by 90°. Right panel: same as left with different cellular parts and cytoskeletal filaments highlighted. Scale bars: (A) 200 nm, (B, C) 25 nm.
Figure 3—figure supplement 2
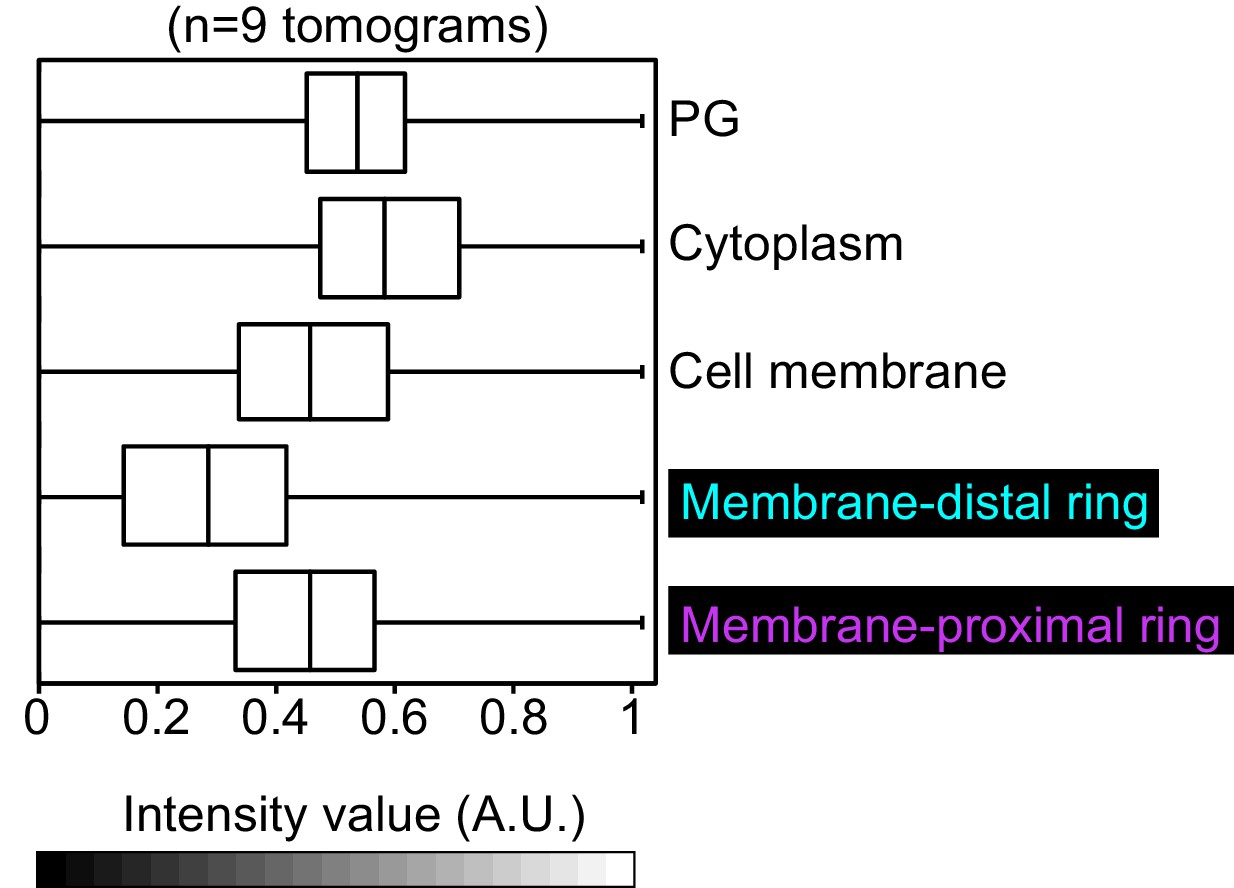
Intensity of cytoskeletal filaments in vegetative cells.
Box-and-whisker plot depicting the distribution of intensity values for the region traced by the membrane-distal and the membrane-proximal rings normalized in the range of 0–1. A region with approximately similar area was masked for peptidoglycan, cell membrane and cytoplasm as controls. Lower-intensity values (darker pixels) correspond to high mass density in the cryo-ET data.
Figure 3—video 1
Series of slices through the cryo-electron tomogram of a dividing vegetative B. subtilis cell shown in Figure 3A.
Insets highlight the leading edges of the dividing septum with cell division proteins visible as a series of dots coating the leading edge. See also Figure 3B, D.
Figure 3—video 2
Series of slices through the cryo-electron tomogram of a dividing vegetative B. subtilis cell shown in Figure 3A when the cell is rotated about its short axis by 90°.
The membrane-proximal and the membrane-distal rings shown in Figure 3C, E are indicated.
Figure 3—video 3
Series of slices through the cryo-electron tomogram of a dividing vegetative B. subtilis cell shown in Figure 3A wherein the cell membrane (peach), FtsA ring (pink) and FtsZ ring (blue) are annotated as in Figure 3G–I.
Figure 4
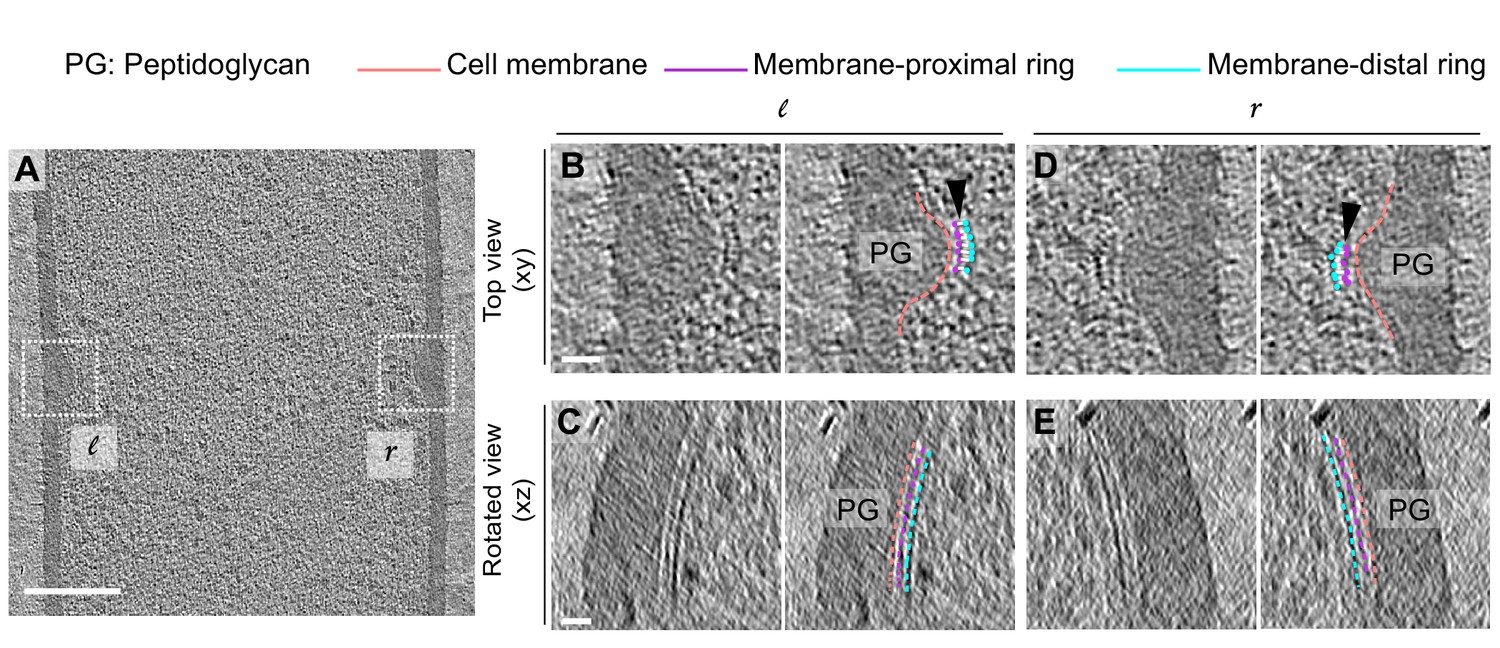
Architecture of bridging densities in the divisome of vegetative B. subtilis cells.
(A) Slice through a tomogram of a dividing vegetative cell. The insets (l for left and r for right side of the septum) highlight the leading edges of the invaginating septum. (B) Left panel: zoomed-in view of the ‘l’ inset in (A) in the xy coordinate plane. Right panel: same as left with peptidoglycan (PG; gray), cell membrane (peach), membrane-proximal series of dots (pink) and membrane-distal series of dots (blue) highlighted. ‘Ladder-like’ connection between the membrane-proximal and the membrane-distal bands is shown by white lines (indicated by a black arrow). The same color scheme is followed throughout. (C) Left panel: view of the septal disc corresponding to (B) in the xz coordinate plane obtained by rotating the cell around its short axis by 90°. Right panel: same as left with PG, cell membrane, membrane-proximal ring and membrane-distal ring highlighted. (D) Left panel: zoomed-in view of the inset ‘r’ in (A) in the xy coordinate plane. Right panel: same as left with cellular parts highlighted. (E) Left panel: view of the septal disc corresponding to (D) in the xz coordinate plane obtained by rotating the cell around its short axis by 90°. Right panel: same as left with cellular parts highlighted. Scale bars: (A) 200 nm, (B–E) 25 nm.
Figure 5 with 1 supplement
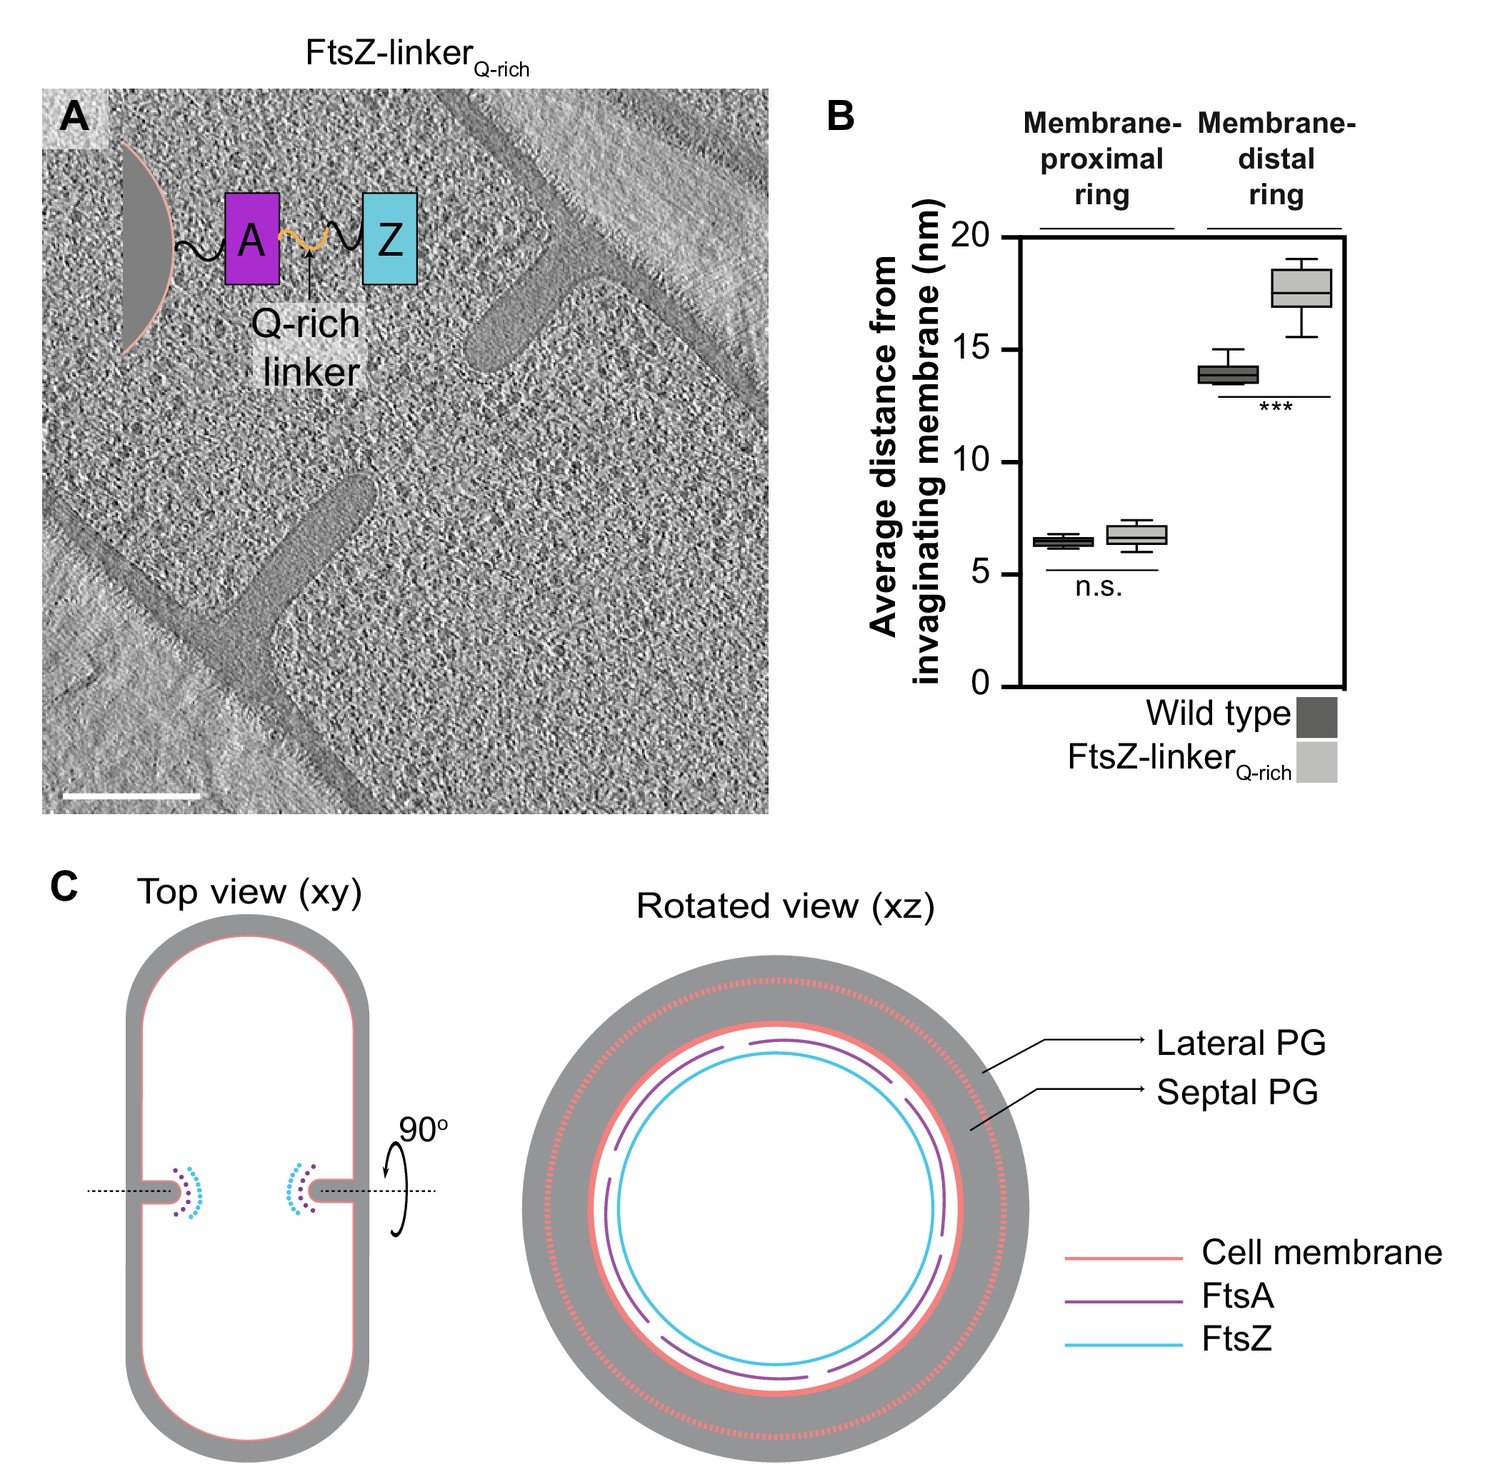
Identity of cytoskeletal filaments.
(A) Slice through a tomogram of FtsZ-linkerQrich dividing vegetative cell. A schematic showing the construction of the modified strain is overlaid on the tomogram slice wherein peptidoglycan (PG; gray) and cell membrane (peach) are highlighted. FtsZ (blue) is tethered to the membrane via FtsA (pink), and the two interact via a linker region (black + Q-rich linker in orange). Same color scheme is followed throughout. (B) Box-plot showing the distance of the membrane-proximal and the membrane-distal rings from the cell membrane in wild type and FtsZ-linkerQrich strains. Error bars indicate standard deviation (n.s.: p>0.05, ***p≤0.001, unpaired t-test). (C) Schematic illustrating the arrangement and identity of the cytoskeletal machinery with PG (gray), cell membrane (peach), FtsZ (blue) and FtsA (pink) highlighted. In the top view (xy coordinate plane), the cytoskeletal machinery is visible as two series of dots at the nascent septum. In the rotated view (xz coordinate plane), denser and more continuous ring formed by FtsZ is tethered to the membrane via a patchy ring formed by FtsA filaments. See also Figure 5—figure supplement 1, Figure 5—source data 1.
-
Figure 5—source data 1
Distance of the cytoskeletal rings (membrane-proximal FtsA and membrane-distal FtsZ) from the invaginating cellular membrane.
- https://cdn.elifesciences.org/articles/62204/elife-62204-fig5-data1-v2.xlsx
Figure 5—figure supplement 1
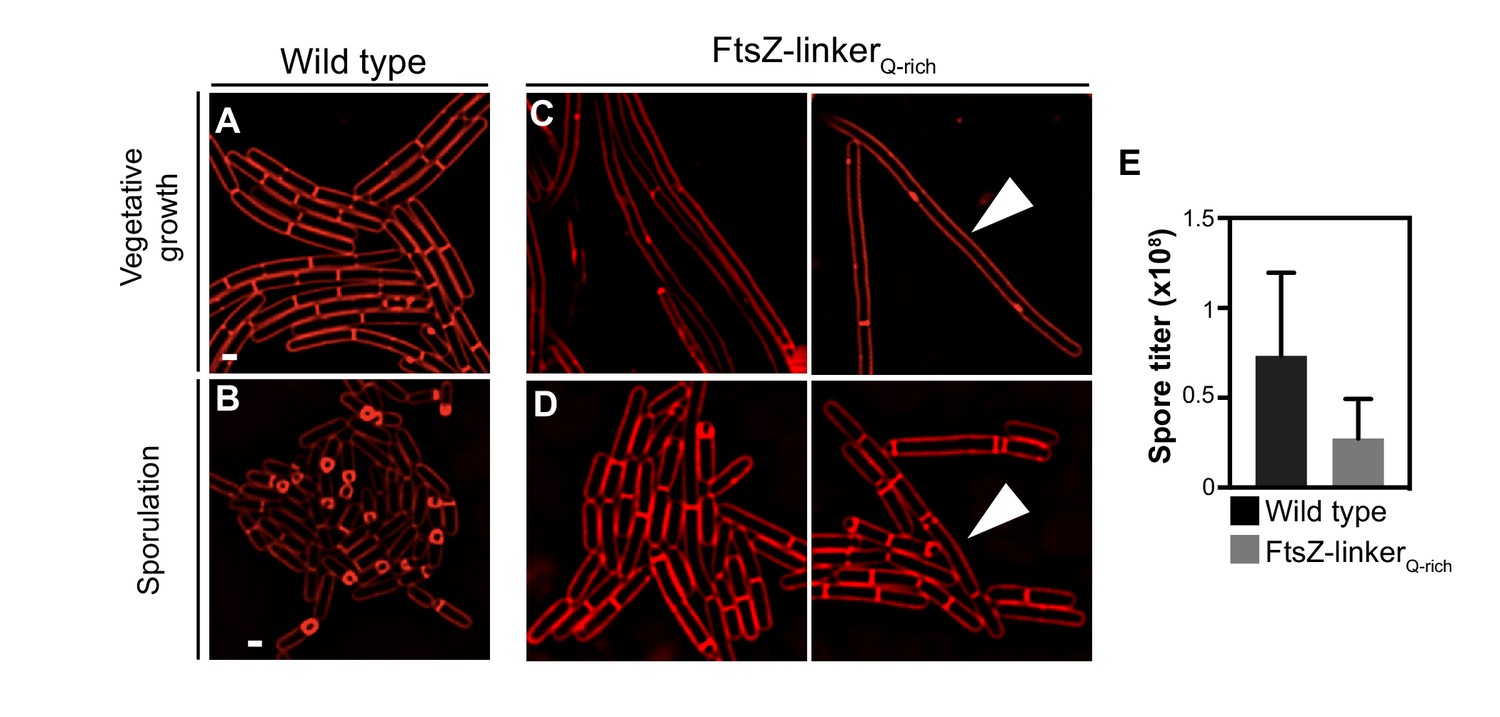
FtsZ-linkerQ-rich phenotype.
Morphology of wild-type B. subtilis (PY79) during (A) vegetative growth and (B) sporulation. Morphology of FtsZ-linkerQ-rich strain during (C) vegetative growth and (D) sporulation. Membranes are stained with FM4-64 (red). The cells indicated by white arrows in (C, D) show a filamentous phenotype and are longer compared to the wild type. (E) Spore titer of wild type and FtsZ-linkerQ-rich (see Materials and methods).
Figure 6 with 2 supplements
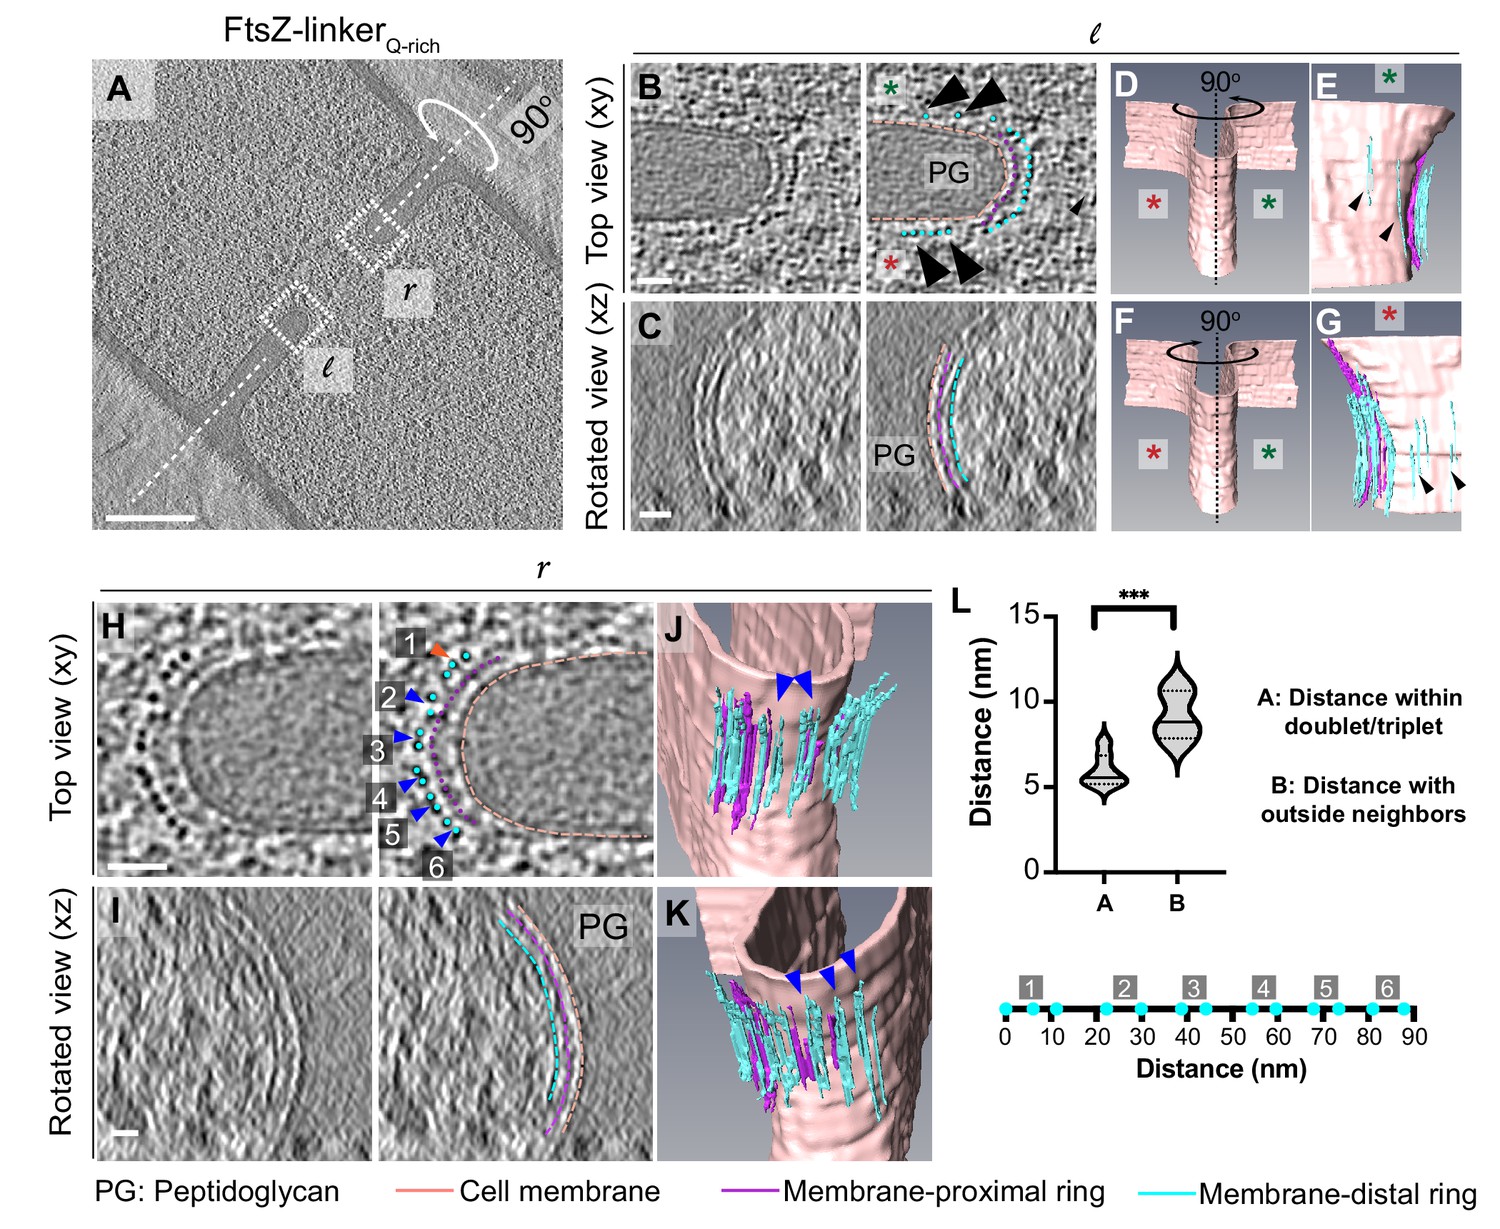
Cytoskeletal filaments in FtsZ-linkerQrich strain.
(A) Slice through a tomogram of a dividing cell expressing FtsZ-linkerQrich, as in Figure 5A. The insets (l for left and r right for right side of the septum) highlight the leading edge of the invaginating septum. (B) Left panel: zoomed-in view of the inset in (A) corresponding to ‘l’ in the xy coordinate plane. Right panel: same as left with peptidoglycan (PG, gray), cell membrane (peach), membrane-proximal series of dots (pink) and membrane-distal series of dots (blue) highlighted. Same color scheme is followed throughout. Black arrows indicate membrane-distal dots that are likely not tethered to the membrane via membrane-proximal dots. Green and red stars are used to differentiate the two opposite sides of the dividing septum. (C) Left panel: view of the septal disc corresponding to (B) in the xz coordinate plane obtained by rotating the cell around its short axis by 90o. Right panel: same as left with different cellular parts and cytoskeletal filaments highlighted. (D) Segmentation of the cell membrane (peach) corresponding to (B) and (C). Red and green stars indicate the two opposite sides. (E) View of the side highlighted by the green star obtained by rotating the cell by 90° as indicated in (D). Membrane-distal dots highlighted by black arrows in the right panel of (B) are highlighted. (F) Same as (D) except that the cell is rotated along its short axis by 90° to get a view of the septum side indicated by the red star. (G) View of the side highlighted by the red star. Membrane-distal dots highlighted by black arrows in the right panel of (B) are highlighted. (H) Left panel: zoomed-in view of the inset in (A) corresponding to ‘r’ in the xy coordinate plane. Right panel: same as left with different cellular parts highlighted. Doublets of the membrane-distal series of dots are indicated by blue arrows (labeled 2–6), and a possible triplet is indicated with an orange arrow (labeled 1). (I) Left panel: view of the septal disc corresponding to (H) in the xz coordinate plane obtained by rotating the cell around its short axis by 90o. Right panel: same as left with different cellular parts and cytoskeletal filaments highlighted. (J, K) Two views of the annotated cell membrane, membrane-proximal and membrane-distal filaments corresponding to (H) and (I). Doublets of membrane-distal filaments highlighted by blue arrows in the right panel of (H) are indicated in (J) and (K). (L) Violin plot showing the quantification of distances of membrane-distal dots indicated in the right panel of (H) within the doublets/triplet (as indicated by blue/orange arrows in the right panel of H) vs. distance of membrane-proximal dots with neighbor outside of the proposed doublet/triplet (***p≤0.001, unpaired t-test). Below the plot, membrane-proximal dots indicated in blue in the right panel in (H) are flattened and drawn to scale for context. Clusters labeled 1–6 in the right panel of (H) are also indicated. Scale bars: (A) 200 nm, (B, C, H, I) 25 nm. Scale bars are omitted from (D–G) and (J, K) owing to their perspective nature. See also Figure 6—figure supplements 1 and 2.
Figure 6—figure supplement 1
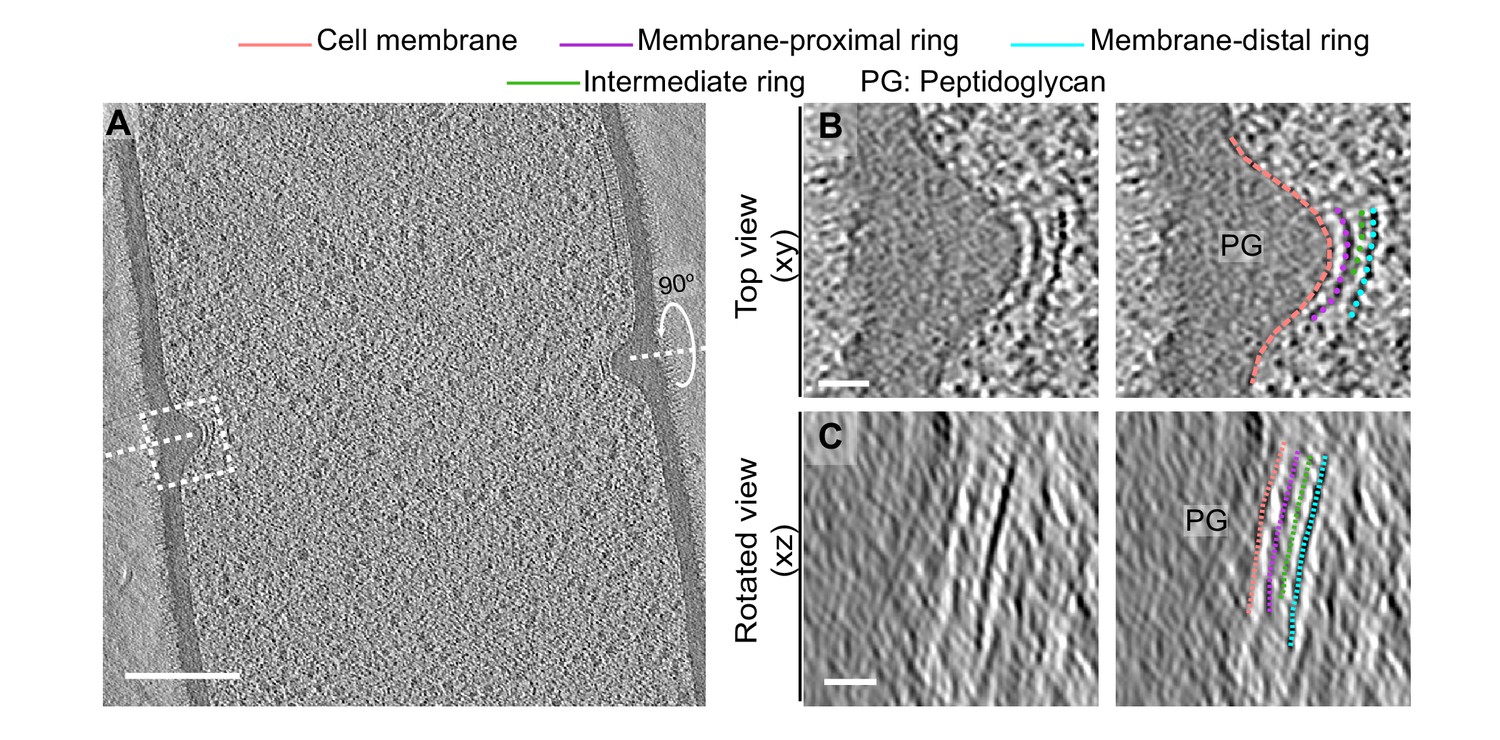
Cytoskeletal filaments in FtsZ-linkerQ-rich.
(A) Slice through a tomogram of a dividing FtsZ-linkerQ-rich vegetative cell. The inset highlights the left side of the leading edge of the invaginating septum. (B) Left panel: zoomed-in view of the inset in (A) in the xy coordinate plane. Right panel: same as left with peptidoglycan (PG; gray), cell membrane (peach), membrane-proximal series of dots (pink) and membrane-distal series of dots (blue) highlighted. An intermediate series of dots between the membrane-proximal and the membrane-distal series is highlighted in green. (C) Left panel: view of the septal disc corresponding to (B) in the xz coordinate plane obtained by rotating the cell around its short axis by 90o. Right panel: same as left with PG, cell membrane, membrane-proximal ring, membrane-distal ring and the intermediate ring (green) highlighted. Scale bars: (A) 200 nm, (B, C) 25 nm.
Figure 6—figure supplement 2
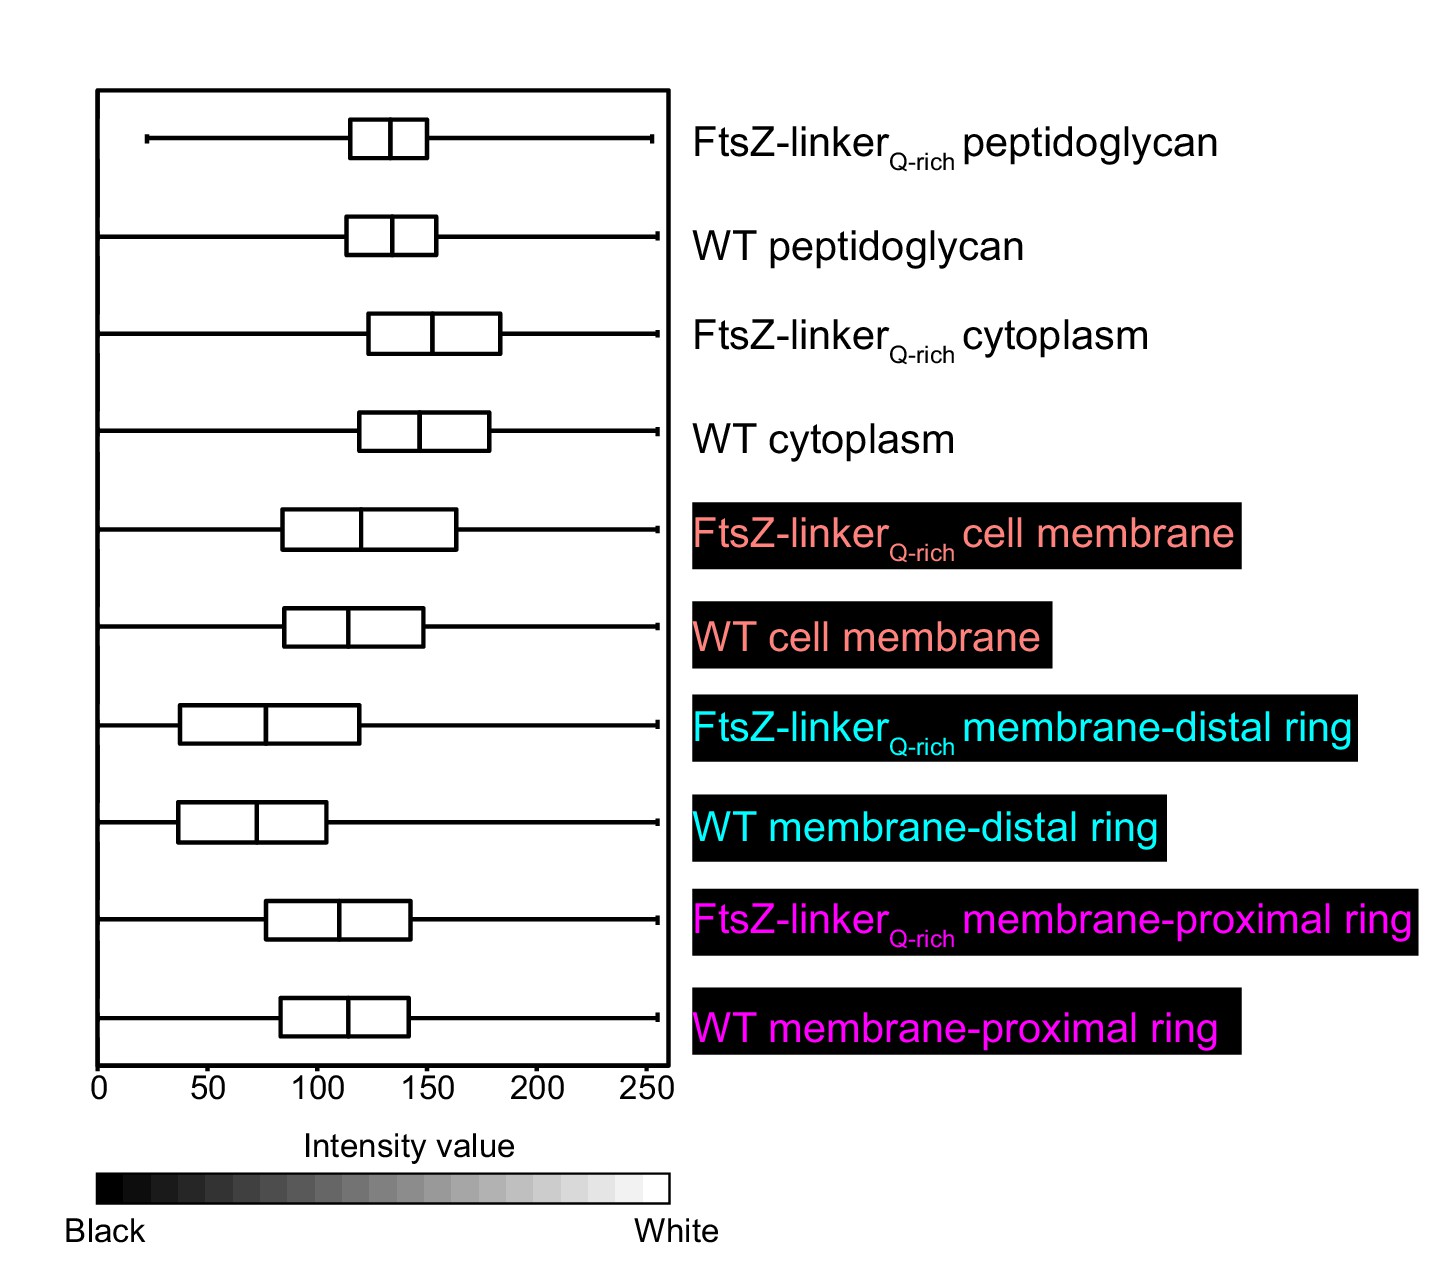
Intensity of cytoskeletal filaments in FtsZ-linkerQ-rich.
Box-and-whisker plot depicting the distribution of intensity values for the region traced by the membrane-distal and the membrane-proximal rings for wild type and FtsZ-linkerQ-rich normalized in the range of 0–1. A region with approximately similar area was masked for peptidoglycan, cell membrane and cytoplasm as controls for both strains. Lower-intensity values (darker pixels) correspond to high mass density in the cryo-ET data.
Figure 7 with 5 supplements
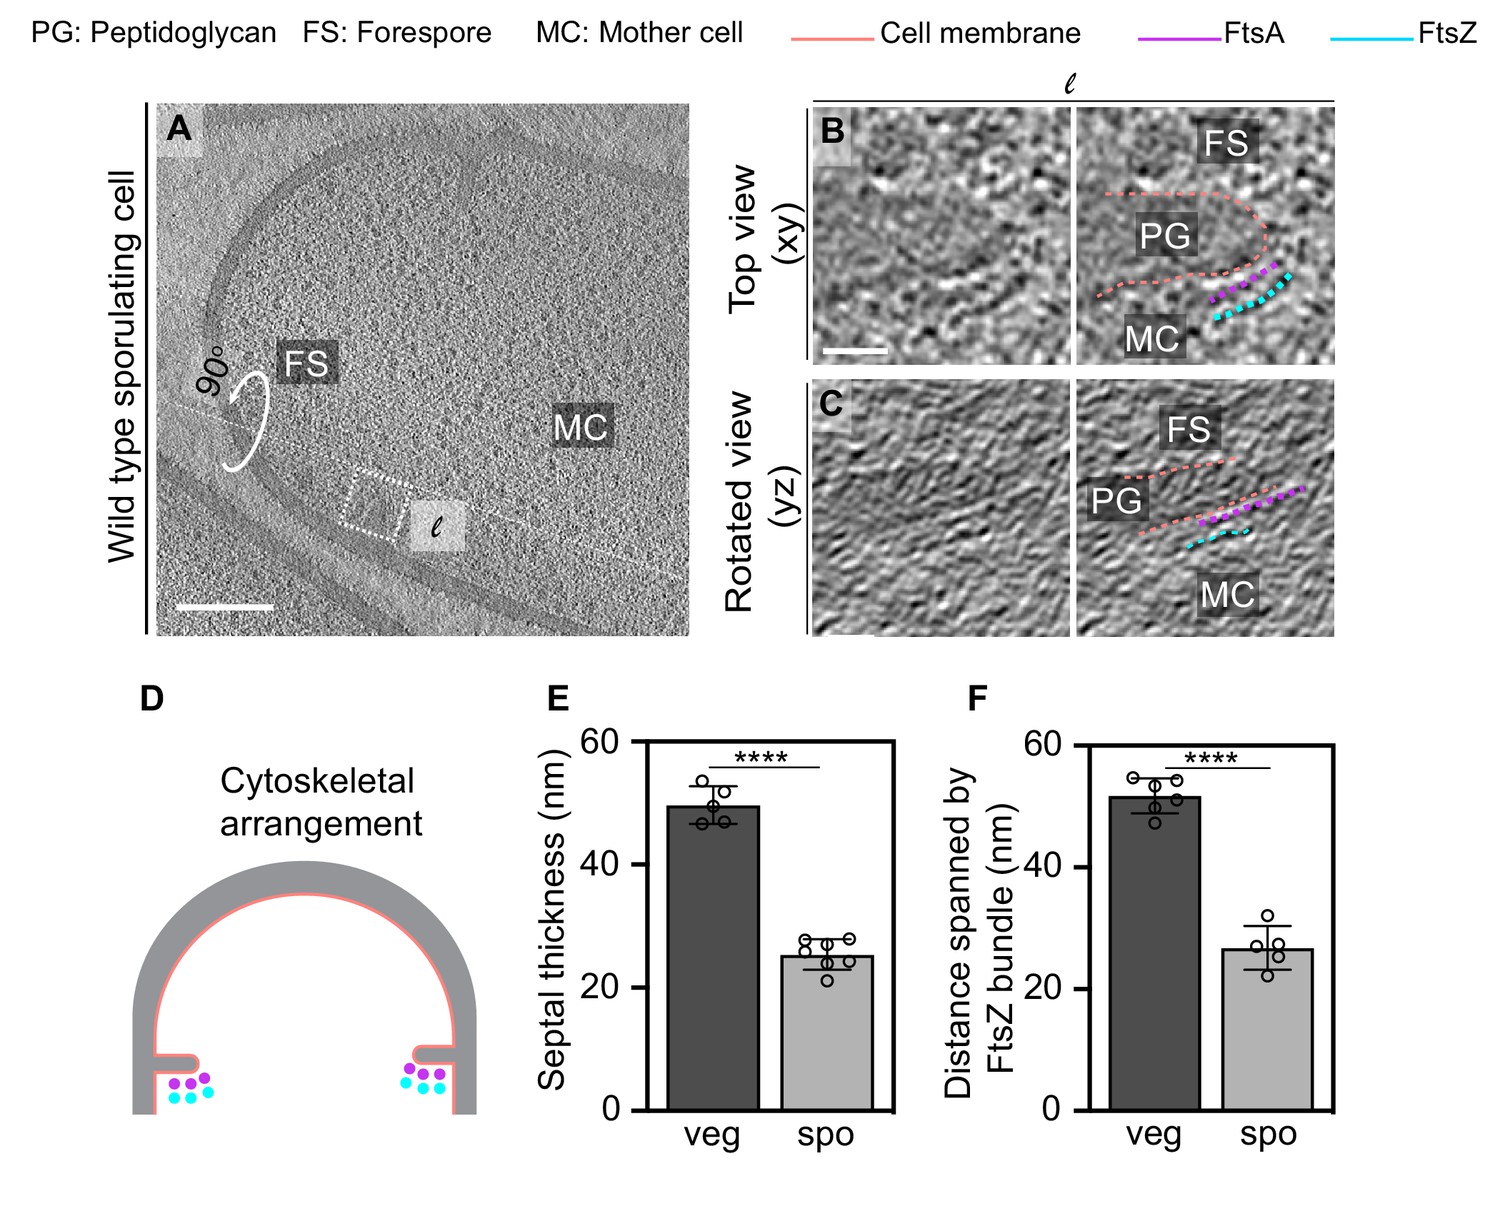
FtsAZ filaments during sporulation and septal thickness measurements.
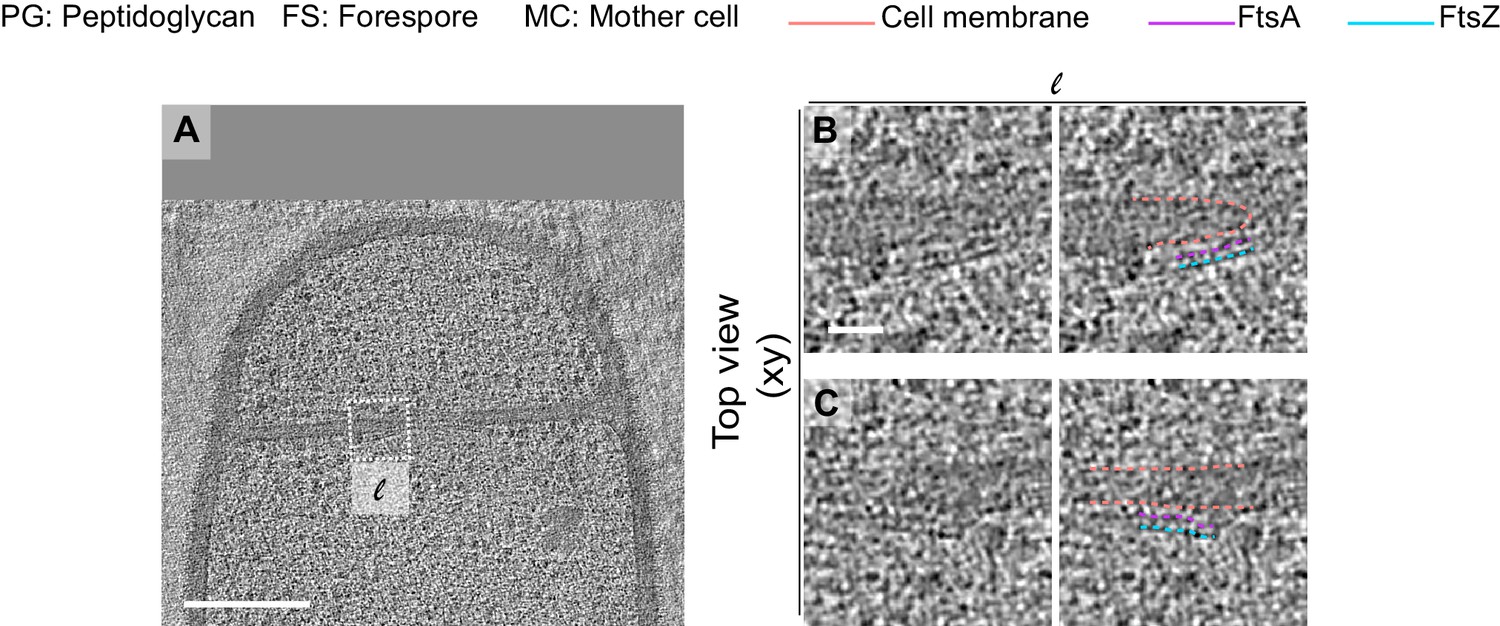
(A) Slice through a tomogram of a dividing sporulating cell. (B) Left panel: zoomed-in view of the inset in (A) in the xy coordinate plane. Right panel: same as left with peptidoglycan (gray), cell membrane (peach), FtsA bundle (pink) and FtsZ bundle (blue) highlighted. (C) Left panel: view of the septal disc corresponding to (B) in the yz coordinate plane obtained by rotating the cell around its long axis near the left side of the invaginating septum by 90o. Right panel: same as left with cellular parts and FtsAZ filaments highlighted. (D) Schematic of the arrangement of the cytoskeletal machinery during sporulation. (E, F) Bar graphs depicting (E) septal thickness and (F) distance spanned by FtsZ bundle in wild-type vegetative and sporulating cells. For both, error bars indicate standard deviation. Each dot indicates a sample point. (****p≤0.0001, unpaired t-test). Scale bars: (A) 200 nm, (B, C) 25 nm. See also Figure 7—figure supplements 1–5.
-
Figure 7—source data 1
Septal thickness in dividing vegetatively growing cells.
- https://cdn.elifesciences.org/articles/62204/elife-62204-fig7-data1-v2.xlsx
-
Figure 7—source data 2
Distance spanned by FtsZ bundle in dividing vegetatively growing cells and wild-type sporulating cells.
- https://cdn.elifesciences.org/articles/62204/elife-62204-fig7-data2-v2.xlsx
Figure 7—figure supplement 1
Visualizing cytoskeletal filaments in cross-sectional views in sporulating cells.
(A) A section of a dividing sporulating cell wherein peptidoglycan (PG; gray) and cell membrane (peach) are highlighted. The xyz coordinate axis represents the dimensions of the 3D specimen (same as in Figure 2). (B) Top panel: projection image of the cell in (A) in the xy coordinate plane. FtsA (pink) and FtsZ (blue) bundles are indicated on the mother cell side of the septum. Bottom panel: the corresponding projection image in the xz coordinate plane when the cell is rotated about its short axis by 90°. The lateral PG, septal PG and FtsAZ filaments as they project onto the orthogonal view (xz) are also highlighted. Same color scheme is followed throughout. (C) Left panel: same as top panel in (B). Right panel: the corresponding projection image in the yz coordinate plane when the cell is rotated about its long axis on the left side of the invaginating septum. (D) Left panel: same as top panel in (B). Right panel: the corresponding projection image in the yz coordinate plane when the cell is rotated about its long axis on the right side of the invaginating septum. For both (C) and (D), FtsAZ bundle and the corresponding filaments are also indicated.
Figure 7—figure supplement 2
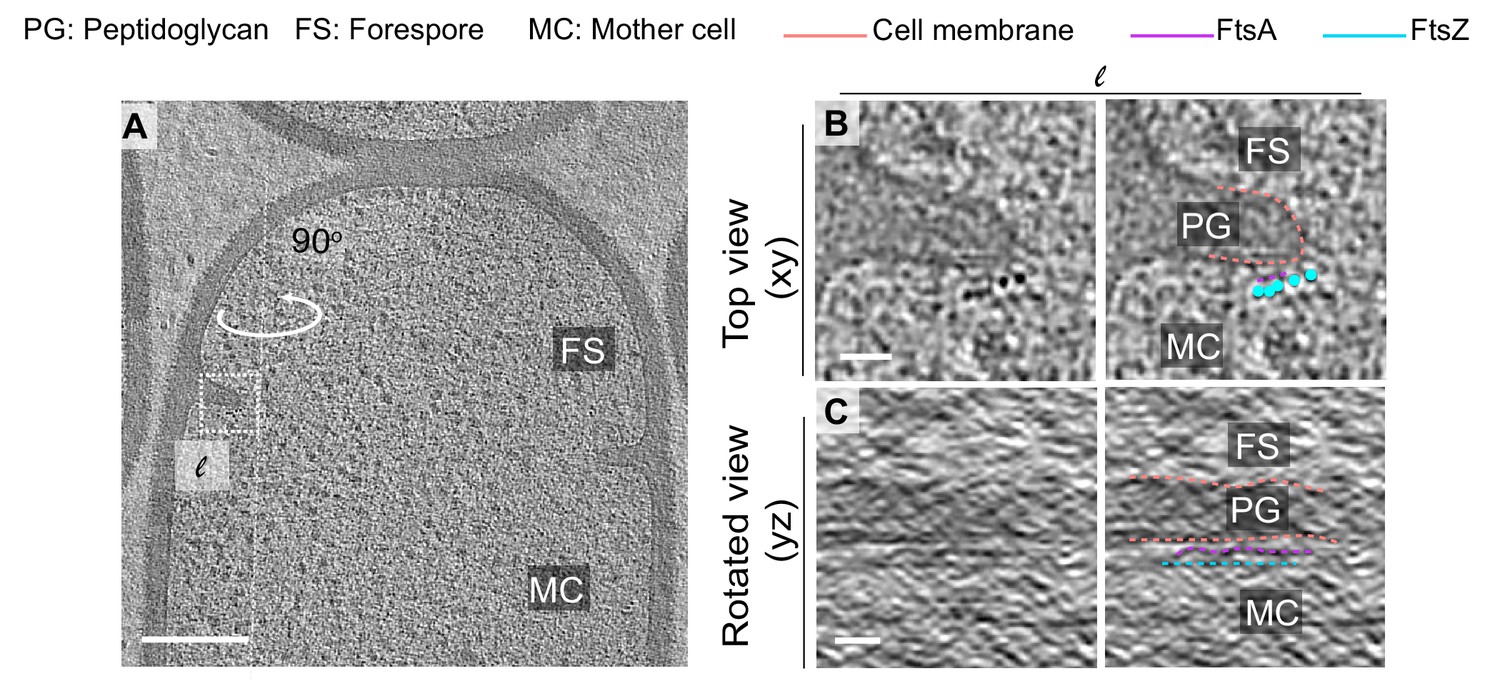
Additional example of FtsAZ localization during sporulation.
(A) Slice through a tomogram of a dividing wild-type sporangia. The inset highlights the left (l) side of the invaginating septum. (B) Left panel: zoomed-in view of the inset in (A) corresponding to ‘l’ in the xy coordinate plane. Right panel: same as left with peptidoglycan (gray), cell membrane (peach), FtsA bundle (pink) and FtsZ bundle (blue) highlighted. Same color scheme for labeling is followed throughout. (C) Left panel: view of the septal disc corresponding to (B) in the yz coordinate plane obtained by rotating the cell around its long axis near the left side of the invaginating septum by 90o. Right panel: same as left with different cellular parts and FtsAZ filaments highlighted. Scale bars: (A) 200 nm, (B, C) 25 nm.
Figure 7—figure supplement 3
Additional example of FtsAZ localization during sporulation.
(A) Slice through a tomogram of a dividing wild-type sporangia. The inset highlights the left (l) side of the invaginating septum. (B) Left panel: zoomed-in view of the inset in (A) corresponding to ‘l’ in the xy coordinate plane. Right panel: same as left with peptidoglycan (gray), cell membrane (peach), FtsA bundle (pink) and FtsZ bundle (blue) highlighted. Same color scheme for labeling is followed throughout. (C) Left panel: view of the septal disc corresponding to (B) in the yz coordinate plane obtained by rotating the cell around its long axis near the left side of the invaginating septum by 90o. Right panel: same as left with different cellular parts and FtsAZ filaments highlighted. Scale bars: (A) 200 nm, (B, C) 25 nm.
Figure 7—figure supplement 4
Additional example of FtsAZ localization during sporulation.
(A) Slice through a tomogram of a dividing wild-type sporangia at a later stage of septum constriction. The insets highlight the left (l) side and the right (r) side of the invaginating septum. (B) Left panel: zoomed-in view of the inset in (A) corresponding to ‘l’ in the xy coordinate plane. Right panel: same as left with peptidoglycan (gray), cell membrane (peach), FtsA (pink) and FtsZ (blue) highlighted. Same color scheme for labeling is followed throughout. (C) Left panel: zoomed-in view of the inset in (A) corresponding to ‘r’ in the xy coordinate plane. Right panel: same as left with different cellular parts highlighted. Scale bars: (A) 200 nm, (B, C) 25 nm.
Figure 7—figure supplement 5
Cytoskeletal filaments in SpoIIIEATP- mutant sporangia.
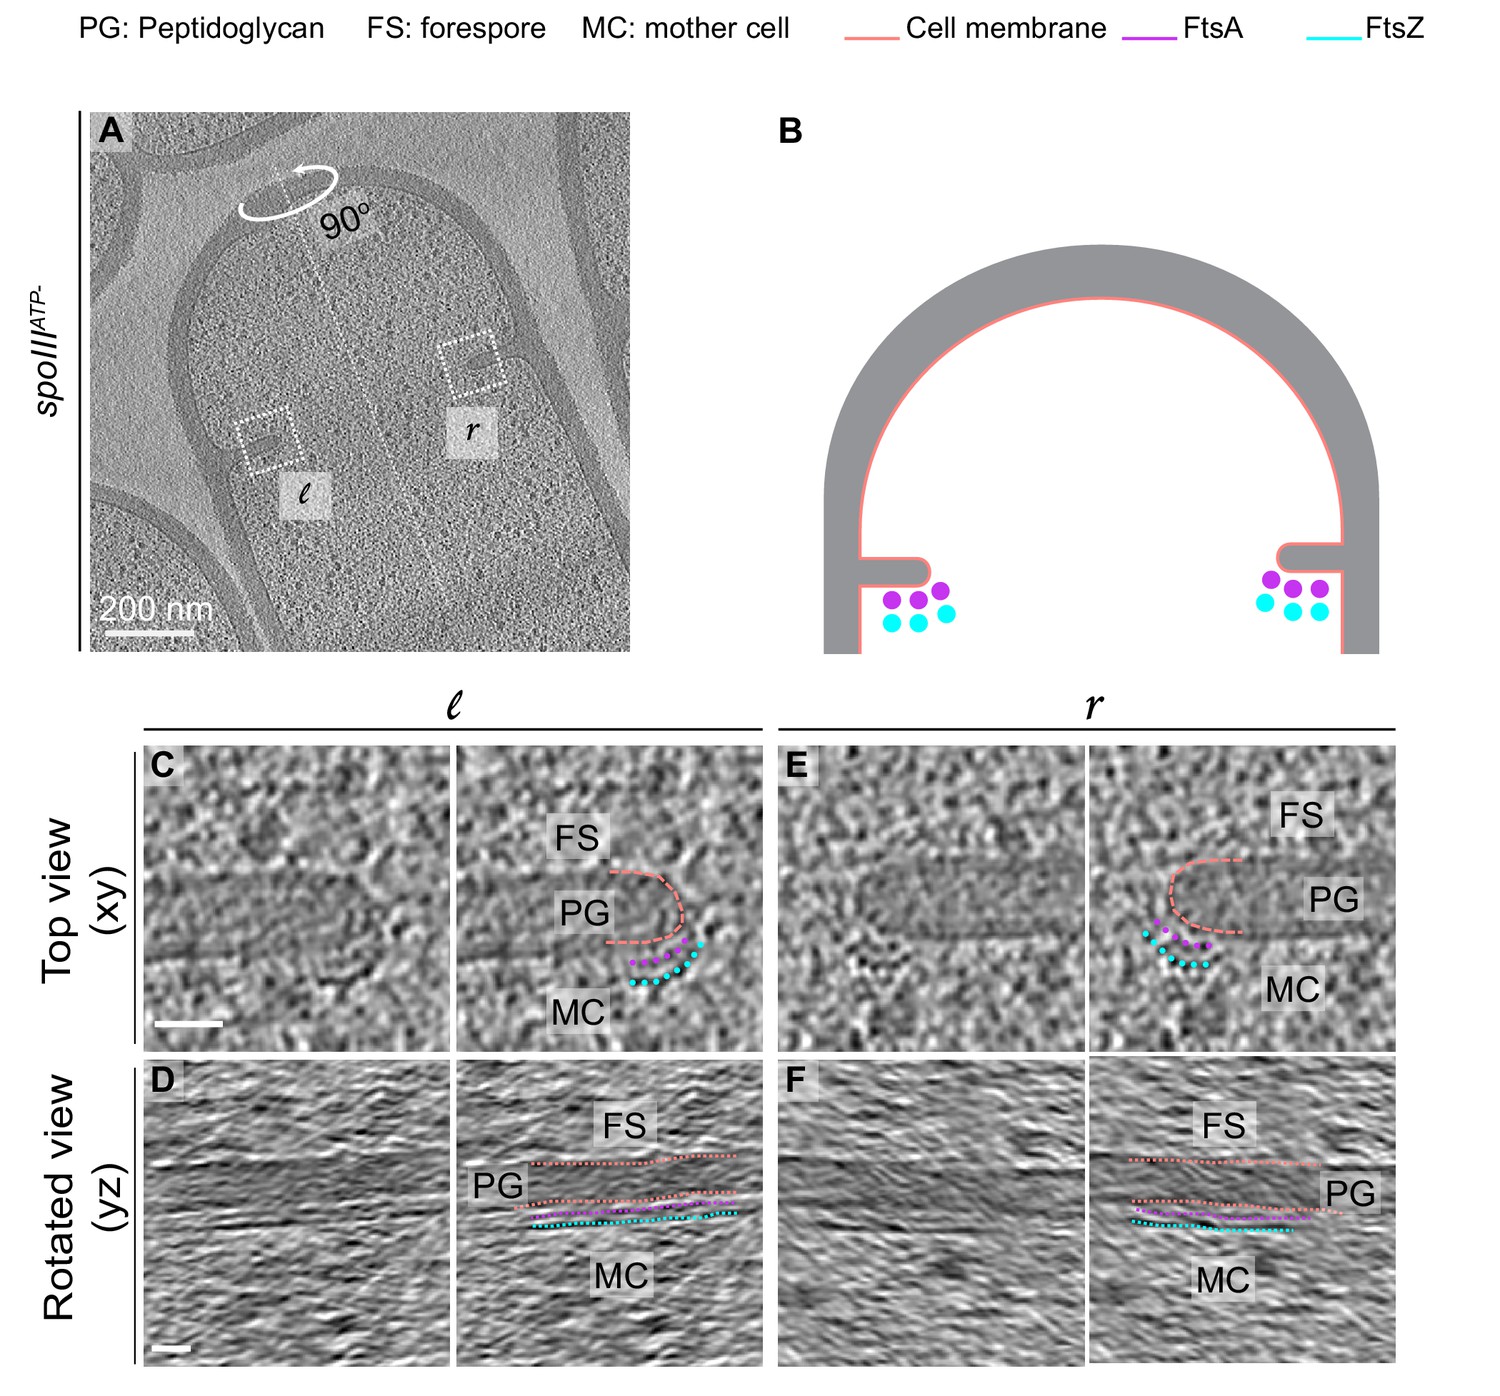
We were able to better resolve FtsAZ filaments in dividing cells of SpoIIIEATP- mutant sporangia during sporulation, where we observed them on the mother cell side of the septum (similar to wild type). We do not fully comprehend the reason behind this, although previous work has shown that the transmembrane protein SpoIIIE localizes to the leading edge of the constricting membrane (Fleming et al., 2010). (A) Slice through a tomogram of a dividing SpoIIIEATP- sporangium. The insets correspond to the left (l) and the right (r) side of the invaginating septum. (B) Schematic showing the arrangement of the cytoskeletal machinery in dividing SpoIIIEATP- sporangium with FtsAZ dots indicated. (C) Left panel: zoomed-in view of the inset in (A) corresponding to ‘l’ in the xy coordinate plane. Right panel: same as left with peptidoglycan (gray), cell membrane (peach), FtsA bundle (pink) and FtsZ bundle (blue) highlighted. Same color scheme for labeling is followed throughout. (D) Left panel: view of the septal disc corresponding to (C) in the yz coordinate plane obtained by rotating the cell around its long axis near the left side of the invaginating septum by 90o. Right panel: same as left with different cellular parts and FtsAZ filaments highlighted. (E) Left panel: zoomed-in view of the inset in (A) corresponding to ‘r’ in the xy coordinate plane. Right panel: same as left different cellular parts highlighted. (F) Left panel: view of the septal disc corresponding to (E) in the yz coordinate plane obtained by rotating the cell around its long axis near the right side of the invaginating septum by 90o. Right panel: same as left with different cellular parts and FtsAZ filaments highlighted. Scale bars: (A) 200 nm, (C–F) 25 nm.
Figure 8 with 5 supplements
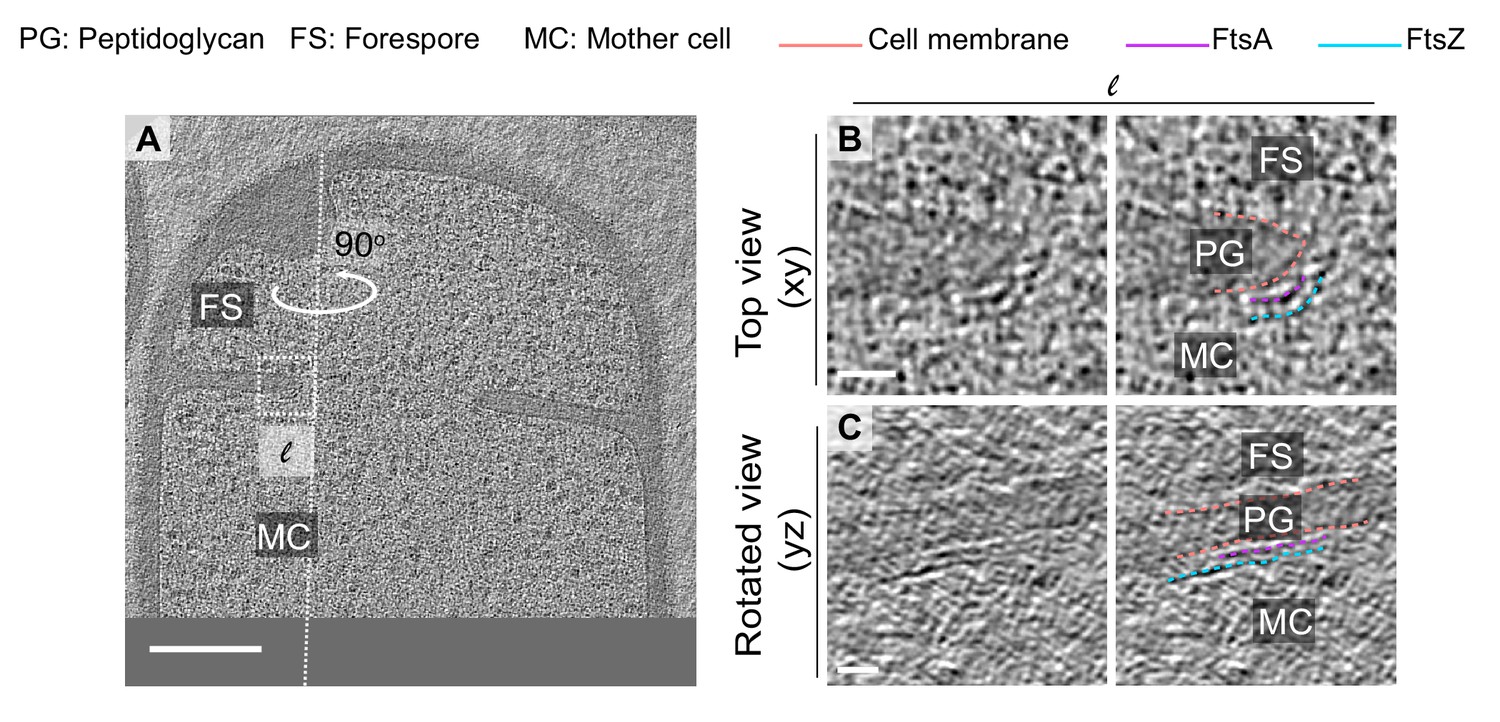
Localization of FtsAZ filaments in SpoIIE mutant sporangia.
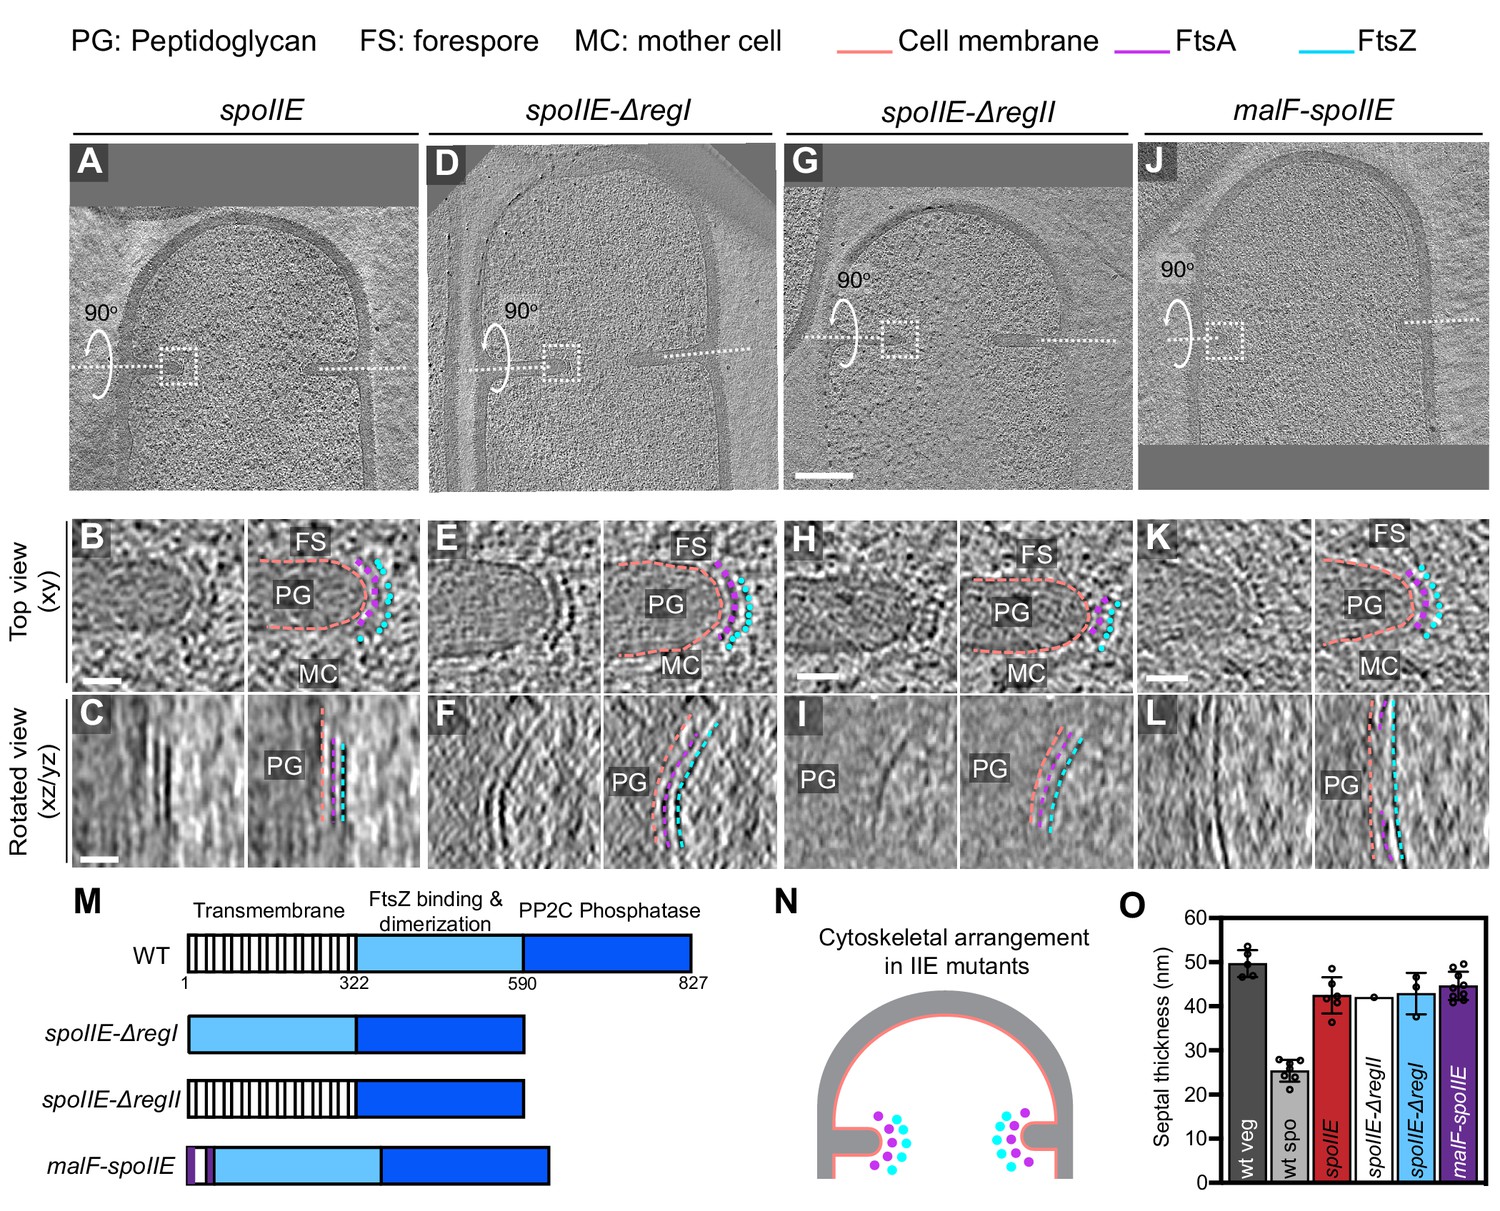
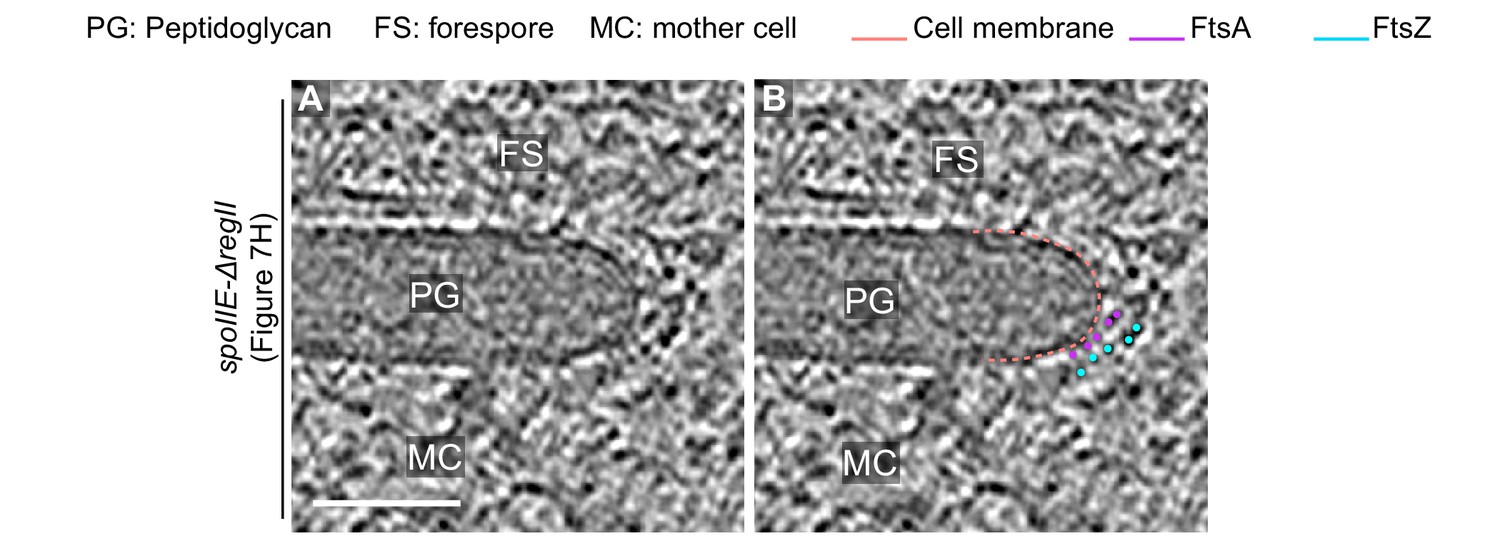
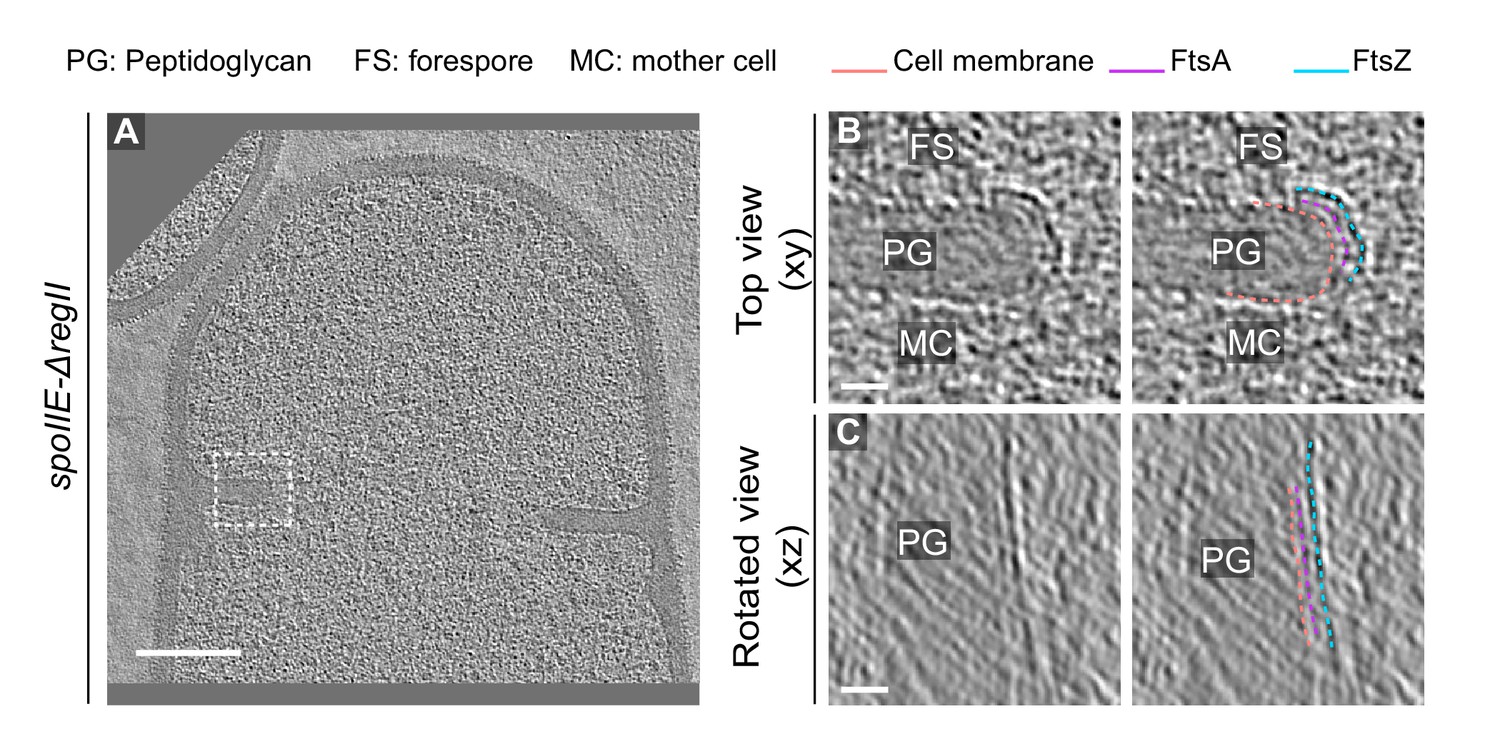
(A, D, G, J) Slice through a tomogram of a dividing (A) spoIIE, (D) spoIIE-ΔregI, (G) spoIIE-ΔregII and (J) malF-spoIIE sporangia. Insets highlight the left side of the invaginating septum for each case. (B, E, H, K) Left panel: zoomed-in view of the inset in (A, D, G, J), respectively, in the xy coordinate plane. Right panel: same as left with peptidoglycan (PG), forespore (FS) and mother cell (MC) compartments indicated in all. Cell membrane (peach), FtsA bundle (pink) and FtsZ bundle (blue) are also highlighted for all. (C, F, I, L) Left panel: view of the septal disc corresponding to (B, E, H, K), respectively, in the xz/yz coordinate plane obtained by rotating the cell around its short axis or long axis by 90o (yz plane for I and xz plane for the rest of the panels). Right panel: same as left with cellular parts and FtsAZ filaments highlighted. (M) Schematic highlighting the different domains of SpoIIE and construction of different spoIIE mutants. (N) Schematic of the arrangement of the cytoskeletal machinery in spoIIE mutant sporangia from (A) to (L). PG (gray), cell membrane (peach), FtsA dots (pink) and FtsZ dots (blue) are indicated. (O) Bar graph depicting the septal thickness in wild-type vegetative, wild-type sporulating cells and spoIIE mutant sporangia. Error bars indicate standard deviation. Each dot indicates a sample point. Scale bars: (A, D, G, J) 200 nm, (B, C, E, F, H, I, K, L) 25 nm. See also Figure 8—figure supplements 1–4, Figure 8—source data 1.
-
Figure 8—source data 1
Septal thickness in dividing vegetatively growing cells, wild-type sporulating cells and different spoIIE sporangia.
- https://cdn.elifesciences.org/articles/62204/elife-62204-fig8-data1-v2.xlsx
Figure 8—figure supplement 1
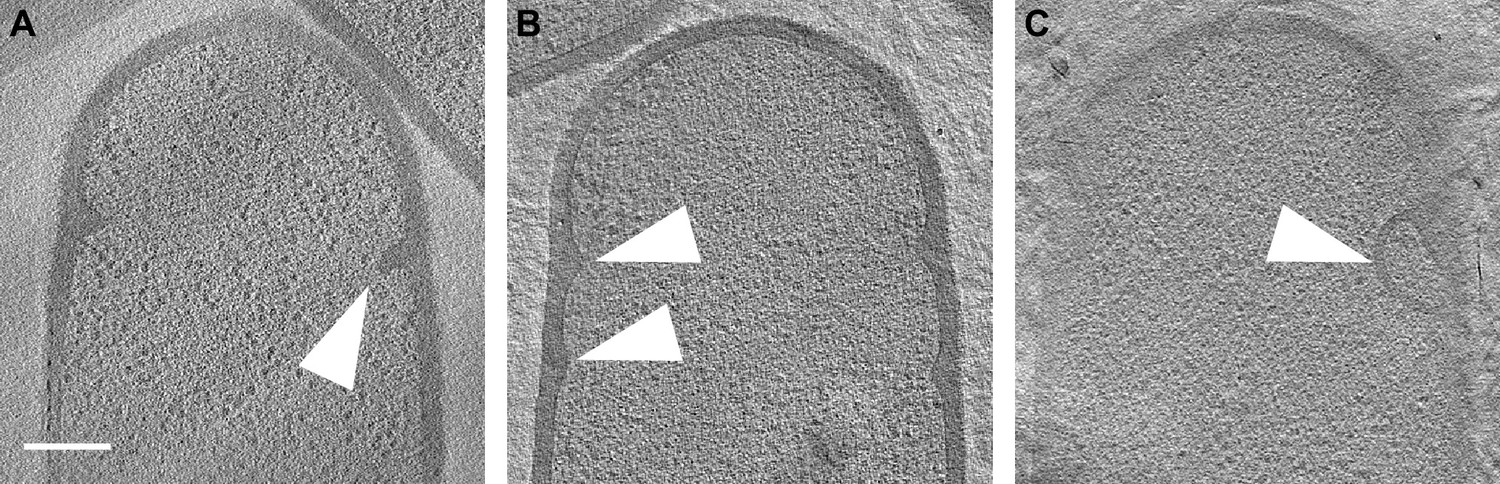
SpoIIE sporangia with abortive septa.
(A–C) Slices through tomograms of SpoIIE sporangia with abortive septa (indicated by white arrows). Scale bars: (A–C) 200 nm.
Figure 8—figure supplement 2
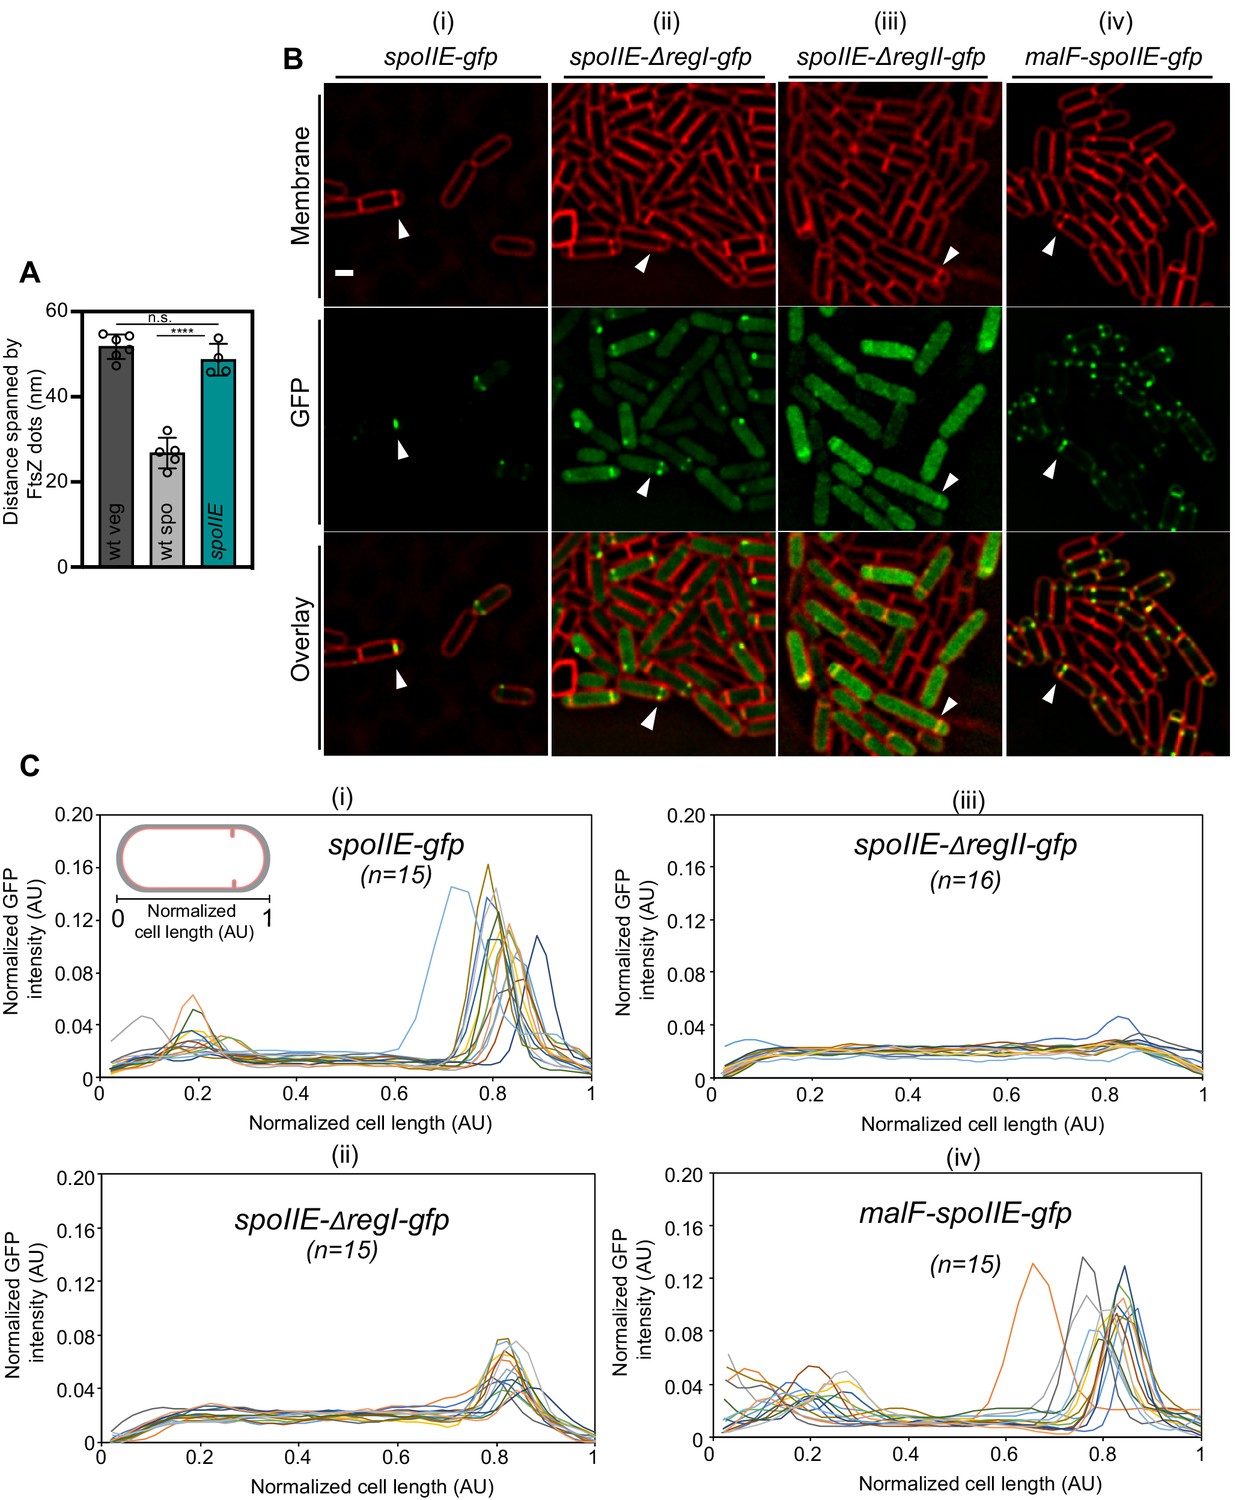
Characterization of SpoIIE mutant sporangia.
(A) Bar graph depicting the distance spanned by FtsZ bundle in wild-type vegetative cells, wild-type sporulating cells and SpoIIE null mutant sporangia. Error bars indicate standard deviation (n.s.: not significant, ****p<0.0001, unpaired t-test). Each dot indicates a sample point. (B) Fluorescence microscopy of GFP-tagged (green) (i) SpoIIE, (ii) SpoIIE-ΔregI, (iii) SpoIIE-ΔregII and (iv) MalF-SpoIIE sporangia. Membranes are stained with FM4-64 (red). Scale bar: 1 μm. White arrows indicate a representative sporulating cell for each case. (C) Line graphs showing normalized GFP intensity for (i–iv) in (B) along the normalized length of sporangia. n indicates the number of cells analyzed for each case. Each line represents a single cell. In agreement with a previous study using the same strains (Carniol et al., 2005), GFP signal corresponding to SpoIIE-ΔregI appeared mostly diffuse with some cells showing enrichment or punctate patterns at the polar septum (at 50% level compared to wild type), indicating some association with FtsZ. GFP signal corresponding to SpoIIE-ΔregII appeared almost completely diffuse in the cytoplasm, and GFP signal corresponding to MalF-SpoIIE localized similar to wild type, displaying punctate patterns at the polar septum.
Figure 8—figure supplement 3
Additional slice for SpoIIE-ΔregII sporangium shown in Figure 8H.
(A) Zoomed-in view of the inset in Figure 8G in the xy coordinate plane. This is a different slice from the 3D volume of the tomogram than shown in Figure 8H. (B) Same as left with peptidoglycan (PG), forespore (FS) and mother cell (MC) compartments indicated. Cell membrane (peach), FtsA bundle (pink) and FtsZ bundle (blue) are also highlighted. Scale bars: (A, B) 50 nm.
Figure 8—figure supplement 4
Additional example of FtsAZ localization in SpoIIE-ΔregII sporangium.
(A) Slice through a tomogram of a SpoII-ΔregII sporangium. The inset indicates the left side of the invaginating dividing septum. (B) Left panel: zoomed-in view of the inset in (A) in the xy coordinate plane. Right panel: same as left with peptidoglycan (gray), cell membrane (peach), FtsA (pink) and FtsZ (blue) highlighted. Same color scheme for labeling is followed throughout. (C) Left panel: view of the septal disc corresponding to (B) in the xz coordinate plane obtained by rotating the cell around its short axis near the left side of the invaginating septum by 90o. Right panel: same as left with different cellular parts and FtsAZ filaments highlighted. Scale bars: (A) 200 nm, (B, C) 25 nm.
Figure 8—video 1
Series of slices through the cryo-electron tomogram of a dividing sporulating B. subtilis cell shown in Figure 8H and Figure 8—figure supplement 3.
Inset highlights the leading edges of the dividing septum with cell division proteins visible as a series of dots coating the leading edge.
Figure 9 with 1 supplement
Role of SpoIIE in modulating FtsAZ filament localization.
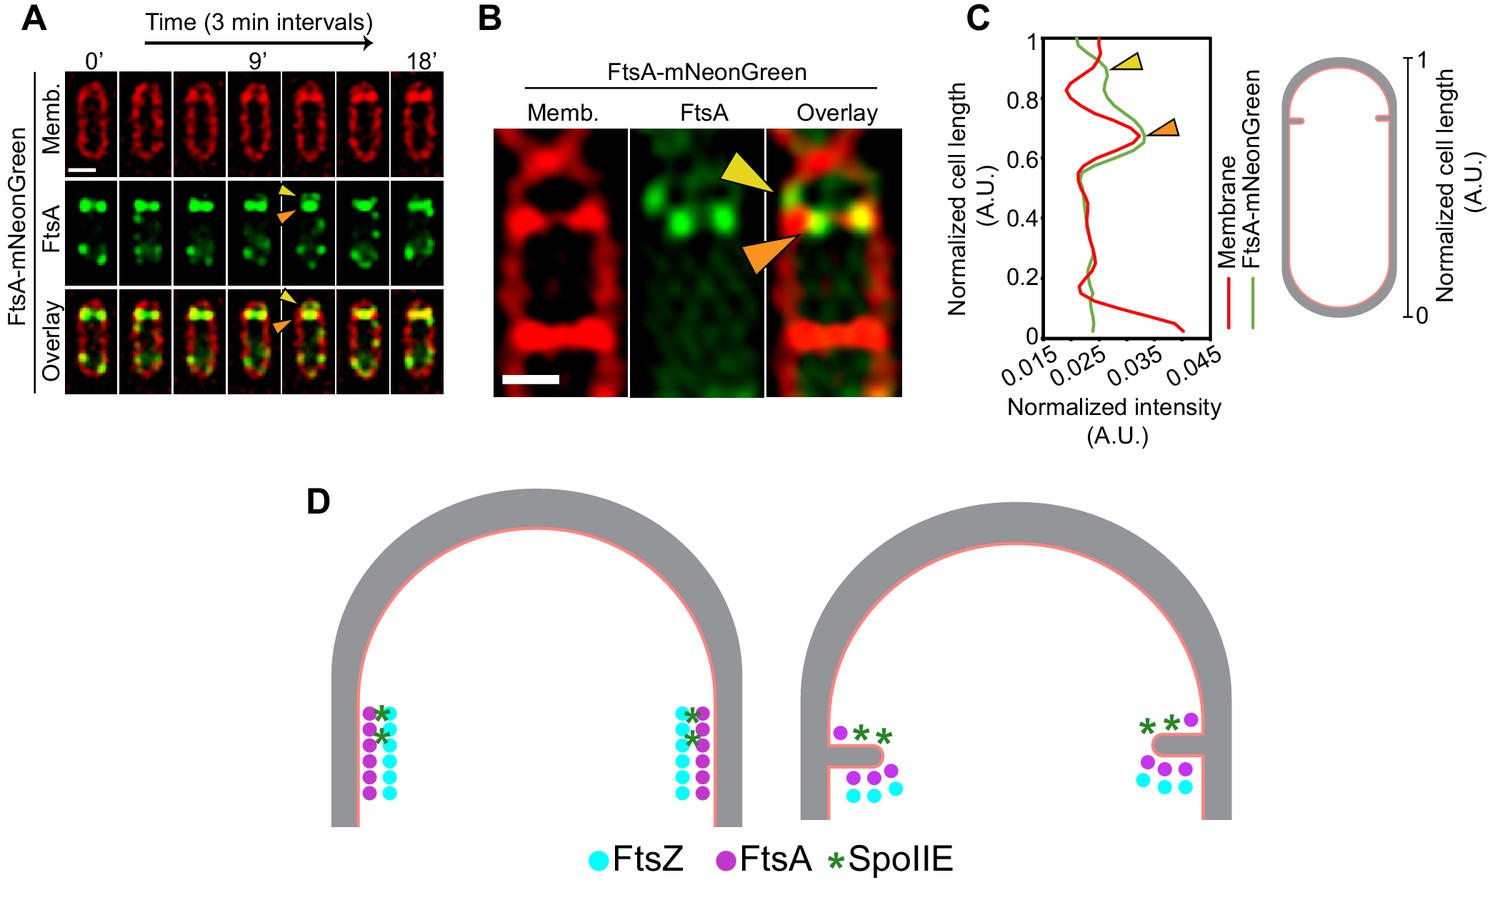
(A) Time-lapse fluorescence microscopy of a dividing sporangium with FtsA in green and membranes in red. Images are taken every 3 min. Between 12 and 15 min, two FtsA rings are visible, one that constricts and the other that seemingly stays behind at the forespore side of the septum. Yellow arrows indicate FtsA on the forespore side that does not constrict. (B) Structured-illumination microscopy of a dividing sporangia with FtsA in green and membranes in red. Puncta corresponding to FtsA are more clearly visible, two (orange) on either side of the septum that constrict and one (yellow arrow) that remains above the invaginating septum near the lateral edge, presumably on the forespore side. (C) Line graph showing the normalized intensity of the membrane (red) and FtsA-mNeonGreen (green) signal along the normalized length of the cell. Two peaks corresponding to two puncta of FtsA in (B) are indicated by orange and yellow arrows, respectively. (D) A possible model of how SpoIIE (green asterisks) affects the localization of FtsA (pink) and FtsZ (blue) filaments during sporulation (top view of the cell shown). Peptidoglycan (gray) and cell membrane (peach) are also highlighted. SpoIIE molecules are preferentially present on the forespore side and hence bind to FtsZ on the forespore side (brown asterisks). This may prevent binding of FtsA filaments (and likely other cell division proteins) to FtsZ on the forespore side and they stay behind at the forespore edge, while FtsAZ filaments on the mother cell side constrict. Scale bars: (A, B) 1 μm. See also Figure 9—figure supplement 1.
Figure 9—figure supplement 1
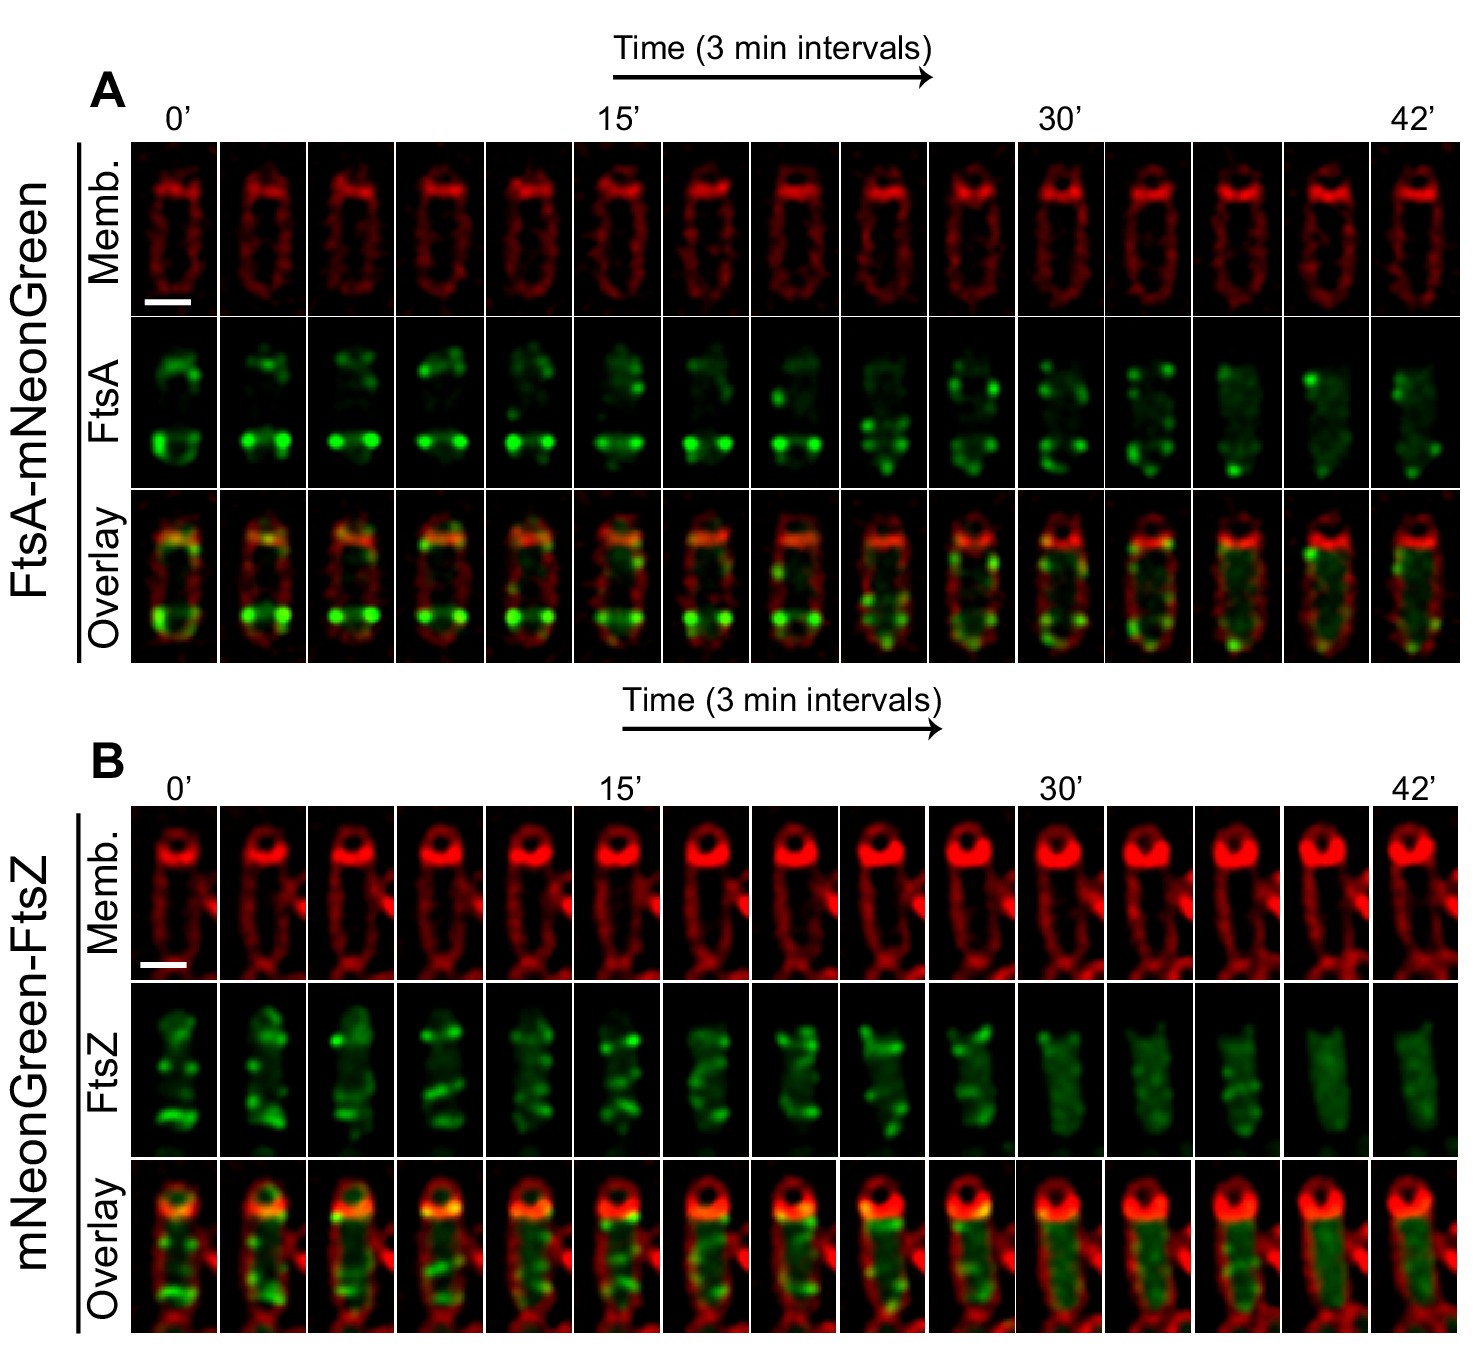
FtsAZ in the forespore during engulfment.
Time-lapse microscopy of (A) FtsA-mNeonGreen and (B) mNeonGreen-FtsZ sporangia. Membranes are stained red with FM4-64, FtsA and FtsZ tagged with mNeonGreen fluorescent protein. Images are taken every 3 min. After polar septation, as engulfment proceeds, mNeonGreen signal gradually diminished in both the strains exclusively in the forespore. Scale bars: (A, B) 1 μm.
Tables
Key resources table
| Reagent type (species) or resource | Designation | Source or reference | Identifiers | Additional information |
|---|---|---|---|---|
| Strain, strain background (Bacillus subtilis PY79) | PY79 | Youngman et al., 1984 | Tax. ID:1415167 | Wild type |
| Strain, strain background (Bacillus subtilis PY79) | KK240 | This study | ftsZ-linkerQ-richΩkan | |
| Strain, strain background (Bacillus subtilis PY79) | KP69 | Sandman et al., 1987 | spoIIE::Tn917 | |
| Strain, strain background (Bacillus subtilis PY79) | KC548 | Carniol et al., 2005 | spoIIE::phleo spoIIA::cat amyE::spoIIE-ΔregII-gfp cat spc | |
| Strain, strain background (Bacillus subtilis PY79) | KC549 | Carniol et al., 2005 | spoIIE::phleo spoIIA::cat amyE::spoIIE-ΔregI-gfp cat spc | |
| Strain, strain background (Bacillus subtilis PY79) | KC538 | Carniol et al., 2005 | spoIIE::phleo spoIIA::spec amyE::malF-spoIIE-ΔregI gfp spc kan | |
| Strain, strain background (Bacillus subtilis PY79) | bAB167 | Bisson-Filho et al., 2017 | ftsA-mNeonGreen(SW) ftsA | |
| Strain, strain background (Bacillus subtilis PY79) | bAB185 | Bisson-Filho et al., 2017 | mNeonGreen ftsZ | |
| Recombinant DNA reagent | pJLG142 | This study | ftsZ-ssrAΩloxPKmloxP | |
| Chemical compound, drug | FM4-64 | Thermo Fisher Scientific | Cat#T13320 | |
| Software, algorithm | IMOD | Mastronarde, 1997 | http://bio3d.colorado.edu/imod/; RRID:SCR_003297 | |
| Software, algorithm | TomoSegMemTV | Martinez-Sanchez et al., 2014 | https://sites.google.com/site/3demimageprocessing/tomosegmemtv | |
| Software, algorithm | Amira | Commercial software by Thermo Scientific (formerly FEI) | https://www.fei.com/software/amira-3d-for-life-sciences/; RRID:SCR_014305 | |
| Software, algorithm | SerialEM | Mastronarde, 2005 | http://bio3d.colorado.edu/SerialEM/ | |
| Software, algorithm | MATLAB code to calculate intensities of cytoskeletal rings | This paper; Source code 1 | ||
| Software, algorithm | MATLAB code to calculate GFP/mNeonGreen intensity along cell length | This paper; Source code 2 |
Additional files
-
Source code 1
Custom-built MATLAB script to calculate the intensities of cytoskeletal rings from cryo-ET data (see Figure 3—figure supplement 2 and Figure 6—figure supplement 2).
- https://cdn.elifesciences.org/articles/62204/elife-62204-code1-v2.zip
-
Source code 2
Custom-built MATLAB script to calculate normalized GFP/mNeonGreen/FM$-64 intensities for each cell along its normalized length (see Figure 8—figure supplement 2C and Figure 9C).
- https://cdn.elifesciences.org/articles/62204/elife-62204-code2-v2.zip
-
Transparent reporting form
- https://cdn.elifesciences.org/articles/62204/elife-62204-transrepform-v2.docx
Download links
A two-part list of links to download the article, or parts of the article, in various formats.
Downloads (link to download the article as PDF)
Open citations (links to open the citations from this article in various online reference manager services)
Cite this article (links to download the citations from this article in formats compatible with various reference manager tools)
Asymmetric localization of the cell division machinery during Bacillus subtilis sporulation
eLife 10:e62204.
https://doi.org/10.7554/eLife.62204


