Identification of human glucocorticoid response markers using integrated multi-omic analysis from a randomized crossover trial
- Department of Internal Medicine and Clinical Nutrition, Institute of Medicine at Sahlgrenska Academy, University of Gothenburg, Sweden
- Endocrinology, Diabetology and Metabolism, Sahlgrenska University Hospital, Sweden
- Department of Molecular and Clinical Medicine, Institute of Medicine at Sahlgrenska Academy, University of Gothenburg, Sweden
- Institute of Health and Care Sciences, Sahlgrenska Academy, University of Gothenburg, Sweden
- Division of Developmental Biology & Medicine, Faculty of Biology, Medicine and Health, University of Manchester, United Kingdom
- Clinical and Translational Research Institute, Newcastle University, United Kingdom
- BHF/University Centre for Cardiovascular Science, University of Edinburgh, United Kingdom
- Department of Medical Endocrinology and Metabolism, Copenhagen University Hospital, Denmark
- Department of Clinical Medicine, Faculty of Health and Medical Sciences, University of Copenhagen, Denmark
- Wallenberg Laboratory, Department of Molecular and Clinical Medicine, Institute of Medicine at Sahlgrenska Academy, University of Gothenburg, Sweden
- Innovation Strategies and External Liaison, Pharmaceutical Technologies and Development, Sweden
Figures
Figure 1
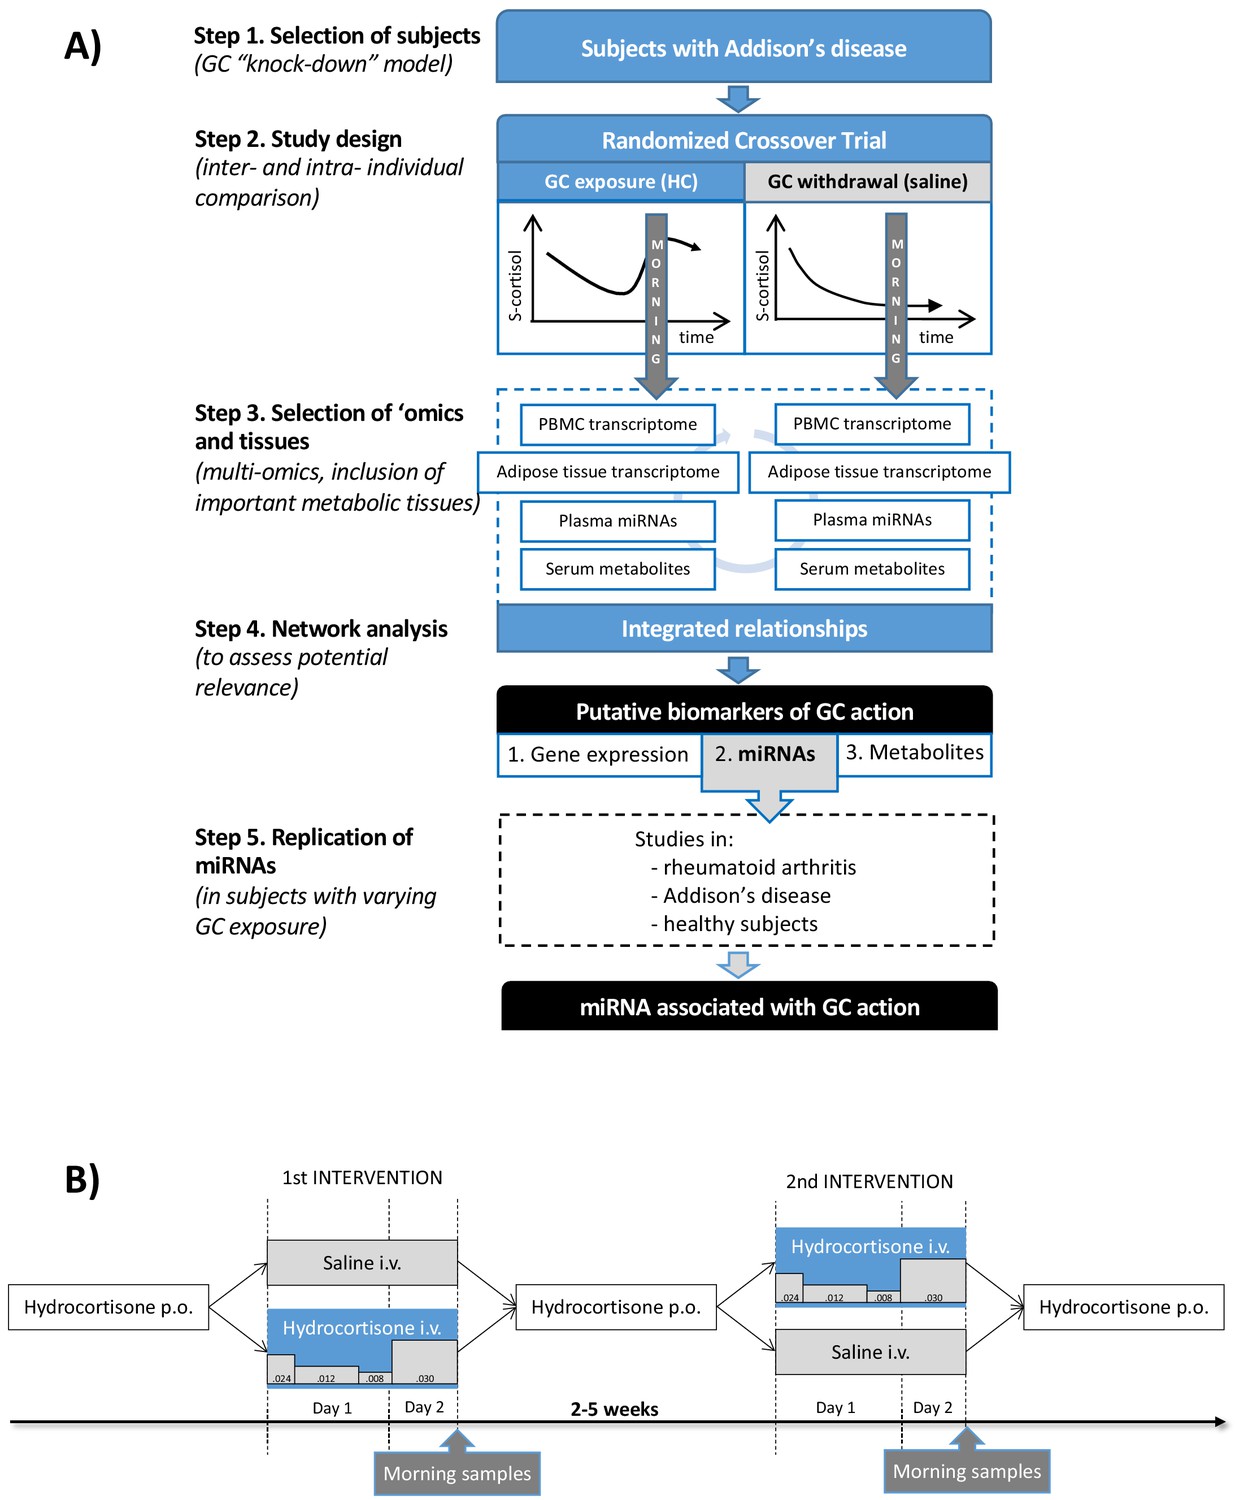
Clinical and analytical part of the exploratory study and the replication step.
(A) Subjects with Addison’s disease (primary adrenal insufficiency, step 1) were studied in a random order during both physiological glucocorticoid (GC) exposure and GC withdrawal (step 2). Transcriptomics (whole-genome expression) in peripheral blood mononuclear cells (PBMCs) and adipose tissue (n = 28,869,869 genes), plasma miRNAomics (n = 252), and serum metabolomics in morning samples were analyzed (n = 164) (step 3). Integration of the multi-omic data derived a network including gene expression (derived from two independent tissues), microRNAs (miRNAs), and metabolites that were statistically differentiated between the two interventions (step 4). The miRNA findings, because of their centrality in the network, were replicated in subjects with different GC exposures (within the physiological range) from three independent studies (step 5). (B) Subjects with Addison’s disease (primary adrenal insufficiency) received in a random order intravenous (i.v.) hydrocortisone (HC) infusion mixed in 0.9% saline in a circadian pattern (physiological GC exposure) or the same volume of 0.9% saline alone (GC withdrawal) during 22 hr starting at 9 AM more than 2 weeks apart. During the GC exposure, HC(Solu-Cortef) was administered at a dose of 0.024 mg/kg/hr between 9 AM and 12 PM (first day), 0.012 mg/kg/hr between 12 PM and 8 PM (first day), 0.008 mg/kg/hr between 8 PM and 12 AM (first day), and 0.030 mg/kg/hr between 12 AM and 7 AM (second day). Samples for the ‘omics analyses were collected at 7 AM on day 2 of the intervention (morning samples). p.o.: oral.
Figure 2
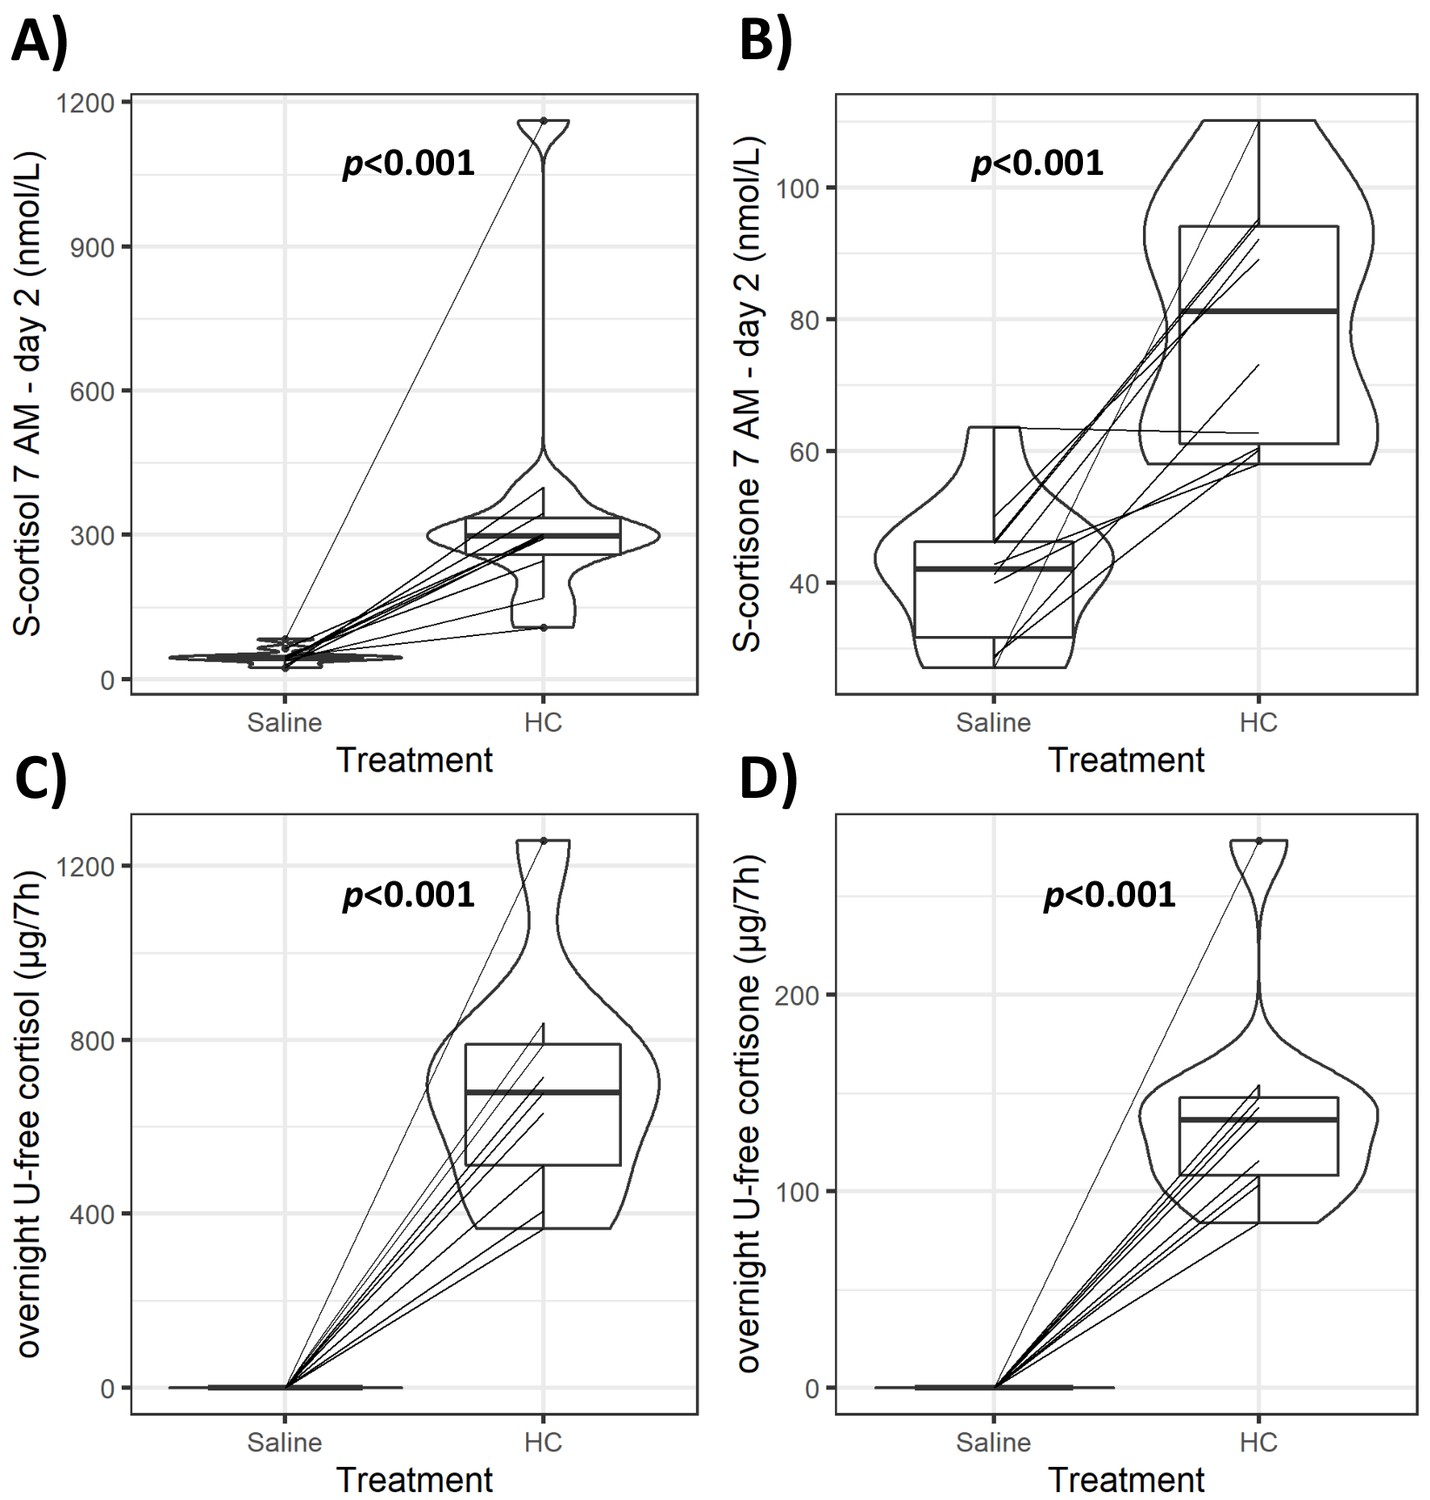
Violin plots of serum and urinary glucocorticoids (GCs) during GC exposure and withdrawal.
Individual data and changes for morning (7 AM) serum cortisol and cortisone (A, B), and overnight (12 AM to 7 AM) urinary-free (U-free) cortisol and cortisone (C, D) from both interventions. Boxes represent interquartile range (IQR); whiskers mark spread of points within 1.5 times IQR; violins demonstrate distribution of results with the maximum width representing the highest density within each violin. Difference of median values between interventions is presented with p-values. HC: hydrocortisone.
Figure 3 with 4 supplements
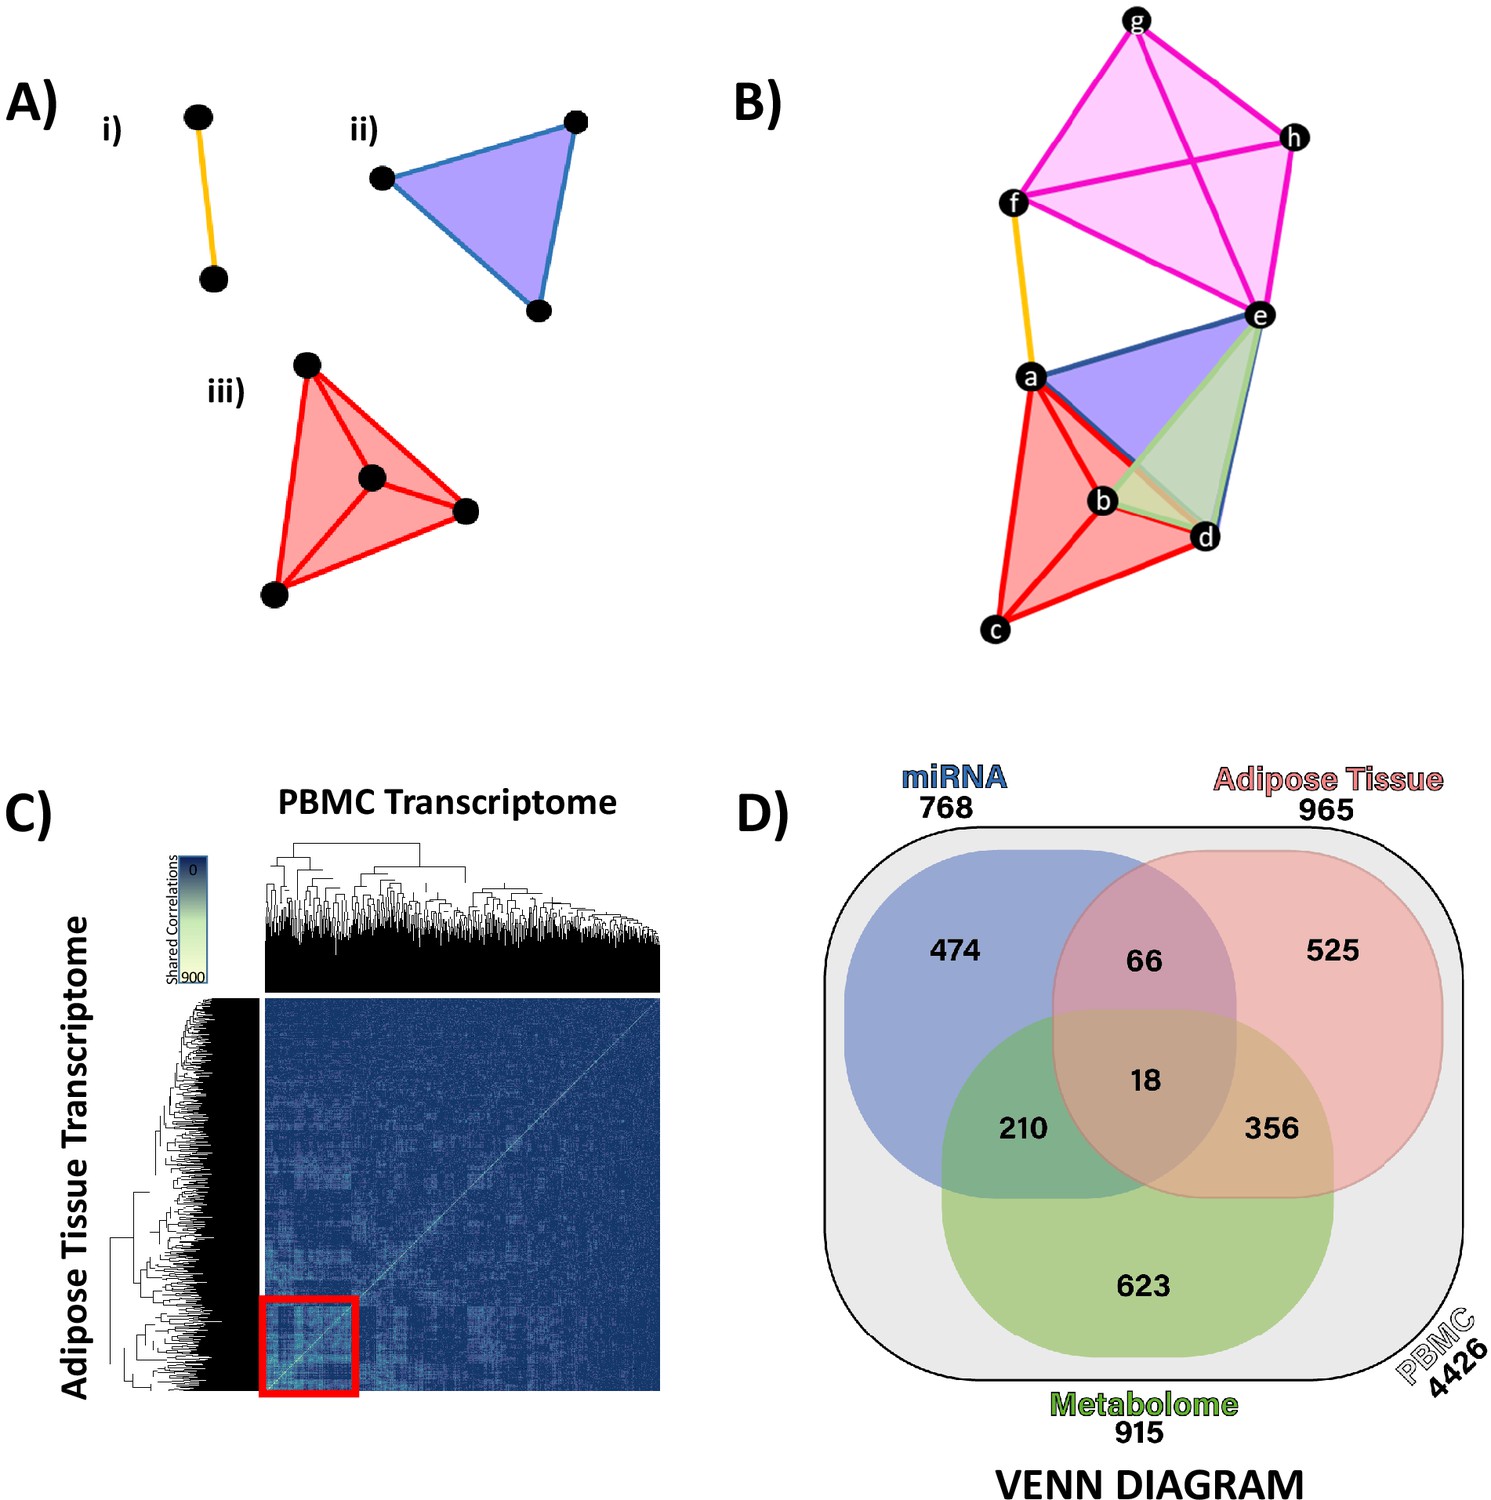
Hypernetwork analyses of integrated ‘omic data.
(A) Hypernetworks differ from traditional networks in that edges can connect more than two nodes. Nodes are represented by black circles, edges by colored lines and surfaces. This demonstration shows how one edge can connect (i) two nodes as a one-dimensional line, (ii) three nodes as a two-dimensional surface, and (iii) four nodes as a three-dimensional structure. Hypernetworks of ‘omic data can have edges shared between hundreds of nodes. (B) Hypernetwork diagram illustrating how a pair of nodes (a–h) can be connected by more than one edge. In this example, nodes e and d share two edges, as do b and d. (C) A hypernetwork plotted as a heat map can be used to investigate clustering of blood peripheral blood mononuclear cell (PBMC) transcripts, based on correlation to, for example, adipose tissue transcriptome. A central cluster, defined using hierarchical clustering, groups PBMC transcripts based on high numbers of shared edges (red square, n = 965). This approach was applied to define groups of PBMC transcripts with similar profiles when correlated against each other ‘omic layer. (D) Gene probe level overlaps between PBMC transcriptome clusters identified by hypernetwork shared with the other ‘omic data sets. PBMC transcriptomic changes are correlated with changes in miRNAome, adipose tissue transcriptome, and metabolome (gas chromatography-mass spectrometry and liquid chromatography-mass spectrometry overlaps combined); overlaps are common PBMC transcripts with correlation to the ‘omic data sets. Values in brackets represent the size of PBMC transcriptomic clusters drawn from all differentially expressed PBMC transcripts (n = 4426, p<0.05). Data demonstrates a fundamental relationship in glucocorticoid response between PBMC and adipose tissue (965 genes) and reinforces the presence of common pathways in these two independent tissues.
Figure 3—figure supplement 1
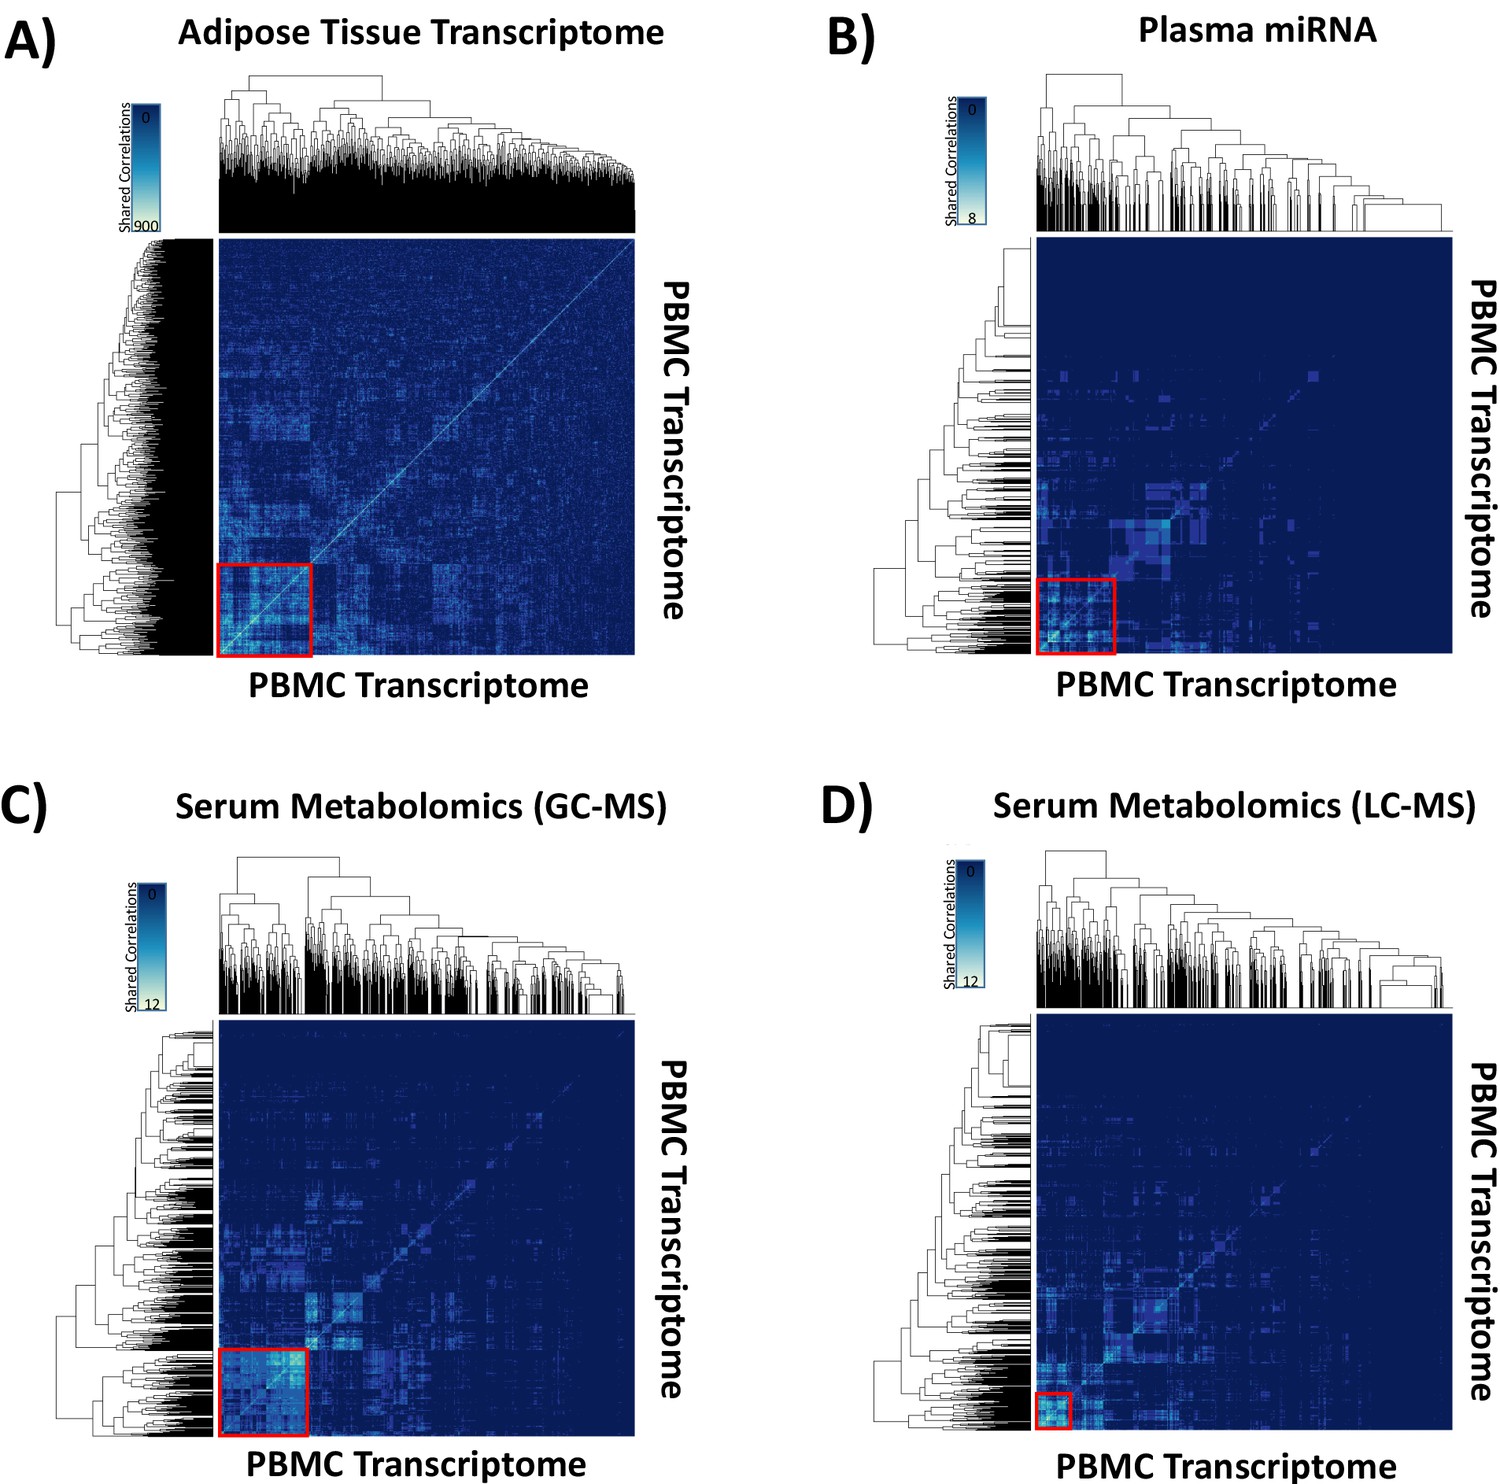
Hypernetwork heat maps of integrated ‘omic data.
The analyses were performed to quantify groups of highly correlated ‘omic data sets. Hypernetwork heat maps show clusters of correlated peripheral blood mononuclear cell (PBMC) transcripts (total 4426, 3.9 × 10⁻⁸ < p<0.05) with differential expression (glucocorticoid [GC] exposure vs. GC withdrawal) shared with (A) adipose tissue transcriptome (red square, n = 965), (B) plasma miRNA (red square, n = 768), (C) serum metabolome measured gas chromatography-mass spectrometry (red square, n = 915), and (D) serum metabolome measured by liquid chromatography-mass spectrometry (red square, n = 312). Increasing numbers of shared correlations appear as a scale from blue to white as shown in the keys.
Figure 3—figure supplement 2
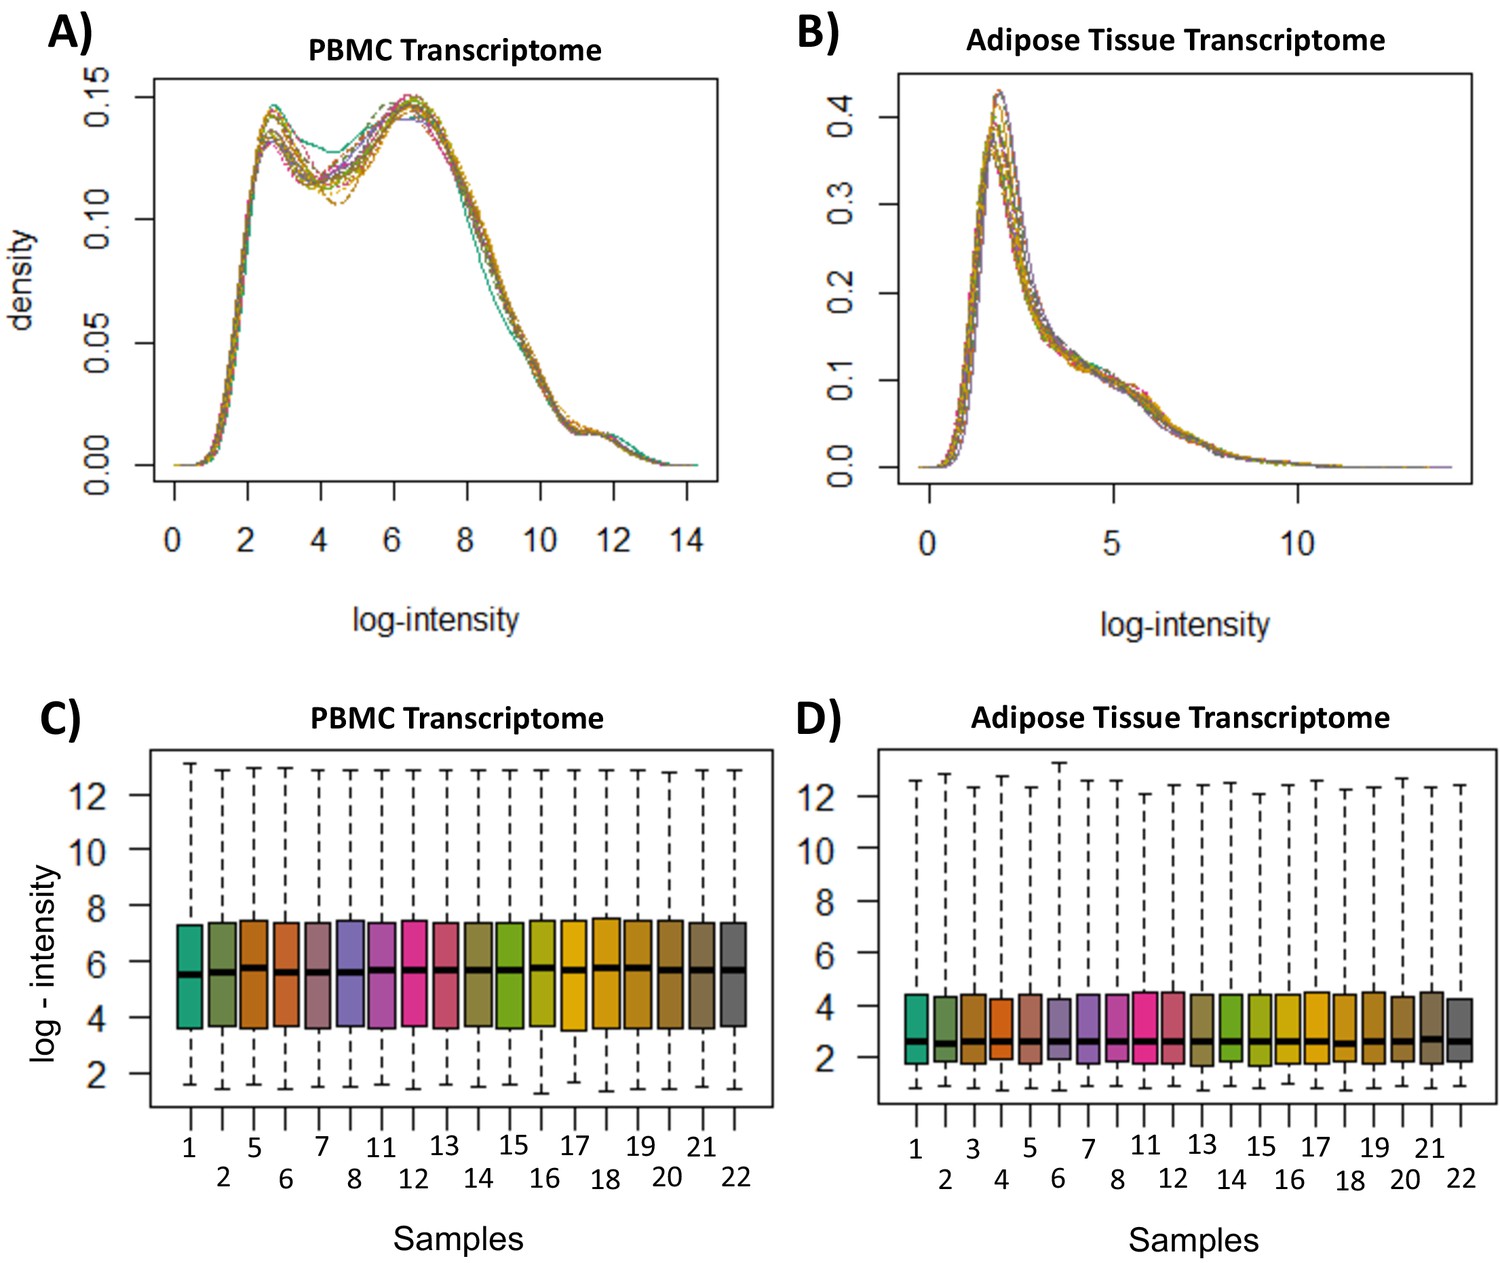
Transcriptome quality control measures.
(A) Peripheral blood mononuclear cell (PBMC) transcriptome probe-level log-intensity distribution. (B) Adipose tissue transcriptome probe-level log-intensity distribution. Density distributions represent intensity per probe, normalized to proportion of overall measurements at each intensity. (C) PBMC transcriptome per-sample log-intensity distribution (D) Adipose tissue transcriptome per-sample log-intensity distribution. Boxplots represent distribution of intensity per sample; boxes represent interquartile range, with median values and whiskers represent the range. All figures were generated in R from measurements generated by the R package ‘oligo’.
Figure 3—figure supplement 3
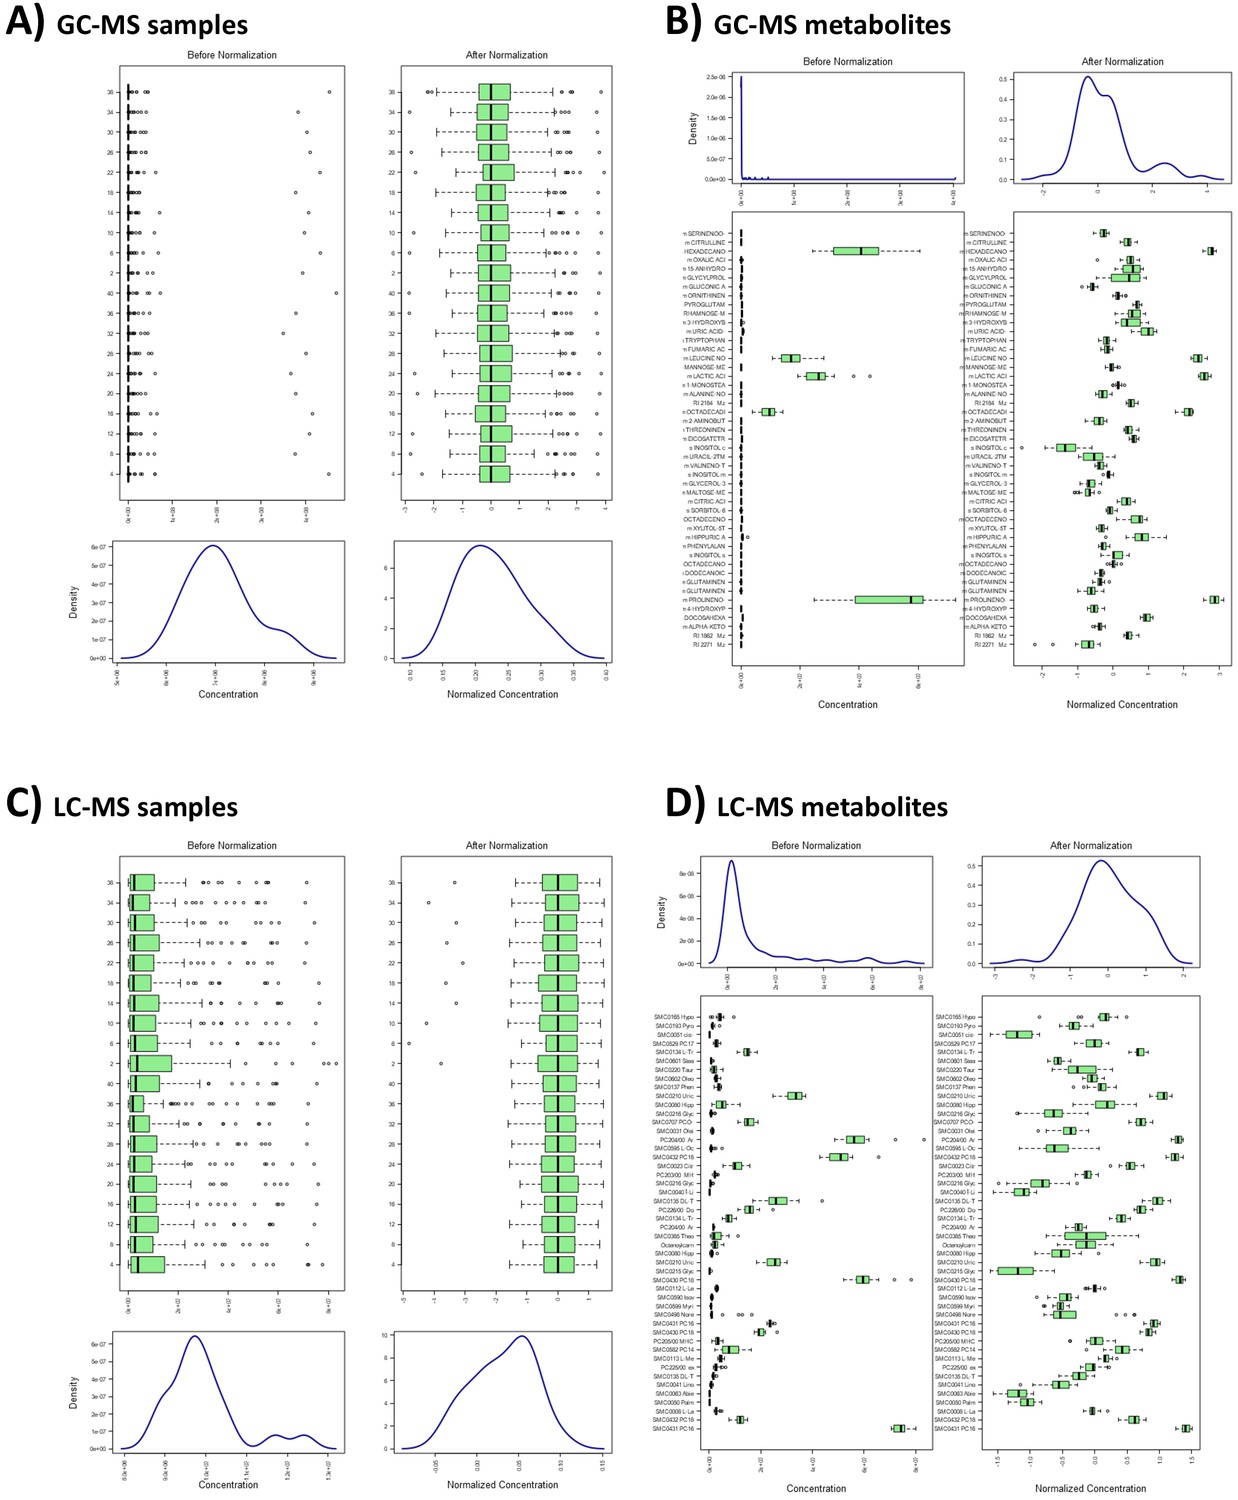
Metabolome quality control measures.
Distribution before and following normalization of (A) gas chromatography-mass spectrometry (GC-MS) samples, (B) GC-MS metabolites, (C) liquid chromatography-mass spectrometry (LC-MS) samples, and (D) LC-MS metabolites. For all figures, distribution of concentration values is provided as boxplots and density distributions for individual samples and metabolites. Boxes represent interquartile range with median values, and whiskers represent the range; outliers are denoted as individual points. Density distributions represent overall distribution of concentrations combined across samples or metabolites. All figures were produced using R package ‘MetaboanalystR’.
Figure 3—figure supplement 4
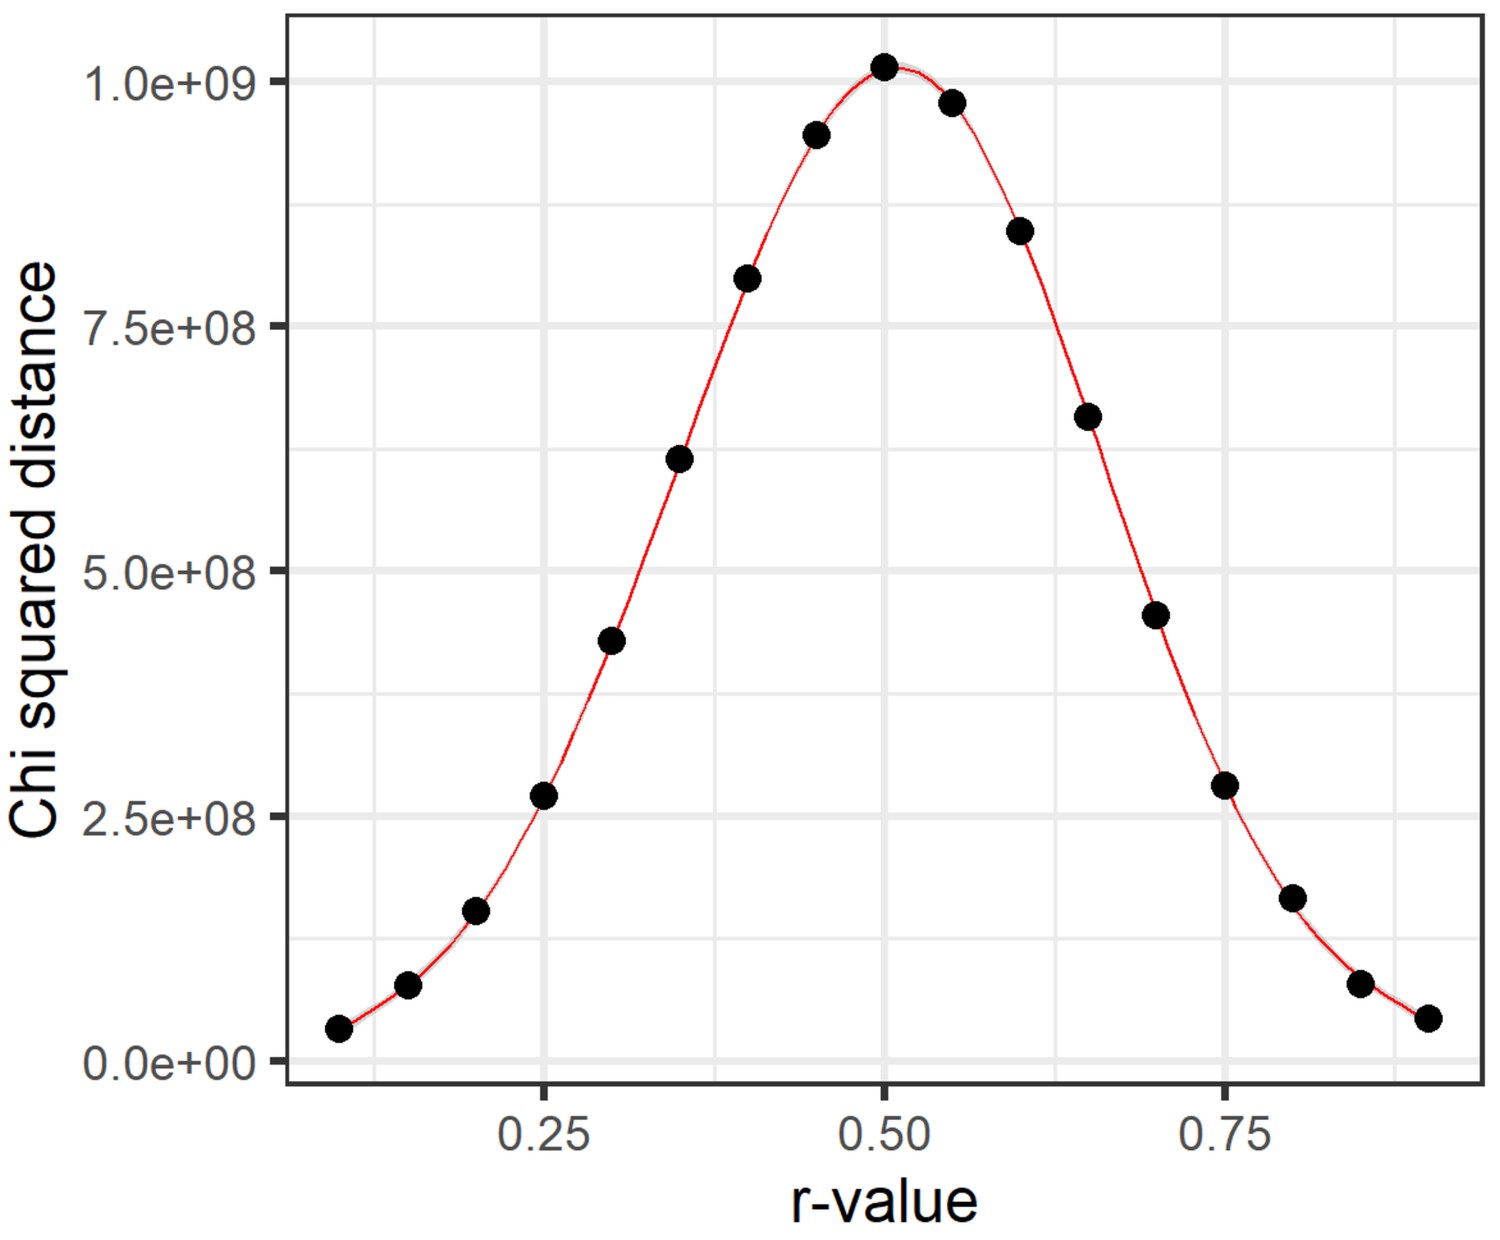
Chi-squared distance distribution from a range of dichotomization thresholds.
Hypernetworks were generated, dichotomizing the data using a range of cut-off r-values, from 0.1 to 0.9 by steps of 0.05, in order to generate the hypernetwork incidence matrix . Overall chi-squared distance was calculated for each hypernetwork as the sum of chi-squared distance across the hypernetwork matrix . A general additive model was used to fit a curve through these data using ggplot2. This approach determines how edges are assigned between pairs of ‘omic elements and, therefore, the number of shared edges represented by the hypernetwork matrix . Chi-squared distance represents the signal window present in a hypernetwork by measuring the spread of values (numbers of shared edges). The greatest spread in values here was found when dichotomizing around an r-value of 0.5. Above and below this threshold, the range of values in the hypernetwork was reduced, limiting the ability to refine a set of interacting ‘omic elements supported by most edges.
Figure 4 with 1 supplement
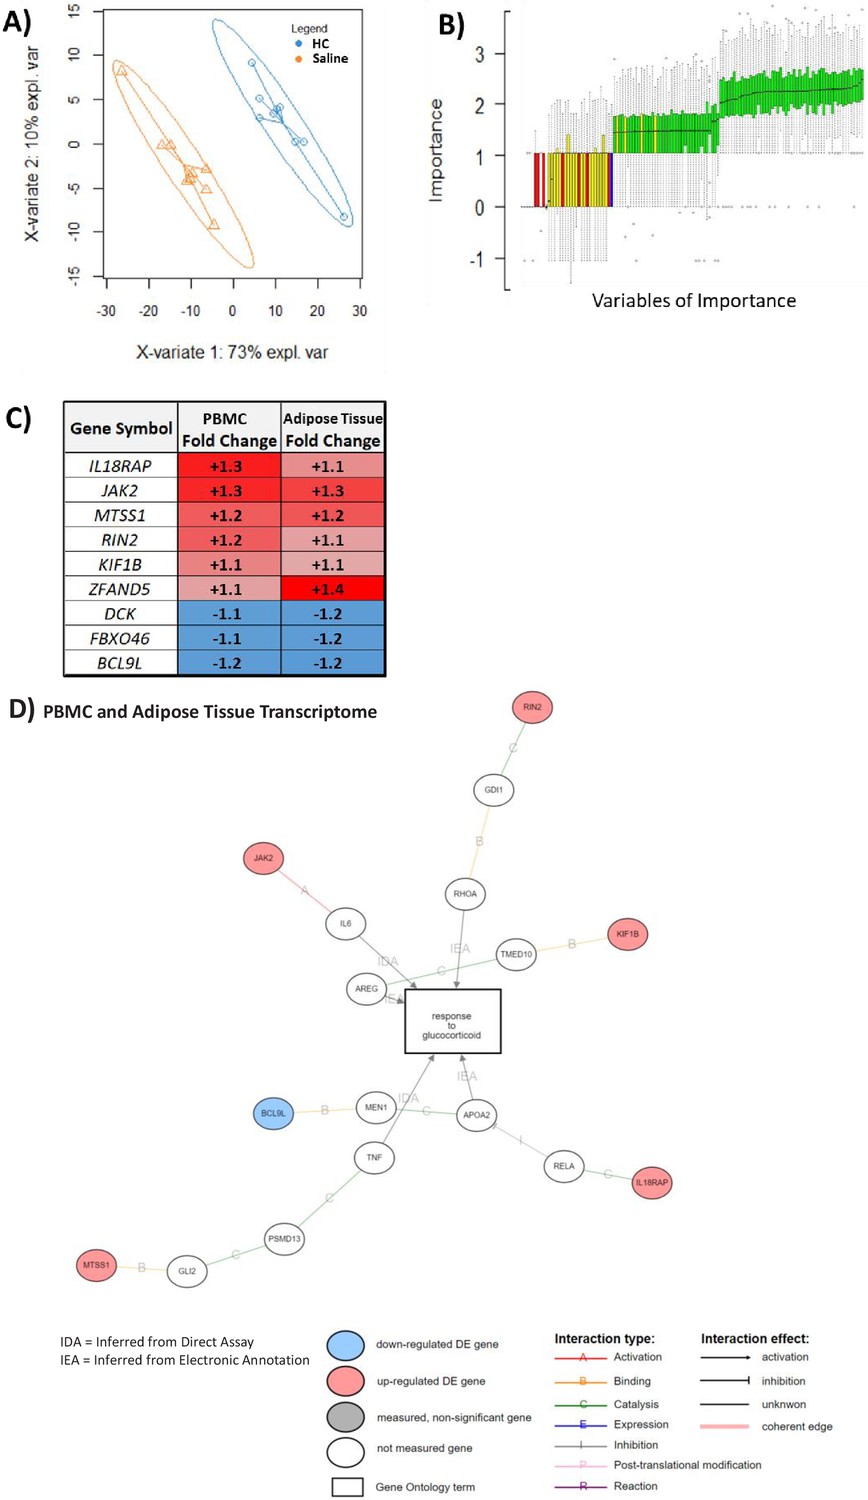
An overlapping gene set in peripheral blood mononuclear cell (PBMC) and adipose tissue transcriptome can be used to classify glucocorticoid (GC) response.
These analyses were performed to depict the common predictive genes in PBMCs and adipose tissue. (A) Partial least squares discriminant analysis (PLSDA) showing complete separation of hydrocortisone (HC) infusion (GC exposure, blue points) from saline infusion (GC withdrawal, orange points) using 271 of 965 PBMC transcripts confirmed as robust in the hypernetwork by analysis of dissimilarity. X-variates 1 and 2: PLSDA components; expl. var: explained variance. (B) BORUTA feature selection identifies variables (genes) of importance in classification using a Random Forest approach to model experimental background noise (green: confirmed classification; yellow: tentative classification: red: rejected classification; blue: ‘shadow’ variable modeling experimental noise). Of 271 transcripts initially used, 59 were identified as important (confirmed [green] or tentative [yellow]) in separating GC exposure from GC withdrawal, as well as having the same direction fold change in both PBMC and adipose tissue transcriptomic data sets. (C) Predictive genes that are significantly differentially expressed between GC exposure and GC withdrawal in both PBMC and adipose tissue transcriptomes and display fold change in the same direction in both tissues (n = 9). (D) Association of predictive genes (six out of nine) with GC response through gene ontology. Data demonstrates the presence of a robust transcriptomic profile predicting GC response in two independent tissues.
Figure 4—figure supplement 1
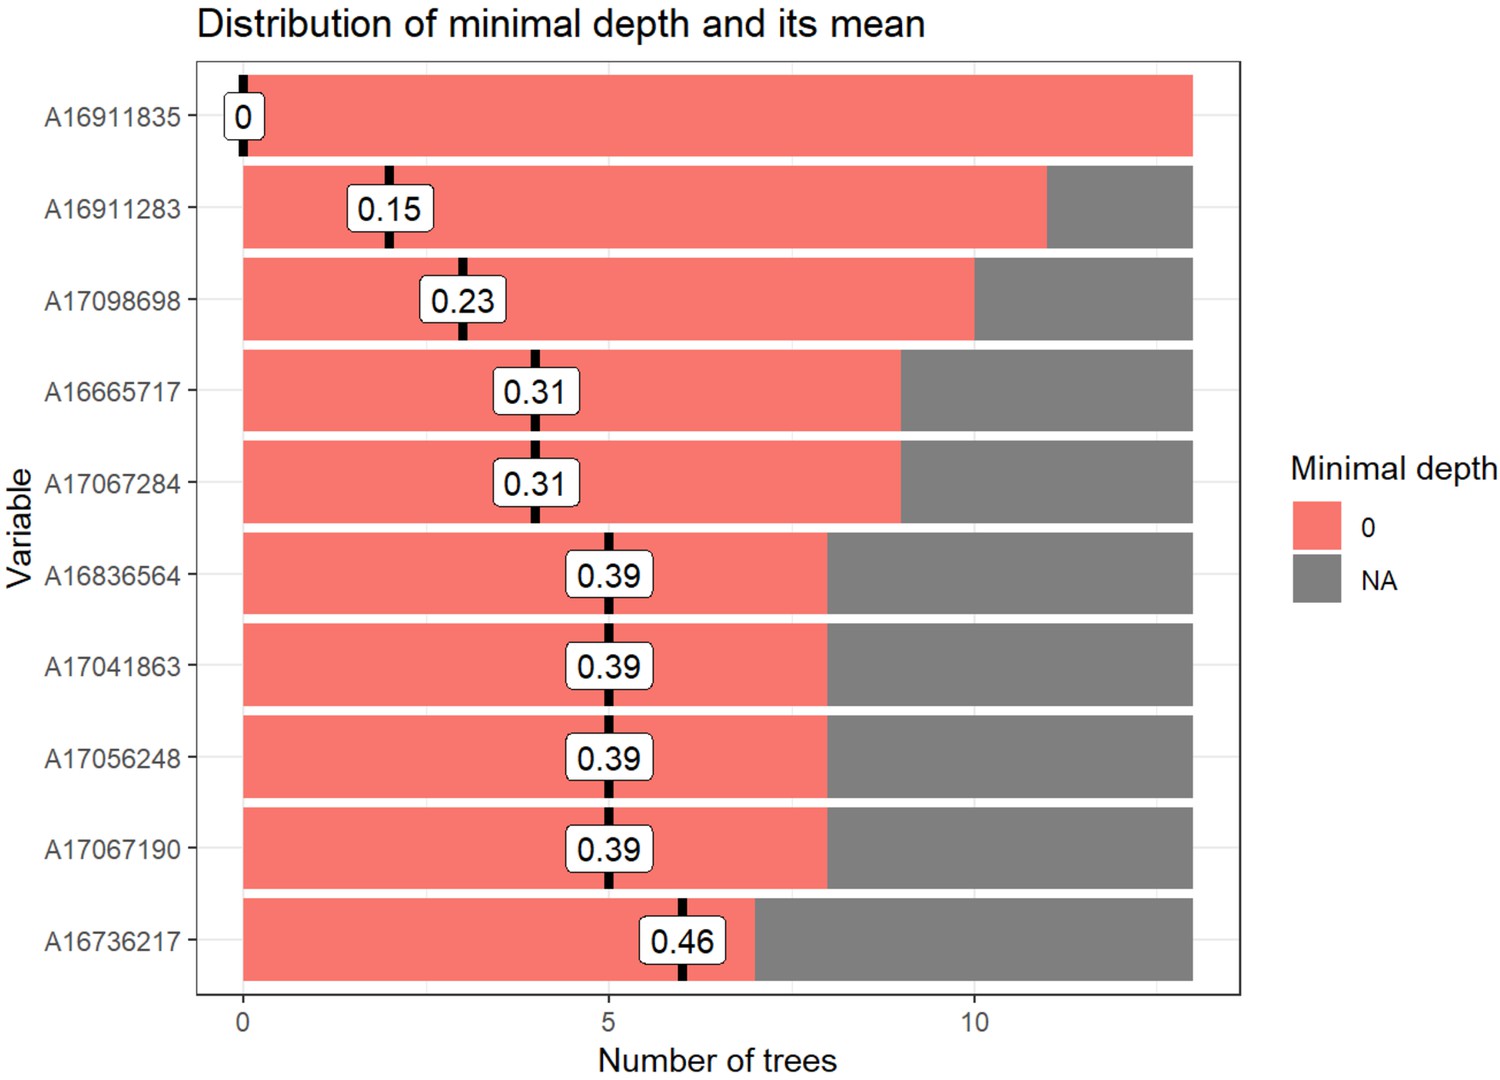
Random forest distribution of minimal depth.
Distribution of minimal depth among trees from random forest generated in Figure 4B. Minimal depth equals the depth of the node closest to the root, which is capable of splitting participants into groups. Minimal depth for variables in this tree is very low as all variables are significantly different between groups at an uncorrected p-value<0.05. Figure generated using R package ‘randomForestExplainer’.
Figure 5 with 1 supplement
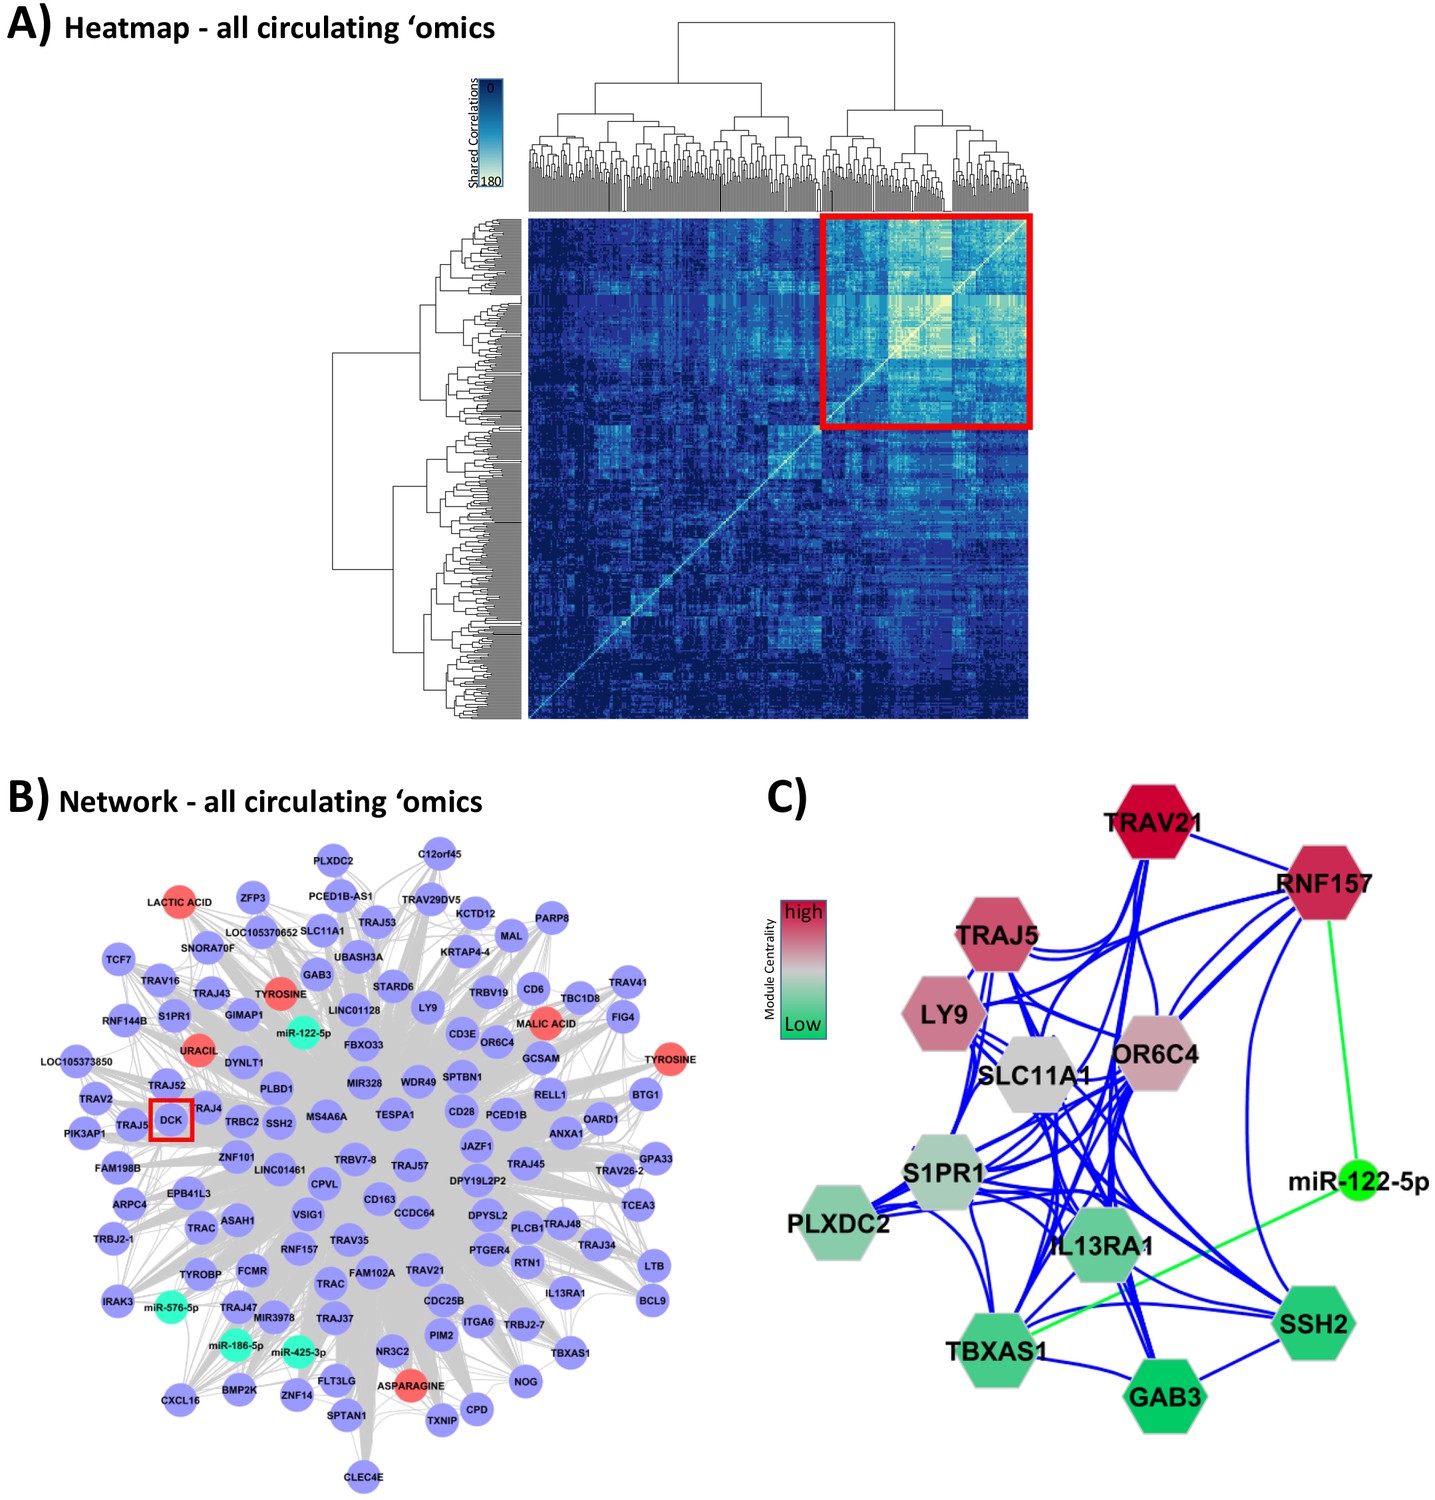
Integration of all circulating ‘omic data sets associated with glucocorticoid (GC) response.
These analyses were performed to lead to putative biomarkers of GC action. (A) Hypernetwork summary heat map of shared correlations between all circulating ‘omic elements (peripheral blood mononuclear cell transcriptome, plasma microRNA [miRNA], serum metabolome; n = 336) with differential expression between GC exposure and GC withdrawal. (B) Network representation of central cluster (red square in A [n = 139], of which 120 map to genes/miRNA/metabolites). Blue circles: genes with differential expression; red circle: differentially expressed metabolites; green: differentially expressed miRNA. Red box highlights DCK, one of the nine genes identified as a classifier of GC response (see Figure 4C). (C) Module decomposition of the hypernetwork. Genes modules (hexagons representing multiple highly connected genes) named by the most central gene in each module. miR-122-5p is present in the core of two modules (shown); color of modules represents centrality hierarchy: red: most central in the network; green: least central in the network.
Figure 5—figure supplement 1
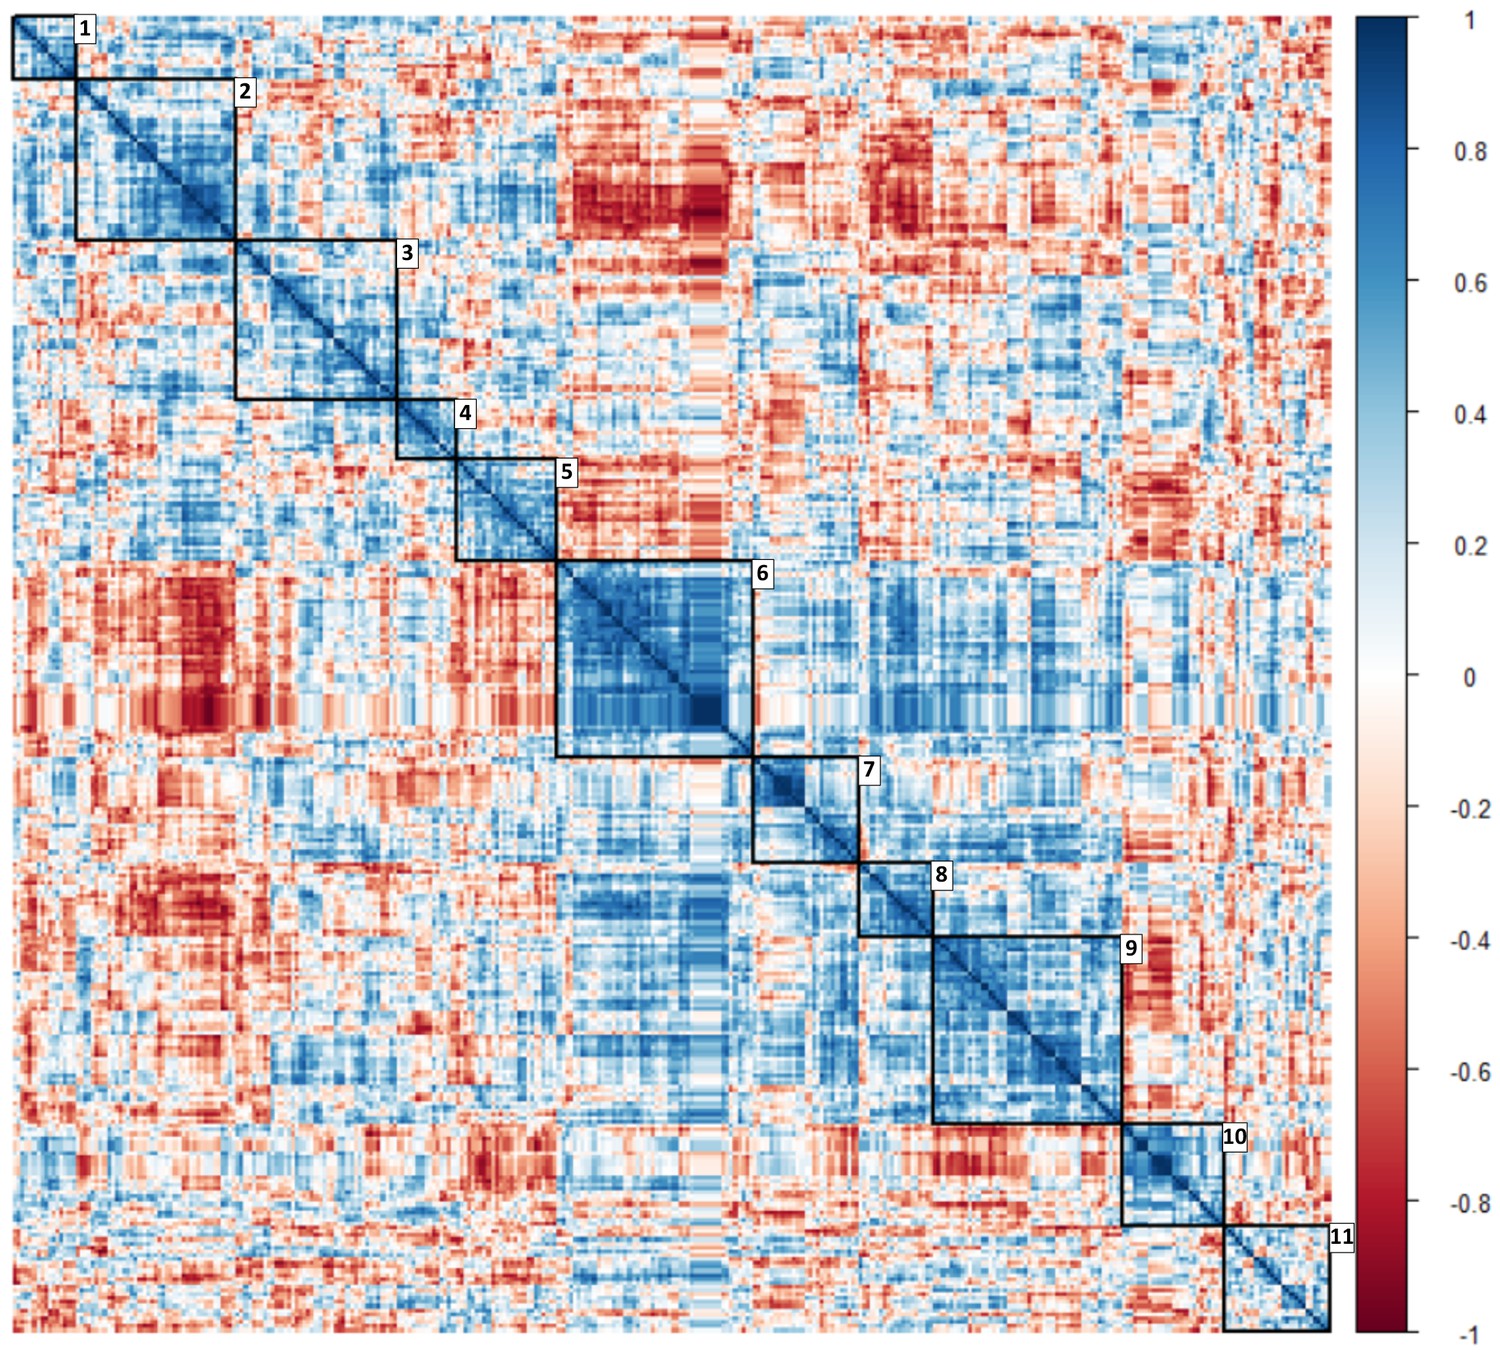
Heat map with clusters of circulating ‘omic data associated with glucocorticoid exposure identified using a correlation matrix.
Along the diagonal 11 clusters including peripheral blood mononuclear cell transcriptomic, miRNAomic and metabolomic data were identified (depicted in squares with their numbers). Color scale represents correlation coefficient. .
Figure 6
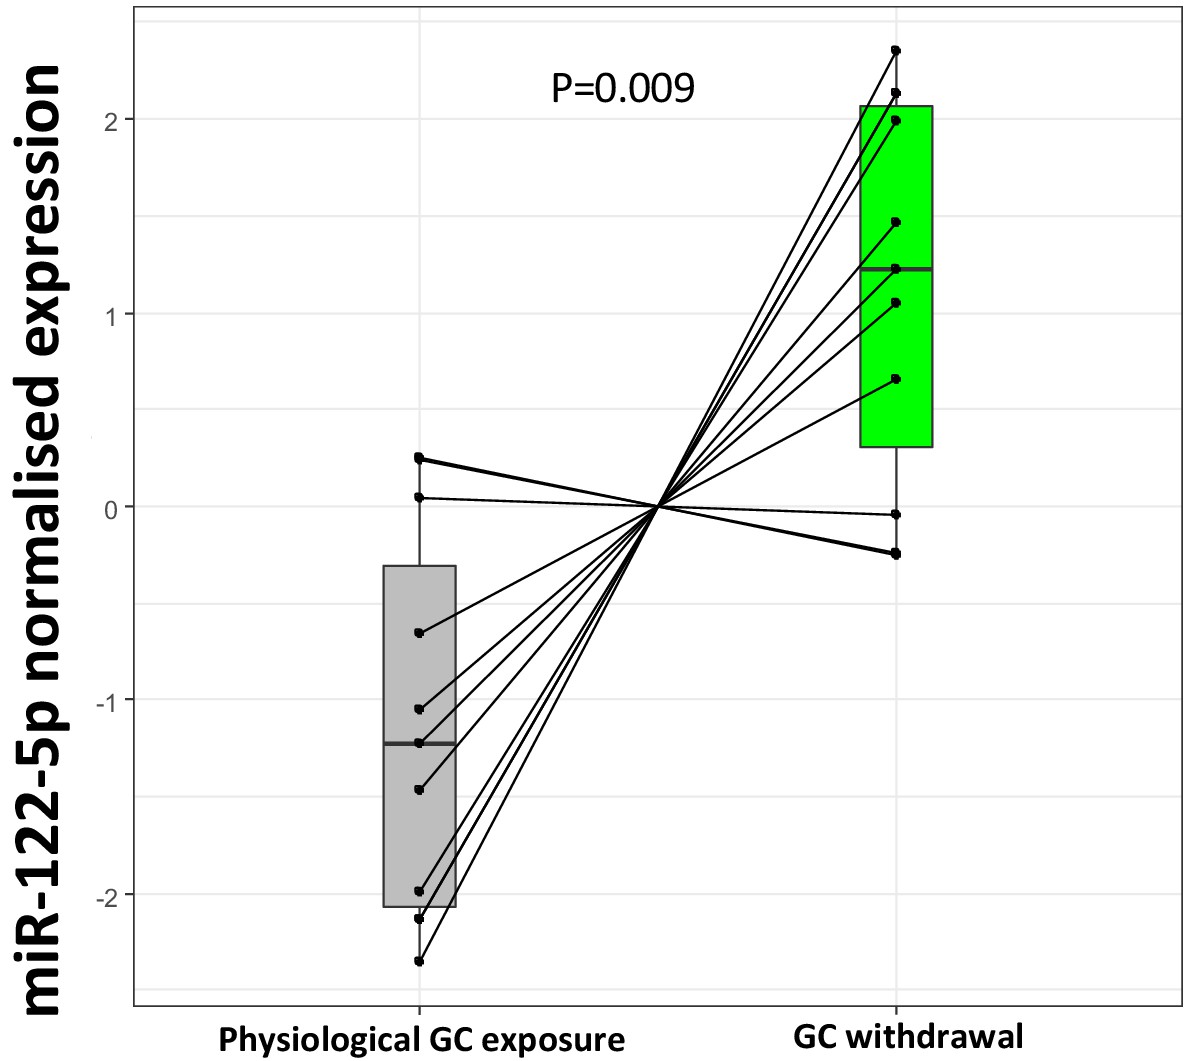
Replication of miR-122-5p as a putative biomarker of glucocorticoid (GC) action in the current biomarker discovery study.
Targeted replication of plasma miR-122-5p fold change from the current study population between subjects with Addison’s disease during GC exposure and GC withdrawal showed a significant down-regulation of miR-122-5p expression with increased GC exposure (p=0.009) conducted using an independent RNA separation procedure in the same samples.
Figure 7

Replication of miR-122-5p as a putative biomarker of glucocorticoid (GC) action in independent patient groups with different GC exposure.
(A) The expression of miR-122-5p was higher in subjects with rheumatoid arthritis and reduced GC exposure due to tertiary adrenal insufficiency after a short-term stop of the GC treatment (AI) than in those without tertiary adrenal insufficiency (Normal). (B) Subjects with Addison’s disease (AD) had higher expression of miR-122-5p than healthy matched controls (Control). In an experimental study in healthy subjects, the expression of miR-122-5p was increased both after low and excessive high GC exposure (LowGC and ExcessGC, respectively) compared to medium GC exposure (MedGC) at both (C) high and (D) low serum insulin levels. Diamond: mean. Box = median ± interquartile range. Whiskers = upper and lower quartiles. miR-122-5p axis is presented as normalized expression.
Appendix 1—figure 1
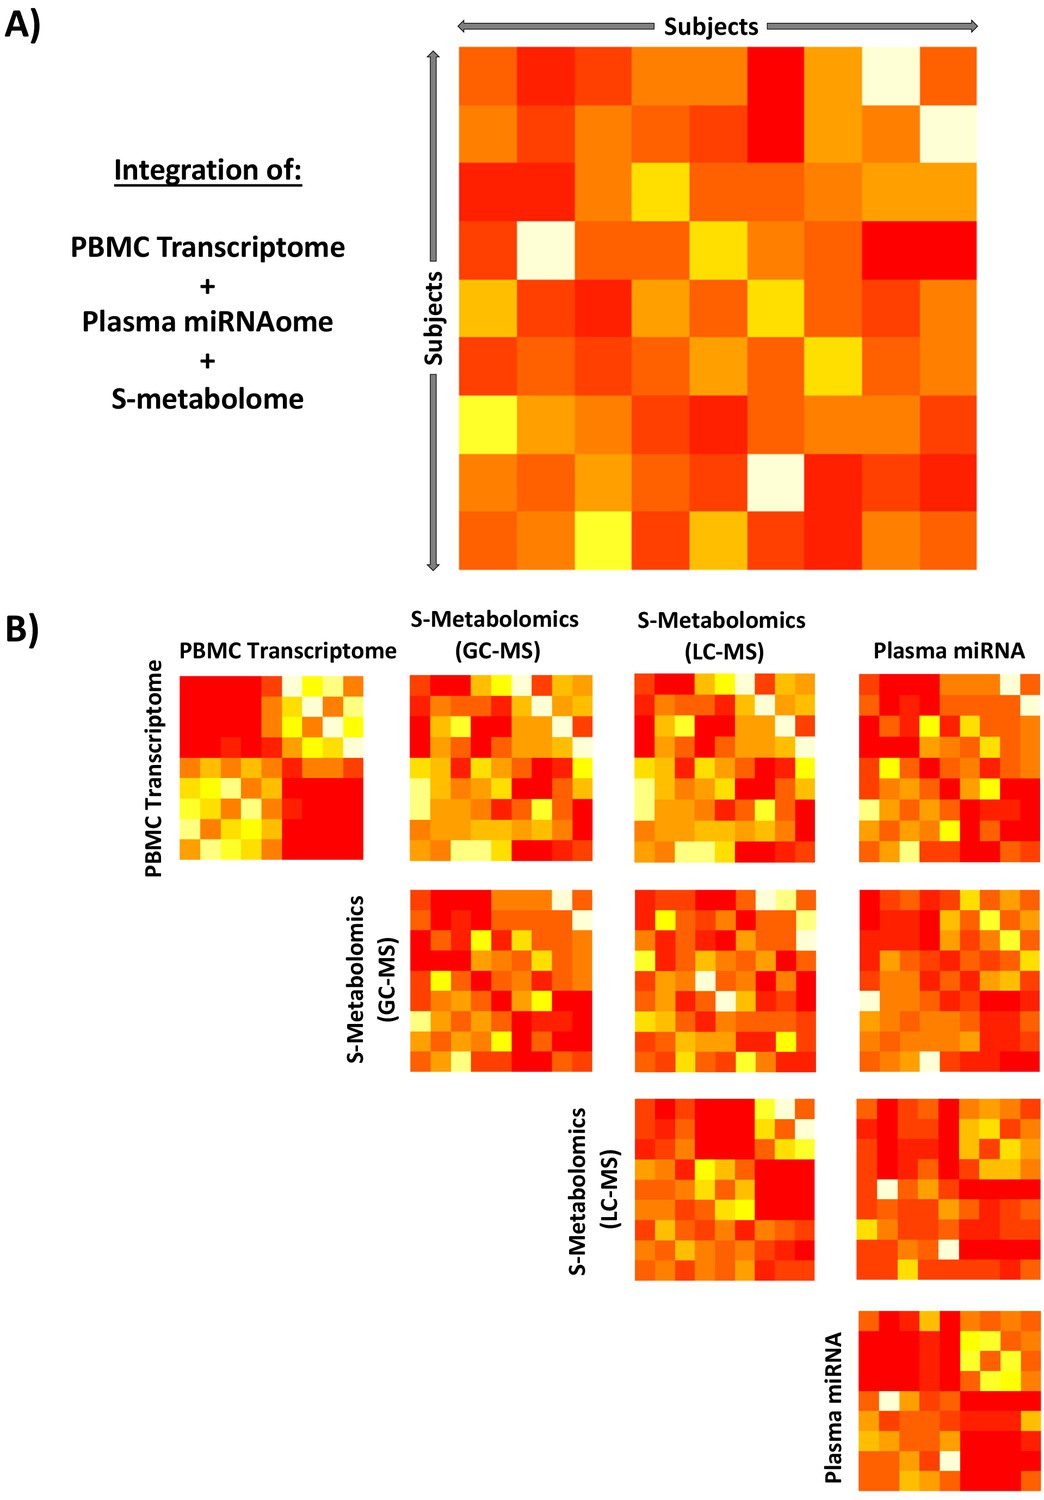
Integration of unsupervised peripheral blood mononuclear cell (PBMC) transcriptomic, metabolomic, and miRNAomic data in subjects between glucocorticoid (GC) exposure and GC withdrawal at 7 AM using similarity network fusion.
Integration of all circulating ‘omic data (A) simultaneously and (B) stepwise. Each matrix represents a subject-by-subject comparison using similarity network fusion of change in signal of ‘omic data between GC exposure and GC withdrawal. The Euclidean distances between subjects based on their relative positions as determined by isomap dimensional scaling were used as a basis to determine similarity. Colors denote normalized continuous similarity score; red: dissimilar; yellow: similar. The complete data set for each specific ‘omic layer of data was used, transcriptome n = 53,617, GC-MS n = 82, LC-MS n = 82, miRNA n = 251. GC-MS, gas chromatography-mass spectrometry; LC-MS: liquid chromatography-mass spectrometry; miRNA, microRNA; S, serum.
Appendix 2—figure 1
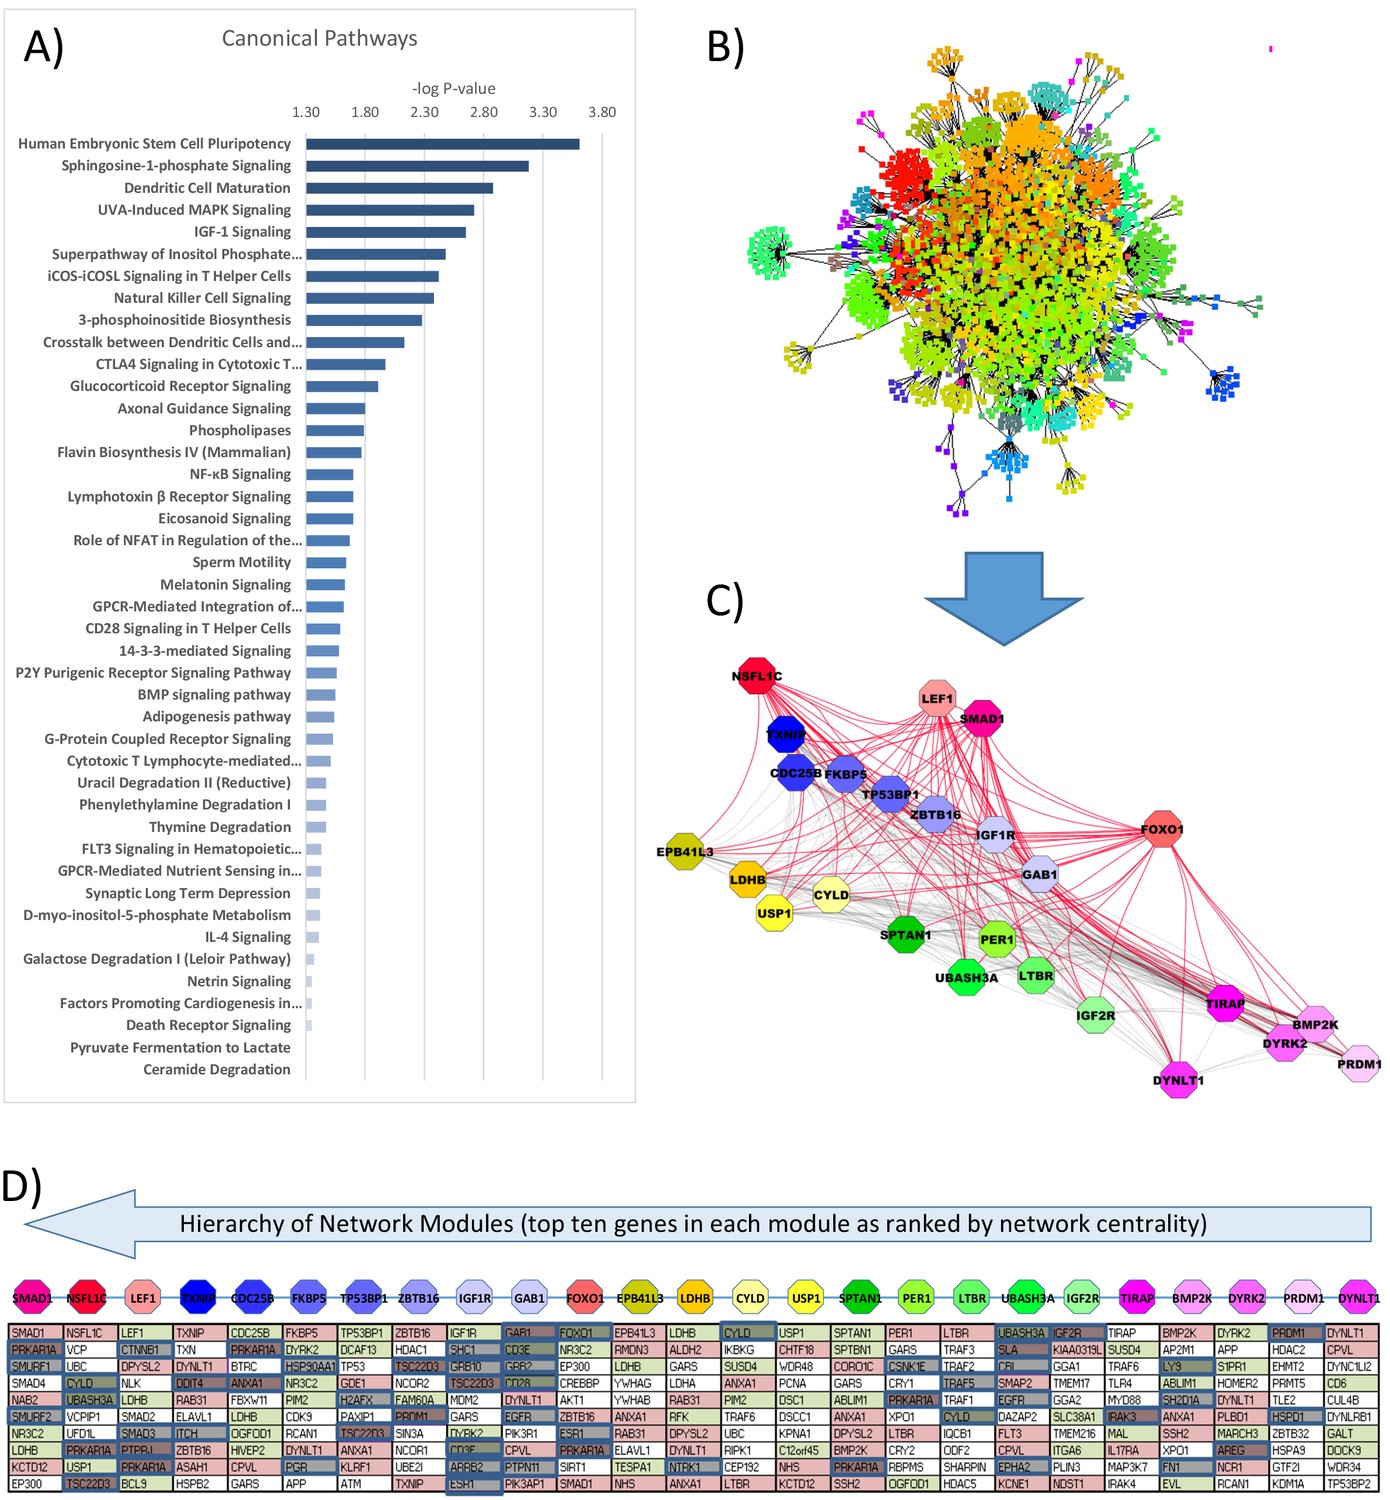
Gene ontology and interactome network model of differential gene expression in peripheral blood mononuclear cells (PBMCs) between glucocorticoid (GC) exposure and GC withdrawal.
Differentially expressed transcriptomic data in PBMCs was used to determine (A) the canonical pathways involved and (B) infer an interactome network model using BioGRID database, consisting of 2467 nodes and 64 modules. (C) Modules of genes (octagons) within the interactome network model were determined using the Moduland algorithm and ranked by a hierarchy based on network centrality; central modules are functionally relevant as they can influence the activity of a wider proportion of the network. The modules are arranged (left to right) in columns of the top 10 genes in each ranked by network centrality (top to bottom). (D) Gene expression marked within the network model (red: up; green: down in hydrocortisone treatment). Causal elements (known literature associations implying regulatory function) are marked in blue.
Appendix 2—figure 2
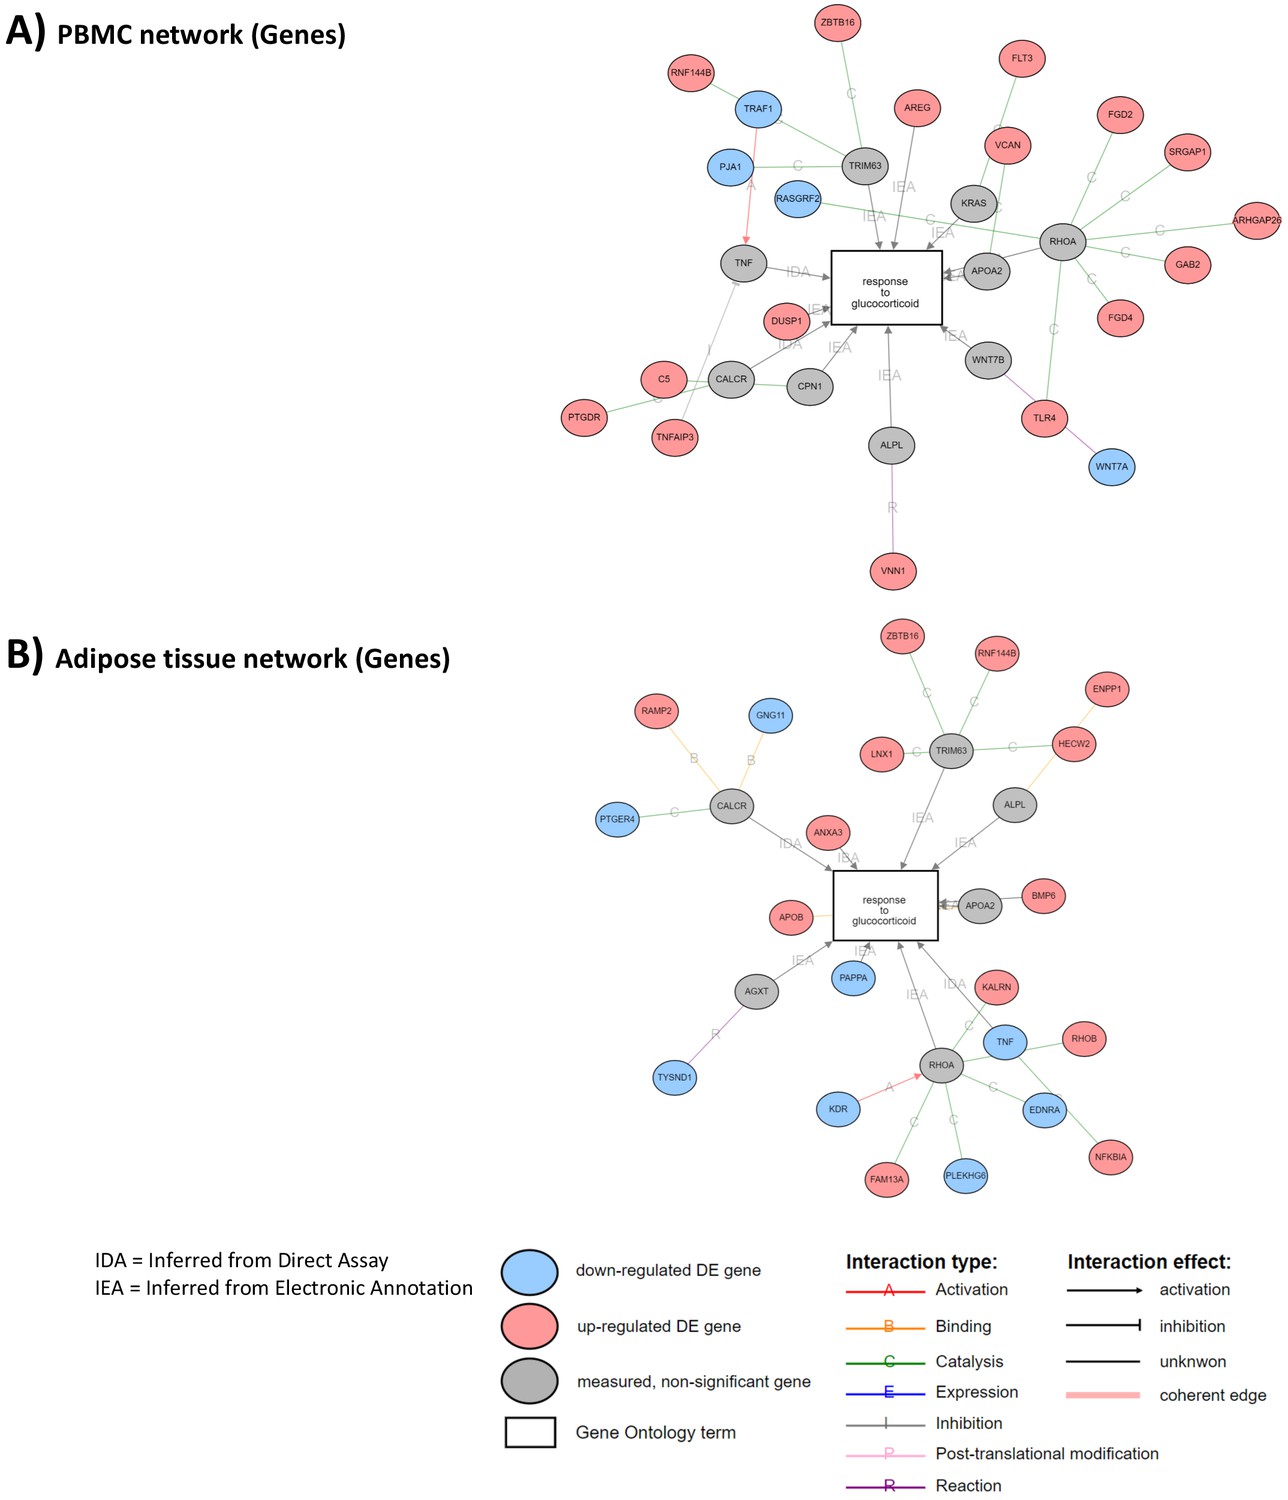
Correlated networks related to glucocorticoid (GC) action in the peripheral blood mononuclear cell (PBMC) and adipose tissue transcriptome.
The analyses were performed to identify similarities and differences in transcriptome (gene expression) associated to GC exposure in two different tissues. Network associations of GC response to genes with differential expression between GC exposure and GC withdrawal in (A) PBMC transcriptome and (B) adipose tissue transcriptome. Gray circles represent genes involved in response to GCs that are not differentially expressed. Sixteen genes up-regulated and four down-regulated in PBMCs. Thirteen genes up-regulated and eight down-regulated in adipose tissue.
Appendix 2—figure 3
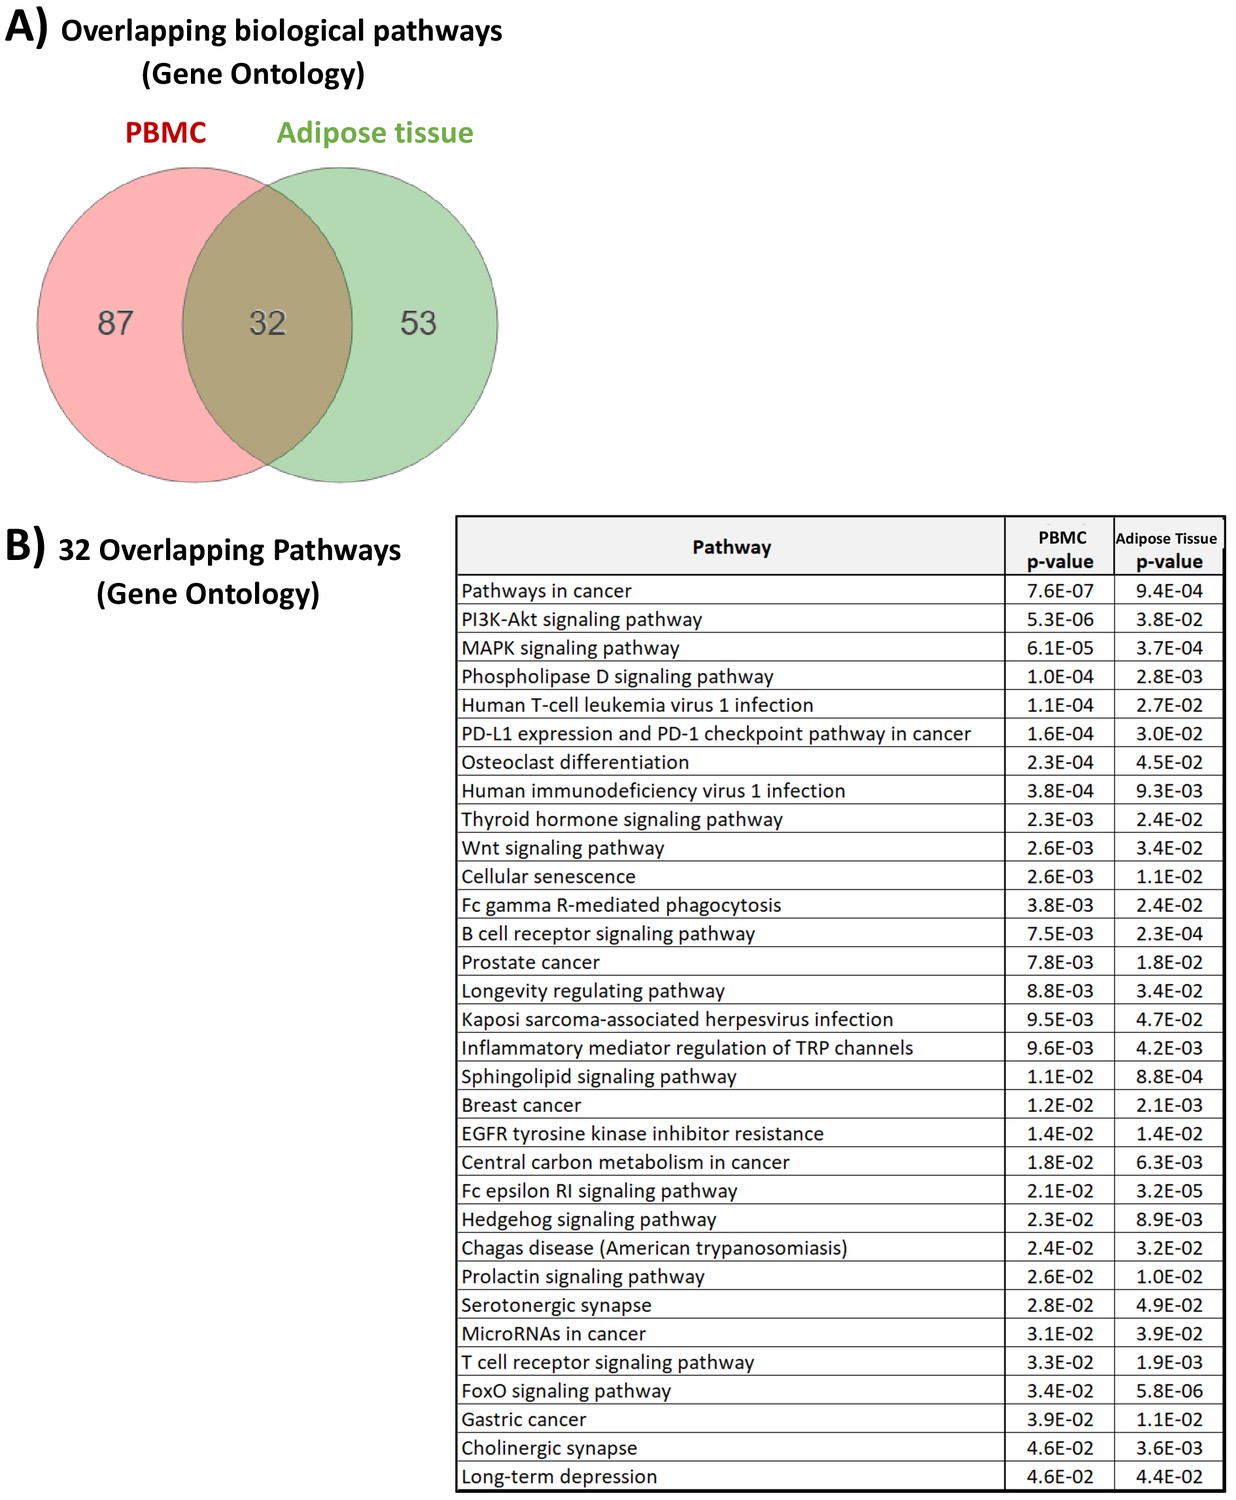
Gene Ontology related to glucocorticoid (GC) action in the peripheral blood mononuclear cell (PBMC) and adipose tissue transcriptome.
(A) Numeric summary of biological pathways (Gene Ontology) associated with differential gene expression between GC exposure and GC withdrawal in the PBMC and adipose tissue transcriptomes. (B) Biological pathways (Gene Ontology) associated with differential gene expression in both PBMCs and adipose tissue. Data demonstrate that while different genes may be involved in the transcriptomic response to GCs in the two independent tissues, there are common pathways through which GC action is manifested.
Tables
Table 1
Clinical and biochemical tests assessed or collected immediately before each intervention and at 7 AM on the second intervention day during both interventions (n = 10).
| 9 AM before start of intervention (first intervention day) | 7 AM (second intervention day) | ||||
|---|---|---|---|---|---|
| Median (IQR) | p-Value | Median (IQR) | p-Value | ||
| S-cortisol (nmol/L) | HC | 43.2 (38.0–55.1) | 0.36 | 298 (228–359) | <0.001 |
| Saline | 46.7 (43.1–61.7) | 44.4 (36.8–52.5) | |||
| Overnight U-free cortisol (µg/7 hr)*,† | HC | – | 678 (459–814) | <0.001 | |
| Saline | – | <0.01‡ | |||
| S-cortisone (nmol/L) | HC | 40.7 (29.5–49.2) | 0.76 | 81.2 (60.5–94.9) | <0.001 |
| Saline | 42.1 (29.7–50.4) | 42.0 (28.9–47.3) | |||
| Overnight U-free cortisone (µg/7 hr)*,† | HC | – | 136 (106–151) | <0.001 | |
| Saline | – | <0.01‡ | |||
| SBP (mmHg) | HC | 122 (111–134) | 0.88 | 123 (107–139) | 0.65 |
| Saline | 127 (112–131) | 124 (101–137) | |||
| DBP (mmHg) | HC | 76 (63–83) | 0.88 | 69 (59–76) | 0.55 |
| Saline | 72 (67–80) | 65 (60–70) | |||
| S-sodium (mmol/L) | HC | 141 (139–142) | 0.85 | 140 (138–141) | 0.97 |
| Saline | 141 (138–142) | 140 (138–141) | |||
| S-potassium (mmol/L) | HC | 4.4 (4.3–4.7) | 0.27 | 4.4 (4.3–4.8) | 0.26 |
| Saline | 4.2 (4.0–4.5) | 4.4 (4.3–4.5) | |||
| P-glucose (mmol/L) | HC | 5.0 (4.5–5.3) | 0.79 | 5.6 (5.2–5.8) | 0.08 |
| Saline | 5.0 (4.6–5.1) | 5.2 (5.2–5.4) | |||
| Body weight (kg) | HC | 72.2 (69.6–77.3) | 0.53 | 72.8 (69.3–77.7) | 0.63 |
| Saline | 73.5 (70.5–79.5) | 74.0 (70.5–79.2) | |||
-
*Overnight U-free cortisol and cortisone were collected from midnight to morning (12 AM to 7 AM) during physiological GC exposure (HC infusion) and GC withdrawal (saline infusion).
†One of the 10 subjects was not included in the analysis because of a problem during sample collection.
-
‡Below the limit of detection.
DBP: diastolic blood pressure; GC: glucocorticoid; HC: hydrocortisone; IQR: interquartile range; P: plasma; S: serum; SBP: systolic blood pressure; U: urinary.
Table 2
Summary of differentially expressed ‘omic elements in association with response to glucocorticoids.
| ‘Omic data set | Total number of ‘omic elements | Number of significant elements (p<0.05) | Number of significant elements (FDR < 0.05) |
|---|---|---|---|
| PBMC transcriptome | 28,869 | 4426 | 3997 |
| Adipose tissue transcriptome | 28,869 | 3520 | 3115 |
| Plasma miRNAome | 252 | 9 | 9 |
| Serum metabolome | 164 | 38 | 14 |
-
FDR: false discovery rate; miRNA: microRNA; PBMC: peripheral blood mononuclear cell.
Table 3
Validation of the predictive genes from the current exploratory study against previous studies examining GC response in cellular systems.
| Study title | GEO # | PMID | N | AUC (95% CI) | OOB* AUC† | OOB* error rate‡ (%) |
|---|---|---|---|---|---|---|
| Dexamethasone effect on epidermal keratinocytes in vitro | GSE26487 | 17095510 (Stojadinovic et al., 2007) | 20 | 0.70 (0.51–0.89) | 0.80 | 30 |
| Dexamethasone effect on GC-resistant and -sensitive lymphoblastic leukemia cell lines | GSE22152 | 21092265 (Carlet et al., 2010) | 24 | 0.71 (0.52–0.90) | 0.78 | 29 |
| In vivo GC effect on non-leukemic peripheral blood lymphocytes | GSE22779 | 21092265 (Carlet et al., 2010) | 16 | 0.88 (0.63–1.0) | 0.96 | 6 |
| Osteosarcoma cell line response to activation of specific GC receptor alpha isoforms | GSE6711 | 17682054 (Lu et al., 2007) 22174376 (Jewell et al., 2012) | 60 | 0.96 (0.89–1.0) | 0.99 | 3 |
| GC effect on lens epithelial cells | GSE3040 | 16319822 (Gupta et al., 2005) | 12 | 0.83 (0.63–1.0) | 0.72 | 17 |
-
*OOB data, the bootstrapping approach of Random Forest, ensures that every tree is built using ~63% of the available data, leaving ~ 37% that can be used for a validation test.
†AUC up to 0.96 demonstrates a high probability of correctly classifying a randomly selected sample from each study.
-
‡OOB error rate = prediction error using the OOB validation data.
The gene set that classified both PBMC and adipose tissue transcriptomes in relation to GC exposure with fold change in the same direction (see Figure 4B – 59 genes) was validated by further testing in five other publicly available studies of GC action in cellular systems.
-
AUC: area under the curve of the receiver operating characteristic; CI: confidence interval; GC: glucocorticoid; GEO: Gene Expression Omnibus; GEO #: study number deposited with GEO; N: study number size; OOB: out-of-bag; PBMC: peripheral blood mononuclear cell; PMID: PubMed ID number of the manuscript describing the data.
Key resources table
| Reagent type (species) or resource | Designation | Source or reference | Identifiers | Additional information |
|---|---|---|---|---|
| Recombinant DNA reagent | GeneChip WT PLUS Reagent Kit | Affymetrix Inc | Other | P/N 703174 Rev. 1 |
| Commercial assay or kit | Human Gene 1.0 ST array | Affymetrix Inc | – | – |
| Commercial assay or kit | Human Gene 1.1 ST array | Affymetrix Inc | – | – |
| Commercial assay or kit | Human Gene 2.0 ST array | Affymetrix Inc | – | – |
| Commercial assay or kit | miRCURY LNA Universal RT microRNA PCR, Polyadenylation, and cDNA Synthesis Kit | Exiqon | – | – |
| Commercial assay or kit | miRCURY RNA Isolation Kit-Biofluids | Exiqon | – | – |
| Chemical compound, drug | Solu-Cortef | Pfizer Inc | – | – |
| Software, algorithm | Agilent Masshunter Profinder | Agilent Technologies, Inc | Other | Version B.08.00 |
| Software, algorithm | SPSS | SPSS | RRID:SCR_002865 | – |
| Software, algorithm | R | R Project for Statistical Computing | RRID:SCR_001905 | – |
| Software, algorithm | Rstudio | Rstudio | RRID:SCR_000432 | – |
| Software, algorithm | MetaboAnalystR | – | RRID:SCR_016723 | – |
| Software, algorithm | Moduland algorithm | – | https://www.linkgroup.hu/docs/ModuLand-ESM1-v5.pdf | – |
| Software, algorithm | Cytoscape | Cytoscape | RRID:SCR_003032 | – |
| Software, algorithm | Qlucore | Qlucore Omics Explorer | https://www.qlucore.com/bioinformatics | – |
| Software, algorithm | Robust Multi-Array Average algorithm | – | http://www.molmine.com | – |
| Software, algorithm | ChromaTOF | LECO | https://www.leco.com | – |
| Software, algorithm | MATLAB R2016a | Mathworks | https://www.mathworks.com | – |
| Software, algorithm | Roche LC software | Roche Molecular Systems, Inc | – | – |
| Software, algorithm | NormFinder | Aarhus University Hospital, Denmark | RRID:SCR_003387 | – |
| Software, algorithm | NIST MS 2.0 software | NIST | https://chemdata.nist.gov | – |
| Other | LightCycler 480 Real-Time PCR System | Roche Molecular Systems, Inc | RRID:SCR_020502 | – |
| Other | Agilent 1290 Infinity UHPLC-system | Agilent Technologies, Inc | https://www.agilent.com | – |
| Other | Agilent 2100 Bioanalyzer system | Agilent Technologies, Inc | RRID:SCR_018043 | – |
| Other | Agilent 6550 iFunnel Q-TOF LC/MS | Agilent Technologies, Inc | RRID:SCR_019433 | – |
| Other | ENCODE | Stanford University | RRID:SCR_015482 | – |
| Other | UCSC Genome Browser | UCSC | RRID:SCR_005780 | – |
| Other | TarBase | DIANA Tools | RRID:SCR_010841 | – |
| Other | miRecords | Biolead.org | RRID:SCR_013021 | – |
| Other | TargetScan | Whitehead Institute for Biomedical Research | RRID:SCR_010845 | – |
| Other | BioGRID | TyersLab.com | RRID:SCR_007393 | – |
| Other | Ingenuity Pathway Analysis | Qiagen | RRID:SCR_008653 | – |
Additional files
-
Supplementary file 1
Analysis of 'omic datasets.
(1) S file 1a. Transcriptomic analysis of peripheral blood mononuclear cells and adipose tissue from 7 AM (morning of the second intervention day) treated with hydrocortisone and saline (control). (2) S file 1b. miRNA with differential expression in plasma samples from 7 AM (morning of the second intervention day) treated with hydrocortisone and saline (control). (3) S file 1c. Gas chromatography-mass spectrometry (GC-MS) of serum samples from 7 AM (morning of the second intervention day) treated with hydrocortisone and saline (control). (4) S file 1d. Liquid chromatography-mass spectrometry (LC-MS) of serum samples from 7 AM (morning of the second intervention day) treated with hydrocortisone and saline (control). (5) S file 1e. The set of 59 genes with fold changes in the same directions in peripheral blood mononuclear cells (PBMCs) and adipose tissue transcriptomic data sets from 7 AM (morning of the second intervention day) treated with hydrocortisone and saline (control). (6) S file 1f. The order of the 11 clusters of ‘omic data in the correlation matrix. (7) S file 1g. Analysis of all ‘omic sets at 7 AM (morning of the second intervention day) treated with hydrocortisone and saline (control). (8) S file 1h. Biological pathways associated with differential gene expression in PBMCs between hydrocortisone and saline treated patients at 7 AM on the second intervention day. (9) S file 1i. The central gene in each network module arranged in hierarchical order as ranked by network centrality score. (10) S file 1j. Causal network analysis of the differential gene expression in PBMCs associated with glucocorticoid action.
- https://cdn.elifesciences.org/articles/62236/elife-62236-supp1-v1.xlsx
-
Transparent reporting form
- https://cdn.elifesciences.org/articles/62236/elife-62236-transrepform-v1.pdf
-
Reporting standard 1
CONSORT 2010 Randomised Trial Checklist.
- https://cdn.elifesciences.org/articles/62236/elife-62236-repstand1-v1.pdf
-
Reporting standard 2
CONSORT 2010 Flow Diagram.
- https://cdn.elifesciences.org/articles/62236/elife-62236-repstand2-v1.pdf
Download links
A two-part list of links to download the article, or parts of the article, in various formats.
Downloads (link to download the article as PDF)
Open citations (links to open the citations from this article in various online reference manager services)
Cite this article (links to download the citations from this article in formats compatible with various reference manager tools)
Identification of human glucocorticoid response markers using integrated multi-omic analysis from a randomized crossover trial
eLife 10:e62236.
https://doi.org/10.7554/eLife.62236


