Adaptive evolution of nontransitive fitness in yeast
- Department of Biological Sciences, Lehigh University, United States
Figures
Figure 1 with 3 supplements
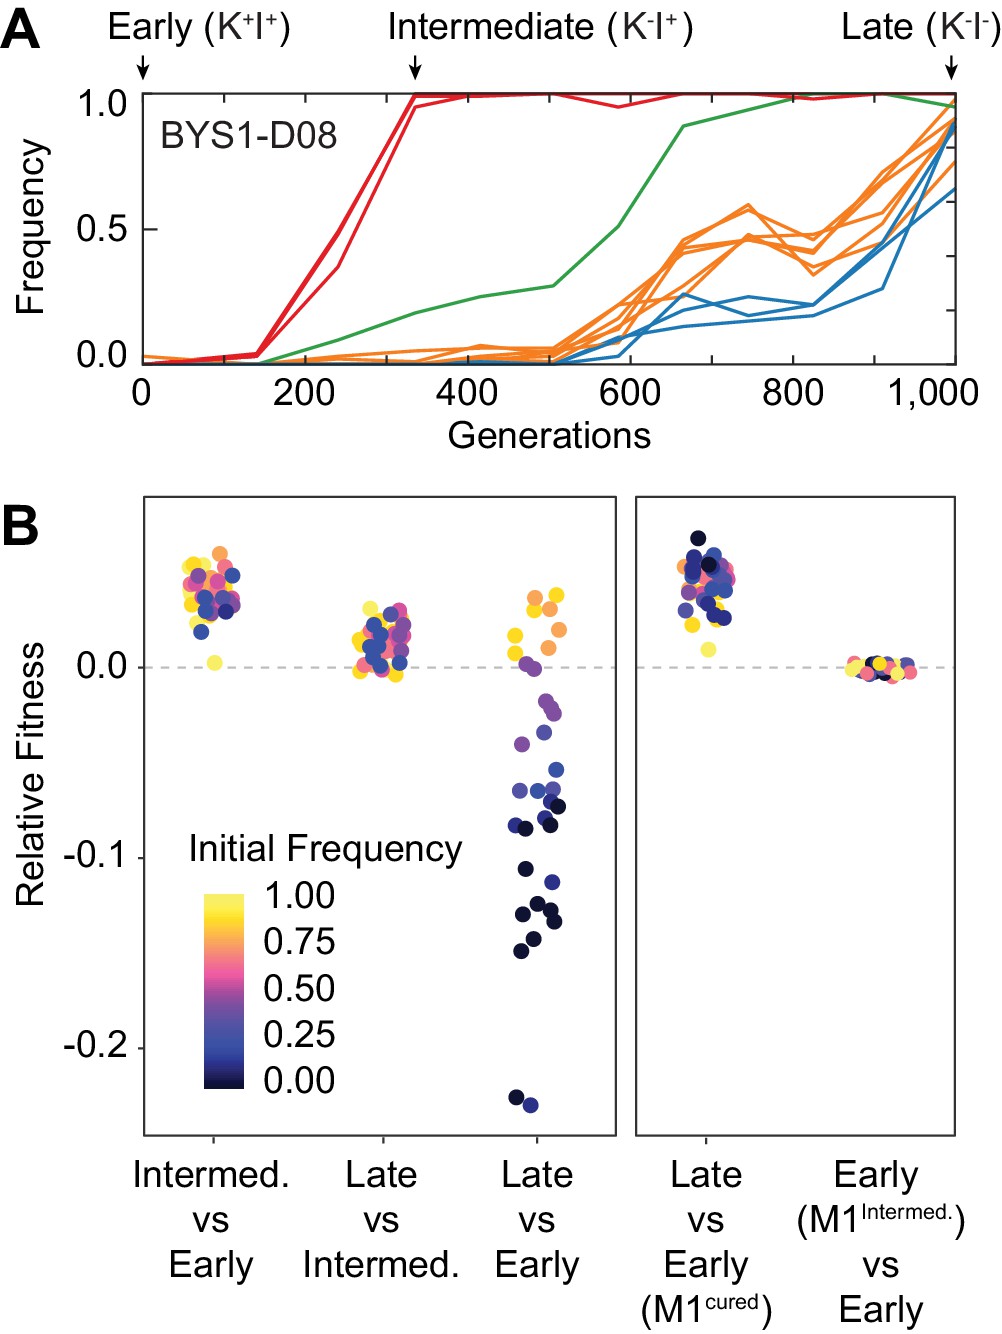
Nontransitivity and positive frequency dependence arise along an evolutionary lineage.
(A) Sequence evolution (from Lang et al., 2013) shows that population BYS1-D08 underwent four clonal replacements over 1000 generations. Mutations in the population that went extinct are not shown. The four selective sweeps are color-coded: red, mutations in yur1, rxt2, and an intergenic mutation; green, a single intergenic mutation; orange, mutations in mpt5, gcn2, iml2, ste4, mud1, and an intergenic mutation; blue, three intergenic mutations. The Intermediate clone isolated at Gen. 335 does not produce, but is resistant to, the killer toxin (K-I+). The Late clone, isolated at Generation 1000 does not produce, and is sensitive to, the killer toxin (K-I-). (B) Competition experiments demonstrate nontransitivity and positive frequency-dependent selection. Left: Relative fitness of Early (Gen. 0), Intermediate (Gen. 335), and Late (Gen. 1000) clones. Right: Relative fitness of the Early clone without ancestral virus or with the viral variant from the Intermediate clone. Fitness and starting frequency correspond to the later clone relative to the earlier clone during pairwise competitions.
Figure 1—figure supplement 1

Positive frequency-dependent interaction along an evolutionary lineage.
Fitness of Late clone relative to Early clone, as a function of frequency. Stable fixed points indicated by closed black circles and unstable fixed point indicated by open black circle.
Figure 1—figure supplement 2
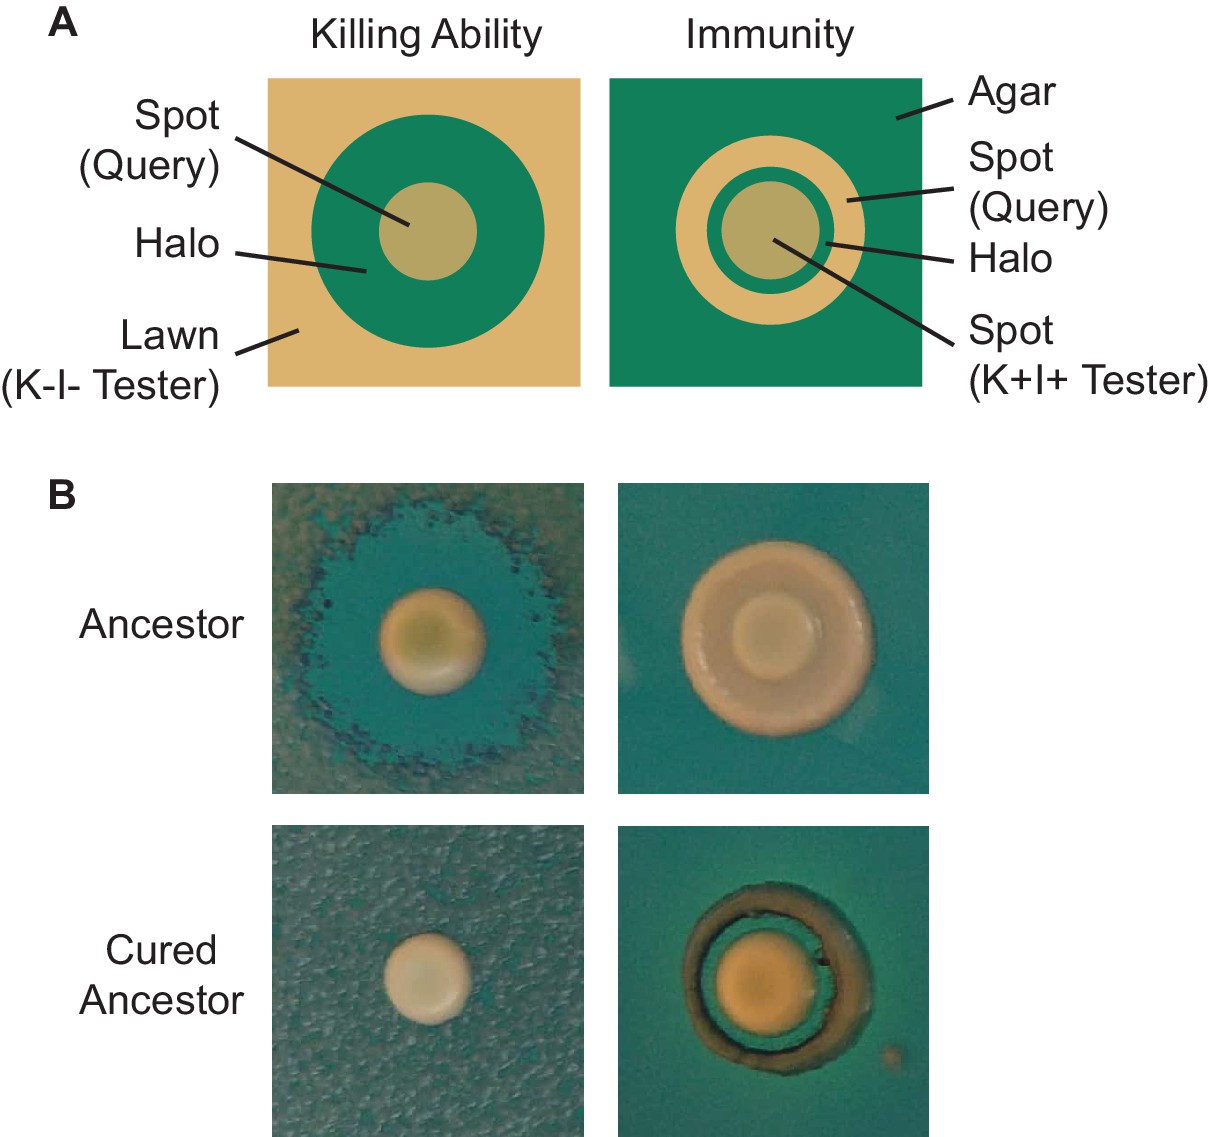
Visualization of killer phenotype by halo assay.
(A) Schematic of killer phenotypic assays. To assay killing ability, a tester (sensitive) strain is spread as a lawn, followed by a query strain spotted as a concentrated culture. After incubation, the production of a zone of clearing indicates that the query strain possesses killing ability. To assay sensitivity, a query strain is plated as a dilute spot, followed by a tester (killer) strain spotted as a concentrated culture. After incubation, the production of a zone of clearing indicates that the query strain possesses killing ability. (B) Halo assays demonstrate that the ancestor of the evolution experiment exhibits killing ability and immunity while the cured ancestor lacks killing ability and is sensitive to the toxin.
Figure 1—figure supplement 3
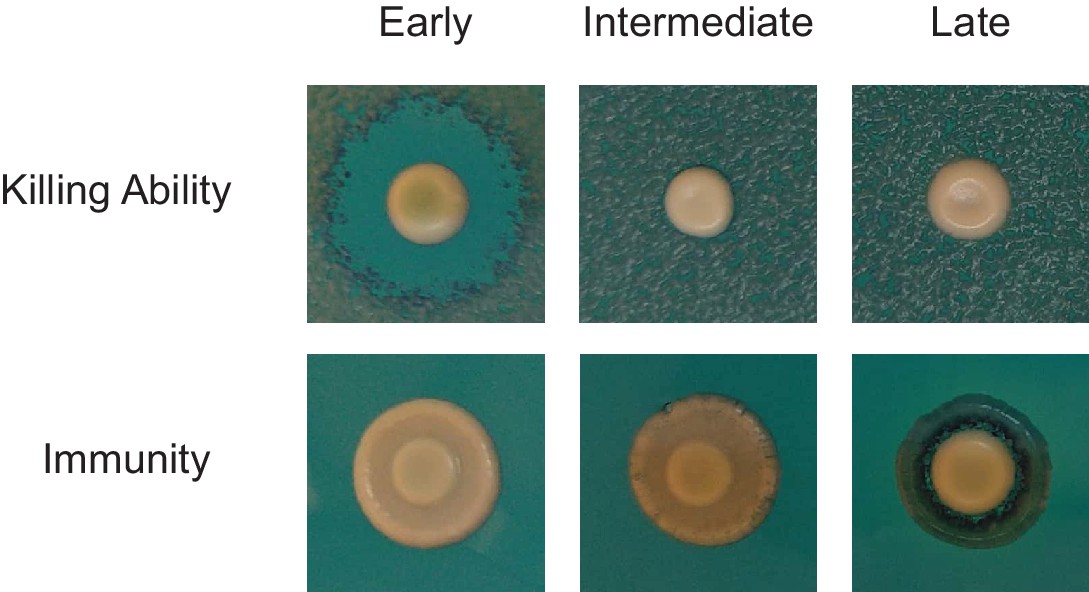
Stepwise deterioration of killer phenotype in evolved clones.
The killer phenotypes of Early, Intermediate, and Late clones from population BYS1-D08 were determined by halo assay.
Figure 2 with 1 supplement
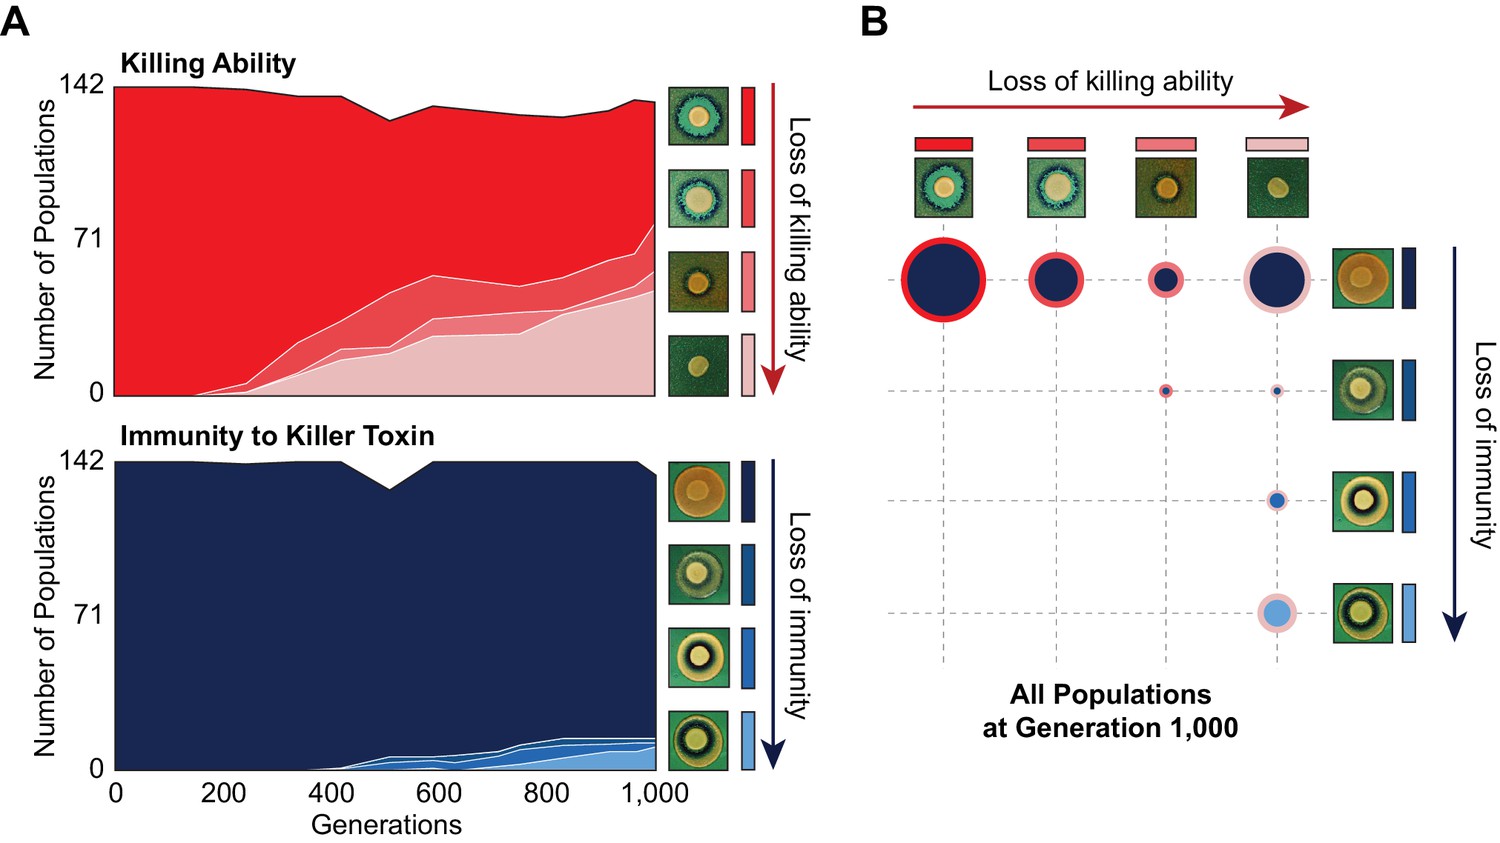
Changes in killer-associated phenotypes in the 142 populations that were founded by a single ancestor and propagated at the same bottleneck size as BYS1-D08 (Lang et al., 2011).
(A) Loss of killing ability (top) and immunity (bottom) from evolving yeast populations over time. Killer phenotypes were monitored by halo assay (examples shown on right). (B) Breakdown of killer phenotypes for all populations at Generation 1000. Data point size corresponds to number of populations. Border and fill color indicate killing ability and immunity phenotypes, respectively, as in panel A.
Figure 2—figure supplement 1
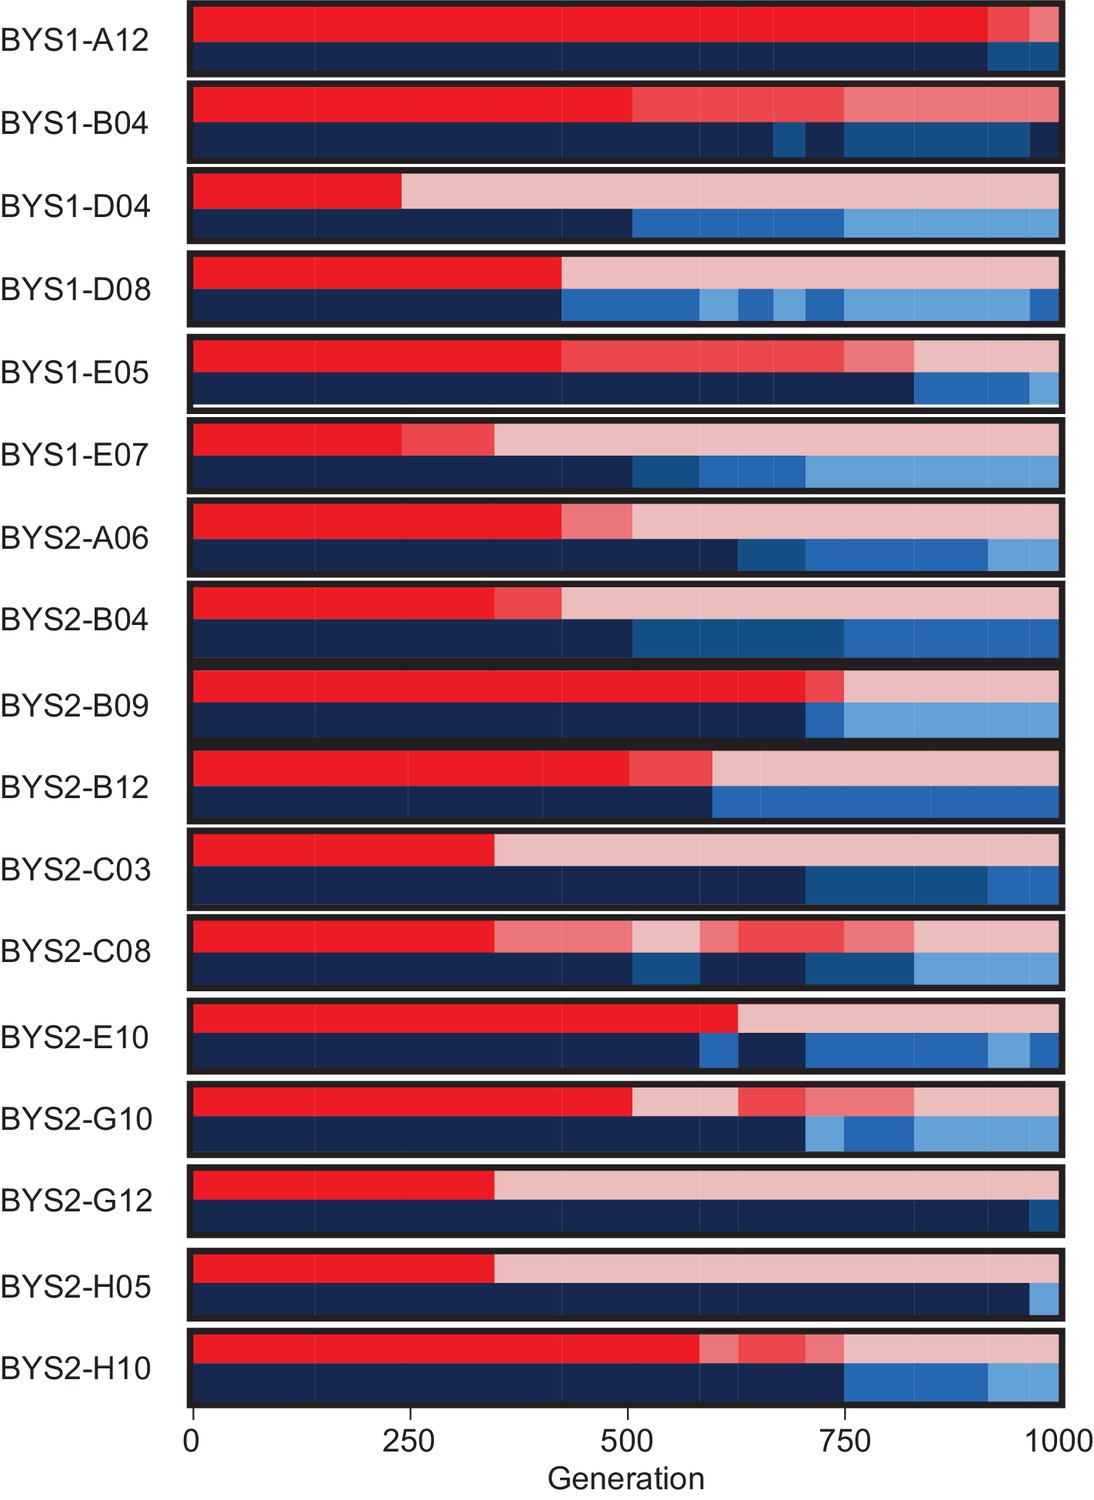
Killer phenotypes of the 17 populations that develop sensitivity to the K1 toxin.
Killer phenotype is shown according to scale in Figure 2. For each population, killing ability is shown in shades of red (top) and immunity in shades of blue (bottom).
Figure 3 with 1 supplement
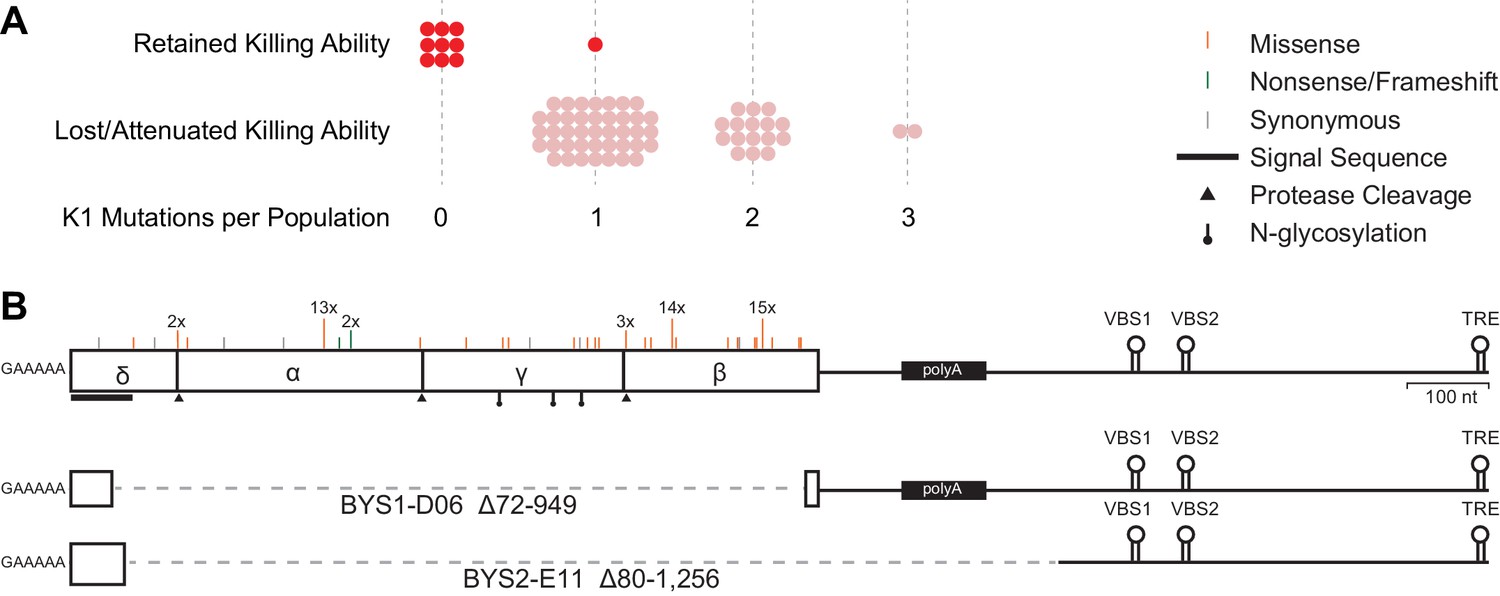
Loss of killer phenotype correlates with the presence of mutations in the K1 toxin gene.
(A) Number of mutations in the K1 gene in yeast populations that retain or lose killing ability. Each data point represents a single yeast population. (B) Observed spectrum of point mutations across the K1 toxin in 67 evolved yeast populations. Mutations were detected in a single population unless otherwise noted. Large internal deletion variants from two yeast populations (BYS1-D06 and BYS2-E11). The deletions span the region indicated by the dashed gray line. VBS: viral binding site. TRE: terminal recognition element.
Figure 3—figure supplement 1

Sequence divergence of ancestral viruses.
The viruses of our ancestral yeast strain diverged from previously published LA and M1 genomes by 19 nucleotides and 7 nucleotides, respectively. Solid lines represent nonsynonymous polymorphisms, labeled by amino acid substitution. Dashed lines represent synonymous/intergenic polymorphisms.
Figure 4 with 1 supplement
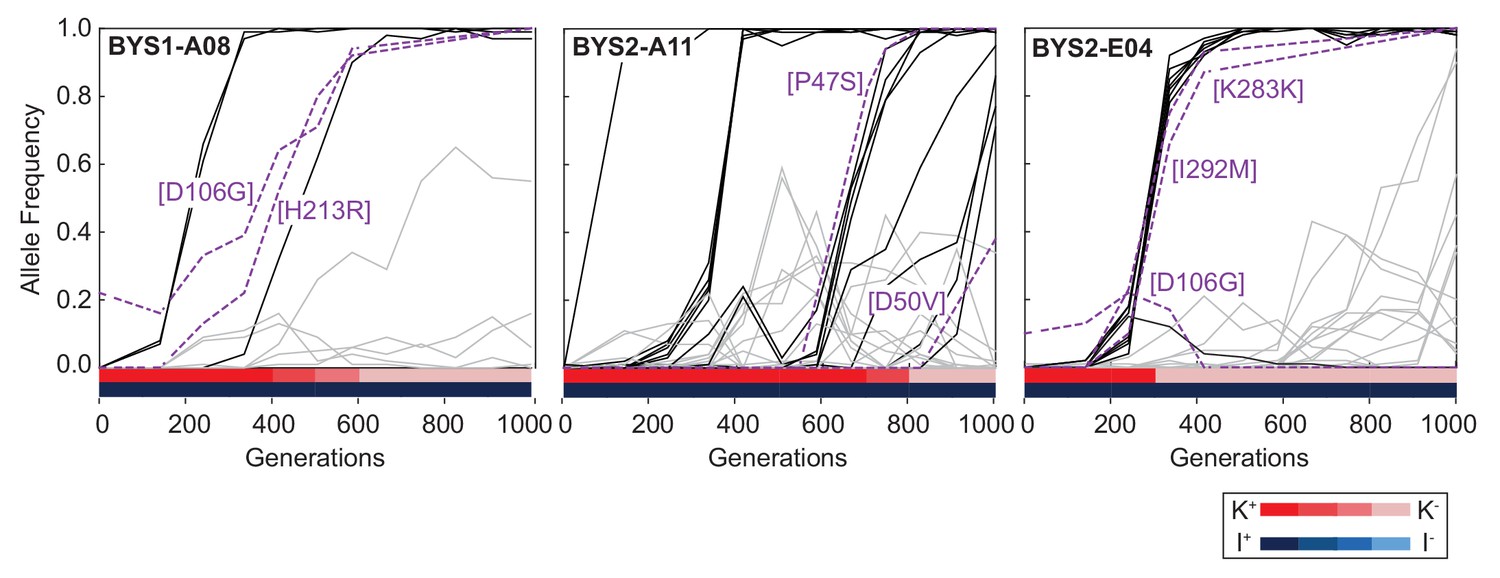
Viral dynamics mimic nuclear dynamics.
Killer phenotype of evolved populations is indicated by color according to the key. Nuclear dynamics (reported previously in Lang et al., 2013) are represented as solid lines. Nuclear mutations that sweep before or during the loss of killing ability are indicated by black lines. All other mutations are indicated by gray lines. Viral mutations are indicated by purple dashed lines and labeled by amino acid change.
Figure 4—figure supplement 1
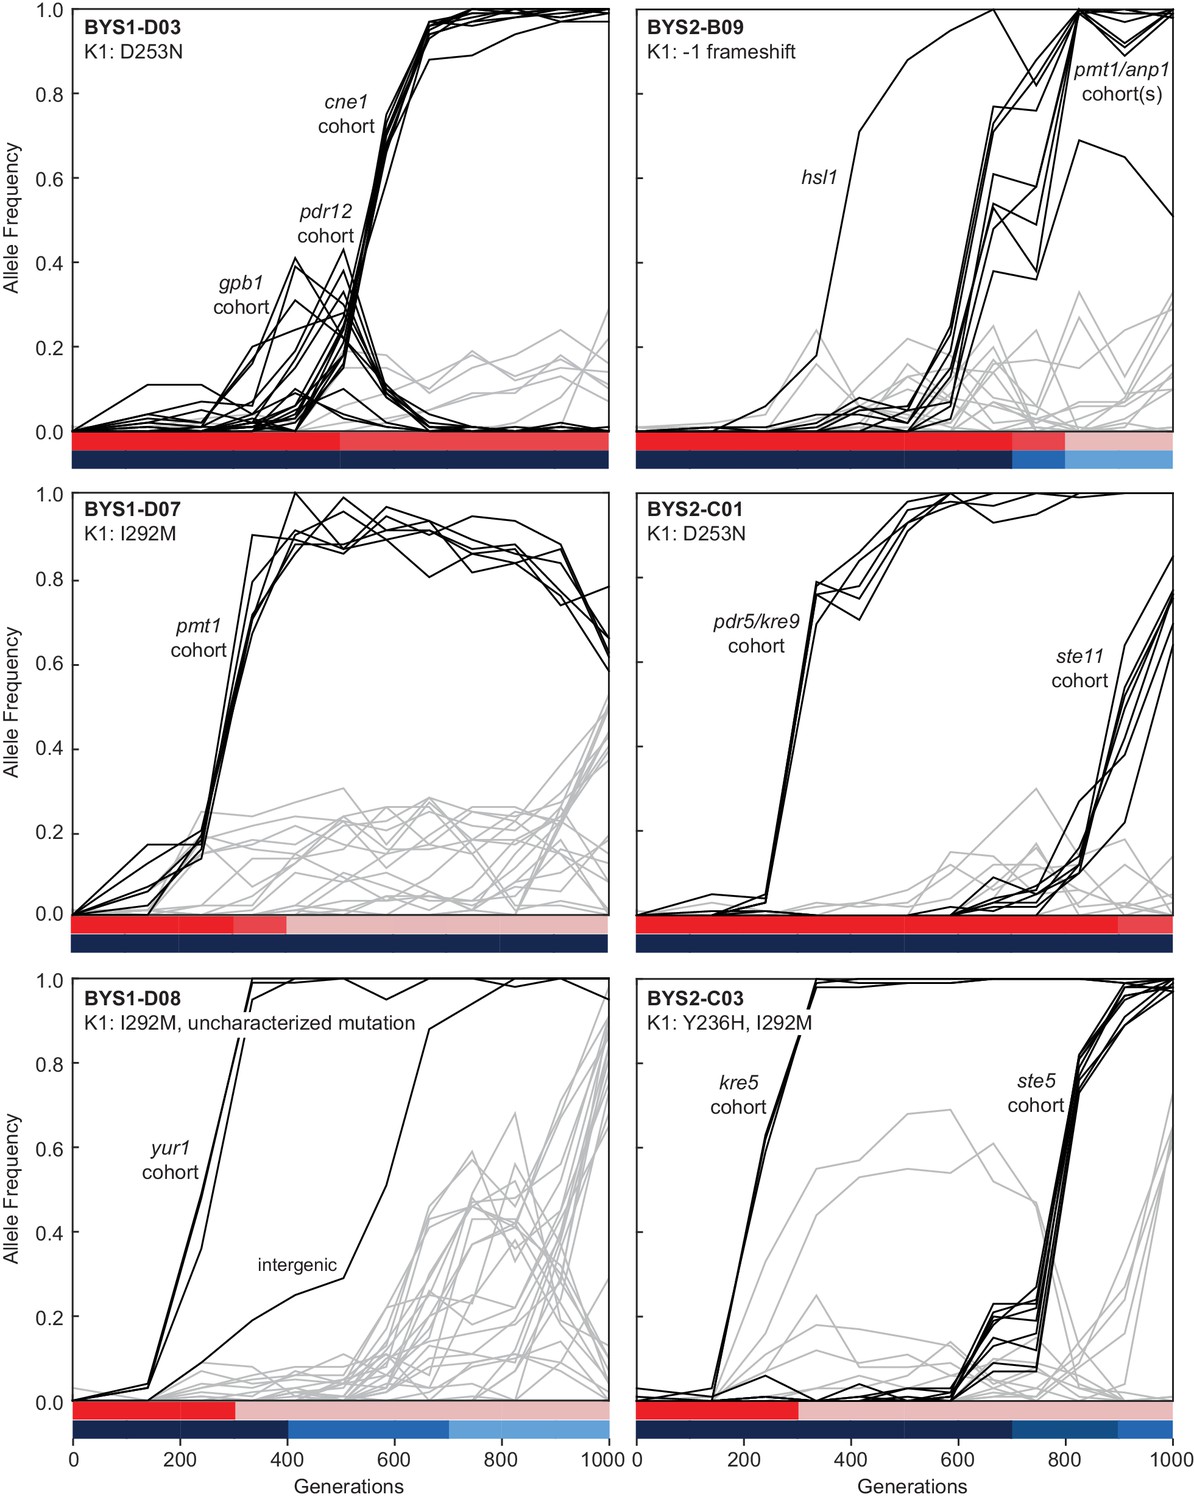
Evolutionary dynamics of nuclear genotypes and killer phenotypes over time.
The K1 mutations detected in each population at Generation 1000 are indicated in the top-left of the plot. Trajectories of nuclear mutations were obtained from Lang et al., 2013. Black lines indicate nuclear mutations that swept up to and including the period of killer phenotypic change (all others nuclear mutations are gray). Mutational cohorts are labeled according to their putative driver or putative toxin resistance mutation. Killing ability and immunity are indicated in bar graph (bottom) by shades of red and blue, respectively.
Figure 5 with 2 supplements

Viral evolution is driven by selection for an intracellular competitive advantage.
(A) Relative fitness of viral variants in pairwise competition with the ancestor (K+I+) and virus-cured ancestor (K-I-). Killer phenotype and identity of viral variant labeled above (Kw indicates weak killing ability). Killer phenotype of the ancestral competitor labeled below. Starting frequency indicated by color. (B) Change to killer phenotype during intracellular competitions between viral variants (by color) and ancestral virus. Replicate lines indicated by symbol. (C) Variant frequency during intracellular competitions. Colors and symbols consistent with panel B. Inset: frequency of the de novo G131D viral variant.
Figure 5—figure supplement 1
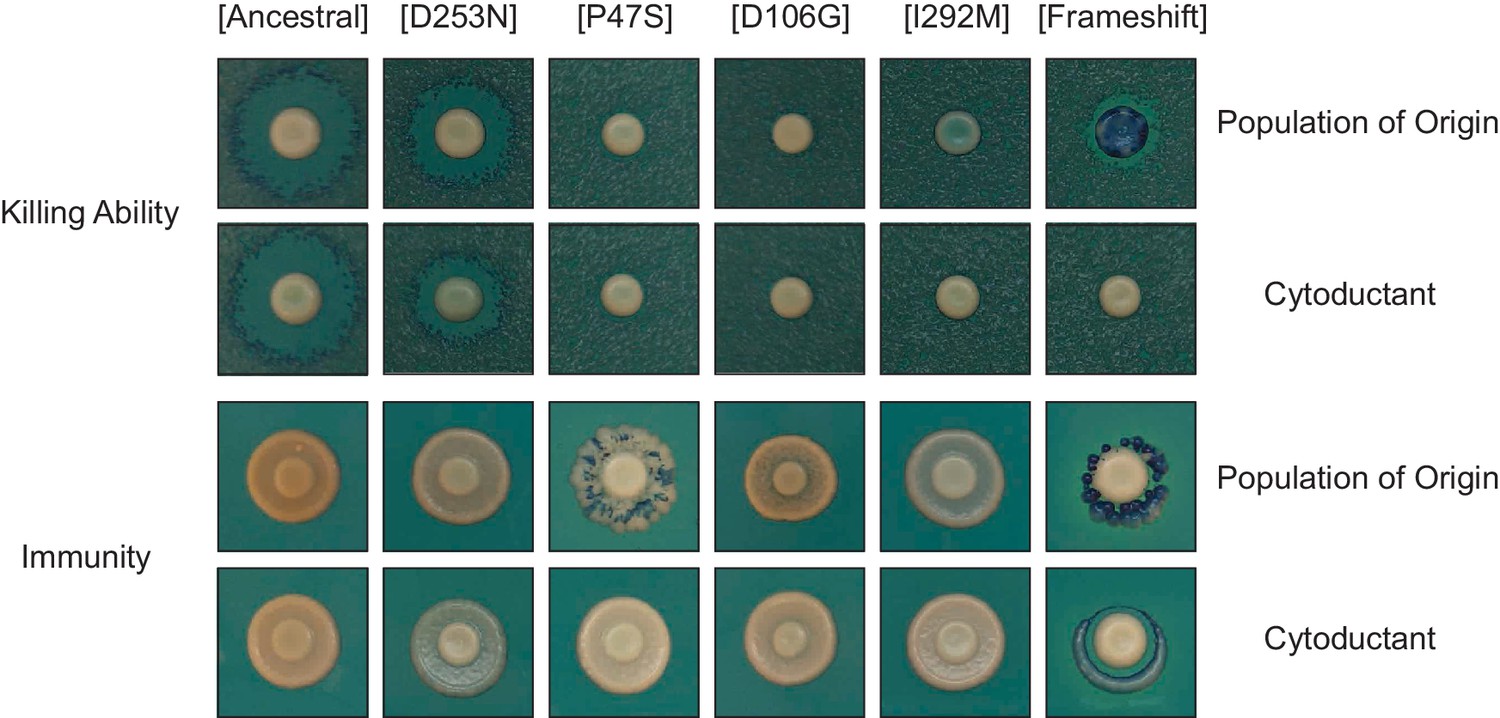
Cytoductants exhibit the same killer phenotype as the population of origin.
Viral variants were transferred from evolved populations to a cured ancestor. Halo assays demonstrate that killer phenotypes were consistent between donor and recipient strains. Viruses were obtained from the following evolved populations at Generation 1000: BYS1-A03 (D253N), RMB1-A02 (P47S), BYB1-H06 (D106G), BYS1-A05 (I292M), and BYS2-B09 (frameshift). Populations RMB1-A02 and BYS2-B09 appear mixed given the observed speckling pattern.
Figure 5—figure supplement 2
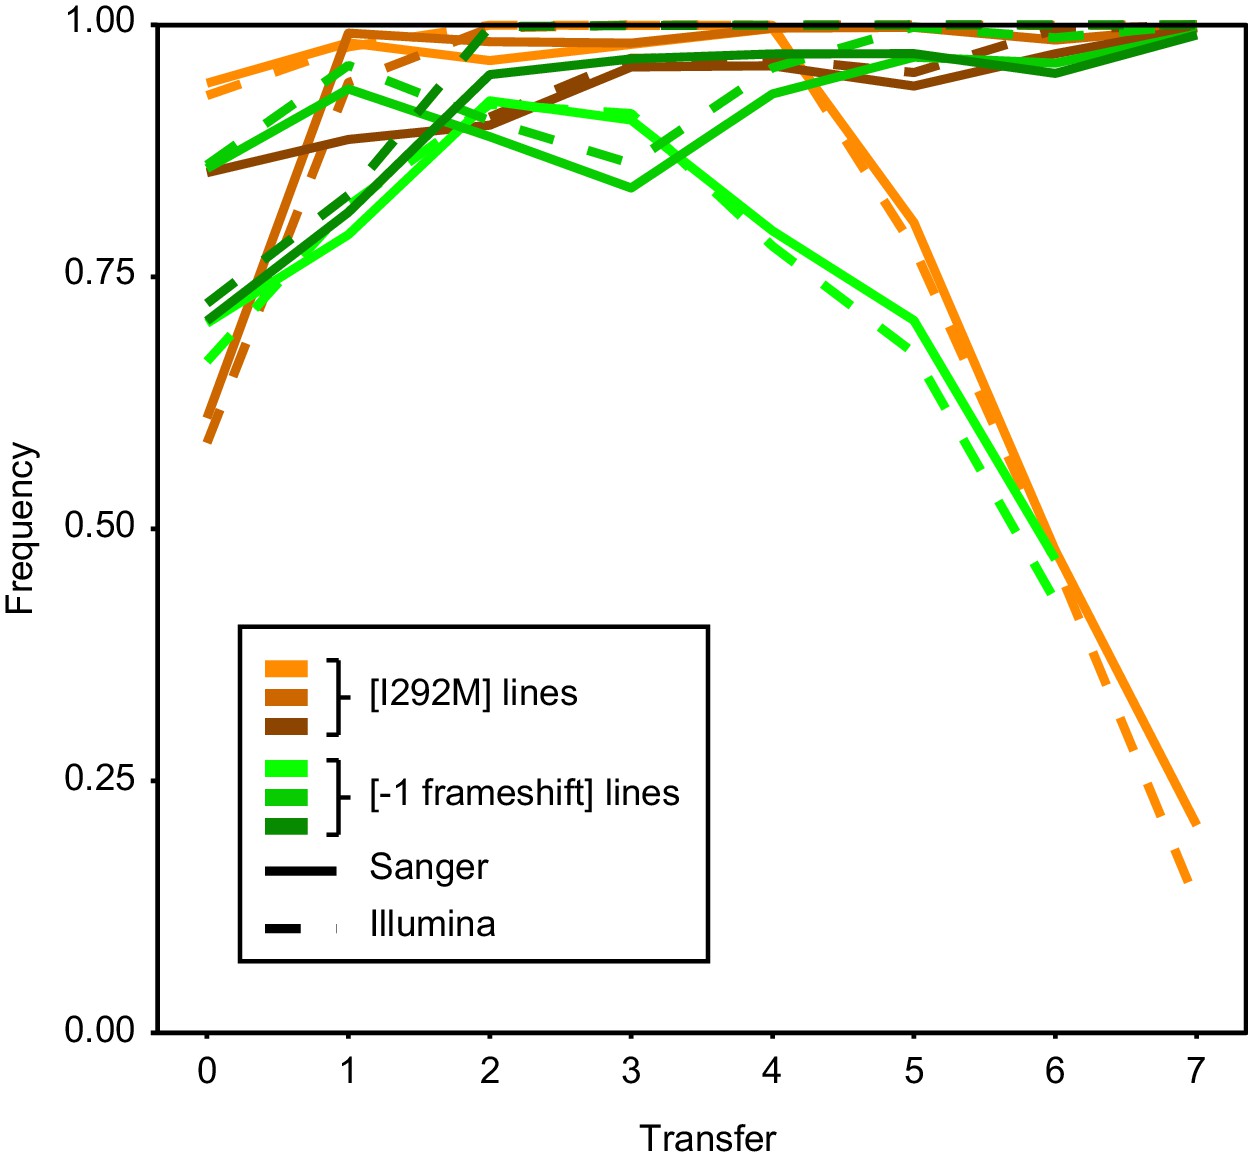
Consensus between Sanger and Illumina sequencing in reporting mutation frequency.
Intracellular competitions were tracked over time by both Sanger and Illumina sequencing.
Figure 6
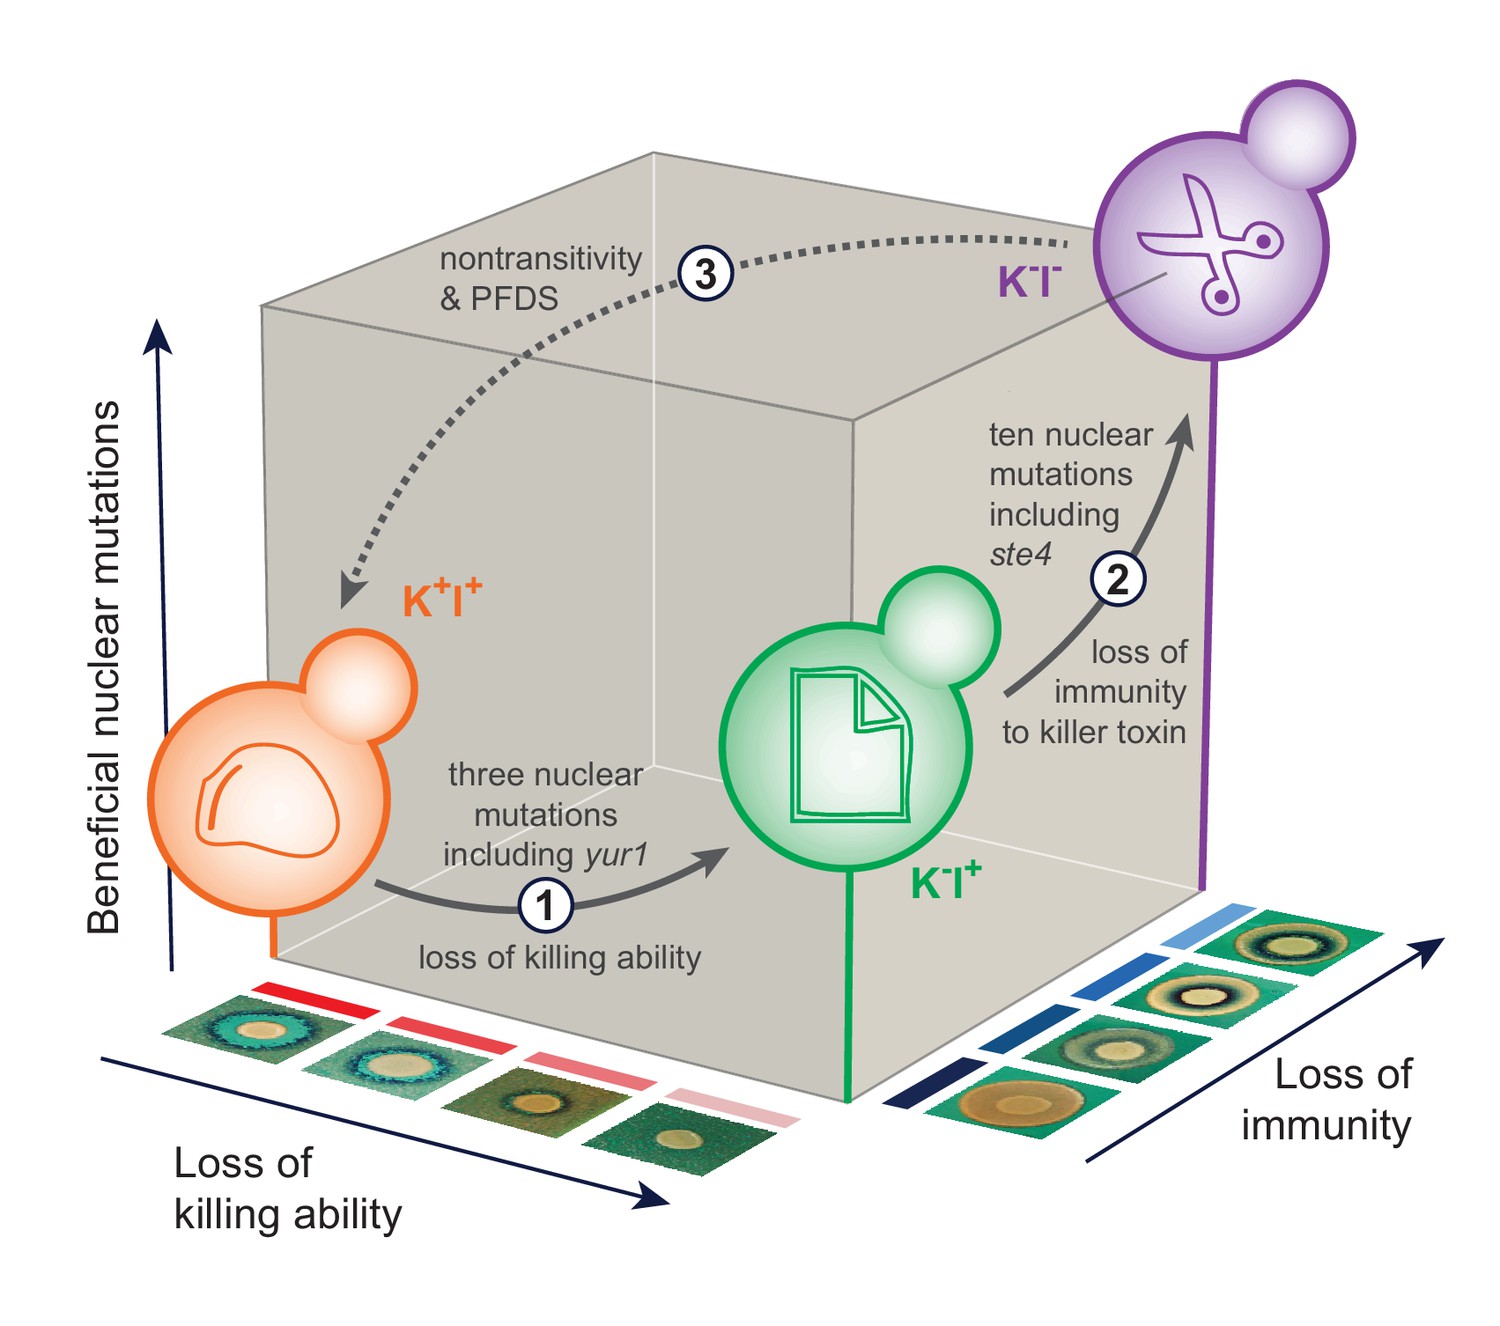
The sequence of events leading to the evolution of nontransitivity in population BYS1-D08.
Nontransitivity arises through multilevel selection requiring adaptive mutations in both the nuclear and viral genomes. The Early clone (orange) produces, and is resistant to, killer toxin. Step 1: after 335 generations, the Intermediate clone (green) fixed three nuclear mutations including a beneficial mutation in yur1 and lost the ability to produce killer toxin due to intracellular competition between viral variants. Step 2: after another 665 generations, the Late clone (purple) fixed an additional 10 nuclear mutations including a beneficial mutation in ste4 and lost immunity to the killer toxin, which is no longer present in the environment. Step 3: when brought into competition with the Early clone (1000 generations removed), the Late clone loses in a frequency-dependent manner due to killer toxin produced by the Early clone. Positive frequency-dependent selection (PFDS) emerges in the competition because the fitness disadvantage of the Late clone can be overcome if it starts the competition at high frequency relative to the Early clone.
Tables
Key resources table
| Reagent type (species) or resource | Designation | Source or reference | Identifiers | Additional information |
|---|---|---|---|---|
| Strain, strain background (Saccharomyces cerevisiae) | yGIL432 | First reported in Lang et al., 2011 | Early clone/Ancestor of evolution experiment | Lang Lab strain collection |
| Strain, strain background (Saccharomyces cerevisiae) | yGIL519 | First reported in Lang et al., 2011 | ymCitrine reference strain | Lang Lab strain collection |
| Strain, strain background (Saccharomyces cerevisiae) | yGIL1582 | This paper | Intermediate clone | Lang Lab strain collection |
| Strain, strain background (Saccharomyces cerevisiae) | yGIL1042 | This paper | Late clone | Lang Lab strain collection |
| Strain, strain background (Saccharomyces cerevisiae) | yGIL1097 | This paper | Sensitive tester strain | Lang Lab strain collection |
| Strain, strain background (Saccharomyces cerevisiae) | yGIL1253 | This paper | Early clone/Ancestor (M1 cured) | Lang Lab strain collection |
| Strain, strain background (Saccharomyces cerevisiae) | yGIL1353 | This paper | kar1∆15 mating partner | Lang Lab strain collection |
| Recombinant DNA reagent | pMR1593 | Mark Rose (Georgetown University) | kar1Δ15 integrating plasmid | ATCC (87710) |
| Sequence-based reagent | M1_F1 | This paper | PCR (Sanger sequencing) | TTGGCTATTACAGCGTGCCA |
| Sequence-based reagent | M1_F5 | This paper | PCR (Sanger sequencing) | ATGACGAAGCCAACCCAAGT |
| Sequence-based reagent | M1_F7 | This paper | PCR (Sanger sequencing) | CAGAAAAAGAGAGAACAGGAC |
| Sequence-based reagent | M1_R3 | This paper | cDNA synthesis, PCR (Sanger sequencing) | TGCTGTTGCATTAAACCAGGC |
| Sequence-based reagent | M1_R6 | This paper | PCR (Sanger sequencing) | ATAGCCCGGTGCTCTGTAGG |
| Sequence-based reagent | LA_F2 | This paper | PCR (Sanger sequencing) | ATCAGGTGATGCAGCGTTGA |
| Sequence-based reagent | LA_F3 | This paper | PCR (Sanger sequencing) | ACTCCCCATGCTAAGATTTGTT |
| Sequence-based reagent | LA_R2 | This paper | PCR (Sanger sequencing) | CGGCACCCTTACGGAGATAC |
| Sequence-based reagent | LA_R3 | This paper | PCR (Sanger sequencing) | GACCTGTAATGCCCGGAGTG |
| Sequence-based reagent | LA_R6 | This paper | PCR (Sanger sequencing) | AGTACTGAGCCCCAAGACCA |
| Sequence-based reagent | I292M_read1 | This paper | PCR (Illumina sequencing) | CGTCGGCAGCGTCAGATGTGTATAAGAGACAGNNNNNNNNCCATGGTGTCGGCTAATGGT |
| Sequence-based reagent | I292M_read2 | This paper | PCR (Illumina sequencing) | CGTGGGCTCGGAGATGTGTATAAGAGACAGAGGTCAGACACGATGCCCTA |
| Sequence-based reagent | frameshift_read1 | This paper | PCR (Illumina sequencing) | CGTCGGCAGCGTCAGATGTGTATAAGAGACAGNNNNNNNNCCCGTCTGCGACAGTAGAAA |
| Sequence-based reagent | frameshift_read2 | This paper | PCR (Illumina sequencing) | CGTGGGCTCGGAGATGTGTATAAGAGACAGTGTGTAAGAACTGCGTGGGT |
| Sequence-based reagent | i5_adapter | This paper | PCR (Illumina sequencing) | AATGATACGGCGACCACCGAGATCTACACNNNNNNNNTCGTCGGCAGCGTCAGATG |
| Sequence-based reagent | i7_adapter | This paper | PCR (Illumina sequencing) | CAAGCAGAAGACGGCATACGAGATNNNNNNNNGTCTCGTGGGCTCGGAGATGTG |
Additional files
-
Supplementary file 1
Killer phenotype and K1 mutations in evolved yeast populations at Generation 1000.
A caret () indicates that a population is heteroplasmic for variants listed. An asterisk (*) indicates that the mutation results in loss of PCR primer binding sites thereby preventing further characterization.
- https://cdn.elifesciences.org/articles/62238/elife-62238-supp1-v2.docx
-
Supplementary file 2
Mutational biases in viral and nuclear data sets.
- https://cdn.elifesciences.org/articles/62238/elife-62238-supp2-v2.docx
-
Transparent reporting form
- https://cdn.elifesciences.org/articles/62238/elife-62238-transrepform-v2.docx
Download links
A two-part list of links to download the article, or parts of the article, in various formats.
Downloads (link to download the article as PDF)
Open citations (links to open the citations from this article in various online reference manager services)
Cite this article (links to download the citations from this article in formats compatible with various reference manager tools)
Adaptive evolution of nontransitive fitness in yeast
eLife 9:e62238.
https://doi.org/10.7554/eLife.62238


