Age-related changes in polycomb gene regulation disrupt lineage fidelity in intestinal stem cells
- Immunology Discovery, Genentech, United States
- OMNI Bioinformatics, Genentech, United States
- Institute of Hematology and Blood Transfusion, Poland
- Buck Institute for Research on Aging, United States
- School of Biosciences, University of Kent, United Kingdom
- Department of Biomedical Engineering and Biological Design Center,Boston University, United States
- Department of Microchemistry, Proteomics, Lipidomics and Next Generation Sequencing, Genentech, United States
- Huntsman Cancer Institute, University of Utah, United States
Figures
Figure 1 with 2 supplements

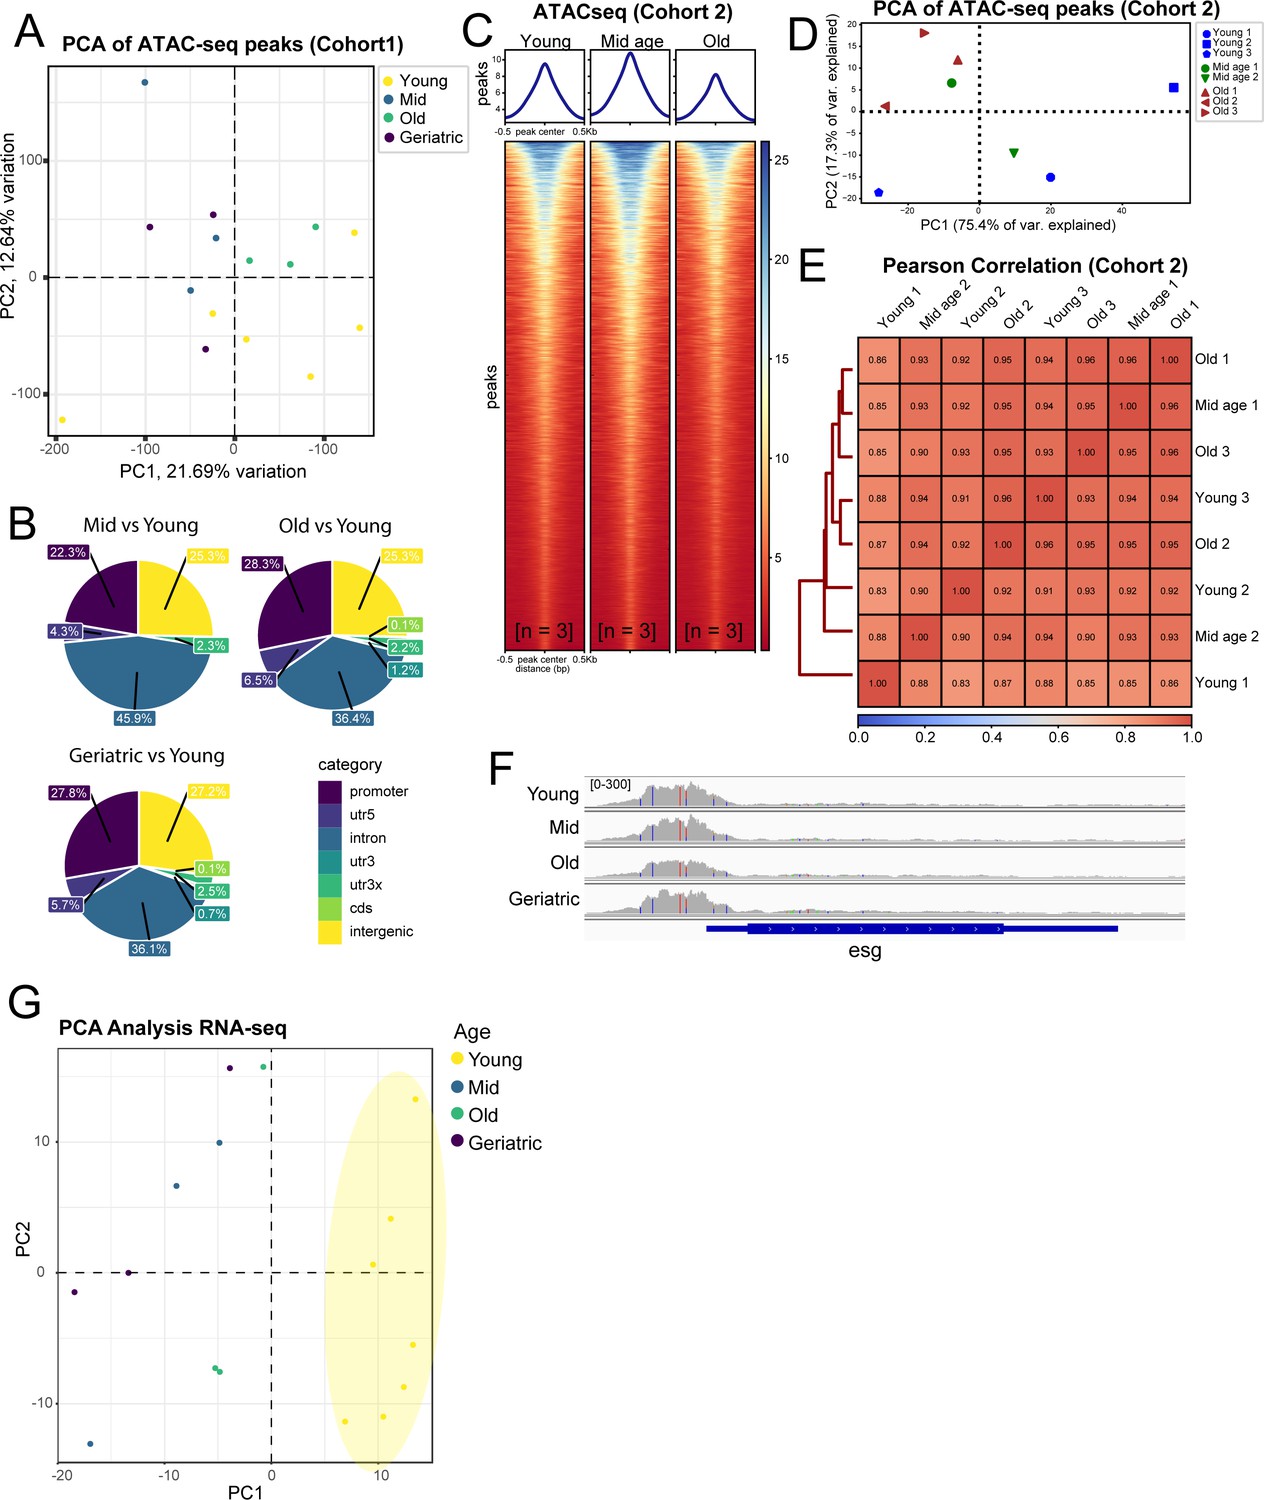
Chromatin accessibility and transcriptional changes in aging ISCs suggest a perturbation in lineage fidelity.
(A) Experimental design of midgut dissection and ISC isolation. Inset shows an example of a young and aged midgut of the fly line used with ISCs marked by YFP (green), EEs marked by Prospero (red), and DAPI in blue. n represents the number of samples containing ISCs from ~120 guts of the indicated age. (B) Example of the gating strategy used in Fluorescence Activated Cell Sorting (FACS) for isolation of YFP+ ISCs. (C) Heatmap of average chromatin accessibility in ISCs at young, mid-age, old, and geriatric time-points. (D) Pearson correlation heatmap showing ATAC-seq sample similarity. (E) Volcano plots of significantly differentially accessible peaks at gene promoter regions at aged time-points compared to young. See also Supplementary file 1. (F) Motif analysis of differentially accessible promoter regions. (G) Pearson correlation heatmap showing RNA-seq sample similarity. (H) Volcano plots of significantly differentially regulated genes. See also Supplementary file 2. (I) Gene Set Enrichment Analysis of an EE and EC geneset at aging time-point comparisons. Figure supplement 1 and 2. contain additional comparisons of sample similarity of aging ISCs from ATAC-seq and RNA-seq experiments.
Figure 1—figure supplement 1
Additional comparisons of sample similarity of aging ISCs from ATAC-seq and RNA-seq experiments.
(A, D) PCA analysis on ATAC-seq samples from Cohort 1 (A) and Cohort 2 (D). (B) Genomic distribution of differentially accessible chromatin regions from different age comparisons. (C) Heatmap of average chromatin accessibility at different aging time-points from ATAC-seq from Cohort 2. n represents the number of samples containing ISCs from ~120 guts of the indicated age. (E) Pearson correlation of ATAC-seq samples in Cohort 2. (F) IGV Genome Browser track showing promoter accessibility of esg at all aging time-points. (G) PCA analysis on RNA-seq samples showing distinct separation of young vs aged samples.
Figure 1—figure supplement 2
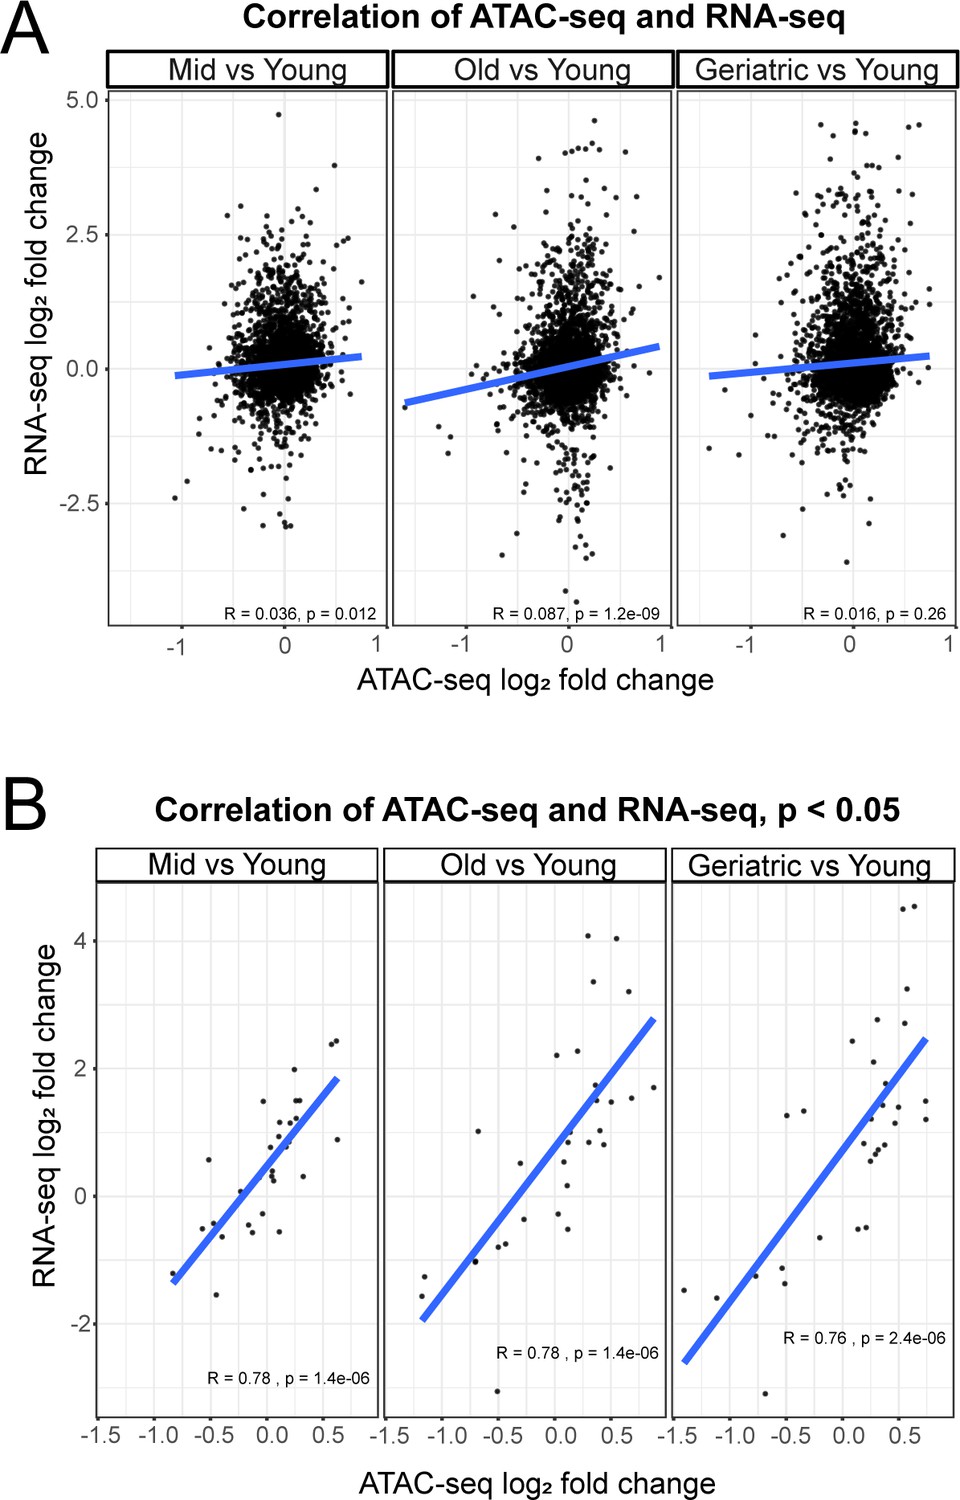
Correlation between gene expression and promoter accessibility.
(A) Correlation of overall gene expression (RNA-seq) and promoter accessibility (ATAC-seq). (B) Correlation of significantly (p<0.05) differentially accessible gene promoters (ATAC-seq) and gene expression (RNA-seq).
Figure 2 with 7 supplements
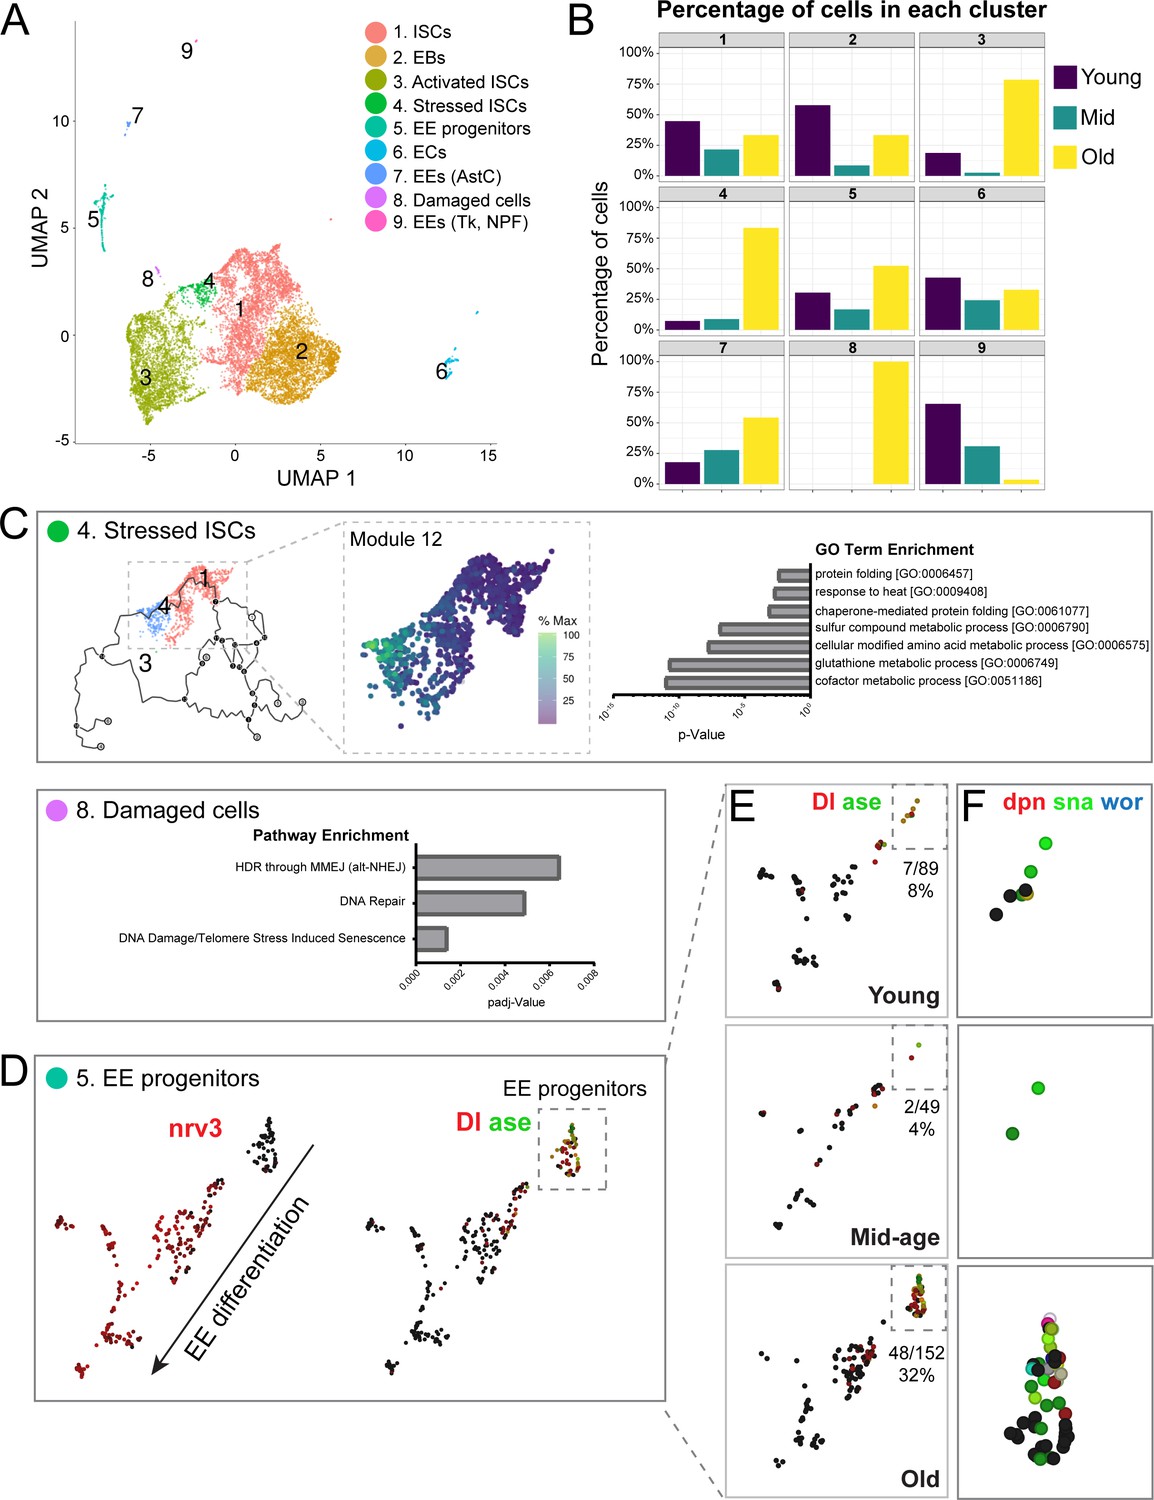
Single-cell RNA-seq analysis reveals old ‘stressed’ ISCs and an increase in EE progenitors during aging.
(A) Uniform Manifold Approximation and Projection (UMAP) plot of combined scRNA-seq data including cells of young, mid-age, and old midguts showing cluster annotation. Clusters were annotated based on gene set enrichment analyses (Figure 2—figure supplement 1). Genetic changes observed in our scRNA-seq were also compared to our bulk RNA-seq data to ensure robustness of results (Figure 2—figure supplements 2 and 3). (B) Age composition of each cluster showing the proportion of cells from young, mid-age and old samples. (C) Top panel: (left) pseudotime of cells in the UMAP (above in A) focusing on the trajectory of young cells (Cluster 1) to old cells (Cluster 4). (middle) Differentially expressed genes along the trajectory (Figure 2—figure supplement 4), focusing on genes that become upregulated in Cluster 4 (Module 12, Figure 2—figure supplement 5). Cells are colored by relative scaling of gene expression to the maximum expression of a given gene. (right) GO term enrichment analysis (Module 12 genes) is shown in the bar graph. Bottom panel: Bar graph showing pathway enrichment for genes expressed in Cluster 8, Module 18 (Figure 2—figure supplement 4). (D) Detailed analysis of Cluster five showing gene expression of mature EE marker nrv3 (left) and EE progenitor markers Dl and ase (right; high expression in red or green, lack of expression in black). Note the direction of differentiation and location of EE progenitors (boxed with dotted line). Figure 2—figure supplement 6 shows additional expression patterns for EE and EE progenitor genes. (E) Split view of Cluster five in D (image on the right) based on age. EE progenitor cells (expressing Dl and ase) are in the outlined box and the proportion of those cells within Cluster five at each age is indicated below each box. (F) Close-up of EE progenitors showing upregulation of pro-neural genes dpn, sna, and wor in red, green, and blue, respectively (see also Figure 2—figure supplement 7). Black indicates no expression.
Figure 2—figure supplement 1
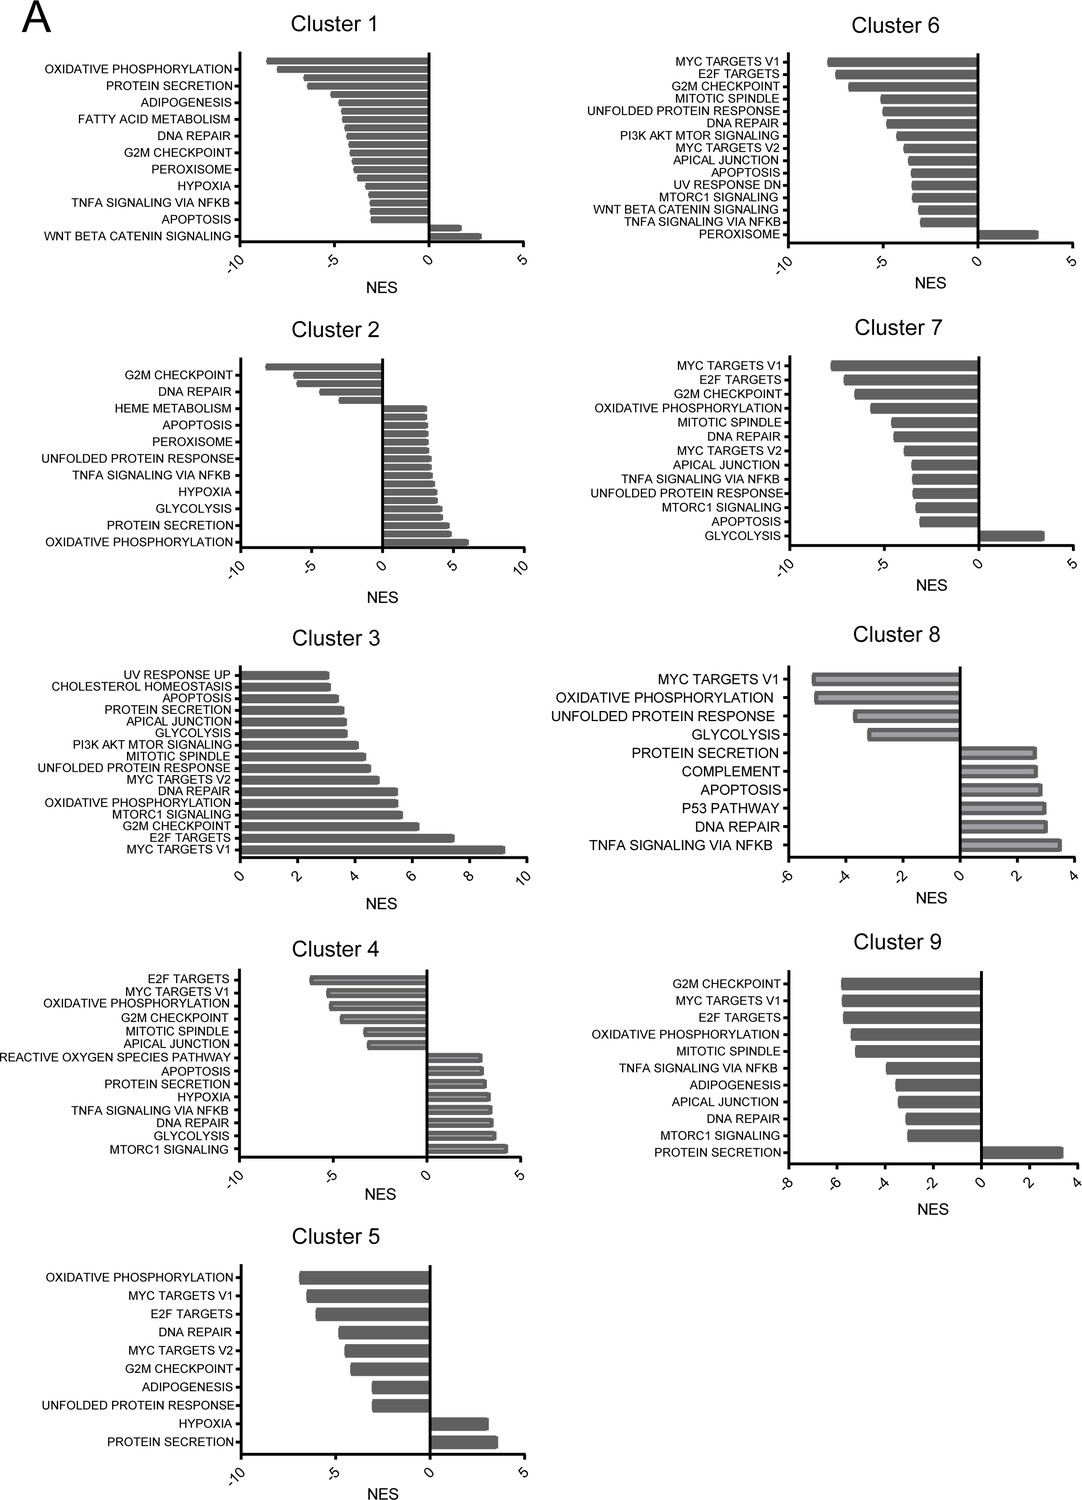
Gene set enrichment analysis per single-cell cluster.
(A) Gene set enrichment analysis on differentially expressed genes in each cluster. NES: Normalized Enrichment Score.
Figure 2—figure supplement 2
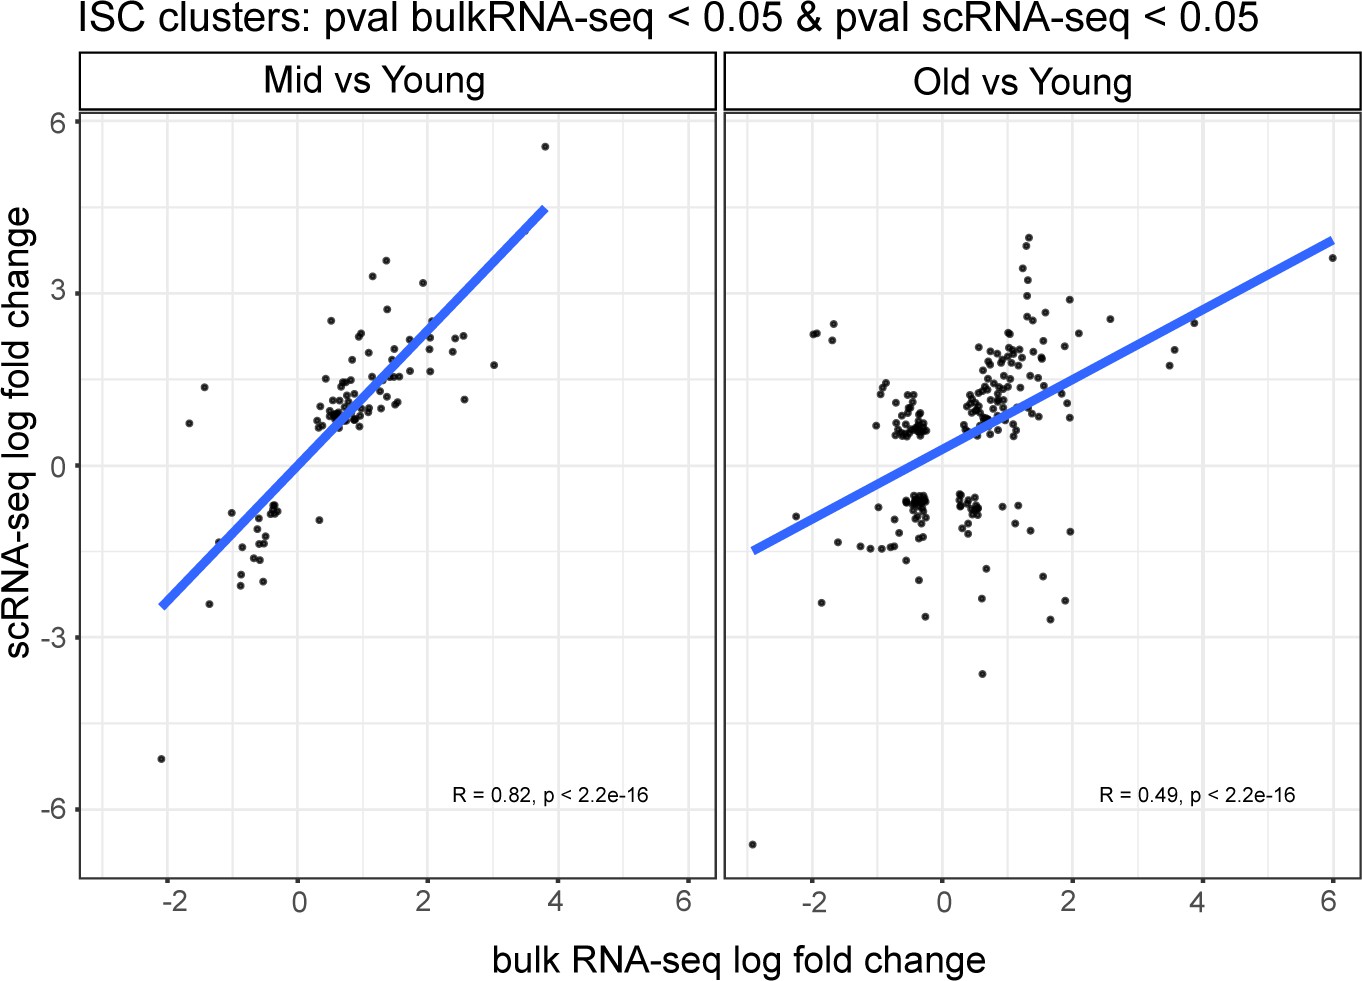
Comparison of genetic changes during aging in scRNA-seq ISCs with bulk RNA-seq.
Correlation of pseudo bulk RNA-seq analysis on combined ISC clusters # 1, 3, and 4 (y-axis) and bulk RNA-seq (x-axis) in ‘Mid-aged vs Young’ and ‘Old vs Young’ comparisons.
Figure 2—figure supplement 3

Differentially regulated genesets from bulk RNAseq are enriched in scRNA-seq analysis.
(A,B) Pseudo bulk analysis and GSEA for individual scRNA-seq cluster comparing differences between mid-aged vs young (A) and old vs young cells (B). GSEA was performed using genesets that were significantly up- or down-regulated in the bulk RNA-seq for either the mid vs young (A) and old vs young (B) comparisons. NES: Normalized Enrichment Score.
Figure 2—figure supplement 4
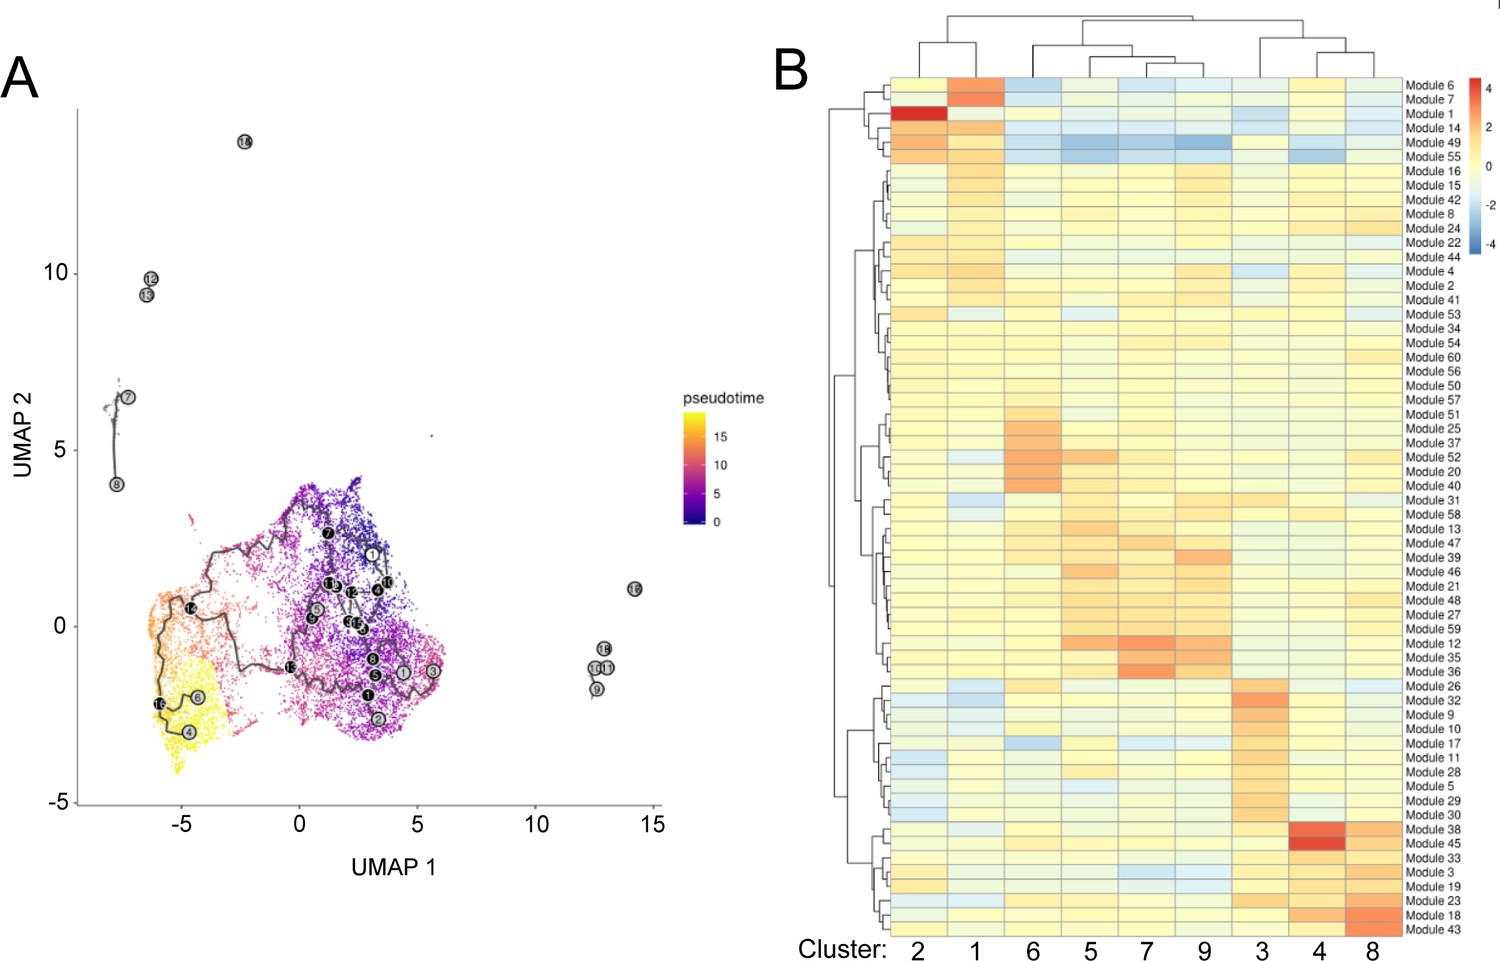
Pseudotime and trajectory analysis of single-cell RNA-seq data from aging ISCs.
(A) Trajectory analysis as a function of pseudotime. White circle - roots of the trajectory (beginning of the process - in our case young cells). Black circles - indicate branch nodes, in which cells can travel to one of several outcomes. Gray circle - leaf, corresponds to a different outcome (i.e. cell fate) of the trajectory. (B) Heatmap of gene ‘Modules’ representing genes that are differentially expressed through the trajectory and enrichment of these modules in each cluster.
Figure 2—figure supplement 5
Gene trajectory analysis of Cluster 4.
Detailed analysis of Cluster 4 gene expression trajectory modules from Cluster 1 young ISCs with a focus on genes that become upregulated. Genes indicated for modules boxed in gray are also upregulated in bulk RNA-seq of old ISCs. Cells are colored by relative scaling of gene expression to the maximum expression of a given gene.
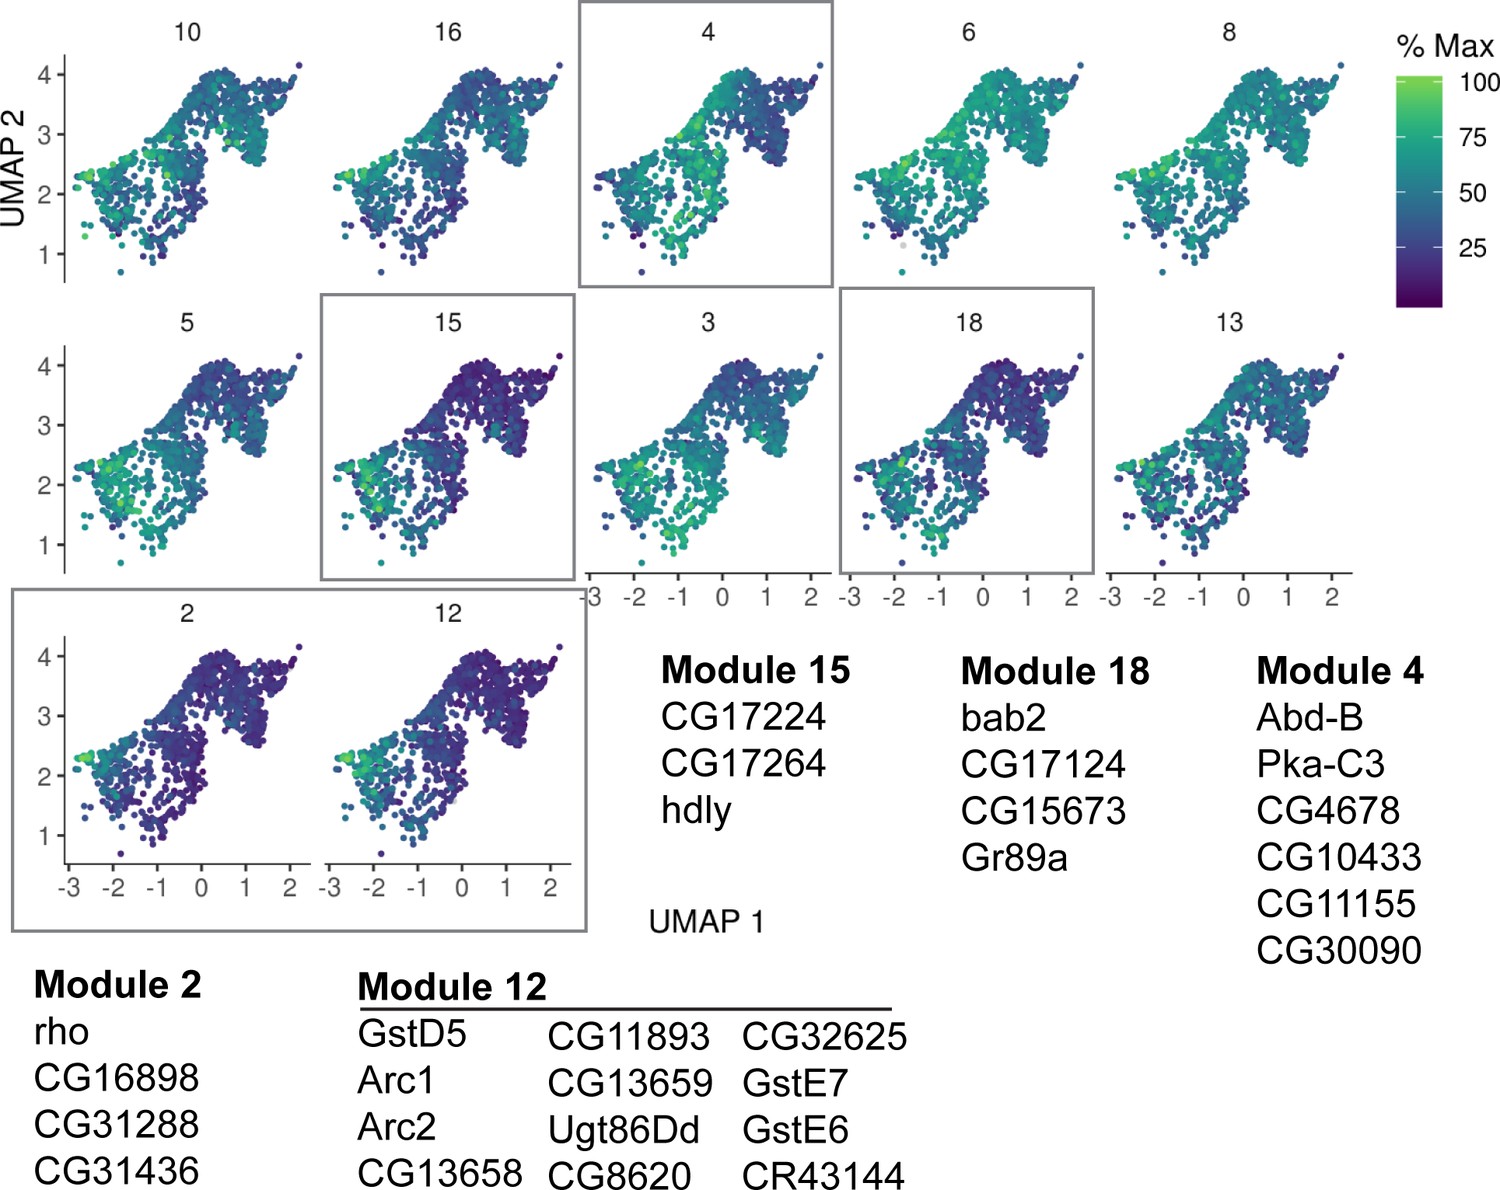
Figure 2—figure supplement 6
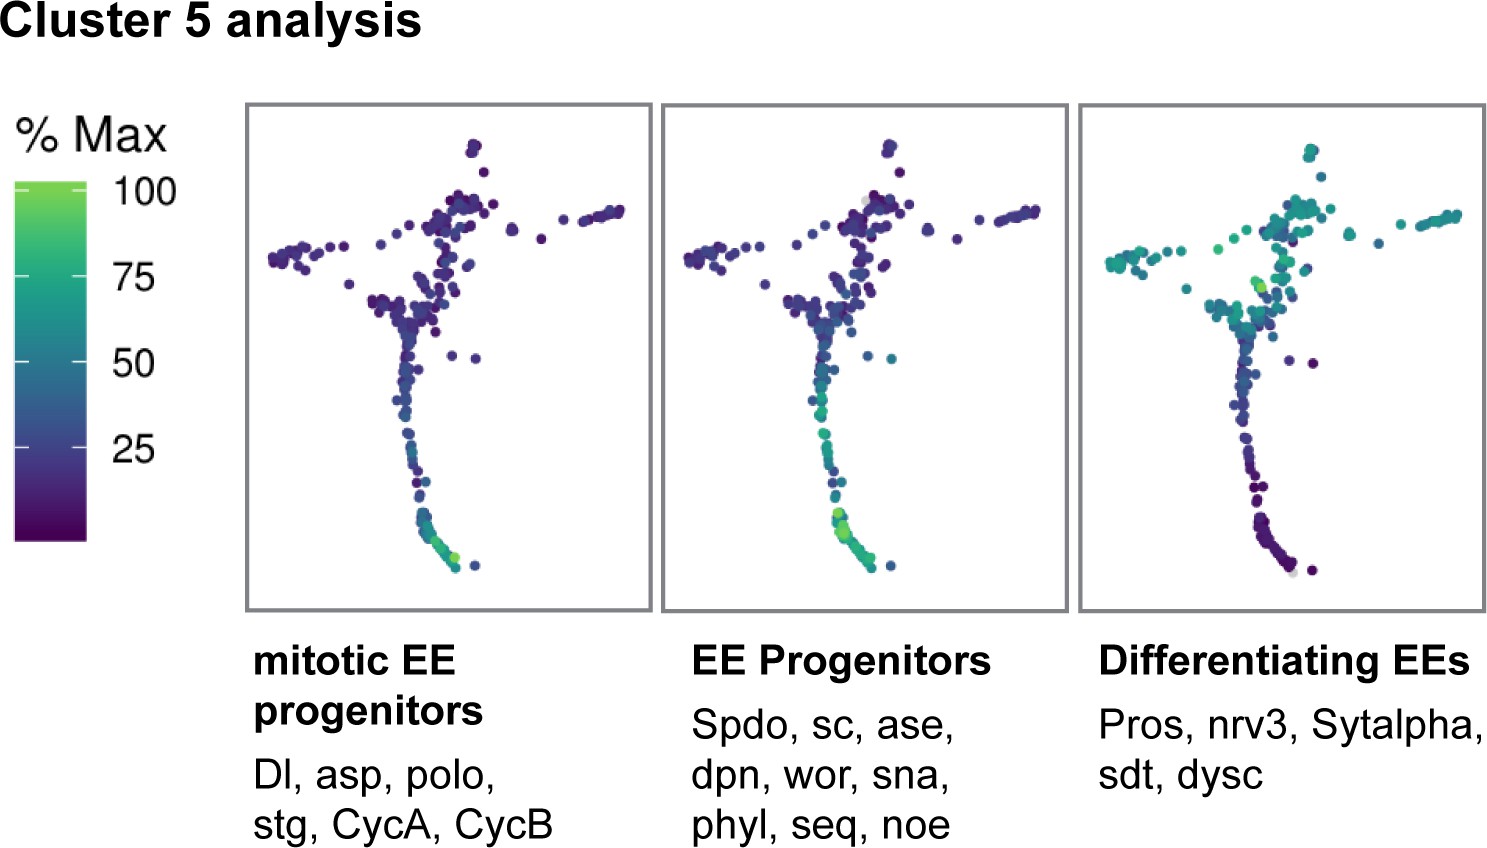
Gene trajectory analysis of Cluster 5.
Gene expression trajectory modules for Cluster 5 depicting co-regulated genes that change during differentiation from mitotic EE progenitors to differentiated EEs. Cells are colored by relative scaling of gene expression to the maximum expression of a given gene.
Figure 2—figure supplement 7
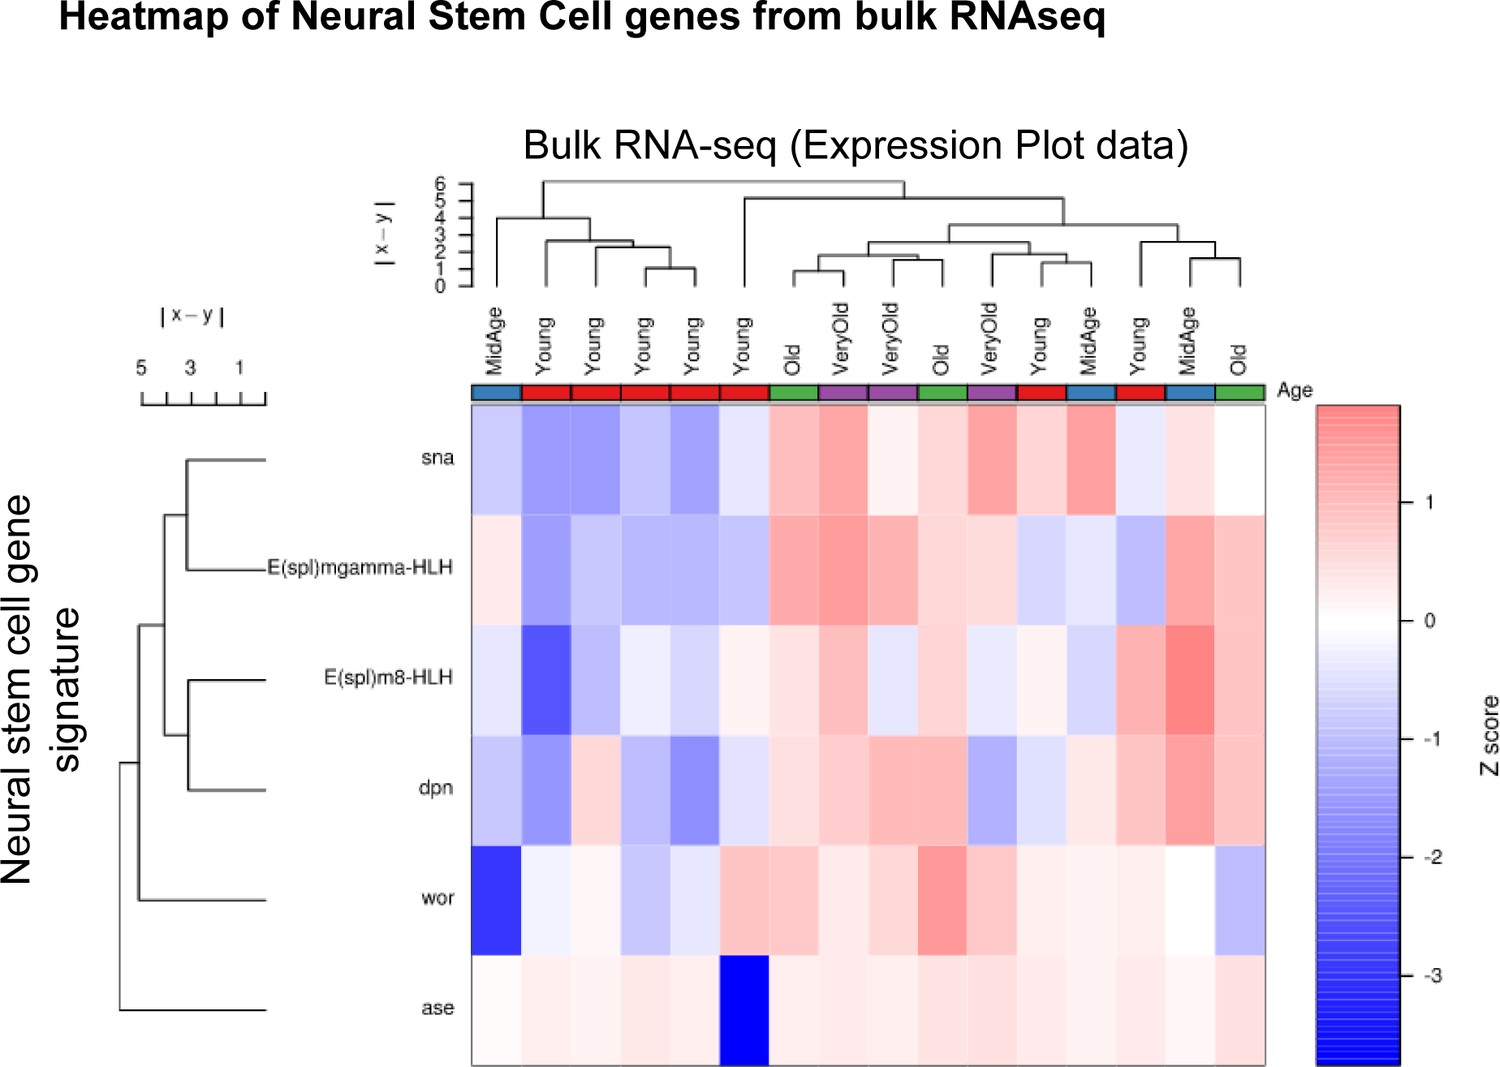
Neural stem cell gene signature is upregulated in old ISCs.
Heatmap of neural stem cell (NSC) gene expression in ISC bulk RNA-seq samples of all ages. Note the separation of young and aged sample and the upregulation of NSC genes in old ISCs.
Figure 3
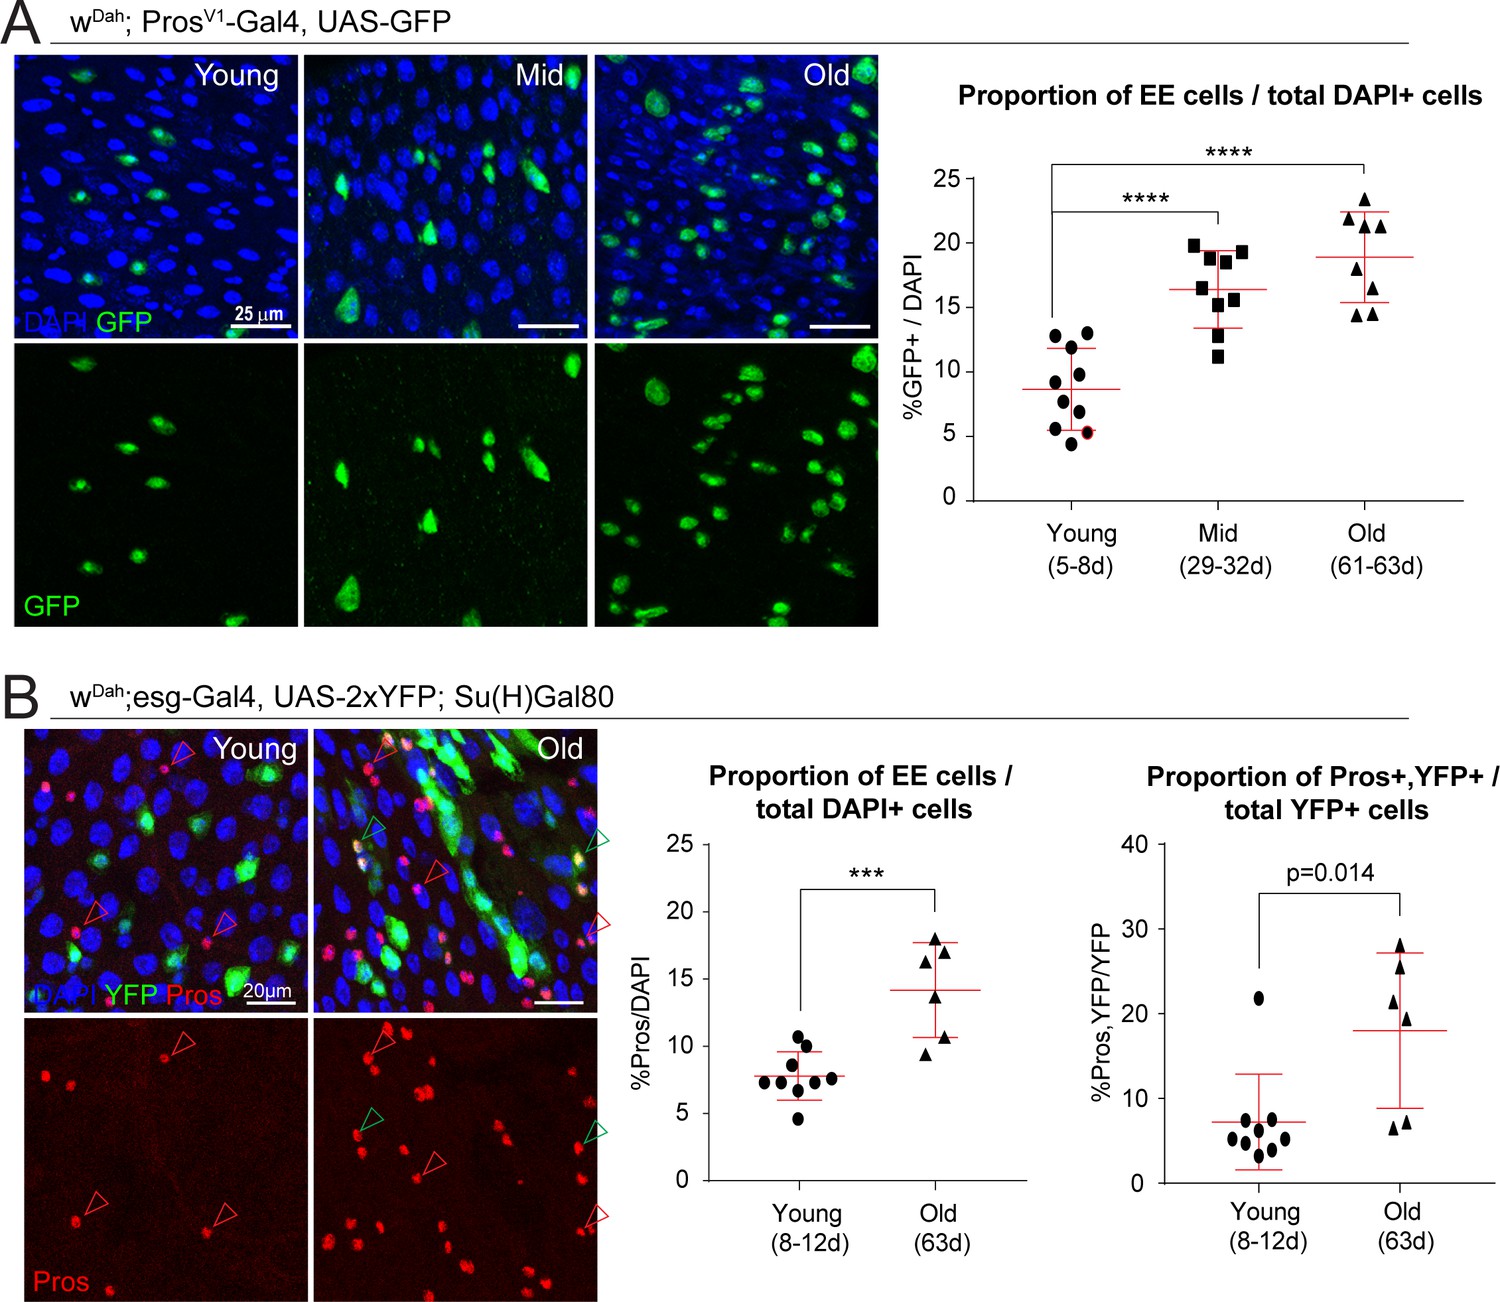
The proportion of EE cells and EE progenitors increases during aging.
(A) Confocal images showing fluorescent immunohistochemistry on posterior midguts of young, mid-age, and old flies (ages indicated) showing the expression of GFP driven by the Pros promoter (green, marking EEs) and DAPI (blue). Quantification of the EEs as a percentage of total DAPI cells during aging is shown on the right. One-way ANOVA followed by Dunnett’s multiple comparisons test: ****, p<0.0001. Young: n = 10, N = 3; Mid: n = 9, N = 2; Old: n = 8, N = 3. (B) Staining of young and old posterior midguts for YFP (green, marking ISCs), Pros (red), and DAPI (blue). Arrowheads point to Pros+ EEs (red) or Pros/YFP+ EE progenitors (green). Quantification of the proportion of EEs as a percentage of total DAPI cells as well as the proportion of EE progenitor cells as a percentage of total YFP+ ISCs are shown on the right. Two-tailed t-test: ***, p=0.0005. Young: n = 9, N = 3; Old: n = 6, N = 3. n: number of posterior midguts analyzed; N: number of independent experiments performed with similar results and a similar n. Data represented as mean ± SD.
Figure 4 with 3 supplements

The polycomb repressor complex regulates H3K27 methylation and is required for EE cell differentiation.
(A) Fluorescent immunohistochemistry on young and old posterior midguts showing ISC-specific expression of YFP (green) as well as Pros (red, marking EEs), H3K27me2 (white) and DAPI (blue). Note the higher intensity of H3K27me2 in EEs compared to other cell types in young samples and the increased H3K27me2 intensity in old ISCs (insets represent zoomed images highlighted by yellow dotted box. ISC: green arrowheads; EE: red arrowheads). The ratio of H3K27me2 intensity of ISCs (YFP+) over EEs (Pros+) in young and old specimens is quantified on the right. Two-tailed t-test: ***, p=0.0002. Young: n = 8, N = 3; Old: n = 6, N = 3. Differential histone post translational modification analysis of whole tissue young and old midguts is shown in Figure 4—figure supplement 1. (B) Clonal analysis using the esg-F/Ots comparing control mcherry-RNAi to E(z)-RNAi clones or mcherry-RNAi to Pc-RNAi clones at 10 days of RNAi expression. Clones are marked with GFP (green) and samples were also stained for Pros (red), H3K27me2 (white) and DAPI (blue). Note the lower intensity of H3K27me2 in E(z)-RNAi clones. The number of clones that have at least one Pros+ cell as a percentage of all clones per view for E(z)-RNAi and Pc-RNAi are quantified on the right. One-way ANOVA followed by Dunnett’s multiple comparisons: *, p=0.0265; **, p=0.0089; ****, p<0.0001. mcherry-RNAi: n = 7; E(z)-RNAi (BL33659): n = 7; E(z)-RNAi (BL36068): n = 7; mcherry-RNAi: n = 8; Pc-RNAi (BL33622): n = 7; Pc-RNAi (BL36070): n = 6, N = 1. Knockdown or either Pc or E(z) minimally affects ISC proliferation upon bacterial challenge (Figure 4—figure supplement 2). (C) Pros staining of esg-F/Ots clones expressing either control (w-RNAi) or an RNAi against trx for 6 days. Animals heterozygous for the trxE2 mutation have more Pros+ EE cells as is shown in images of control (FRT82B) and trx (trxE2, FRT82B) midguts stained with Pros (red). The number of Pros+ EE cells for control and trxE2 midguts is quantified on the right. Two-tailed t-test: ****, p<0.0001. FRT82B: n = 12; trxE2: n = 18. n: number of posterior midguts analyzed; N: number of independent experiments performed with similar results and a similar n. Data represented as mean ± SD. Quantification of ISC proliferation after loss of trx is shown in Figure 4—figure supplement 3.
Figure 4—figure supplement 1

Histone post-translational modification (PTM) analysis on young and old whole midguts.
(A) Results from the histone panel analysis (Active Motif) showing histogram plots of the ratios of the PTM relative to H3. (B) Table showing percent changes of PTMs in old midguts compared to young. Statistically significant changes (t-Test, 95% confidence interval) are highlighted in red type. Note the significant increase in H3K27me2.
Figure 4—figure supplement 2
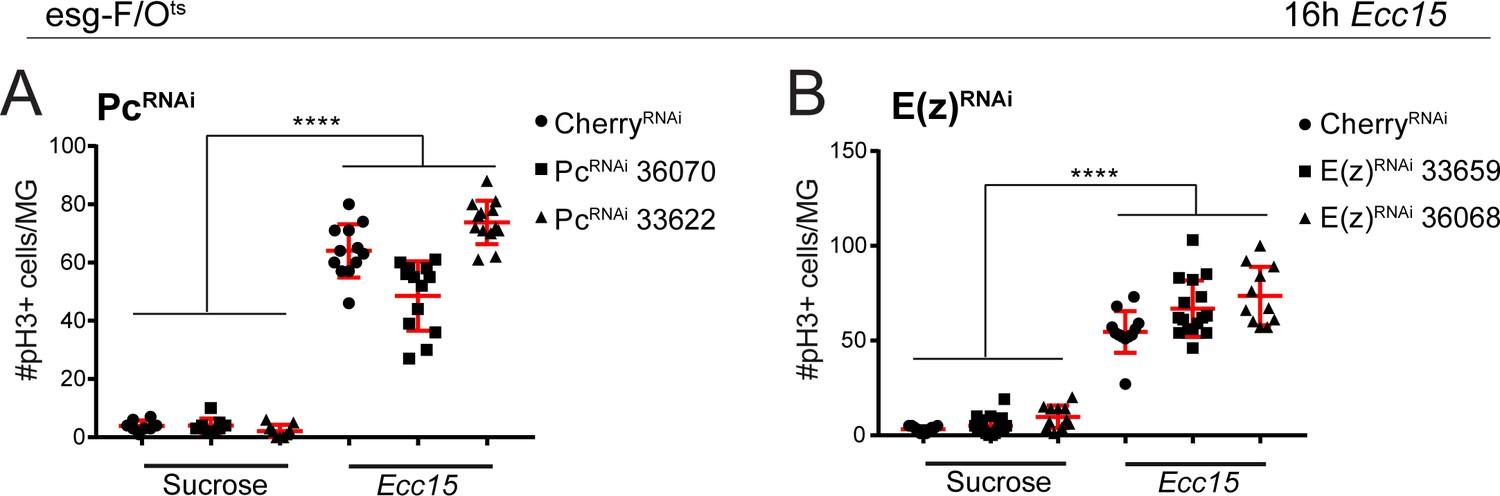
Quantification of ISC proliferative response after Ecc15 challenge upon loss of Pc or E(z).
(A,B) Quantification of the number of phospho-histone H3 (pH3) positive cells per whole midgut after 16 hr of mock (sucrose) or Ecc15 treatment after knocking down either Pc (A) or E(z) (B) using esg-F/Ots. 1-way ANOVA followed by Tukey’s multiple comparisons test: ****, p<0.0001. Sucrose: mcherry-RNAi: n = 8; Pc-RNAi (BL36070): n = 9; Pc-RNAi (BL33622): n = 9; Ecc15: mcherry-RNAi: n = 12; Pc-RNAi (BL36070): n = 13; Pc-RNAi (BL33622): n = 13; N = 2. Sucrose: mcherry-RNAi: n = 11; E(z)-RNAi (BL33659): n = 19; E(z)-RNAi (BL36068): n = 11; Ecc15: mcherry-RNAi: n = 12; E(z)-RNAi (BL33659): n = 16; E(z)-RNAi (BL36068): n = 11; N = 1. n: number of posterior midguts analyzed; N: number of independent experiments performed with similar results and a similar n. Data represented as mean ± SD.
Figure 4—figure supplement 3
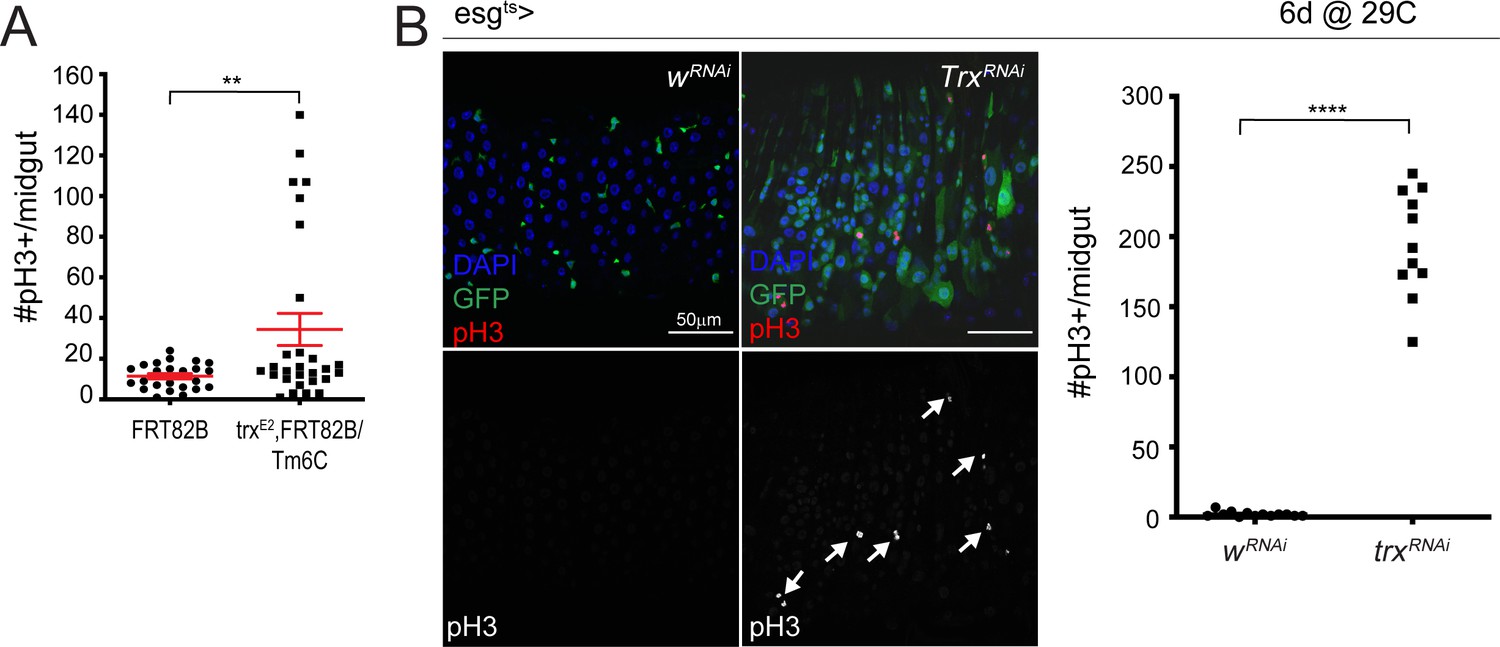
Loss of Trithorax results in increased ISC proliferation.
(A) Quantification of the number of pH3+ cells/midgut for control FRT82B and trxE2 midguts. Two-tailed t-test with Welch’s correction: **, p=0.0078. FRT82B: n = 24; trxE2: n = 28; N = 1. (B) Expression of trx RNAi for 6 days using esg-Gal4ts, UAS-GFP. Arrows indicate mitotic cells. Quantification of the number of pH3+ cells/midgut for control w-RNAi and trx-RNAi expressing midguts are shown on the right. Two-tailed t-test: ****, p<0.0001. w-RNAi: n = 13; trx-RNAi: n = 11; N = 1. n: number of posterior midguts analyzed; N: number of independent experiments performed with similar results and a similar n.
Figure 5 with 3 supplements
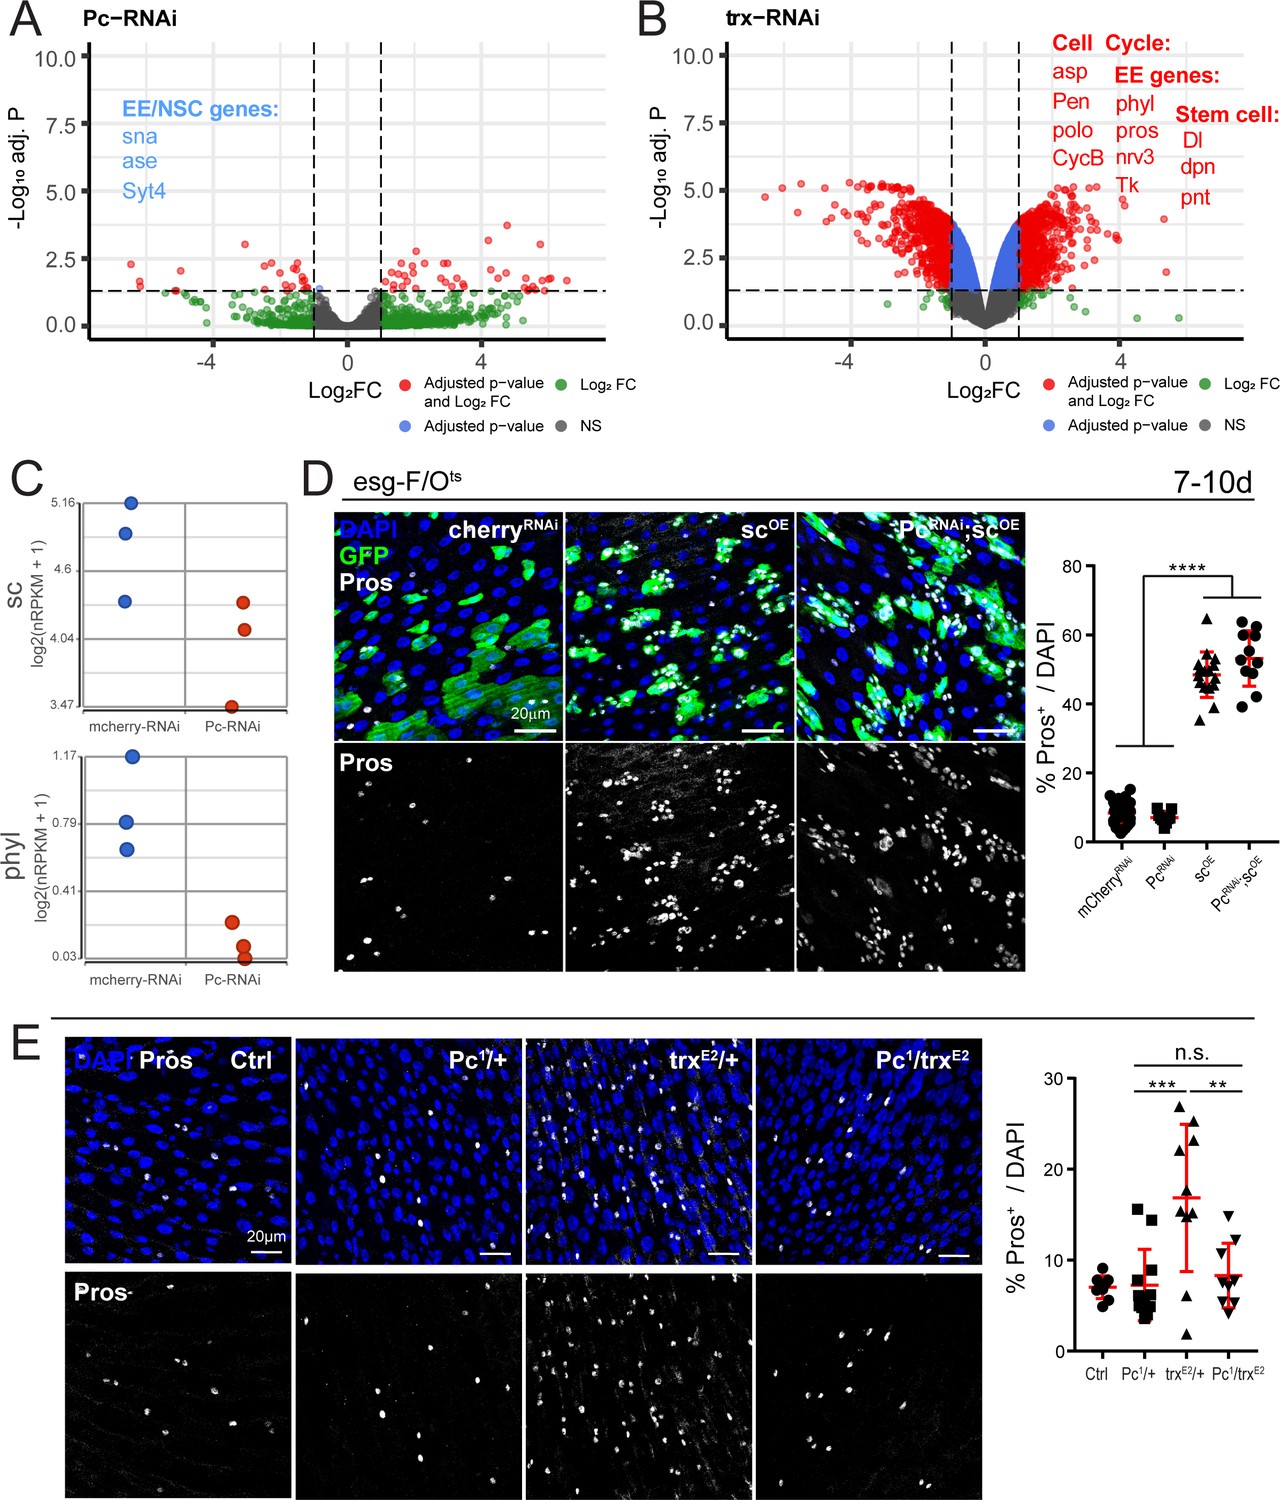
Polycomb and trithorax regulate key EE differentiation genes.
(A,B) Volcano plot showing significantly differentially regulated genes after Pc (A) or trx (B) knockdown in ISCs. Genes highlighted in blue or red are significantly down- or upregulated, respectively (see also Supplementary file 5). GSEA was performed on the differentially regulated genes, shown in Figure 5—figure supplement 1. Promoter accessibility after Pc knockdown was assessed by ATAC-seq (Figure 5—figure supplement 3, Table 6). (C) Expression values of key EE specification genes sc and phyl decreases after Pc-RNAi expression. The increase in EC genes is depicted in Figure 5—figure supplement 2. (D) Overexpression of sc rescues EE loss after Pc-RNAi. Immunostaining shows esg-F/Ots clones (GFP+, green), Pros (white), and DAPI (blue). The proportion of EEs in total DAPI cells per view were quantified after 7d-10d of induction at 29°C. Note no changes in EE proportion after sc overexpression and Pc knockdown compared to sc overexpression alone. One-way ANOVA followed by Tukey’s multiple comparisons test: ****, p<0.0001. mcherry-RNAi: n = 40; Pc-RNA: n = 9; sc-OE: n = 16; Pc-RNAi; sc-OE: n = 11; N = 2. OE: overexpression. Data represented as mean ± SD. (E) Immunostaining showing Pros+ cells in Pc1 and trxE2 heterozygous mutant flies and Pc1, trxE2 trans-heterozygous mutant flies. Note that re-balancing Pc and trx transcript levels results in normal EE numbers. The proportion of EEs in total DAPI cells per view were quantified. One-way ANOVA followed by Tukey’s multiple comparisons test: ***, p=0.0003; **, p=0.003. WT control: n = 9; Pc1/+: n = 12; trxE2/+: n = 10; Pc1/trxE2: n = 9; N = 3. Data represented as mean ± SD.
Figure 5—figure supplement 1
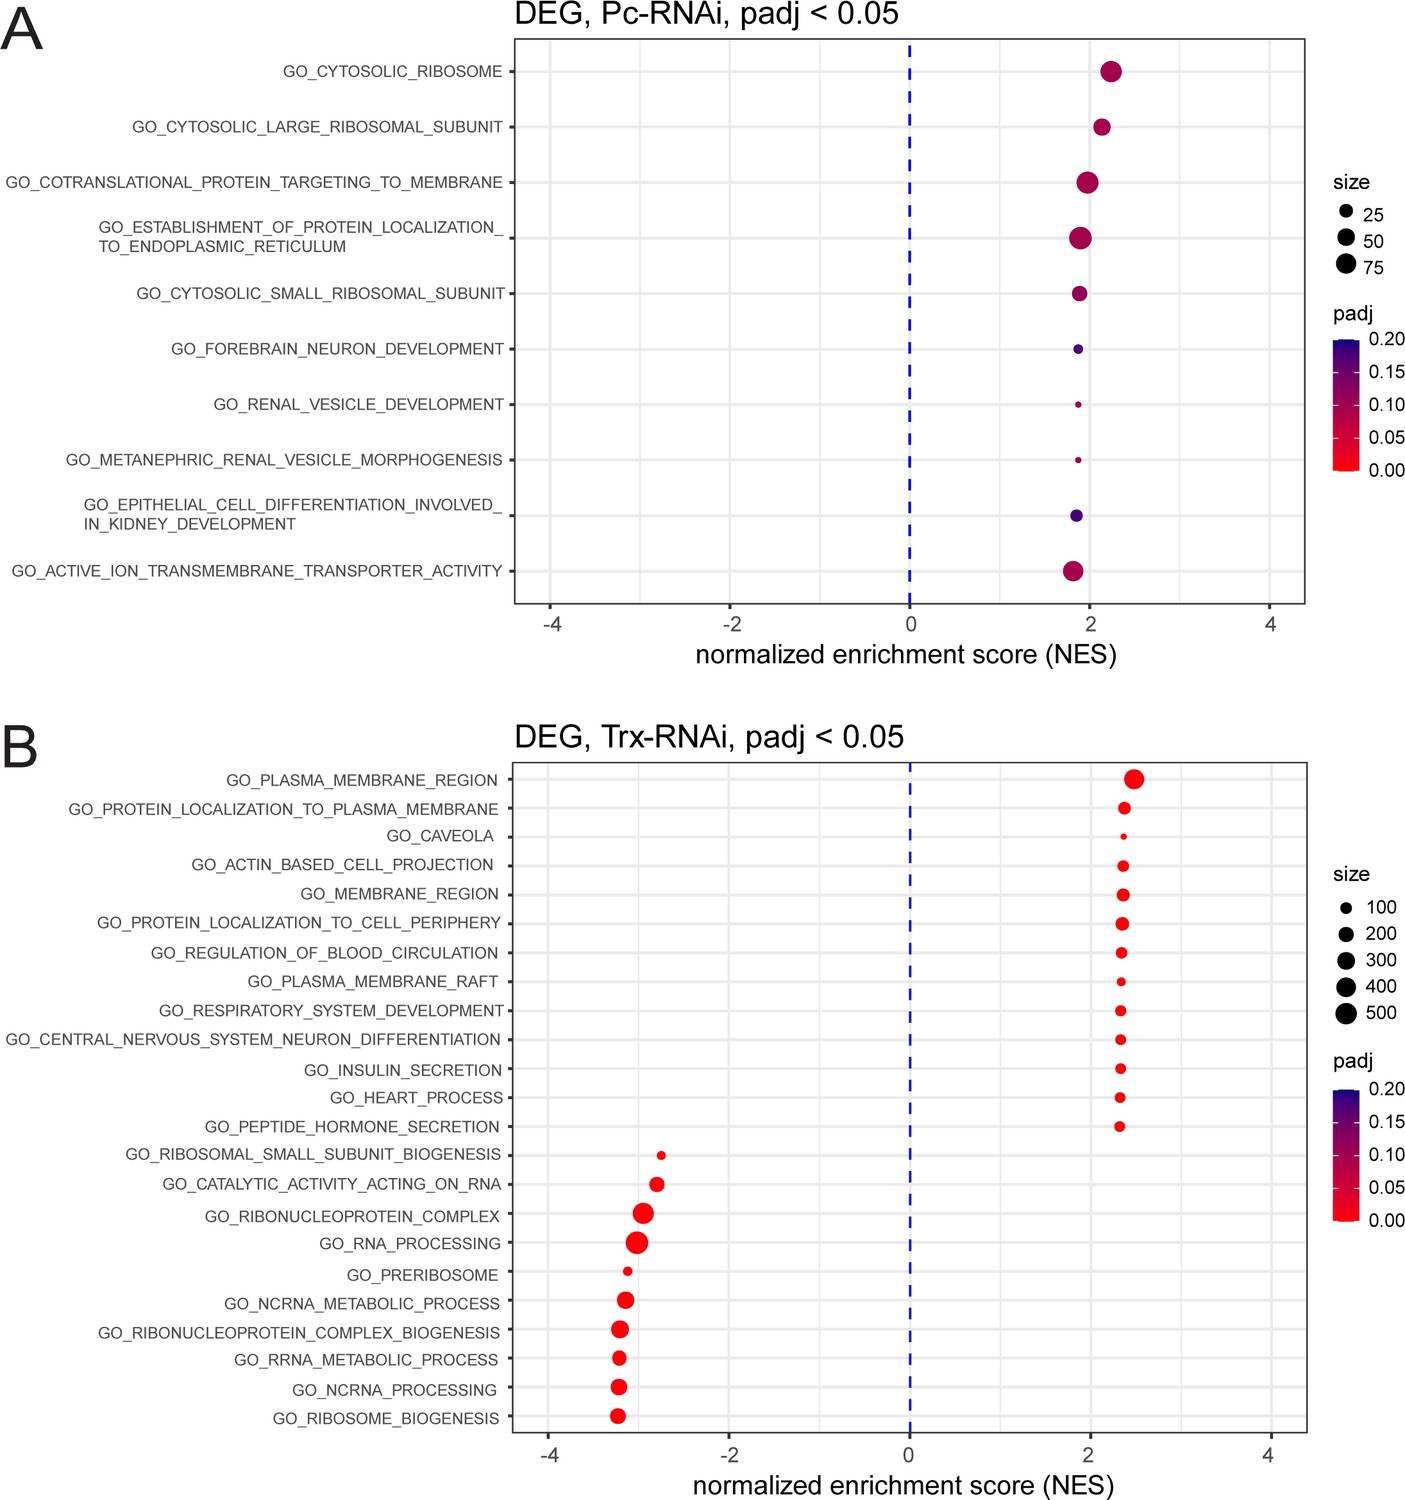
GSEA of significantly differentially regulated genes after Pc-RNAi and trx-RNAi.
(A,B) Geneset enrichment analysis showing enrichment of GO terms after Pc knockdown (A) and trx knockdown (B).
Figure 5—figure supplement 2
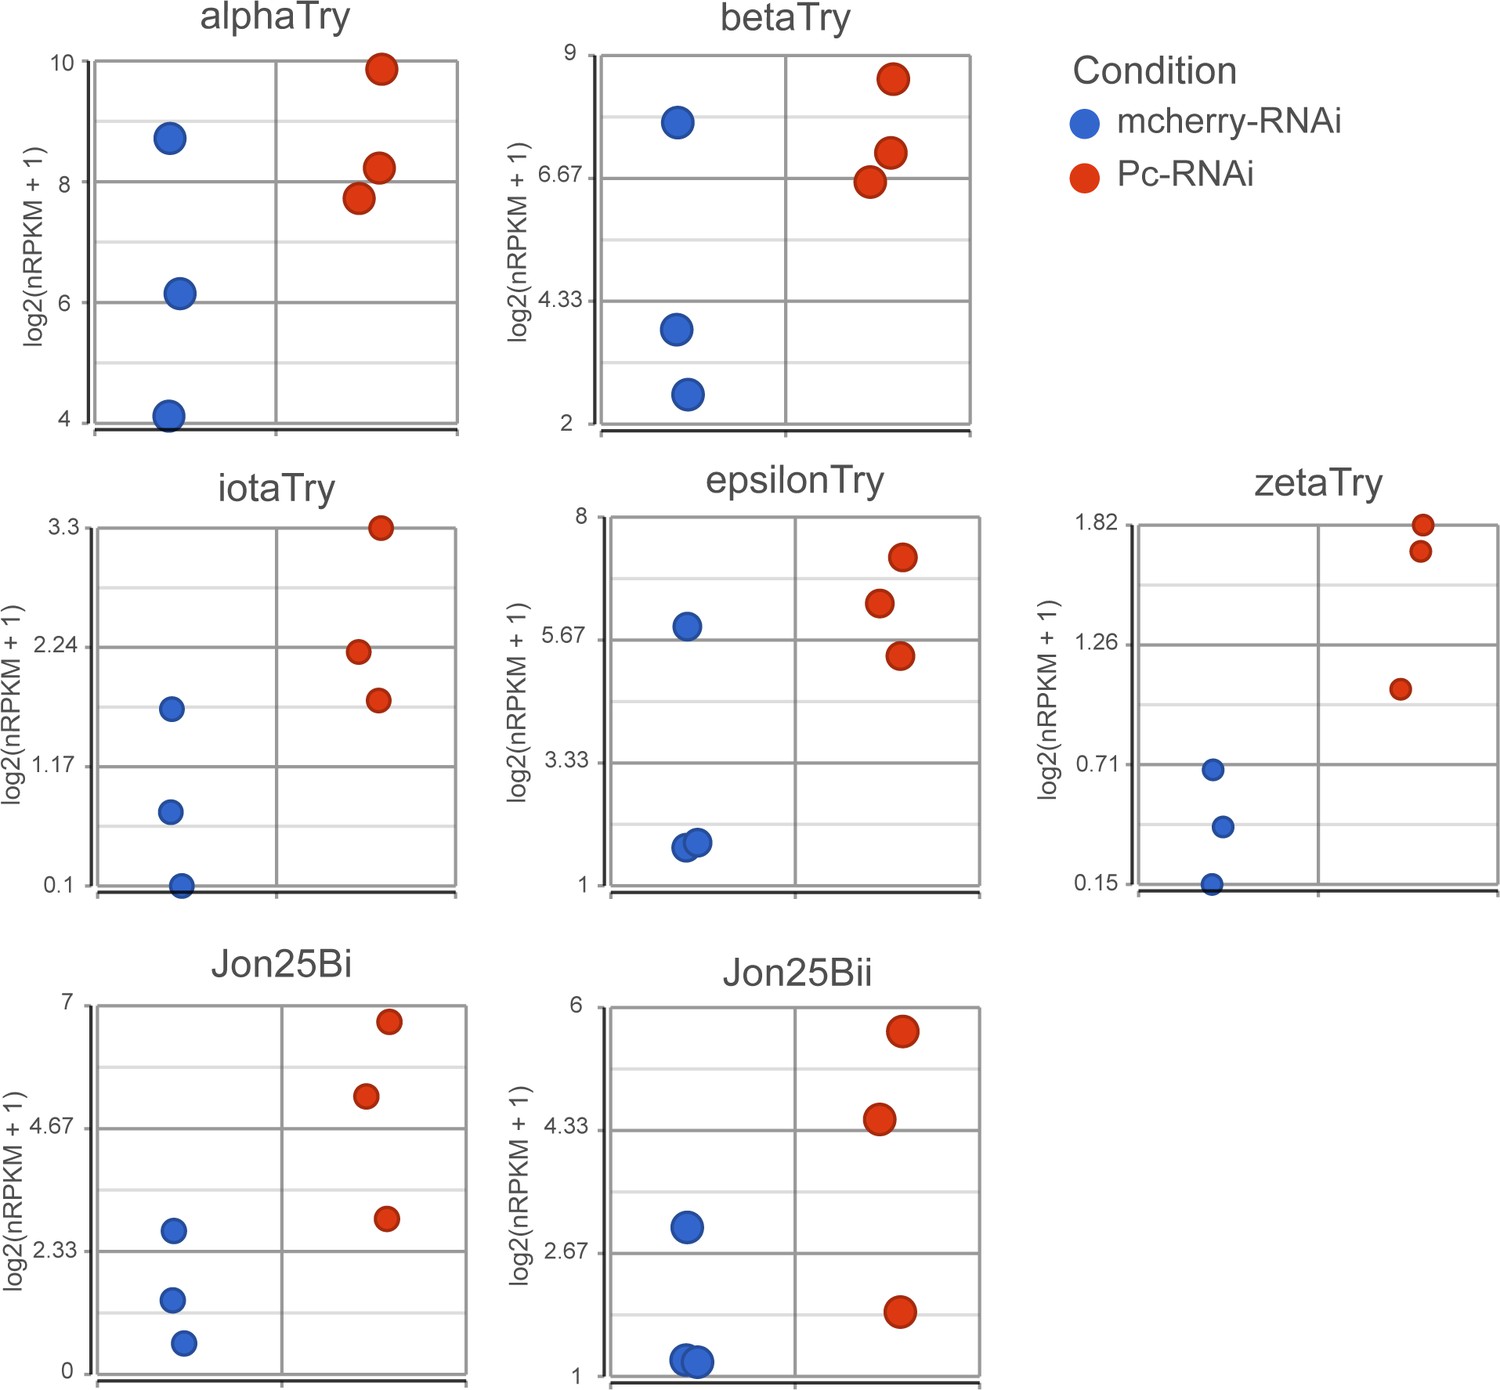
Expression of EC genes after Pc knockdown.
Expression values (log2(nRPKM+1)) of proteolytic genes after Pc-RNAi expression.
Figure 5—figure supplement 3
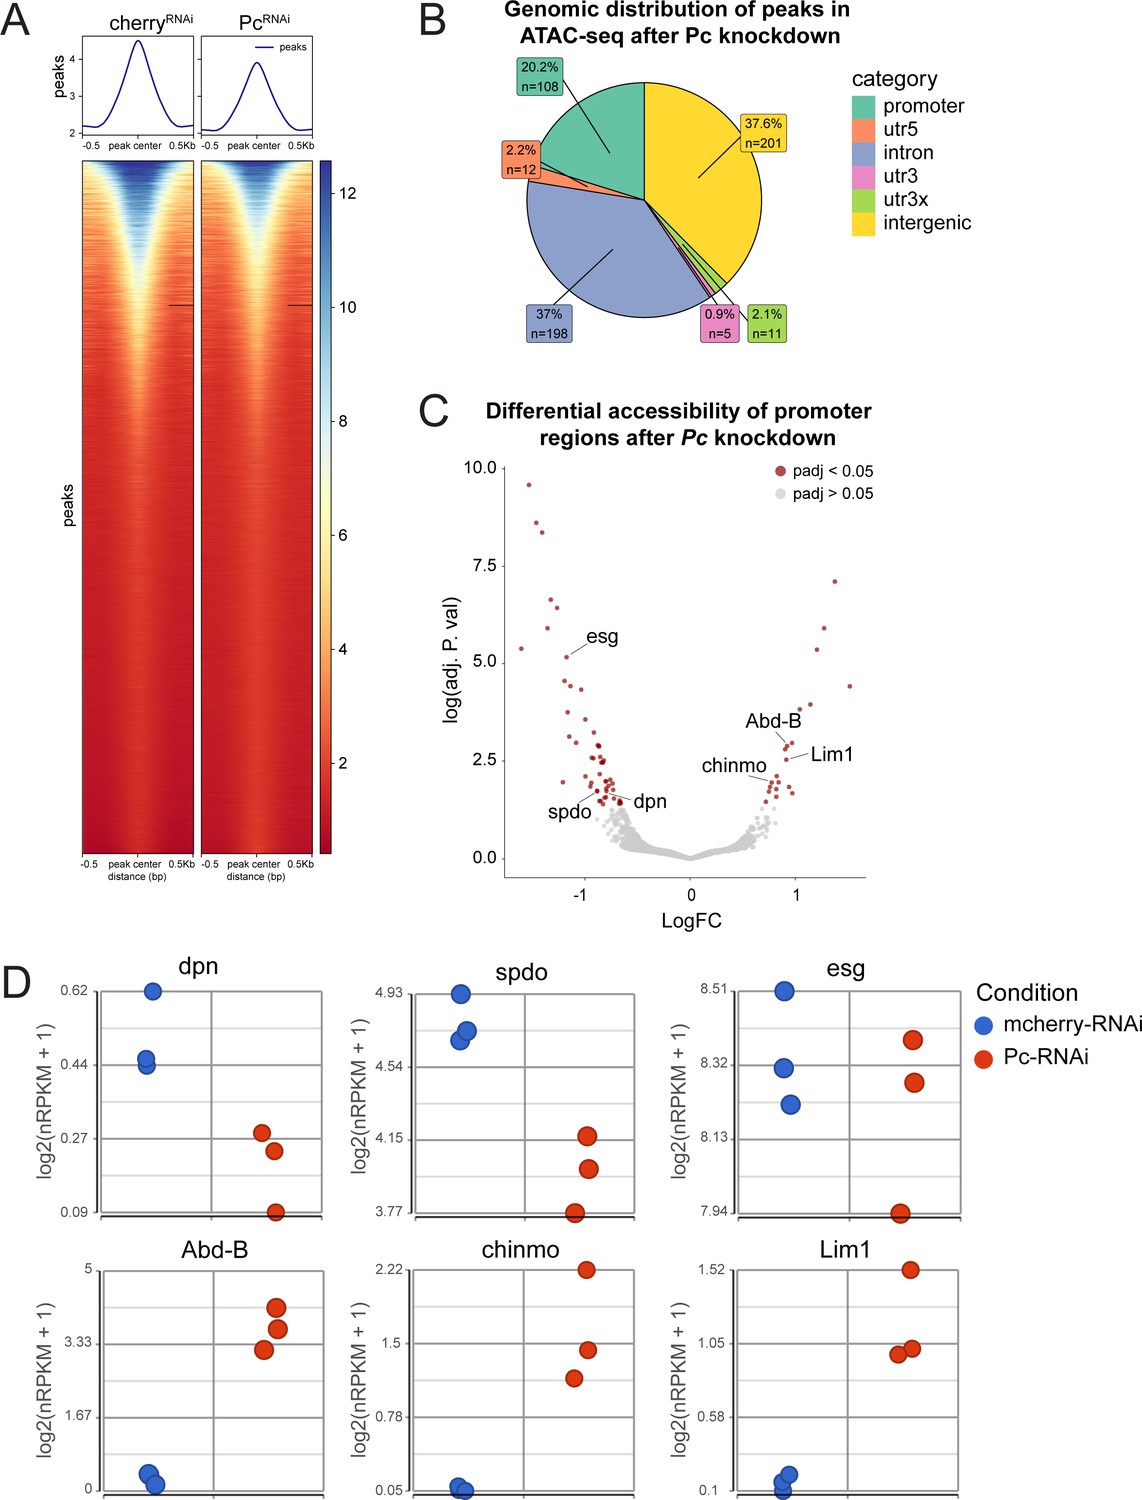
ATAC-seq of ISCs after Pc knockdown.
(A) Heatmap of average peak accessibility in control mcherry-RNAi and Pc-RNAi expressing ISCs. n = 3, n represents the number of samples containing ISCs from ~120 guts of the indicated condition (B) Genomic distribution of differentially accessible chromatin regions after Pc-RNAi knockdown. (C) Volcano plot of differentially accessible promoter regions after Pc knockdown with highlighted examples of genes with differentially accessible promoters. (D) Gene expression values from Pc-RNAi RNA-seq correlating to differentially accessible promoters depicted in (C). Of note, the downregulation of dpn, spdo and esg was not statistically significant whereas the upregulation of Abd-B, chinmo, and Lim1 was significant (refer to Supplementary file 5).
Figure 6 with 1 supplement
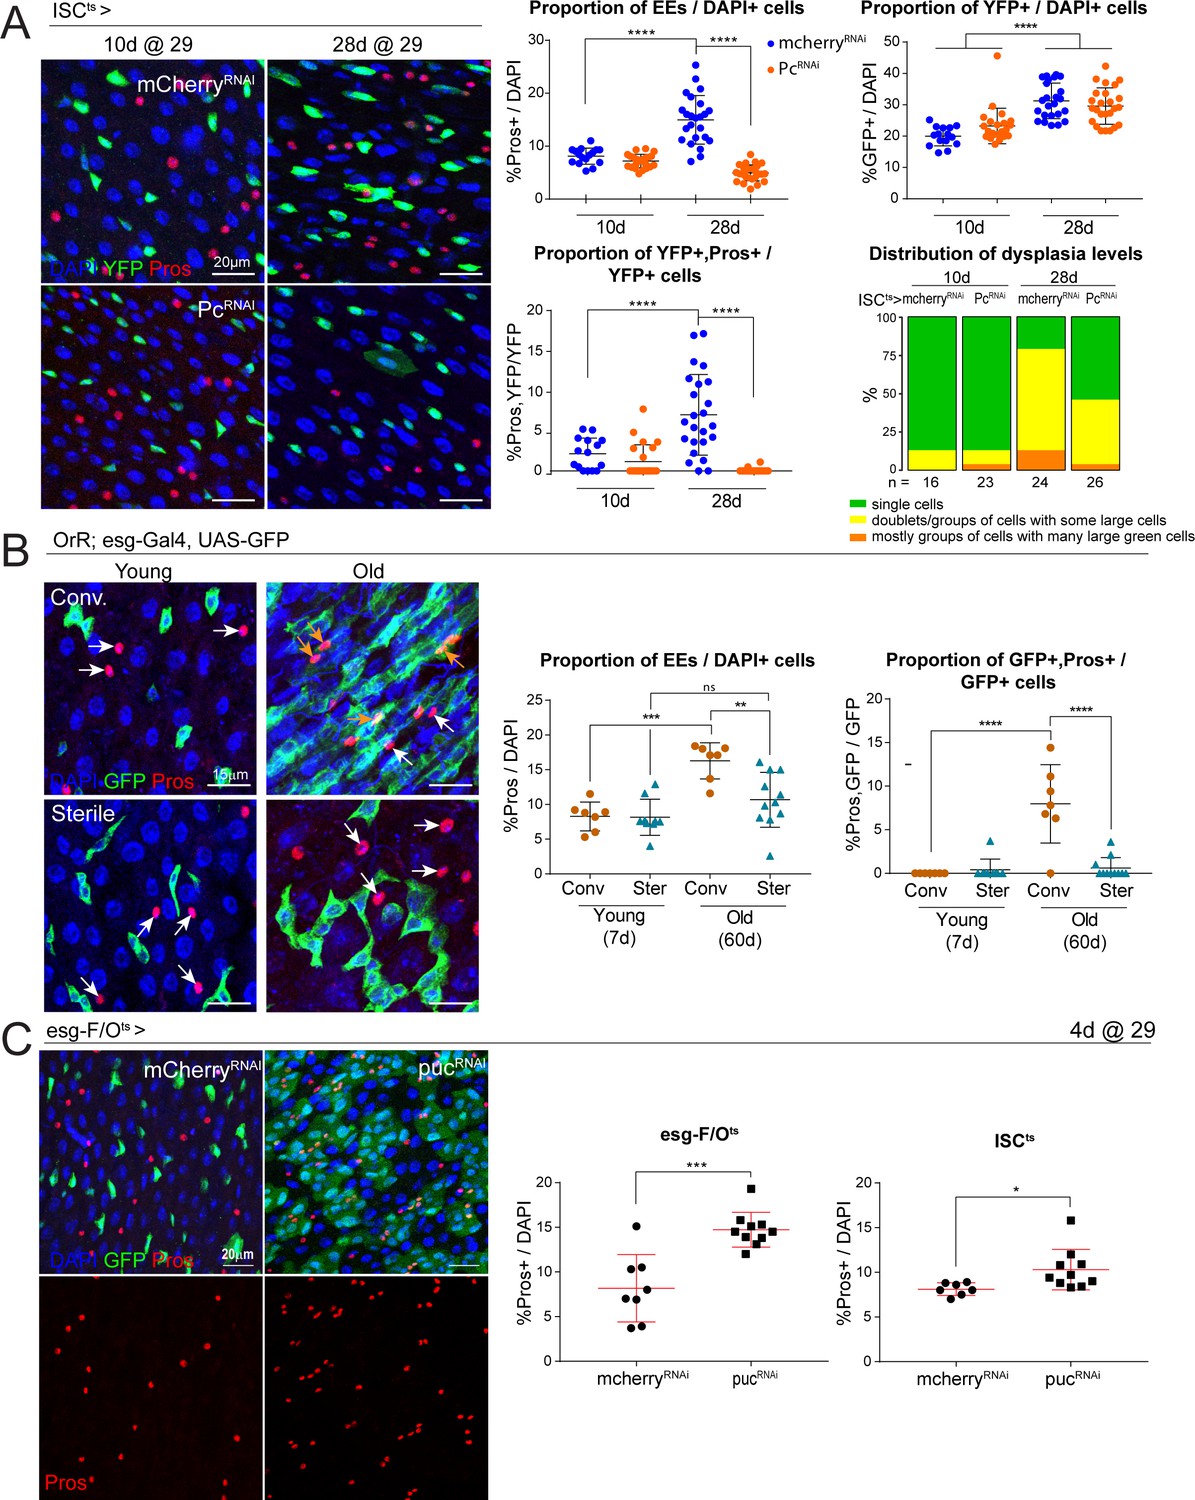
Long-term downregulation of Polycomb levels inhibits EE increase, which is elevated after stress signaling.
(A) Midguts from flies aged at 29°C for short- (10d) and long-term (28d) knockdown of Pc specifically in ISCs using the ISCts fly line. Immunostaining shows ISCs (YFP+, green), EEs (Pros+, red) and DAPI (blue). The proportion of EE cell numbers of total DAPI cells per view, as well as the proportion of EE progenitors of total ISCs per view, are quantified on the right. One-way ANOVA followed by Tukey’s multiple comparisons test: ****, p<0.0001. Distribution of dysplasia levels across short- and long-term knockdown of Pc in ISCs compared to control cherry knockdown. mcherry-RNAi (10d): n = 16; Pc-RNAi (10d): n = 23; mcherry-RNAi (28d): n = 24; Pc-RNAi (28d): n = 26; N = 1. (B) Comparison of the number of EEs in conventionally versus axenically (sterile) raised flies. Staining shows ISCs/EBs marked by GFP (green), EEs marked by Pros (red) and DAPI (blue). The proportion of EEs in total DAPI cells is quantified on the right as well as the proportion of EE progenitors in the total ISC population. Levels of dysplasia correlated with numbers of EE progenitors regardless of age (Figure 6—figure supplement 1). One-way ANOVA followed by Tukey’s multiple comparisons test: **, p=0.0033; ***, p=0.0002; ****, p<0.0001. Young, conv.: n = 7; young, sterile: n = 9; old, conv.: n = 7; old, sterile: n = 11; N = 1. (C) Immunostaining of posterior midguts after overexpression of mcherry-RNAi or puc-RNAi for 4 days using esg-F/Ots. Quantification of EE cells as a proportion of total DAPI cells per view using esg-F/Ots or ISCts to drive expression is shown on the right. Two-tailed t-test: *, p=0.0268; ***, p=0.0002. esg-F/Ots>mcherry-RNAi: n = 8; puc-RNAi: n = 10; N = 2. ISCts>mcherry-RNAi: n = 7; puc-RNAi: n = 10; N = 1. n: number of posterior midguts analyzed; N: number of independent experiments performed with similar results and a similar n. Data represented as mean ± SD.
Figure 6—figure supplement 1
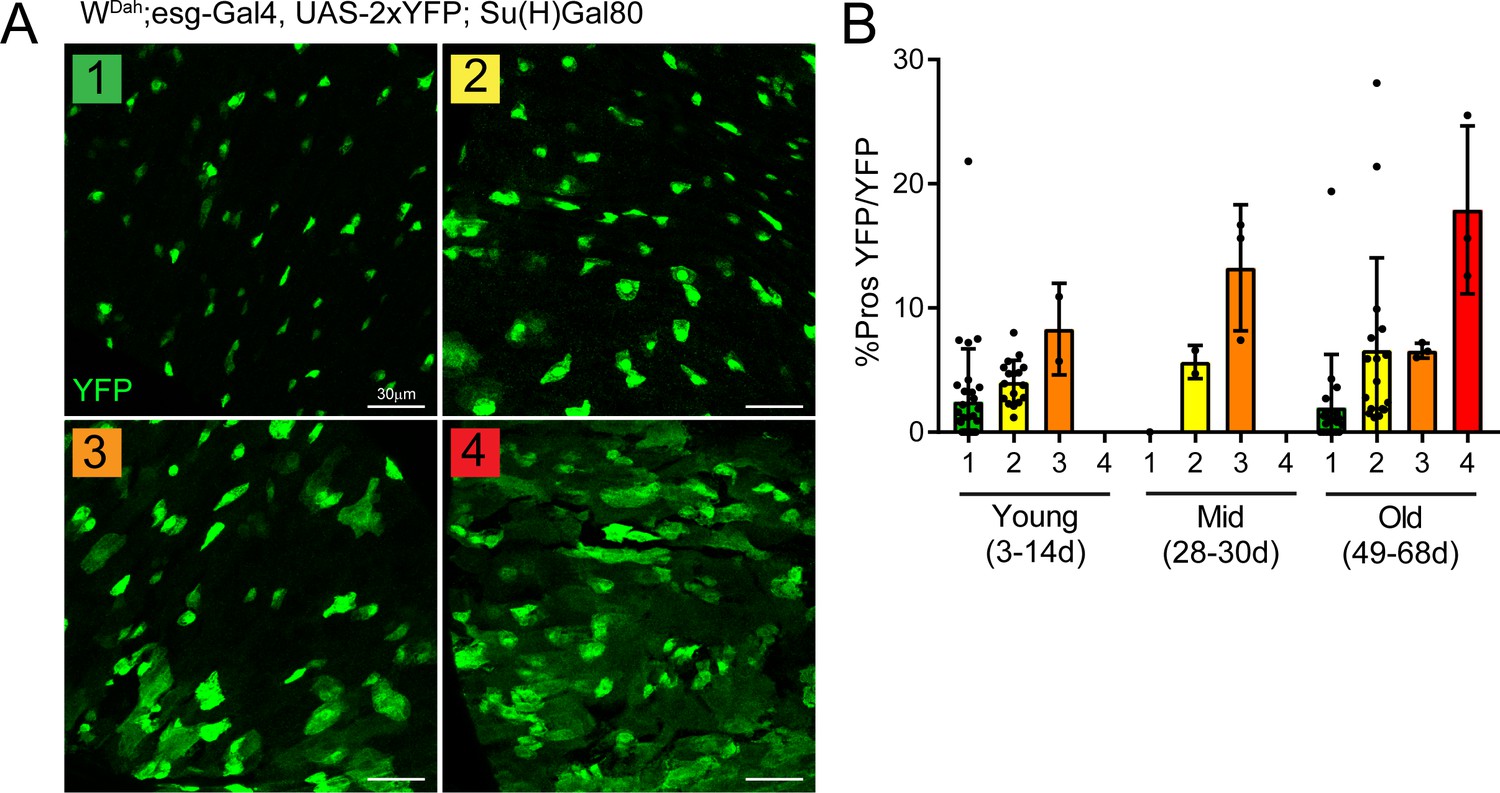
The proportion of enteroendocrine cells correlates with dysplasia levels.
(A) Qualitative categorization of dysplasia levels described as follows: (1) single YFP+ (green) cells, some doublets (2) doublets and small groups of YFP+ cells, (3) many groups of YFP+ cells with large cells interspersed and (4) many YFP+ cells that are grouped with many large cells present. (B) Quantification of the proportion of EE progenitors (double-positive Pros+/YFP+ cells) in total ISCs (YFP+) per view. Note the positive correlation between dysplasia level and proportion of EE progenitors. Young: n = 32; mid: n = 6; old: n = 33; N = 3. n: number of posterior midguts analyzed; N: number of independent experiments performed with similar results and a similar n. Data represented as mean ± SD.
Figure 7
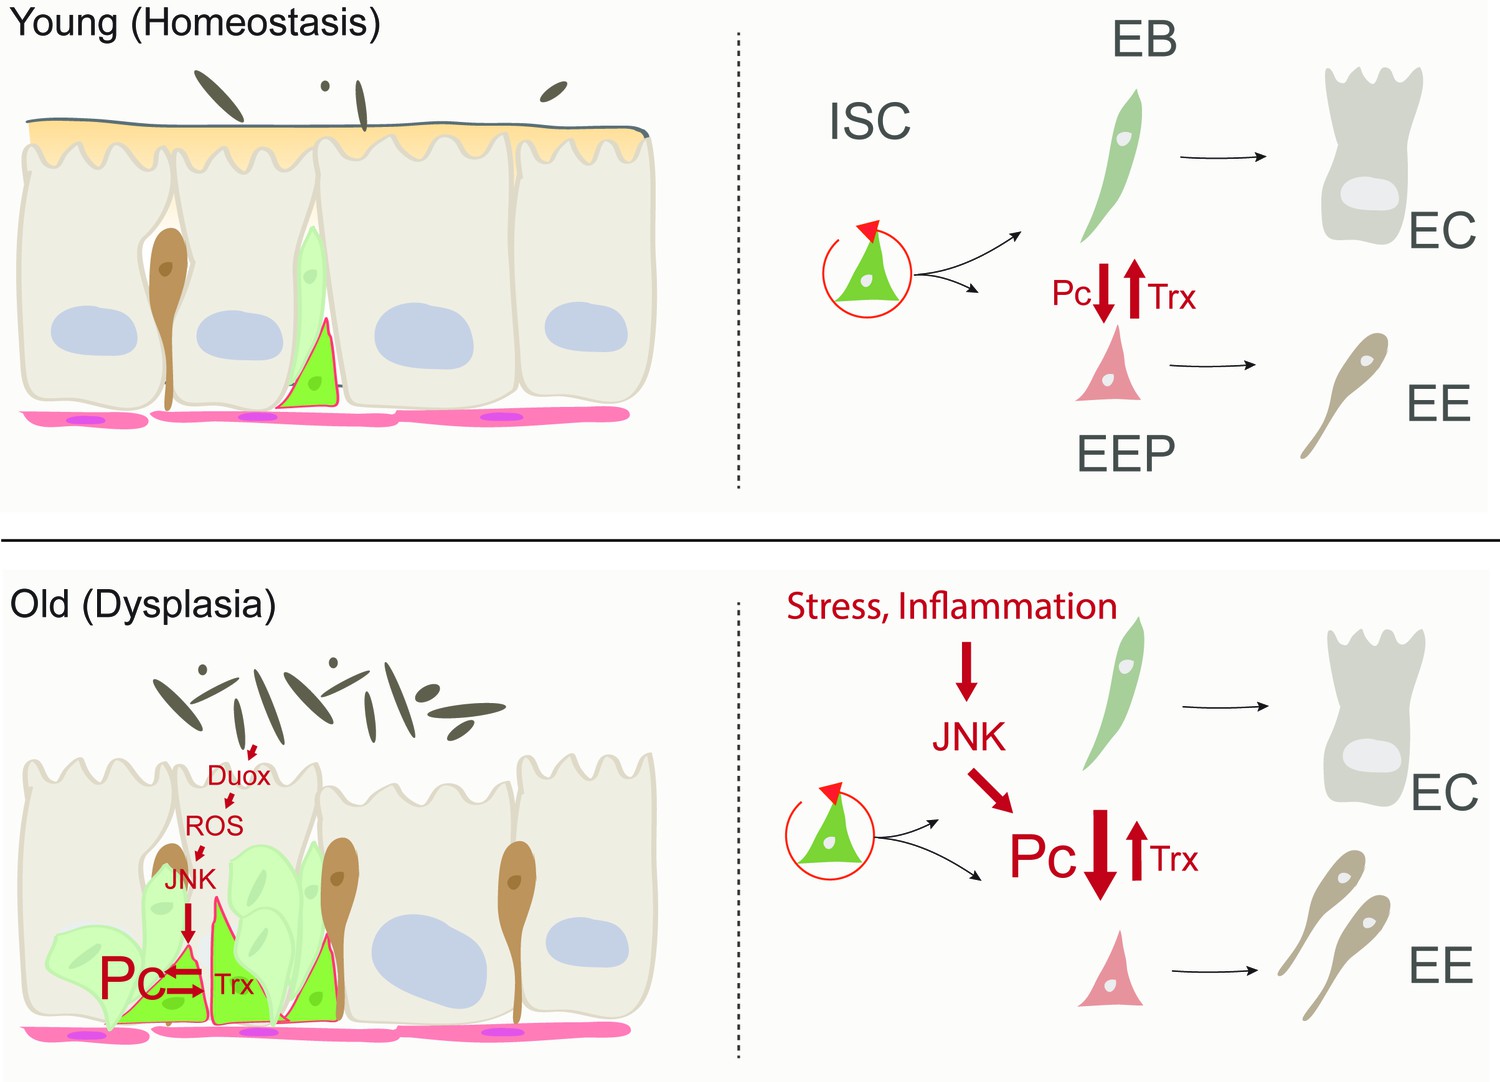
Model of age-related deregulation of ISC lineage fidelity by perturbed Polycomb and Trithorax balance.
In young flies, balanced Pc and trx activity maintain appropriate specification of ISCs into the EE or EC lineage. In old flies, elevated JNK activity in ISCs (a consequence of commensal dysbiosis – induced inflammation and ROS production) in ISCs perturbs this balance, resulting in elevated commitment into the EE lineage.
Tables
Key resources table
| Reagent type (species) or resource | Designation | Source or reference | Identifiers | Additional information |
|---|---|---|---|---|
| Genetic reagent (D. melanogaster) | UAS-mcherry-RNAi | Bloomington Drosophila Stock Center | BDSC:35785; RRID:BDSC 35785 | |
| Genetic reagent (D. melanogaster) | UAS-w-RNAi | Bloomington Drosophila Stock Center | BDSC:25785; RRID:BDSC 25785 | |
| Genetic reagent (D. melanogaster) | UAS-Pc-RNAi | Bloomington Drosophila Stock Center | BDSC:36070; RRID:BDSC 36070 | |
| Genetic reagent (D. melanogaster) | UAS-Pc-RNAi | Bloomington Drosophila Stock Center | BDSC:33622; RRID:BDSC 33622 | |
| Genetic reagent (D. melanogaster) | UAS-E(z)-RNAi | Bloomington Drosophila Stock Center | BDSC:33659; RRID:BDSC 33659 | |
| Genetic reagent (D. melanogaster) | UAS-E(z)-RNAi | Bloomington Drosophila Stock Center | BDSC:36068; RRID:BDSC 36068 | |
| Genetic reagent (D. melanogaster) | trxE2, FRT82B/Tm6C | Bloomington Drosophila Stock Center | BDSC:24160; RRID:BDSC 24160 | |
| Genetic reagent (D. melanogaster) | FRT82B | Bloomington Drosophila Stock Center | BDSC:2051; RRID:BDSC 2051 | |
| Genetic reagent (D. melanogaster) | Pc1/TM1 | Bloomington Drosophila Stock Center | BDSC:1728; RRID:BDSC 1728 | |
| Genetic reagent (D. melanogaster) | UAS-eGFP | Bloomington Drosophila Stock Center | BDSC:6874; RRID:BDSC 6874 | |
| Genetic reagent (D. melanogaster) | OregonR | Bloomington Drosophila Stock Center | BDSC:5; RRID:BDSC 5 | |
| Genetic reagent (D. melanogaster) | UAS-trx-RNAi | Vienna Drosophila Resource Center | Transformant ID: GD37715 | |
| Genetic reagent (D. melanogaster) | UAS-puc-RNAi | Vienna Drosophila Resource Center | Transformant ID: GD3018 | |
| Genetic reagent (D. melanogaster) | UAS-sc-3HA | Fly ORF | F000085 | |
| Genetic reagent (D. melanogaster) | ProsV1-Gal4 | Grosjean et al., 2001 | N/A | J. Korzelius |
| Genetic reagent (D. melanogaster) | WDah | L. Partridge | N/A | |
| Genetic reagent (D. melanogaster) | esg-Gal4, UAS-GFP | S. Hayashi, RIKEN, Japan | N/A | |
| Genetic reagent (D. melanogaster) | esg-Gal4, UAS-2xEYFP/Cyo; Su(H)GBE-G80/TM3 | Wang et al., 2014 | N/A | S. Hou, NIH, USA |
| Genetic reagent (D. melanogaster) | esg-Gal4, UAS-2xEYFP/Cyo; Su(H)GBE-G80, tub-Gal80ts/TM3 (ISCts) | Wang et al., 2014 | N/A | S. Hou, NIH, USA |
| Genetic reagent (D. melanogaster) | w; esg-Gal4, UAS-GFP, tubGal80ts/Cyo; UAS-Flp, act>>CD2>>G4/TM6B (esg-F/Ots) | B. A. Edgar | N/A | |
| Antibody | anti-Prospero (mouse monoclonal) | DSHB | Cat# MR1A; RRID:AB_528440 | IF (1:250) |
| Antibody | anti-H3K27me2 (rabbit polyclonal) | Abcam | Cat# ab24684; RRID:AB_448222 | IF (1:500) |
| Antibody | anti-GFP (chicken polyclonal) | Abcam | Cat# ab13970; RRID:AB_300798 | IF (1:2000) |
| Antibody | anti-phospho-histone H3 (rabbit polyclonal) | Sigma-Aldrich | Cat# 06–570 RRID:AB_310177 | IF (1:1000) |
| Other | Hoechst 33342 | Thermo Fisher Scientific | Cat# 62249 | IF (1:1000) |
| Commercial assay or kit | RNeasy Mikro Kit | Qiagen | Cat# 74004 | |
| Commercial assay or kit | Nextera DNA Sample prep kit | Illumina | Cat# FC-131–1024 | |
| Commercial assay or kit | MiniElute Reaction Cleanup kit | Qiagen | Cat# 28204 | |
| Commercial assay or kit | NEBNext High-Fidelity 2X PCR Master Mix | New England Biolabs | Cat #M0541 | |
| Commercial assay or kit | Chromium Single Cell 3’ Library and Gel bead kit v2 | 10x Genomics | PN-120237 | |
| Software, algorithm | FIJI is just ImageJ (FIJI) | Schindelin et al., 2012 | RRID:SCR_002285 | https://fiji.sc/ |
| Software, algorithm | GraphPad Prism | GraphPad | RRID:SCR_002798 | https://www.graphpad.com/scientific-software/prism/ |
| Software, algorithm | Partek Flow Genomic Analysis Software | Partek | https://www.partek.com/partek-flow/ | |
| Software, algorithm | Adobe Photoshop and Illustrator | Adobe | RRID:SCR_014199; RRID:SCR_010279 | https://www.adobe.com/ |
Additional files
-
Supplementary file 1
Table of results from ATAC-seq of aging ISCs.
Related to Figure 1. Differential peak analysis between aged time-points (mid-age, old and geriatric) and young ISCs. Tabs separate age comparisons and significantly regulated peaks.
- https://cdn.elifesciences.org/articles/62250/elife-62250-supp1-v2.xlsx
-
Supplementary file 2
Table of results from bulk RNA-seq of aging ISCs.
Related to Figure 1. Differential gene expression analysis between aged time-points (mid-age, old and geriatric) and young ISCs. Tabs separate age comparisons and significantly regulated genes.
- https://cdn.elifesciences.org/articles/62250/elife-62250-supp2-v2.xlsx
-
Supplementary file 3
Table illustrating age-associated genes regulated at RNA and chromatin level.
Related to Figure 1. Significantly differentially regulated genes at mRNA and chromatin levels across aged time-points in ISCs.
- https://cdn.elifesciences.org/articles/62250/elife-62250-supp3-v2.xlsx
-
Supplementary file 4
Table outlining genes regulated in old ISCs are upregulated in old Cluster 4 cells.
Related to Figures 1 and 2. Differentially regulated genes in old ISCs are also found in gene trajectory modules that are upregulated in Cluster 4. See also Figure 2—figure supplement 5.
- https://cdn.elifesciences.org/articles/62250/elife-62250-supp4-v2.xlsx
-
Supplementary file 5
Table of results from Pc-RNAi and trx-RNAi RNA-seq.
Related to Figure 5. Differential gene expression analysis after Pc-RNAi and trx-RNAi. Tabs separate Pc-RNAi and trx-RNAi comparisons as well as significantly regulated genes.
- https://cdn.elifesciences.org/articles/62250/elife-62250-supp5-v2.xlsx
-
Supplementary file 6
Table of Pc-RNAi ATAC-seq differential peak analysis.
Related to Figure 5. Significantly differentially regulated peak in promoter regions after Pc-RNAi in ISCs.
- https://cdn.elifesciences.org/articles/62250/elife-62250-supp6-v2.xlsx
-
Transparent reporting form
- https://cdn.elifesciences.org/articles/62250/elife-62250-transrepform-v2.pdf
Download links
A two-part list of links to download the article, or parts of the article, in various formats.
Downloads (link to download the article as PDF)
Open citations (links to open the citations from this article in various online reference manager services)
Cite this article (links to download the citations from this article in formats compatible with various reference manager tools)
Age-related changes in polycomb gene regulation disrupt lineage fidelity in intestinal stem cells
eLife 10:e62250.
https://doi.org/10.7554/eLife.62250


