The orchestrated cellular and molecular responses of the kidney to endotoxin define a precise sepsis timeline
- Department of Medicine, Indiana University School of Medicine, United States
- Department of Pediatrics and the Herman B. Wells Center, Indiana University School of Medicine, United States
- Department of Medical and Molecular Genetics, Indiana University School of Medicine, United States
- Roudebush Indianapolis Veterans Affairs Medical Center, United States
Figures
Figure 1 with 2 supplements

ScRNA-seq identifies various renal cell populations.
(A) Integrated UMAP of kidney cell clusters from control and LPS-treated mice (0, 1, 4, 16, 27, 36, and 48 hr after LPS injection). Actual anatomical layout of kidney nephronal segments is shown below UMAP. (B) Dot plot of representative genes defining indicated cell types. (C) Backmapping of cells from the integrated UMAP onto unintegrated UMAPs of select time points. Highlighted are the proliferating cell cluster (red circle) and S3T2 cluster (blue box). For visibility the actual size of the proliferating cells cluster was purposefully exaggerated. Inset at the 0 hr timepoint shows the proximal tubular clusters with the non-edited proliferating cells subcluster circled in red. CD, collecting duct. CD-IC, collecting duct-intercalated cells. CD-PC, collecting duct-principle cells. CNT, connecting tubule. DCT, distal convoluted tubule. Endo, endothelial cells. Exp, expression. Glom, glomerulus. LOH, Loop of Henle. LPS, endotoxin. Ly, lymphocytes. Mφ -DC, macrophage-dendritic cells. Ne, neutrophil. Peri/St, mixed pericyte and stromal cells. Prolif. Cells, proliferating cells. PT, proximal tubule. S1, first segment of PT. S2, second segment of PT. S3, third segment of PT. S3T2, S3 type 2 cells.
Figure 1—figure supplement 1
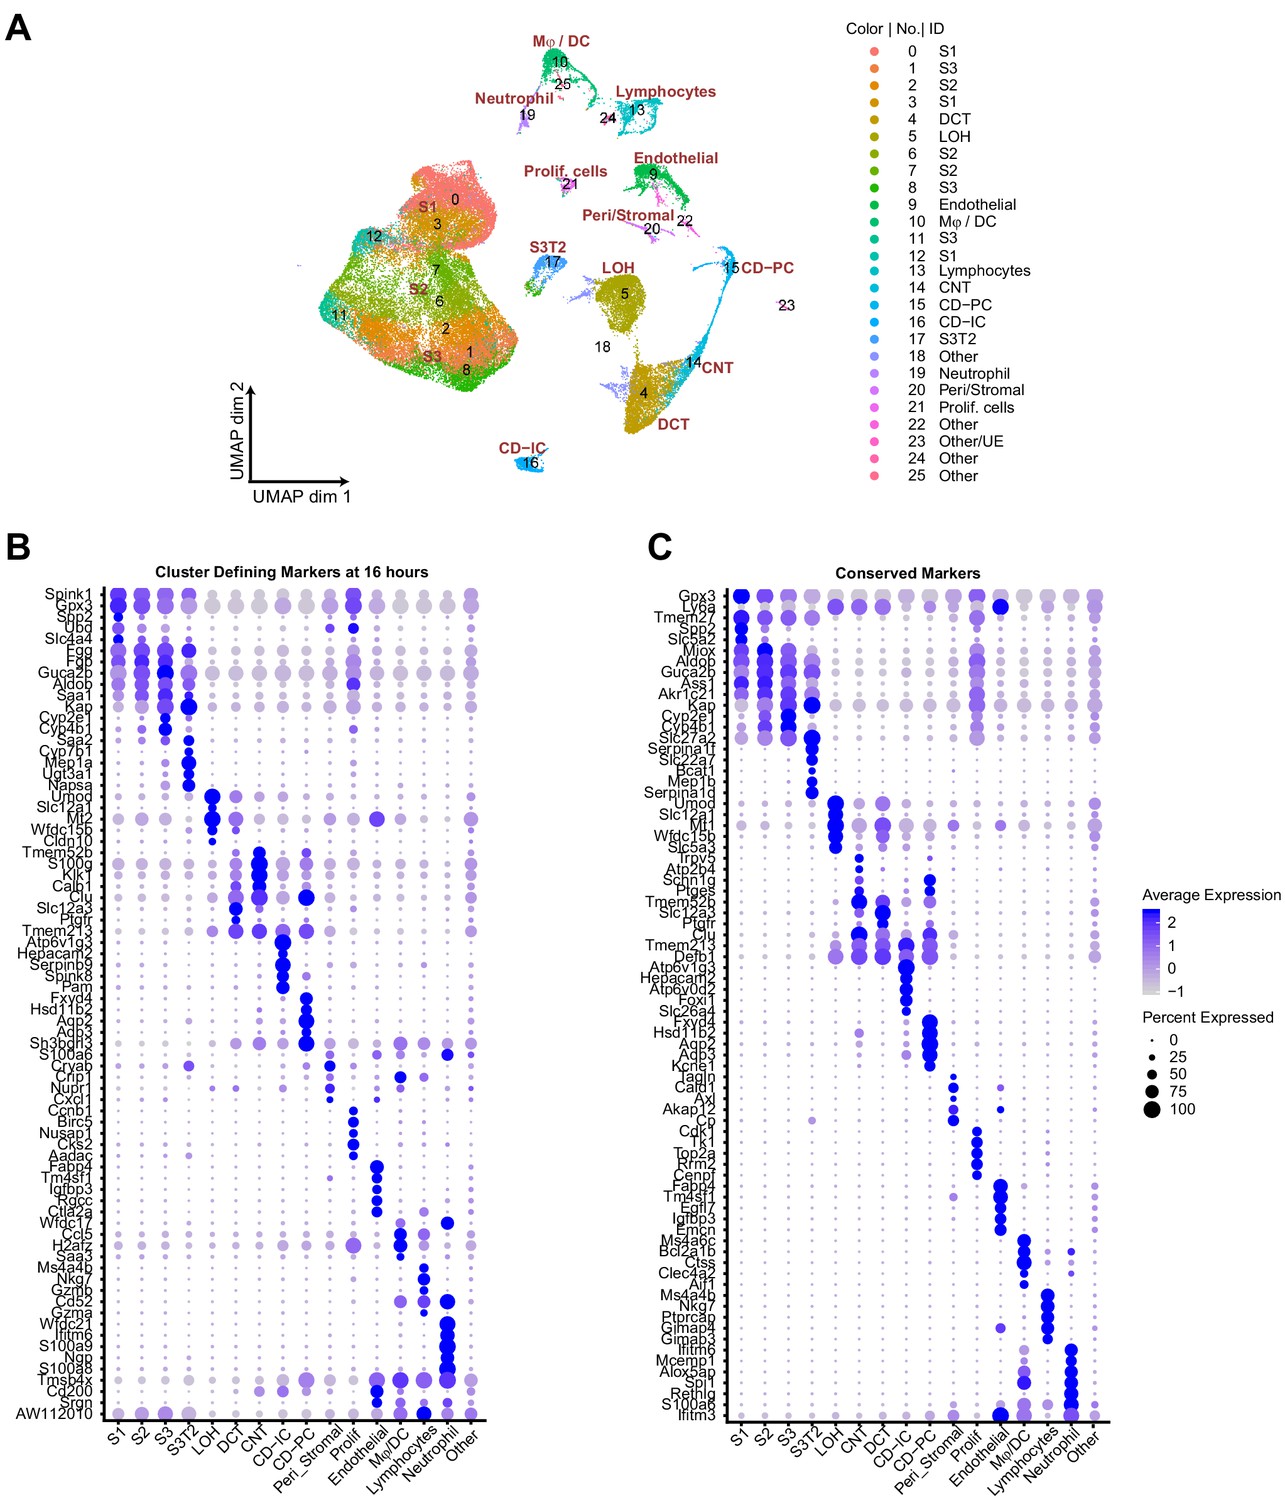
Cluster-defining markers across the endotoxemia timeline.
(A) Integrated UMAP of kidney cell clusters showing both assigned identity and original cluster number from control and LPS-treated mice (0, 1, 4, 16, 27, 36, and 48 hr after LPS injection). (B–C) Dot plots of top five cluster-defining (shown at 16 hr) and conserved marker genes (all time points integrated). CD, collecting duct. CD-IC, collecting duct-intercalated cells. CD-PC, collecting duct-principle cells. CNT, connecting tubule. DCT, distal convoluted tubule. Endo, endothelial cells. LOH, Loop of Henle. LPS, endotoxin. Ly, lymphocytes. Mϕ-DC, macrophage-dendritic cells. Ne, neutrophil. Peri/St, mixed pericyte and stromal cells. Prolif. Cells, proliferative cells. PT, proximal tubule. S1, first segment of PT. S2, second segment of PT. S3, third segment of PT. S3T2, S3 type 2 cells. Other/UE, mixed clusters, ureteric epithelium.
Figure 1—figure supplement 2

Characterization of proliferating cells.
(A) Feature plots of Jun and Fos, markers for dissociation-induced stress response. Note that proliferating cells (red circles) showed minimal expression of Jun and Fos. (B) Mice were injected with thimidine analog CldU and the kidneys were harvested at baseline (control, 0 hr) and 24 hr after LPS. Arrows point to CldU positive cells shown in red. Nuclei are stained blue with DAPI. Green is tubular autofluorescence. CldU, 5-chloro-2’deoxyuridine.
Figure 2 with 2 supplements
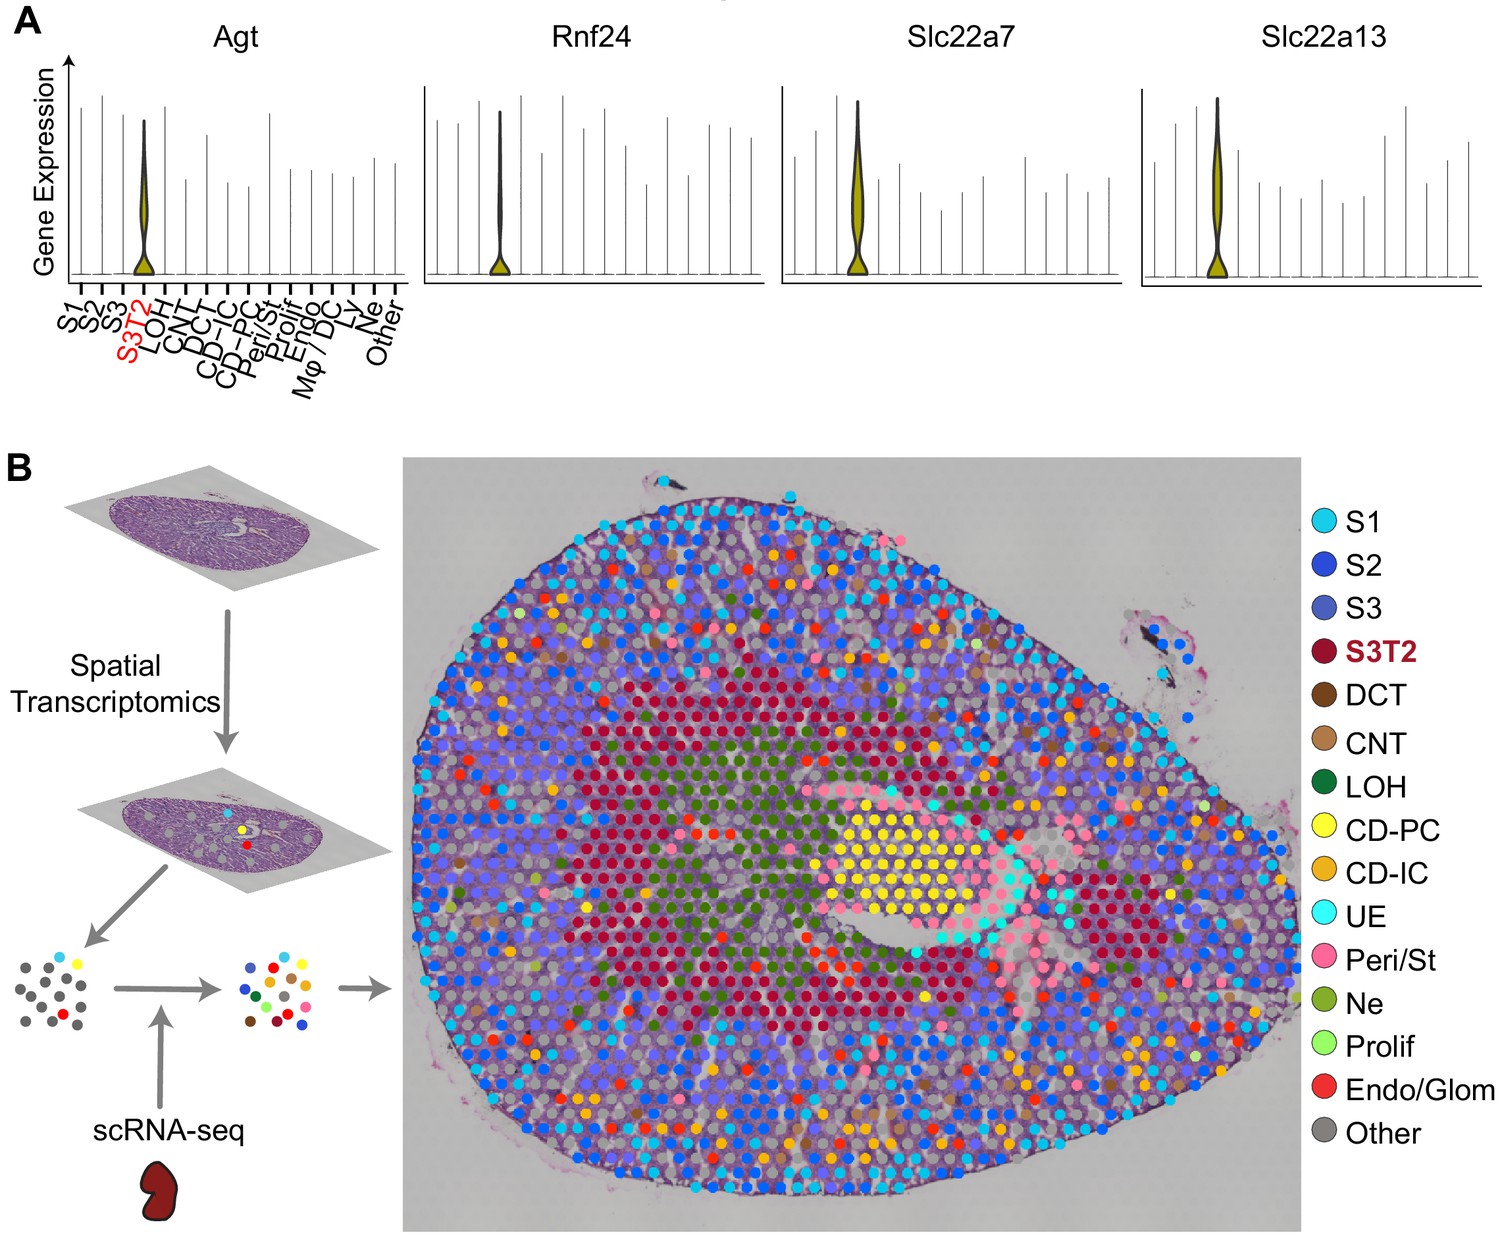
Integration of scRNA-seq and spatial transcriptomics localizes subtypes of S3 proximal tubules.
(A) Violin plots of S3T2 defining markers. (B) Integration of spatial transcriptomics and scRNA-seq. Spatial transcriptomics were performed on a slice of mouse kidney. This yielded seven clusters that were expanded to 15 cell types by integrating spatial transcriptomics with scRNAseq data from LPS-treated mice. See also Figure S3.
Figure 2—figure supplement 1
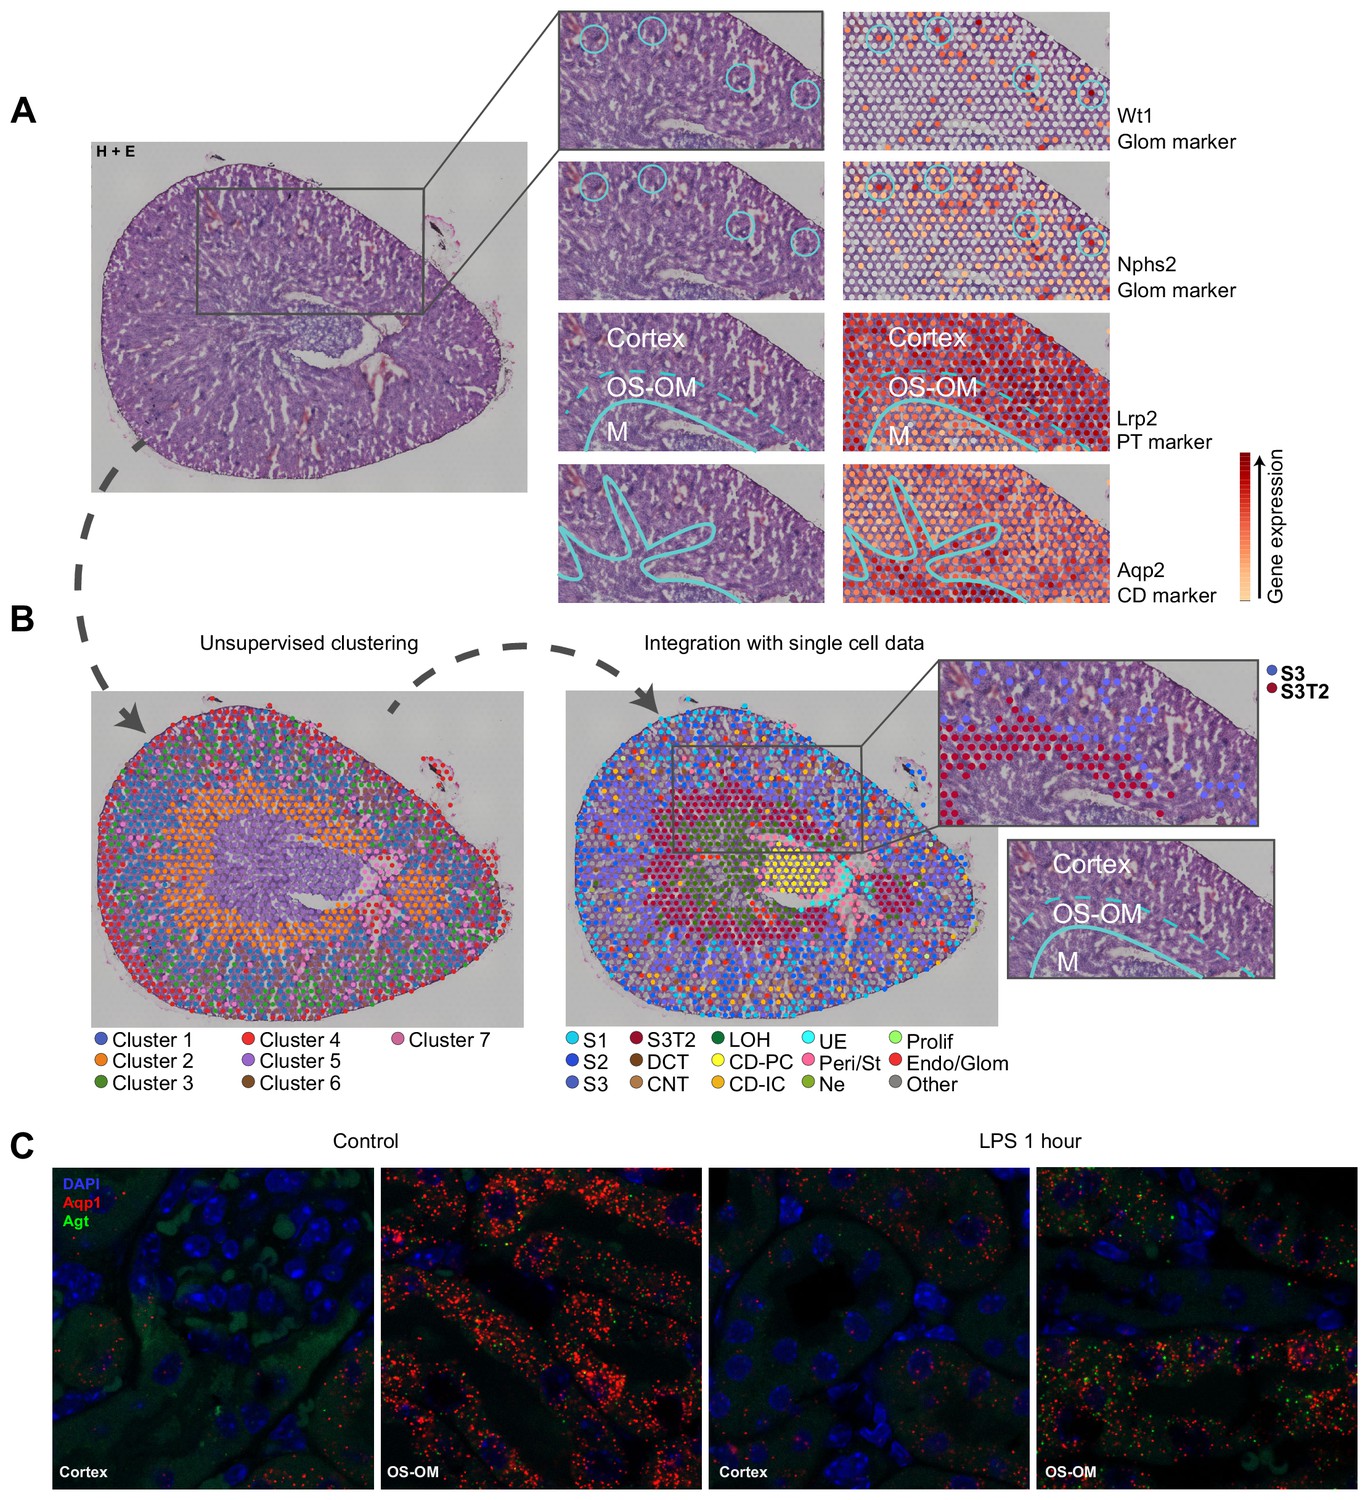
Spatial transcriptomics validation.
(A–B) Spatial transcriptomics of murine kidney showing unsupervised clustering (b-left panel) and expanded clustering after integration with single cell data (b-right panel). Insets of A show gene expression of select glomerular and tubular markers. Gray dots are gene expression values which fall below displayed scale. Inset of b-right panel highlights S3 and S3T2 clusters. Note that S3T2 spots are strictly localized to the OS OM. In contrast, S3 spots are primarily located in the lower cortex, adjacent to the OS OM and do not extend to the upper cortex. They are clearly distinct from S2 spots that span the cortex, including the upper cortex. (C) Single molecular FISH (smFISH) coexpression of Aqp1 (red) and Agt (punctate green) in control kidney and after 1 hr of LPS (Cortex and outer stripe of outer medulla shown). Diffuse green objects are RBC and tubular autofluorescence. Endo/Glom, glomerular endothelial cells, H&E, hematoxylin and eosin stain, OS-OM, outer stripe of outer medulla, M, medulla.
Figure 2—figure supplement 2
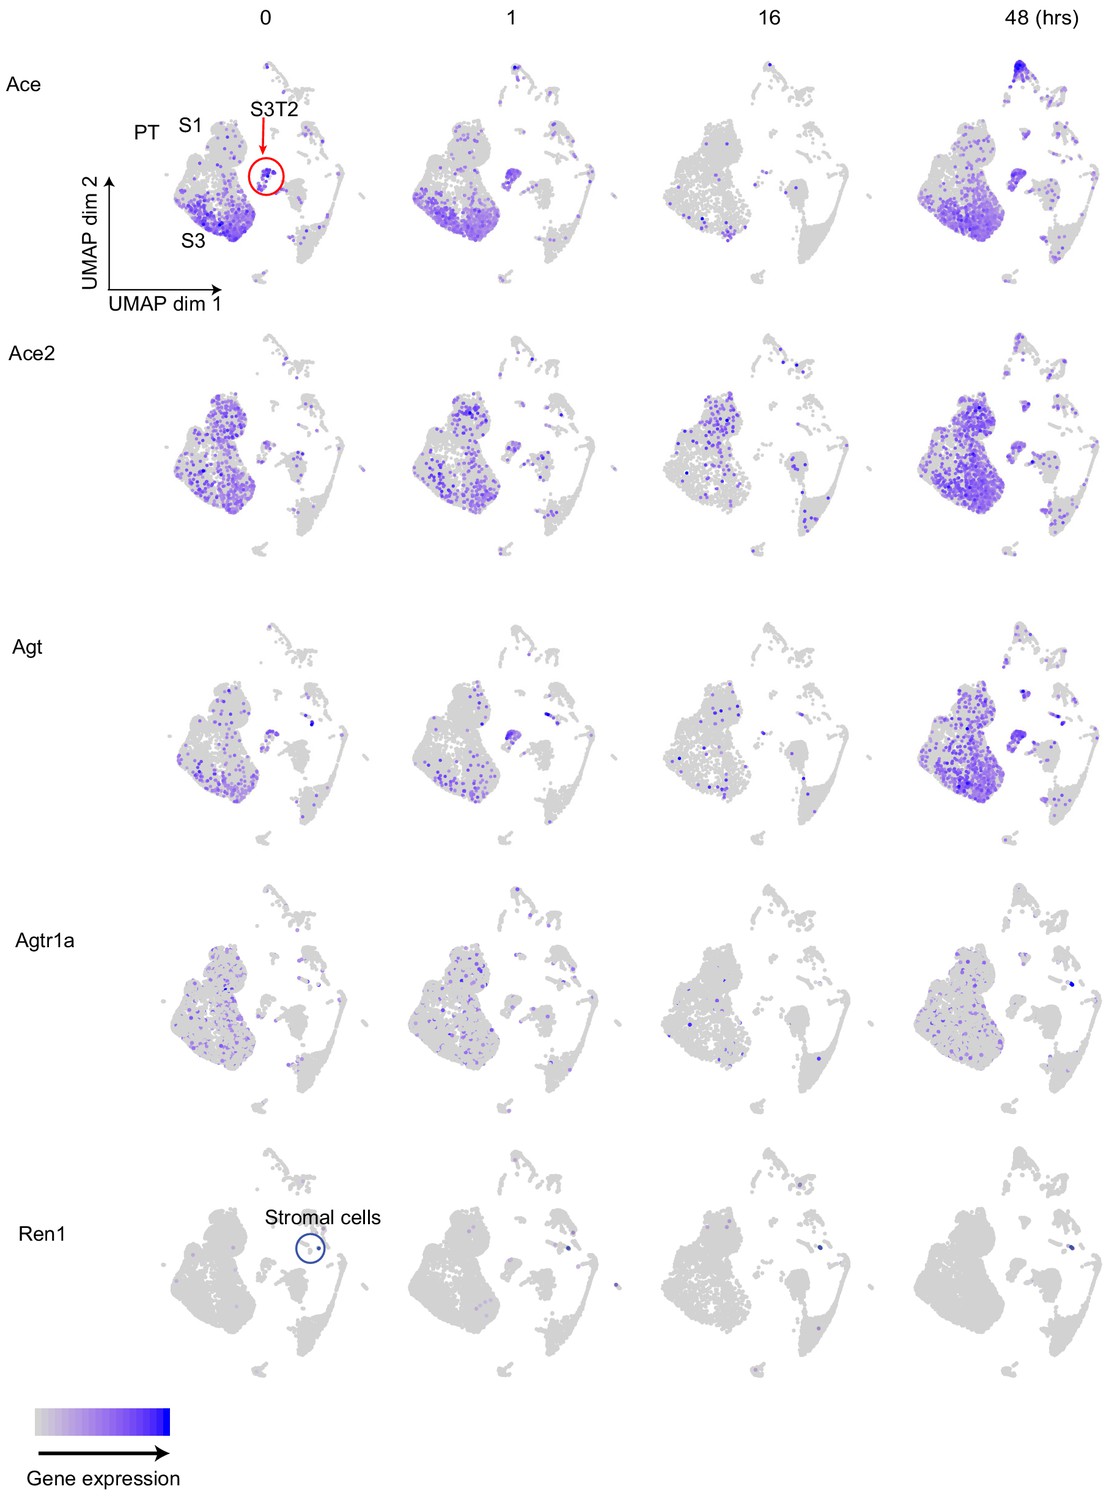
Cellular expression of the RAS axis along the endotoxemia timeline.
Feature plots showing expression of components of the RAS axis at specified time points. Labeled in the upper left panel are the segments of the proximal tubule, and stromal cells which express genes related to the renin-angiotensin axis.
Figure 3 with 1 supplement
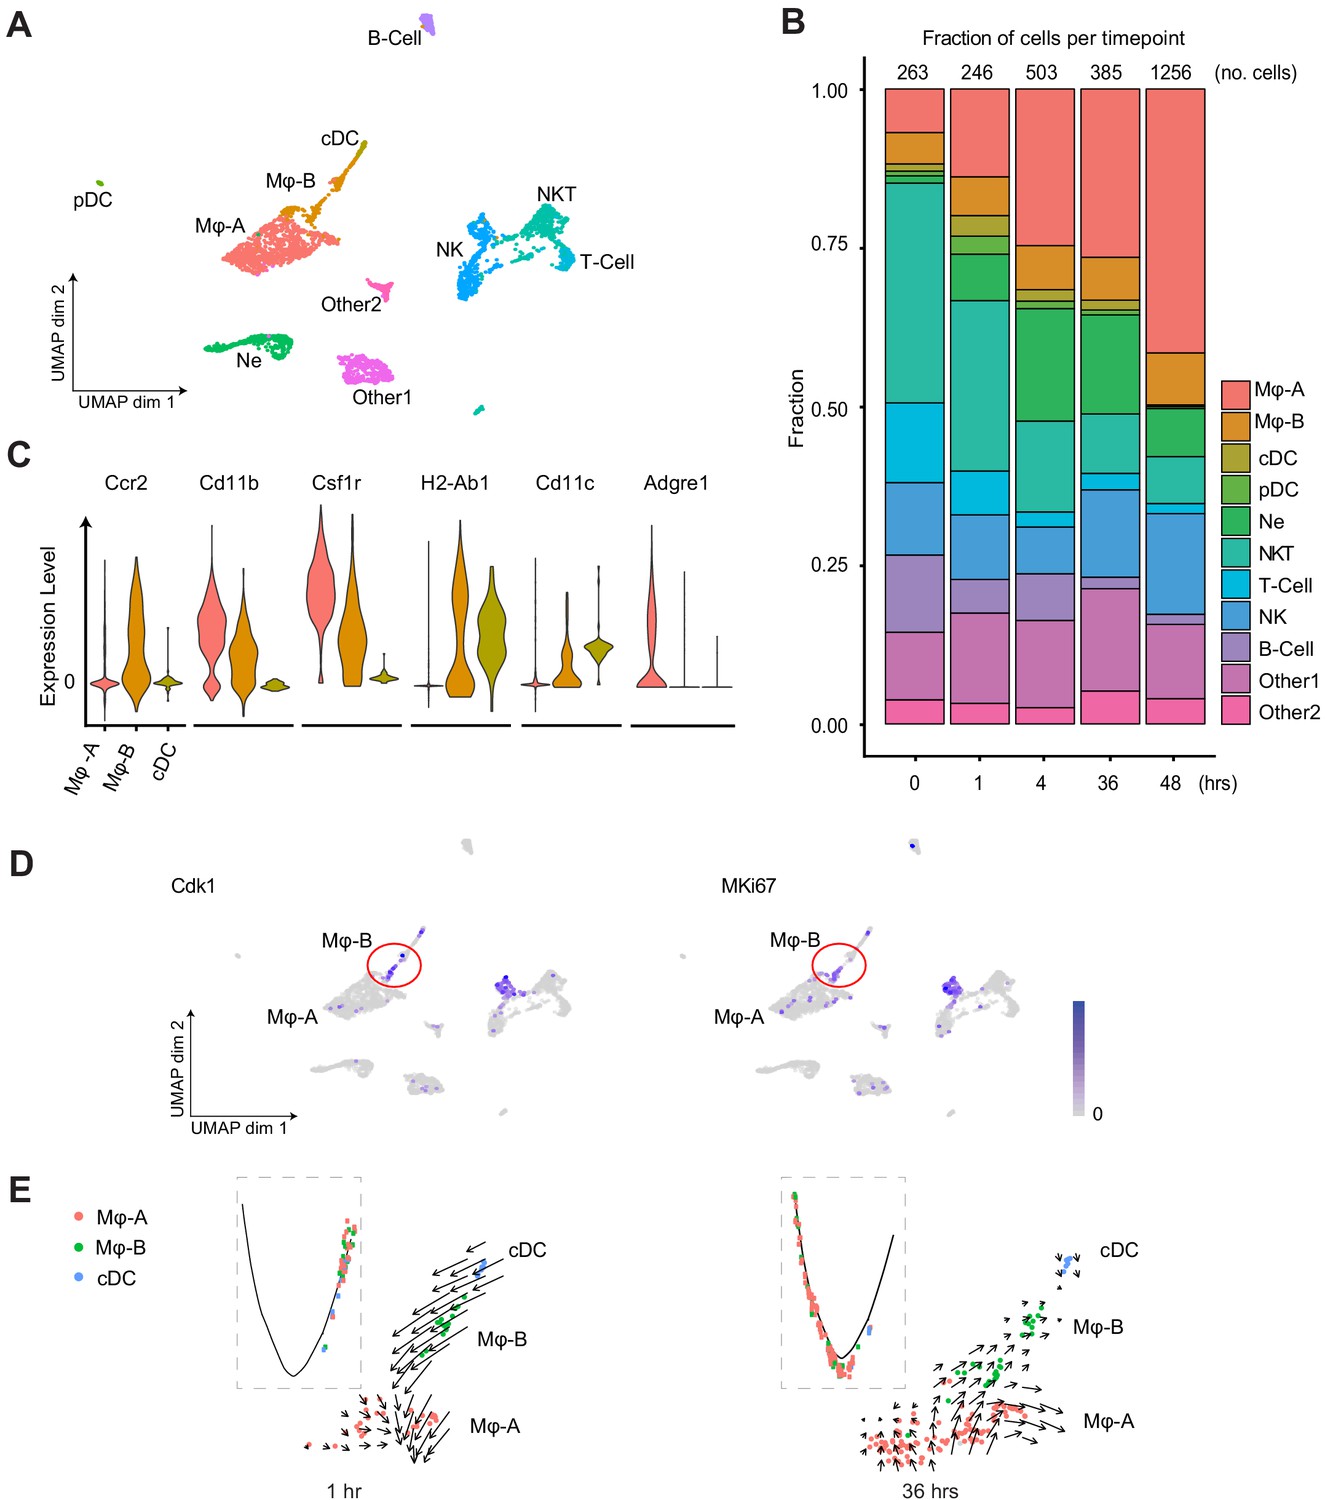
Endotoxemia induces dynamic changes in renal immune cell composition, pseudotime states and RNA velocity.
(A) Integrated UMAP of the immune cell clusters from control and LPS-treated mice (0, 1, 4, 16, 27, 36, and 48 hr after LPS injection). Other one and Other two are Cd45+ cells with mixed epithelial and immune markers. (B) Stacked bar plot with fractions of immune cells (relative to total number of cells) shown in the y-axis, at 0, 1, 4, 36, and 48 hr after LPS. The total number of immune cells is indicated at the top of the bar for each time point. (C) Integrated violin plots from all time points for indicated genes defining subtypes of macrophages and DCs. (D) Feature plots of proliferation markers expression from integrated time points in the immune cell subsets. (E) Integrated cell trajectory analyses and RNA velocity fields for macrophages and dendritic cells shown at indicated time points. cDC, conventional dendritic cell. Hrs, hours. Mϕ-A, macrophage-A. Mϕ-B, macrophage-B. Ne, neutrophil. NK, natural killer cells. NKT, natural killer T-cells. pDC, plasmacytoid dendritic cell. T-cell, Cd3+ T-lymphocytes.
Figure 3—figure supplement 1

Immune cell subset characteristics.
(A) RNA velocity analysis reveals two distinct subfields within the Mϕ-A cluster. The subfield circled in red showed expression of M2 macrophage-related genes at later time points (B). (C) Violin plots of Cd4, Cd8 and Ifn-g expression across immune cell subtypes. cDC, conventional dendritic cell. Hrs, hours. Mϕ-A, macrophage-A. Mϕ-B, macrophage-B. M2, alternatively activated macrophages. Ne, neutrophil. NK, natural killer cells. NKT, natural killer T-cells. pDC, plasmacytoid dendritic cell. T-cell, Cd3+ T-lymphocytes.
Figure 4 with 2 supplements
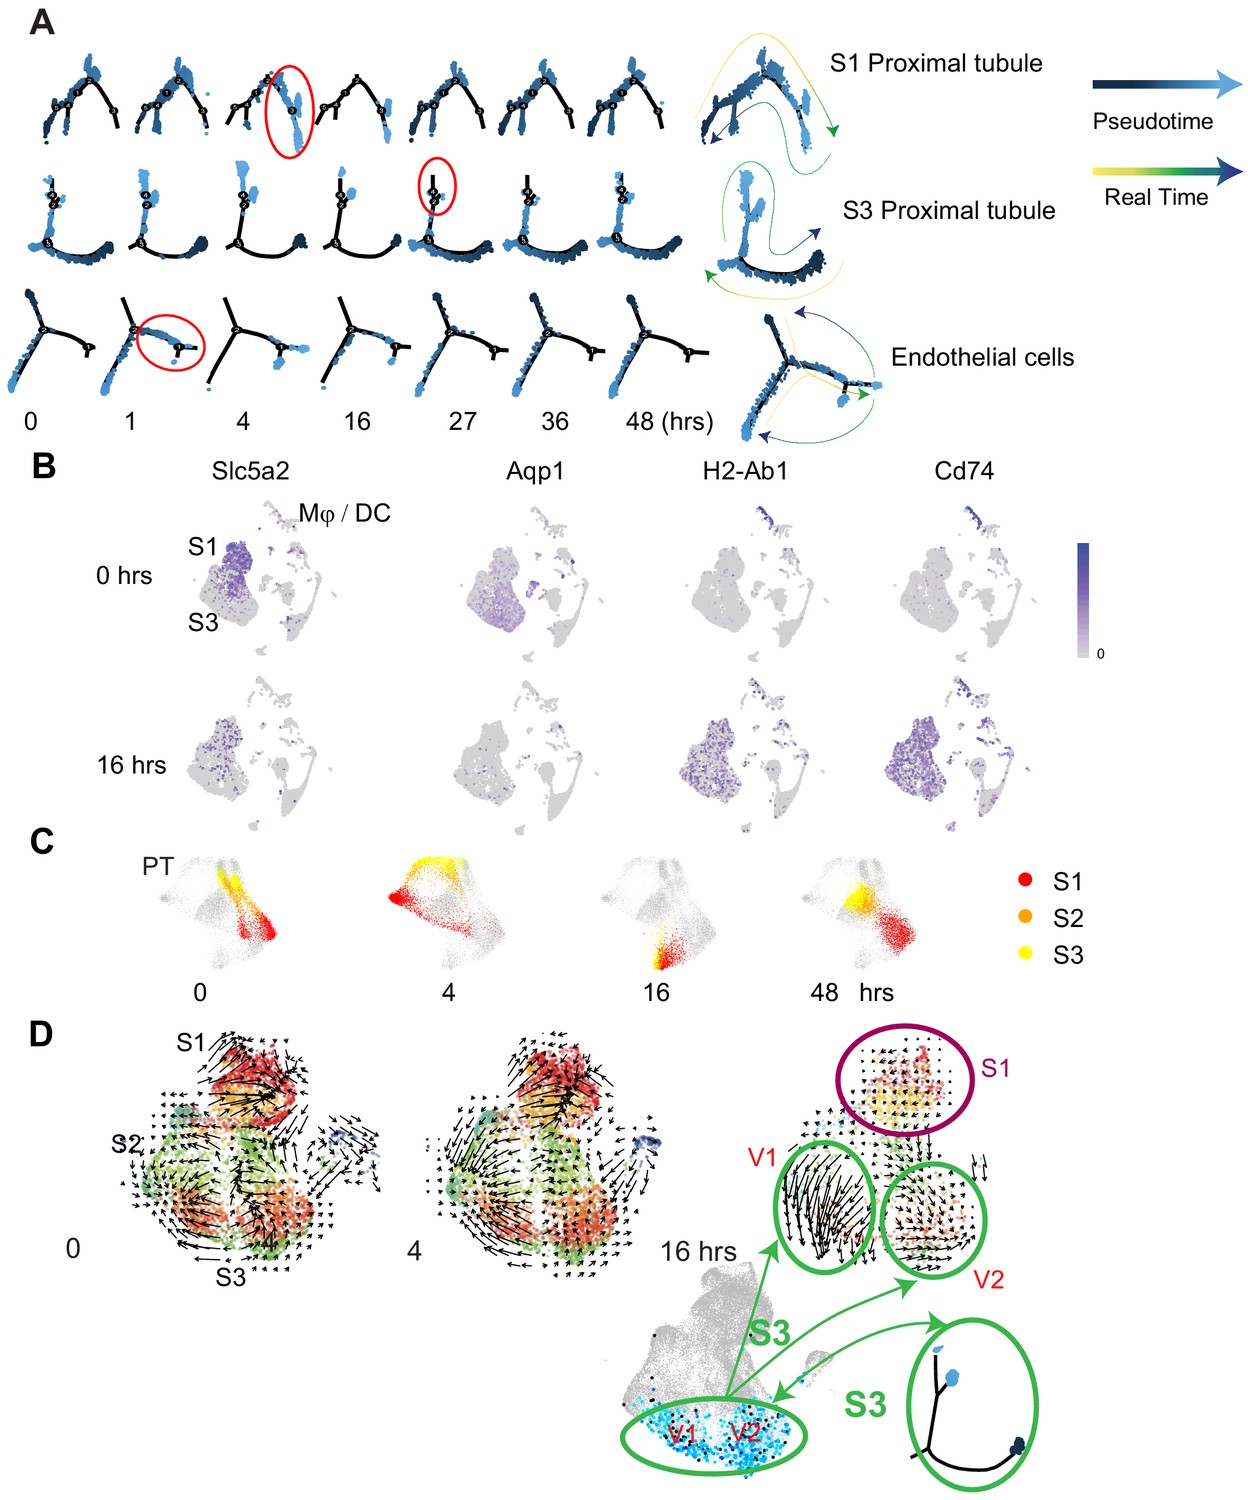
Pseudotime and velocity field analyses identify cell-specific phenotypic changes along the endotoxemia timeline.
(A) Cell trajectory analysis for S1, S3, and endothelial cells shown at indicated time points. Highlighted in red circles are significant state transitions in respective cell types. The last cell trajectory shown for each cell type is integrated from all time points. It highlights the correspondence between pseudotime and real time. (B) Feature plots of selectgenes shown at indicated time points highlighting proximal tubular phenotypic changes. (C) Time-specific S1, S2, and S3PT cells (red, orange, yellow) overlaid on composite t-SNE map of all PT cells (gray). (D) RNA velocity fields for S1, S2, and S3 proximal tubular cells are shown at indicated time points. Two velocity subfields V1 and V2 in S3 cells are circled in green. Projections of two pseudotime S3 states (light blue, dark blue dots) onto the S3 velocity fields do not show a 1:1 correspondence with the two velocity subfields V1 and V2. V1, velocity subfield 1. V2, velocity subfield 2.
Figure 4—figure supplement 1
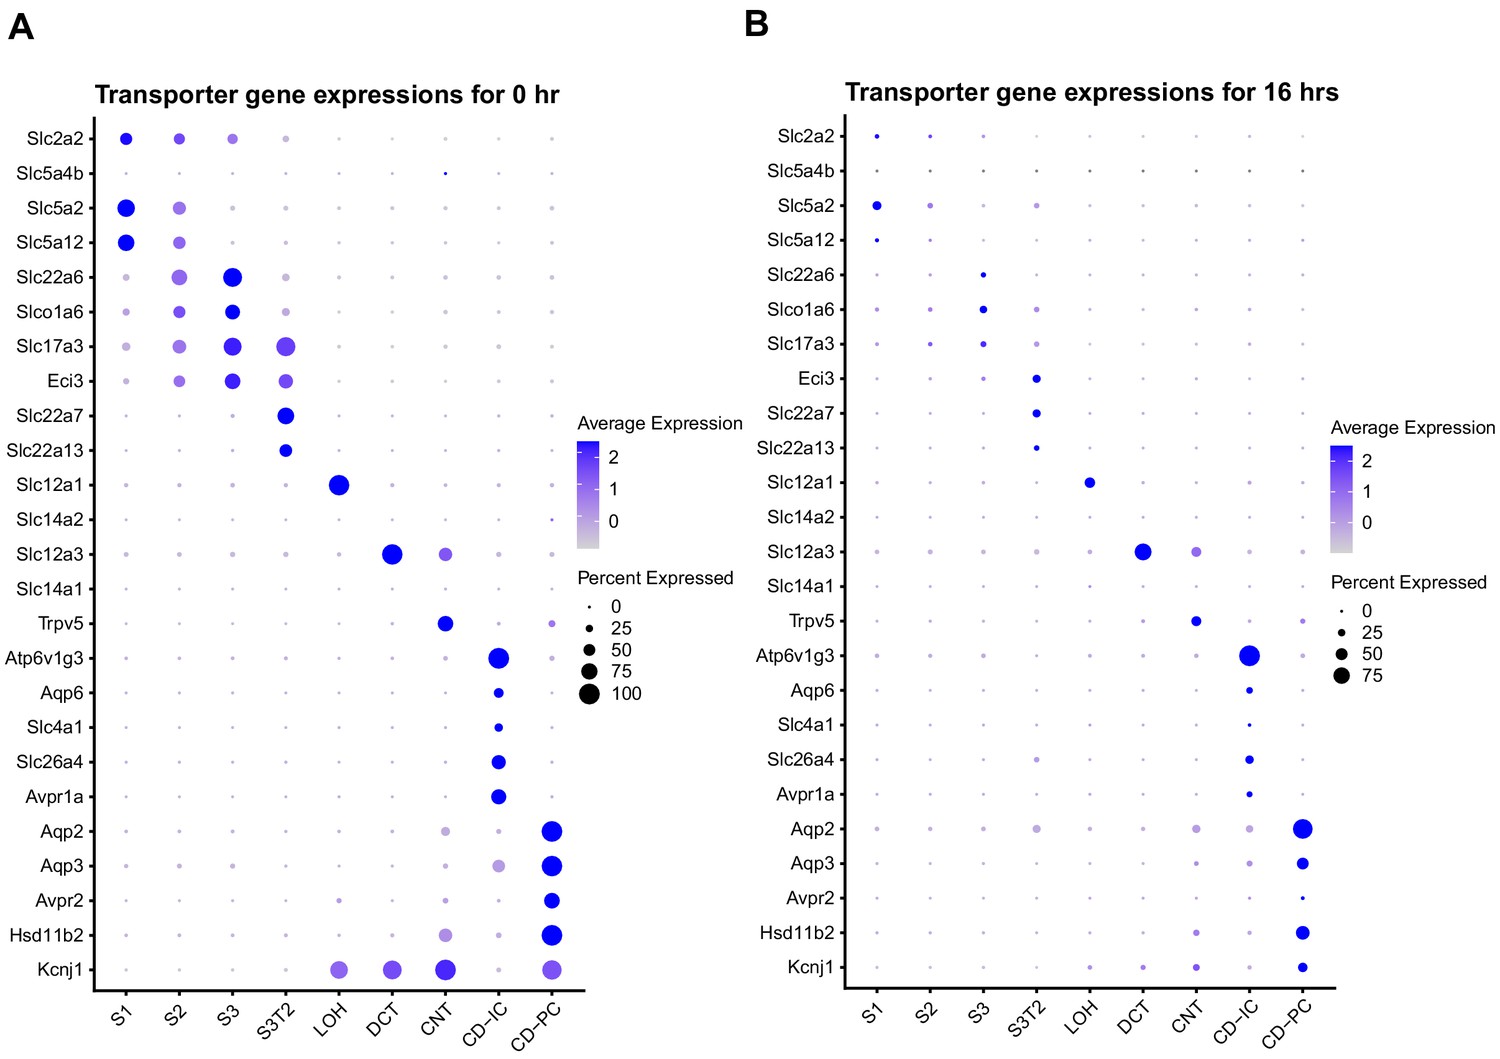
Transporter gene expression across the nephron during endotoxemia.
Dot plots of select transporter genes shown at 0 hr (A) and 16 hr (B).
Figure 4—figure supplement 2
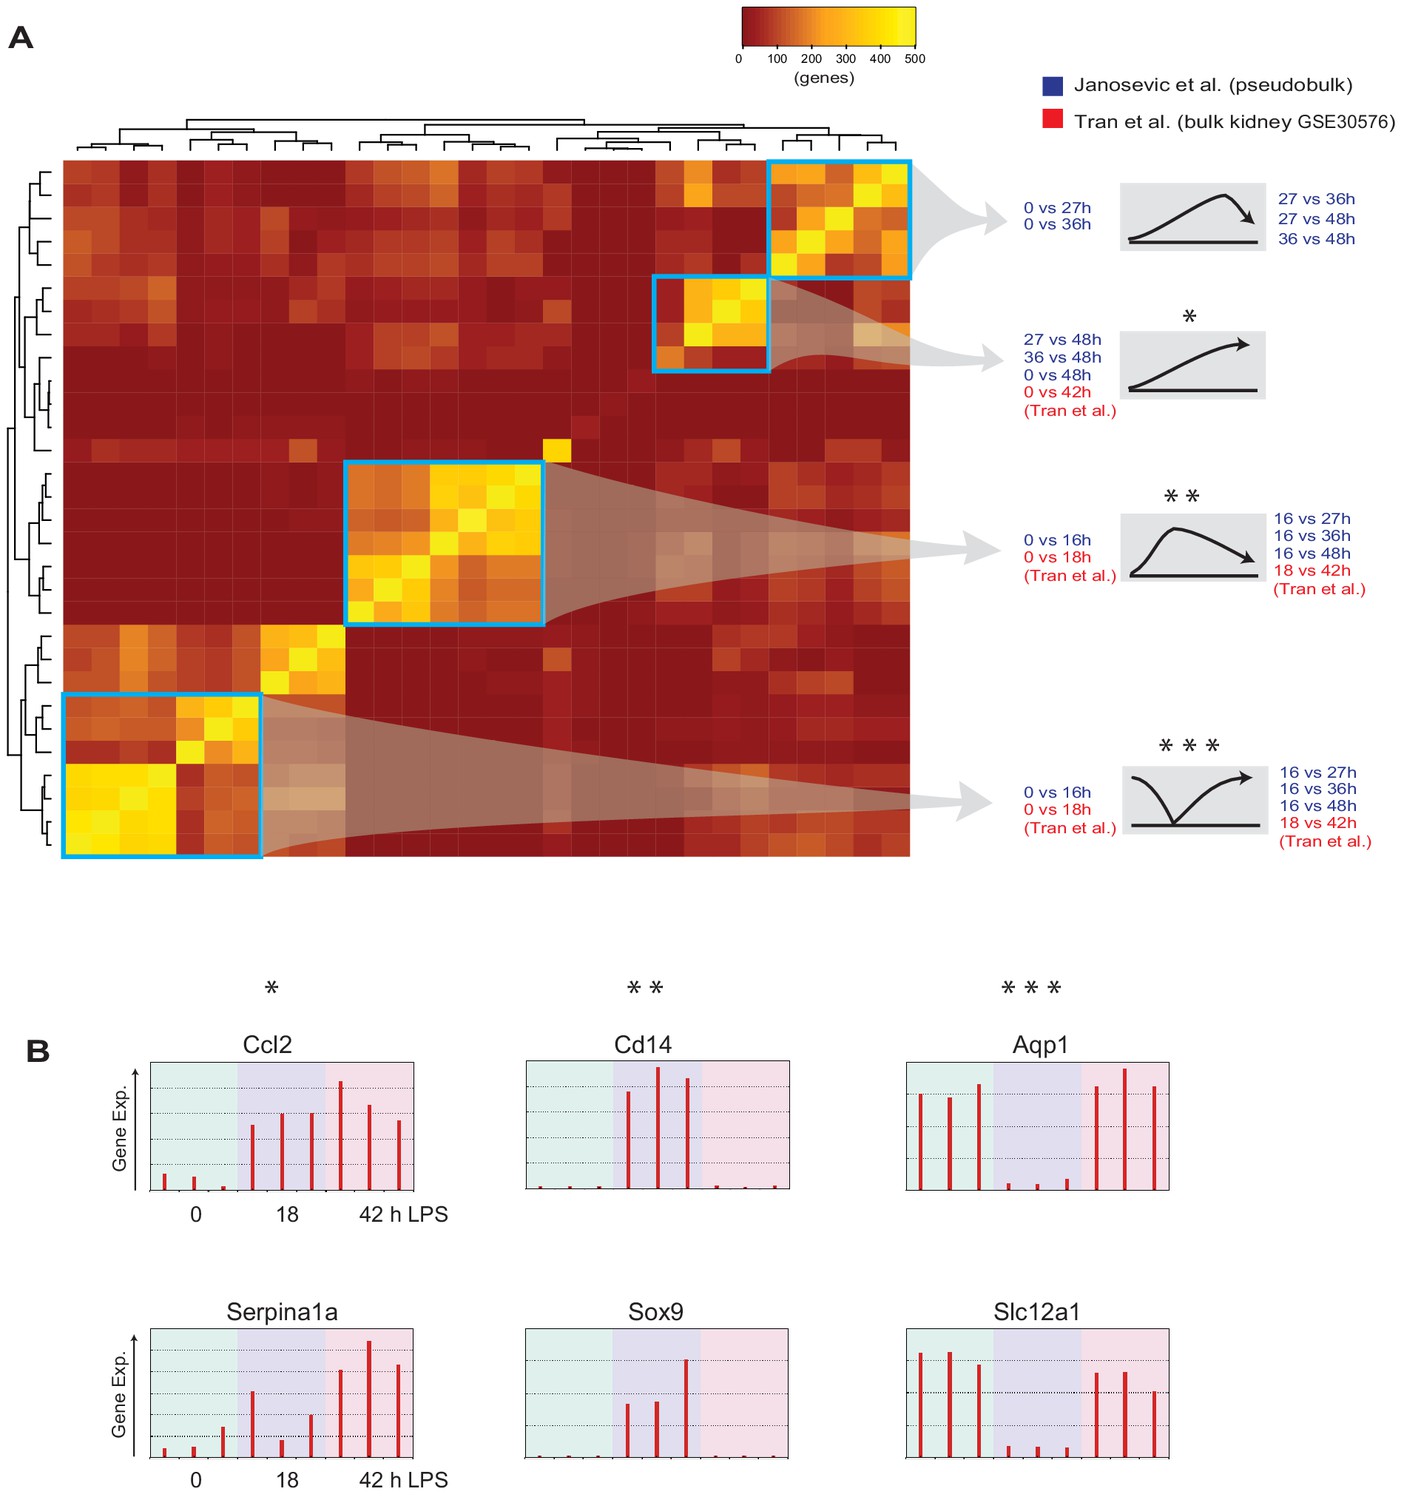
Similarity analysis between bulk and single-cell RNA-seq data.
(A) Jaccard similarity index analysis performed on the current single-cell RNA-seq data and publicly available bulk kidney transcriptomic dataset (GSE30576). Differentially expressed genes over indicated time points are similar between the two datasets as highlighted in blue rectangles. (B) Select gene expression levels from GSE30576 dataset with indicated patterns (*, **, ***). Control, 18 hr post LPS, and 42 hr recovery groups are shown.
Figure 5 with 3 supplements
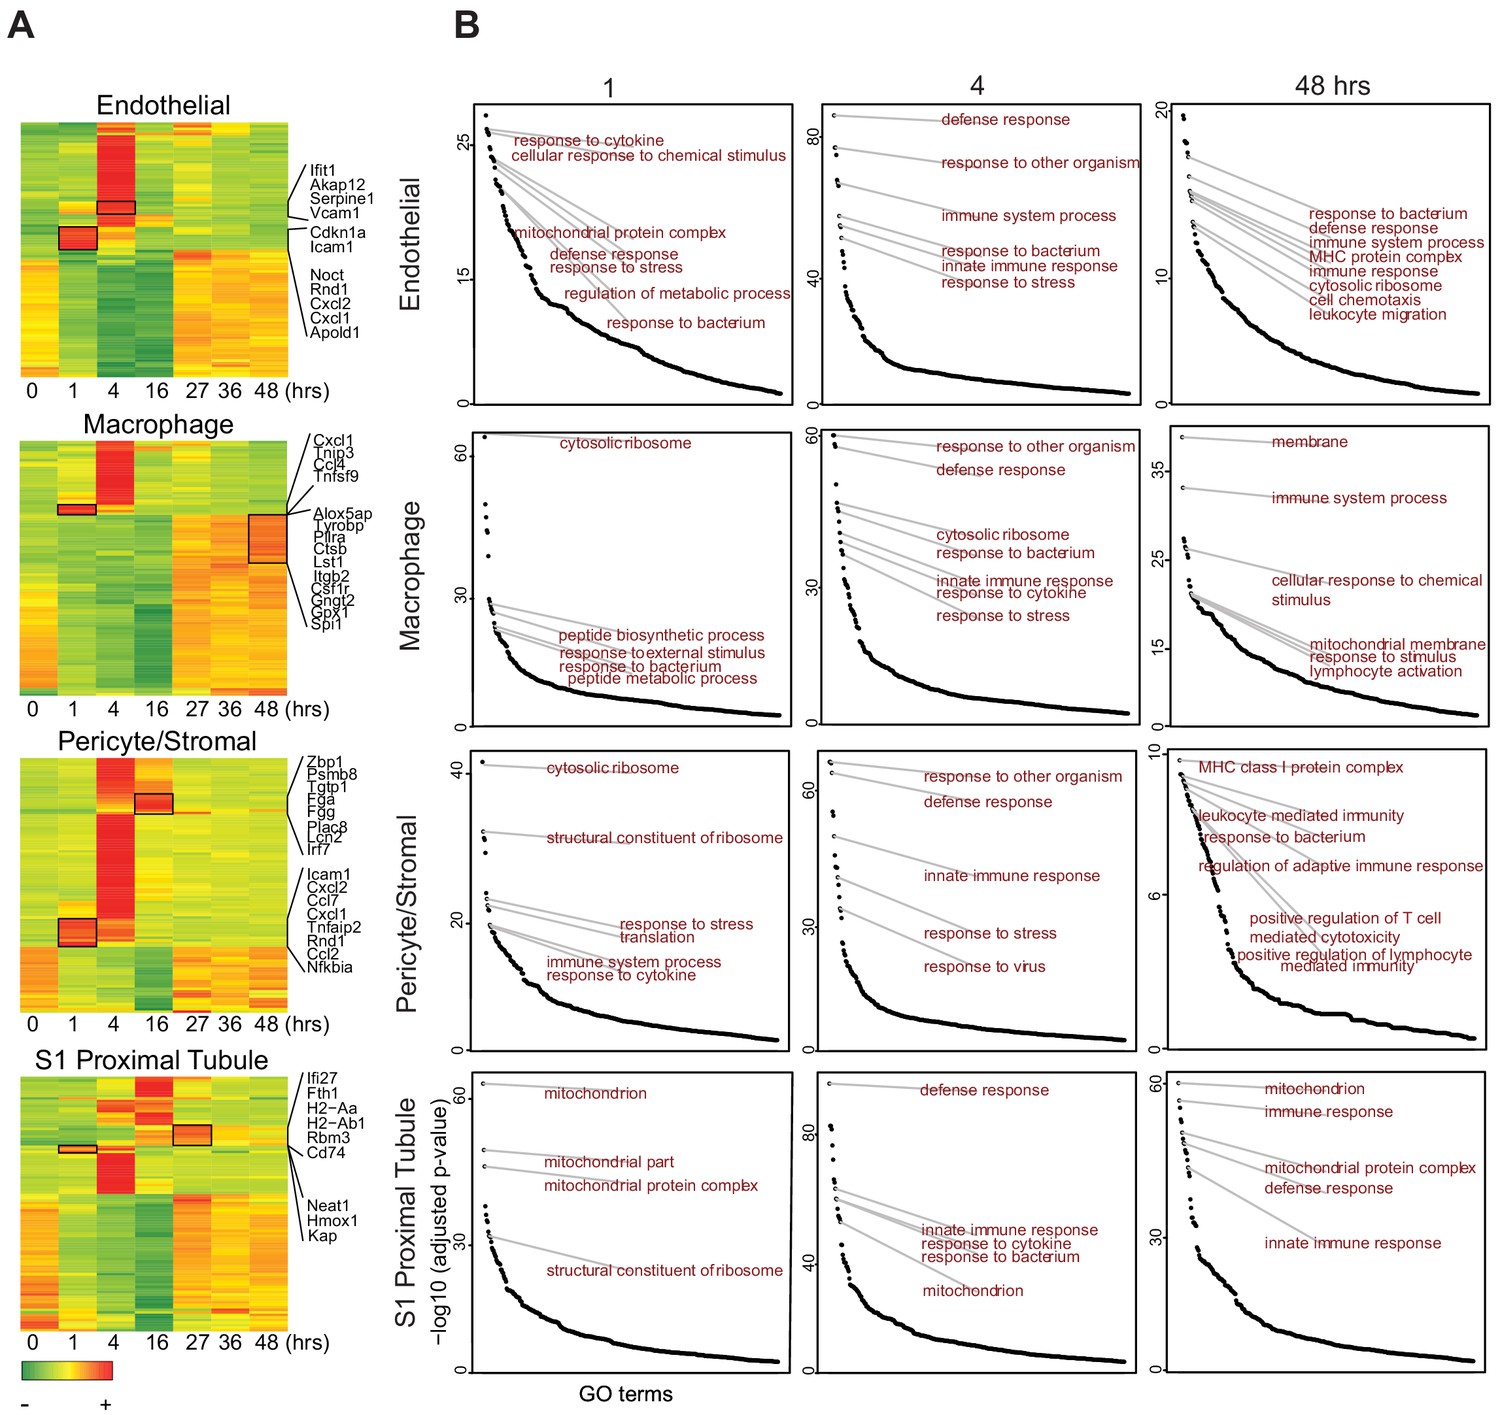
Endotoxemia induces an organ-wide host defense phenotype in the kidney.
(A) Heatmaps of select cell types with top 100 differentially expressed genes across the endottoxemia timeline (0–48 hr). Select genes are shown for each cell type. (B) Time dependent enrichment of gene ontology terms for indicated cell types. GO terms are sorted in order of statistical significance. Hrs, hours. GO, gene ontology biological processes.
Figure 5—figure supplement 1

Comparisons of transcriptomic profiles of selected cell types across the endotoxemia timeline.
(A) Venn diagram showing differentially expressed genes across time (0–48 hr) for indicated cell types. (B) Heatmaps of genes involved in coagulation, complement and arachidonic acid related pathways in all cell types. Individual components of the complement cascade (the flow of which is denoted by red arrows) and coagulation cascade (denoted by blue arrows) are originated in distinct cell types.
Figure 5—figure supplement 2
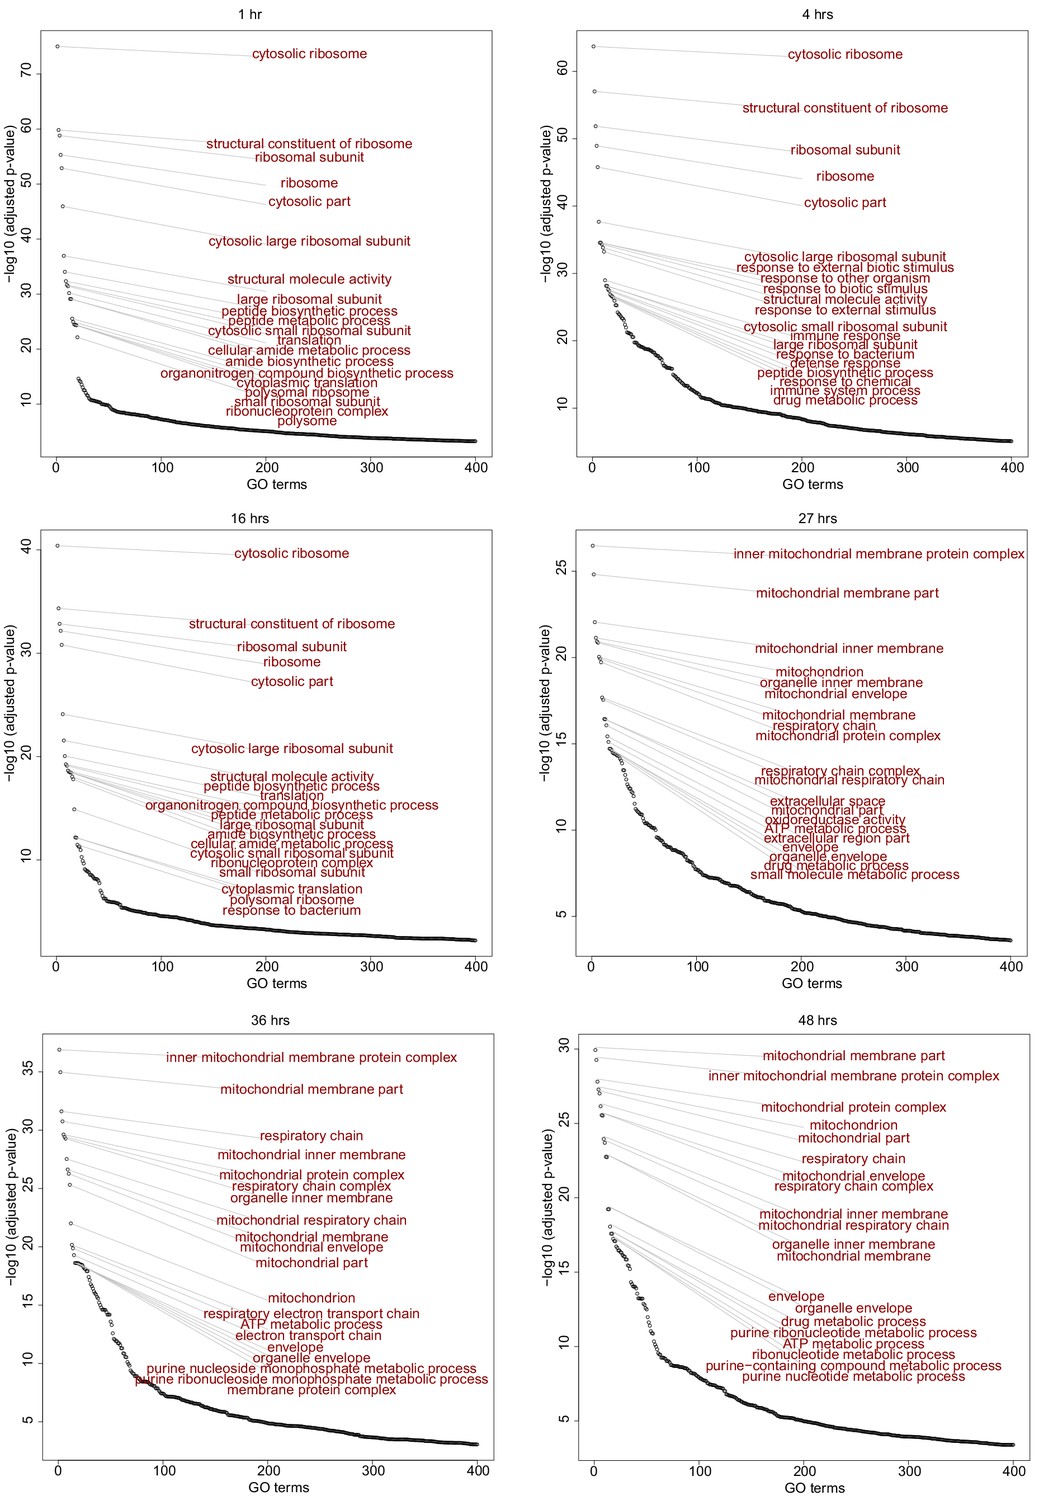
S3T2 GO terms.
Time dependent enrichment of gene ontology terms for S3T2 cells. GO terms are sorted in order of statistical significance. GO, gene ontology biological processes.
Figure 5—figure supplement 3
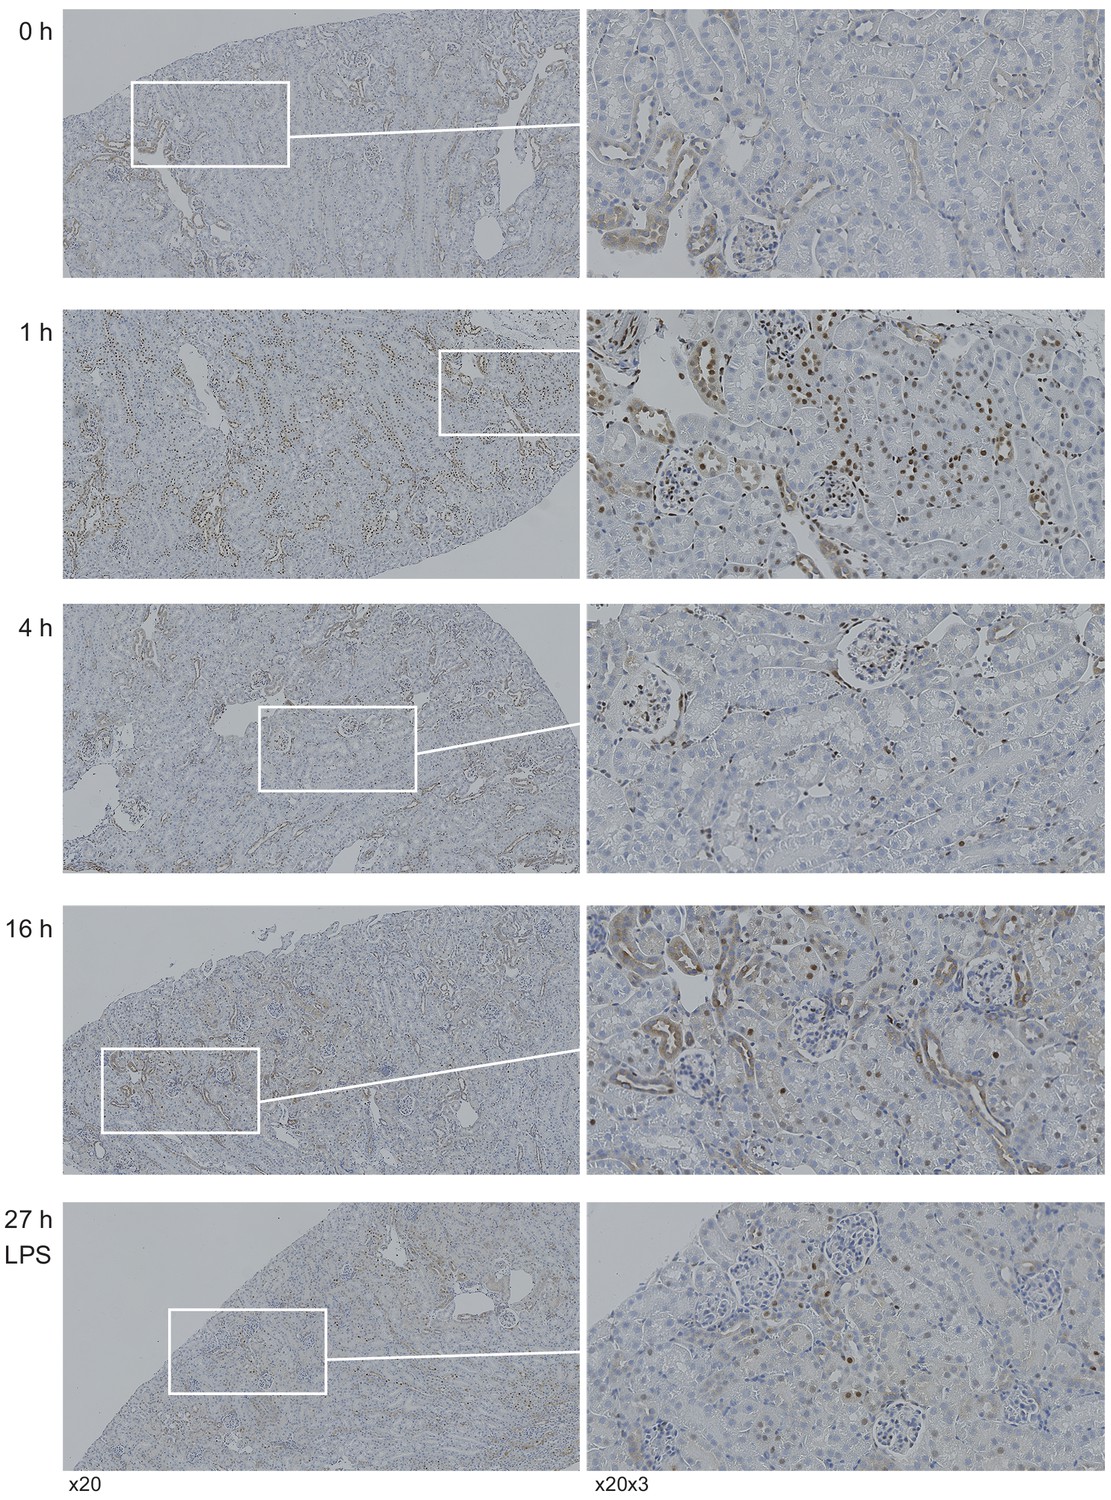
Representative images of immunohistochemical staining for NF-κB are shown under indicated conditions.
Insets point to magnified views of select areas. At baseline, the expression of NF-κB is minimal in all cell types and primarily cytoplasmic. One hour after LPS, diffuse nuclear staining for NF-κB was observed in the majority of cell types including interstitial/immune, distal segment and some proximal tubules. Four hours after LPS, nuclear NF-κB signal was predominantly in interstitial/immune cells. At 16 hr after LPS, nuclear NF-κB signal was primarily in proximal tubules albeit in a patchy pattern. At this time point, NF-κB signal was reduced in interstitial/immune cells. By 27 hr, NF-κB signal started to return to baseline.
Figure 6 with 1 supplement
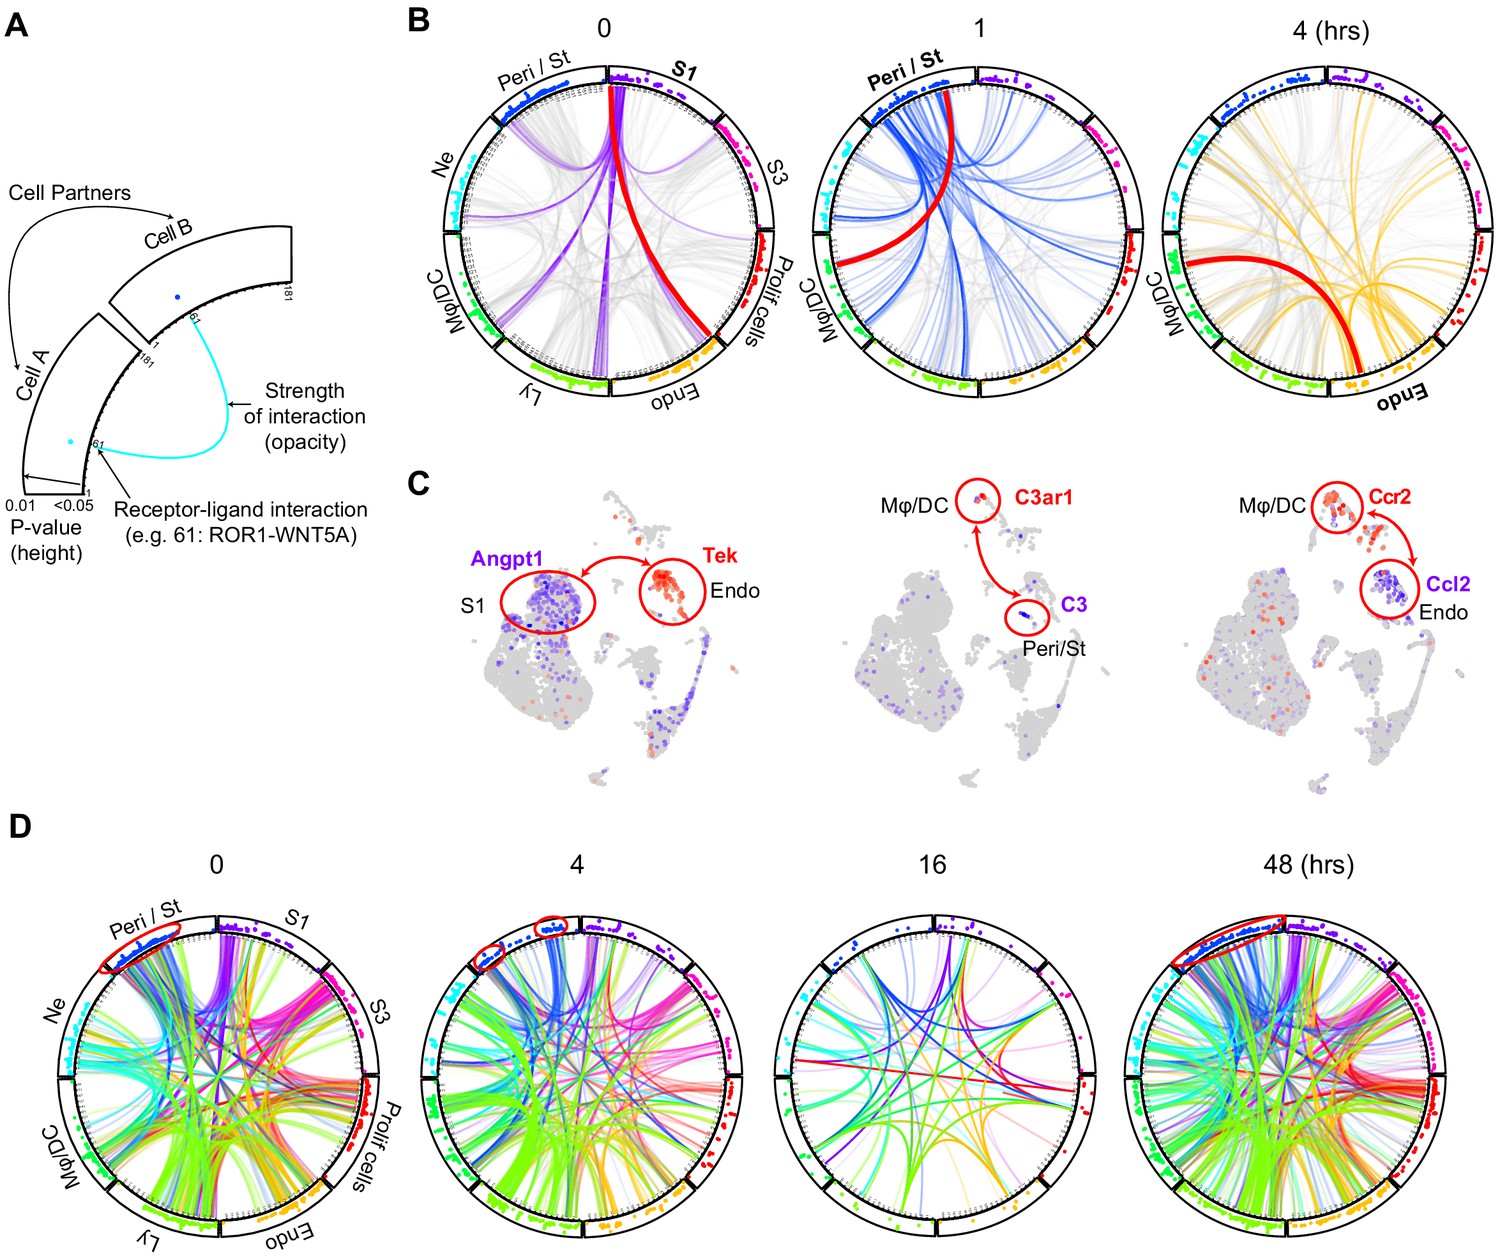
Endotoxemia alters cellular crosstalk causing time-specific global communication failure.
(A) Schematic description of a cell–cell communication circular plot. Dots in the outer track of the circle represent specific ligands or receptors and are positioned identically for all cell types. The height of dots correlates with statistical significance (all dots are less than adjusted p-value<0.05). The identity of each dot is given in Supplementary file 2. (B) Receptor–ligand pairs for indicated cell types are displayed in circular plots. The data was generated using the CellPhone database. For clarity, communication between one cell type and all others is shown (purple lines: 0 hr for S1, blue lines: 1 hr for Peri/St and yellow lines: 4 hr for endothelial cells). Other cell–cell communications in each circular plot are shown in light gray in the background. In each circular plot, the red line connects the specific receptor–ligand pair highlighted in panel C. (C) Feature plots of receptor–ligand pairs between specified cell types as highlighted by the red line in panel B. In each feature plot, the ligand is shown in purple and the receptor in red. (D) Circular plots displaying receptor–ligand interactions between all cell types at specified time points. Examples of change in communication patterns are shown in the red circles in the outer track of the plot at 0, 4 and 48 hr. Note the dramatic drop in cell communication at 16 hr.
Figure 6—figure supplement 1
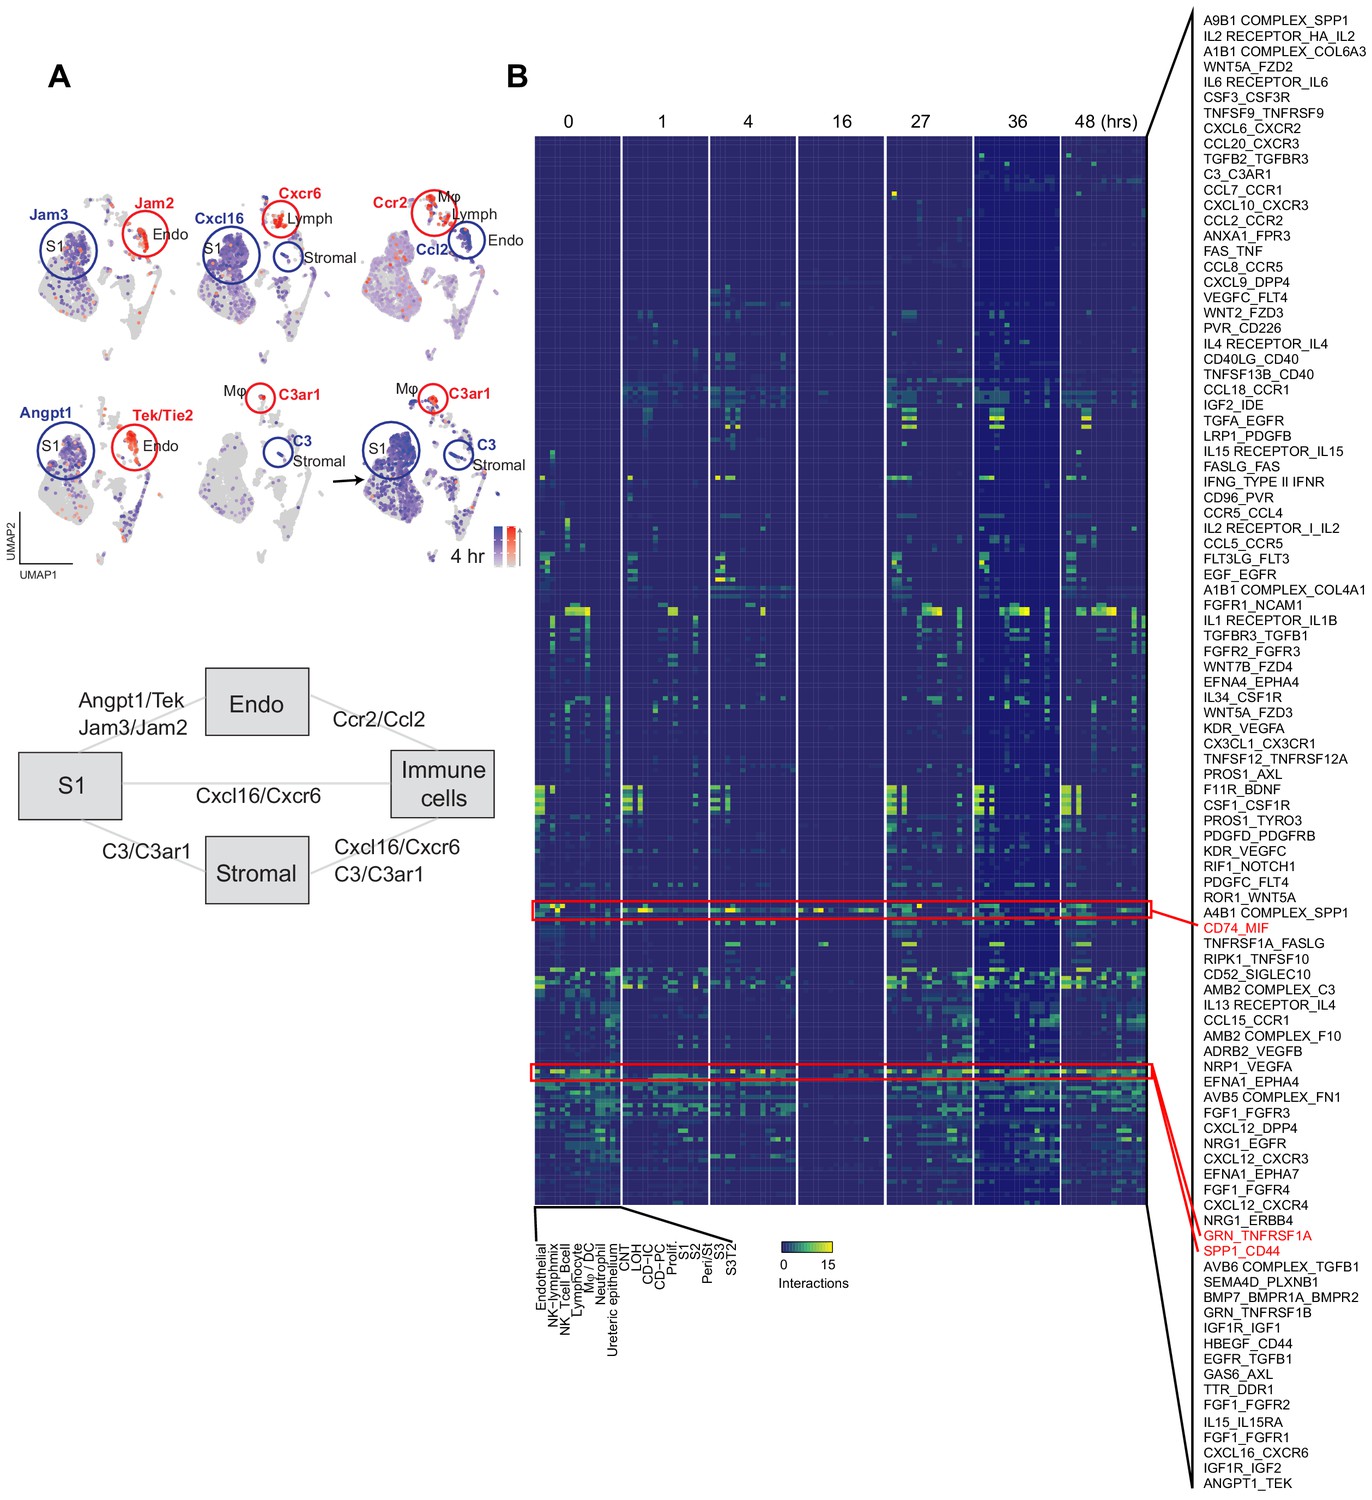
Expanded cell–cell communication examples.
(A) Feature plots illustrating cell and time-dependent expression changes of select receptor ligand pairs (shown at 0 hr unless otherwise specified). Schematic illustrates specific receptor–ligand pairs involved in cross-talk between S1, endothelium, immune and stromal cells. (B) Heatmaps of receptor–ligand pairs at select time points. The heatmap intensity denotes the number of interactions between cell types (x-axis) using receptor ligand pairs (y-axis). Red boxes highlight select pairs across time.
Figure 7 with 2 supplements
Global communication failure is accompanied by increased activity of genes involved in recovery.
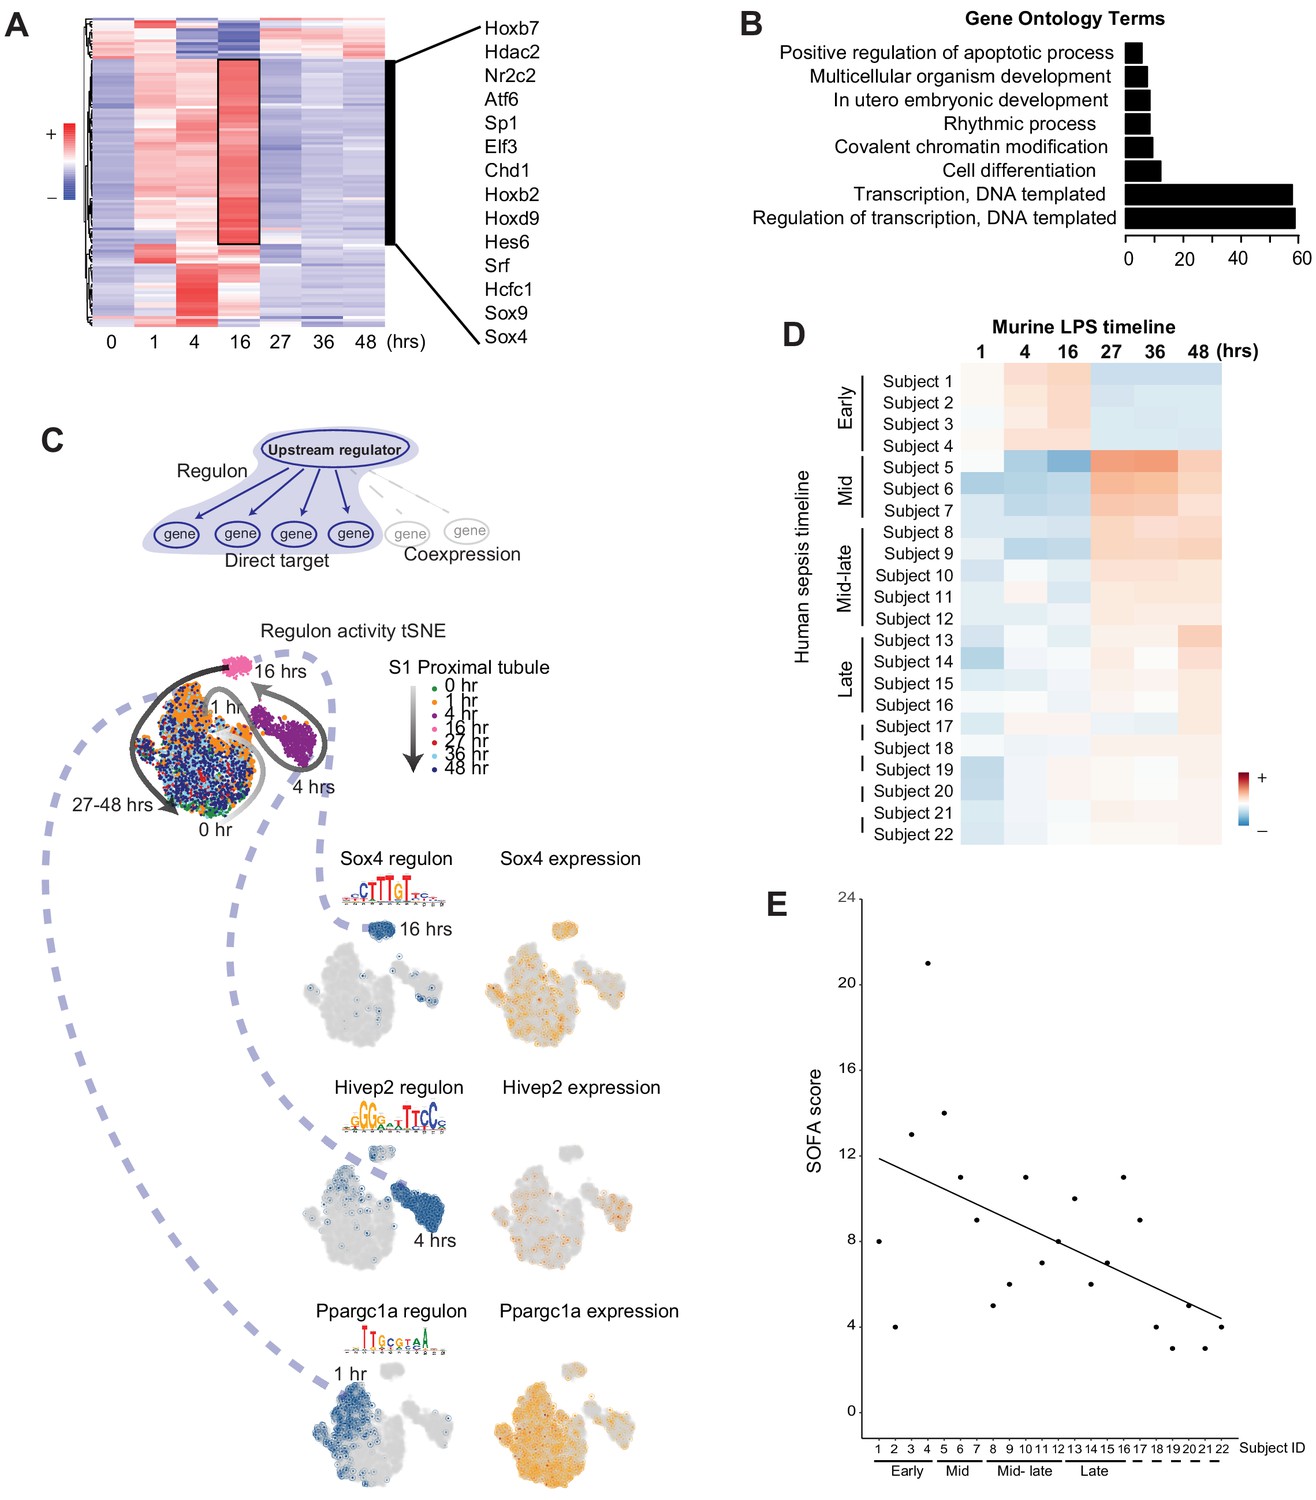
(A) SCENIC-derived heatmap of regulons for S1 tubules. Highlighted are select transcription factors with active regulons at the 16 hr time point. (B) Gene ontology pathway enrichment analysis derived from all regulons active at the 16 hr time point (Supplementary file 3). (C) t-SNE of proximal tubule S1 time-specific regulon activity. Select transcription factor expression (orange) and its corresponding regulon expression (blue) are shown. As shown for Sox4, note the temporal differences between the expression of the transcription factor itself and its regulon. (D) Heatmap of human sepsis kidney samples stratified based on aggregates of murine time-specific orthologues. The color scale indicates the degree of correlation based on Spearman’s ρ. GO, gene ontology biological processes. (E) SOFA score distribution of subjects (x-axis subject ID corresponds to panel D subject ID). GO, gene ontology. SOFA, sequential organ failure assessment.
Figure 7—figure supplement 1
Characteristics of subjects.
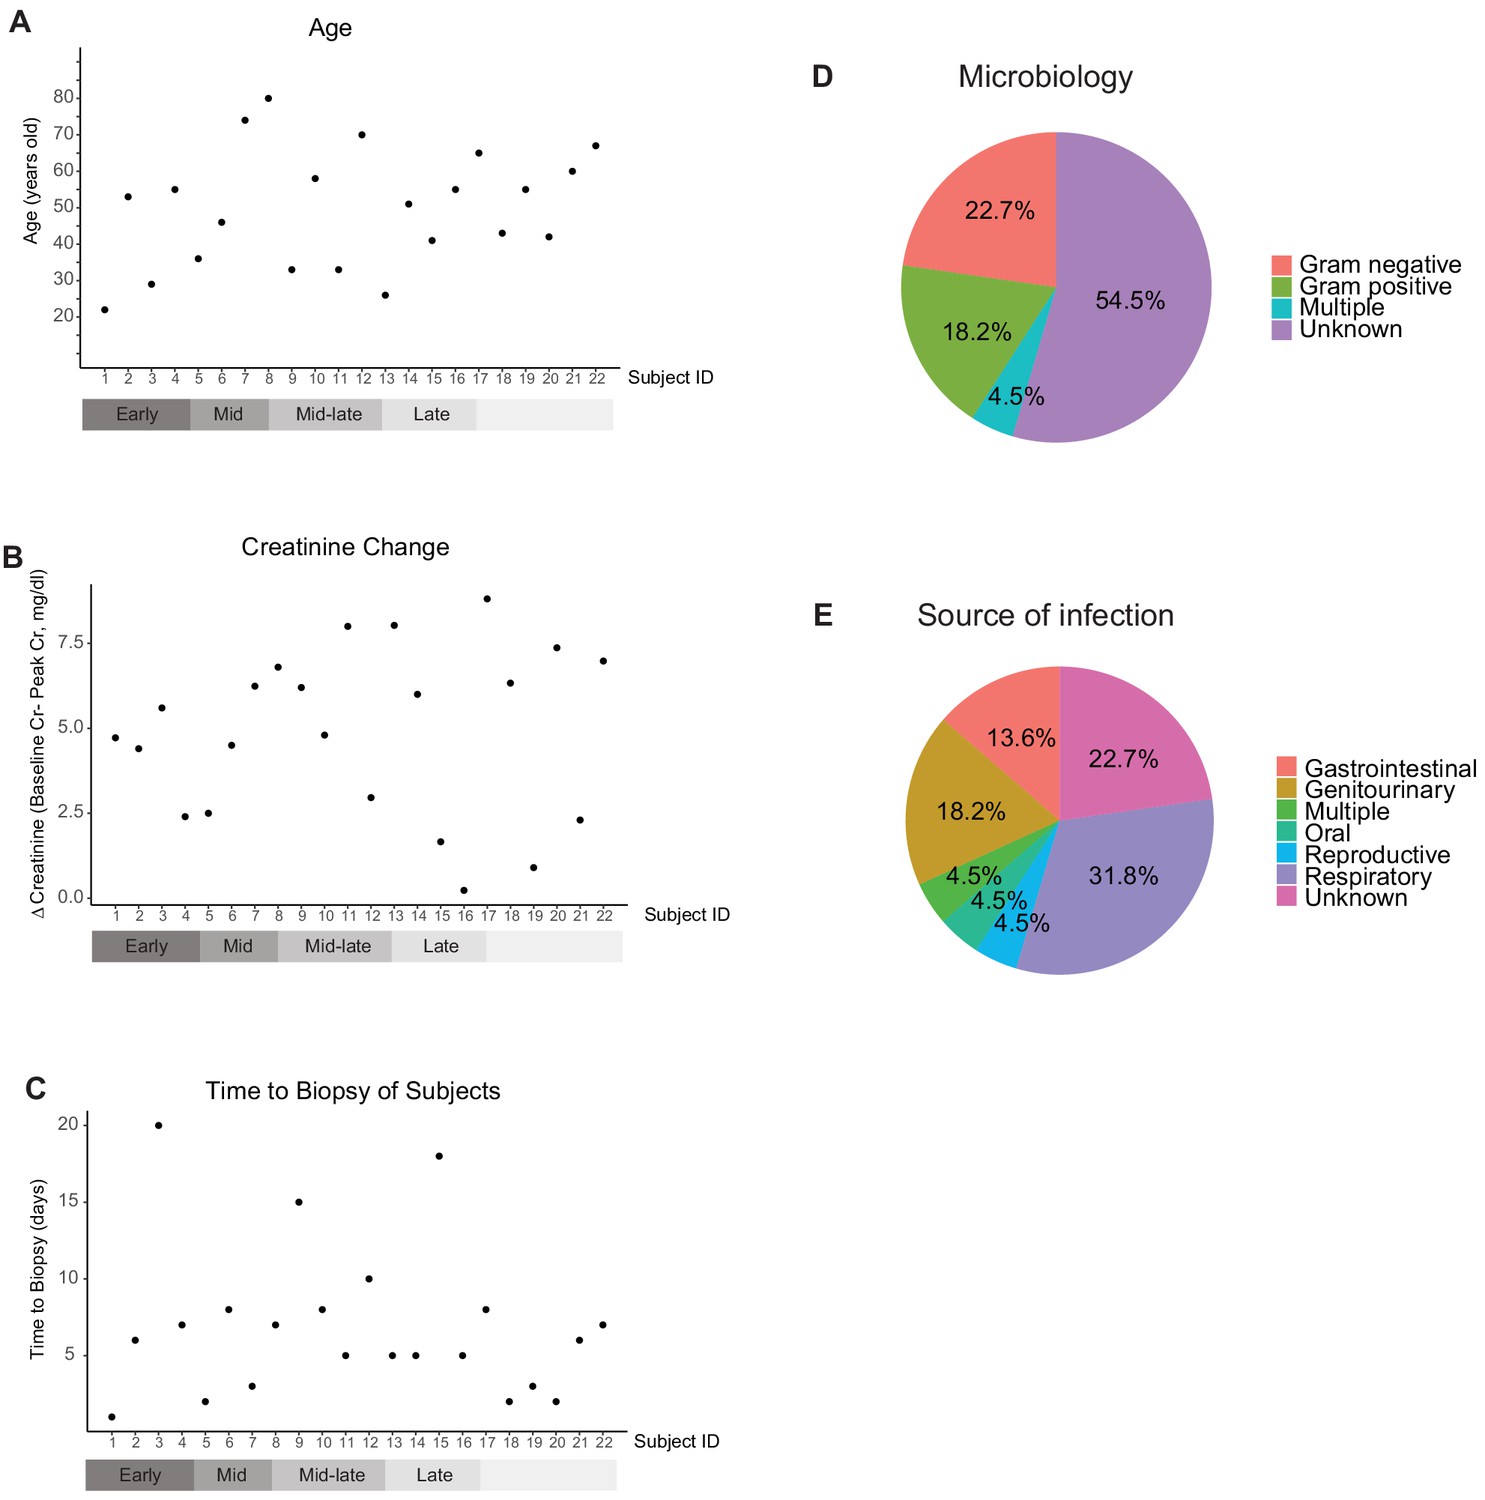
(A) Age distribution of subjects (22 subjects are sorted based on gene expression as shown in main Figure 7D and E. p=0.223). (B) Distribution of serum creatinine changes from baseline to peak levels (p=0.865). (C) Time from AKI diagnosis to renal biopsy (p=0.518). (D - E) Summary of documented microorganisms and infection source. See Supplementary file 5 for detail.
Figure 7—figure supplement 2
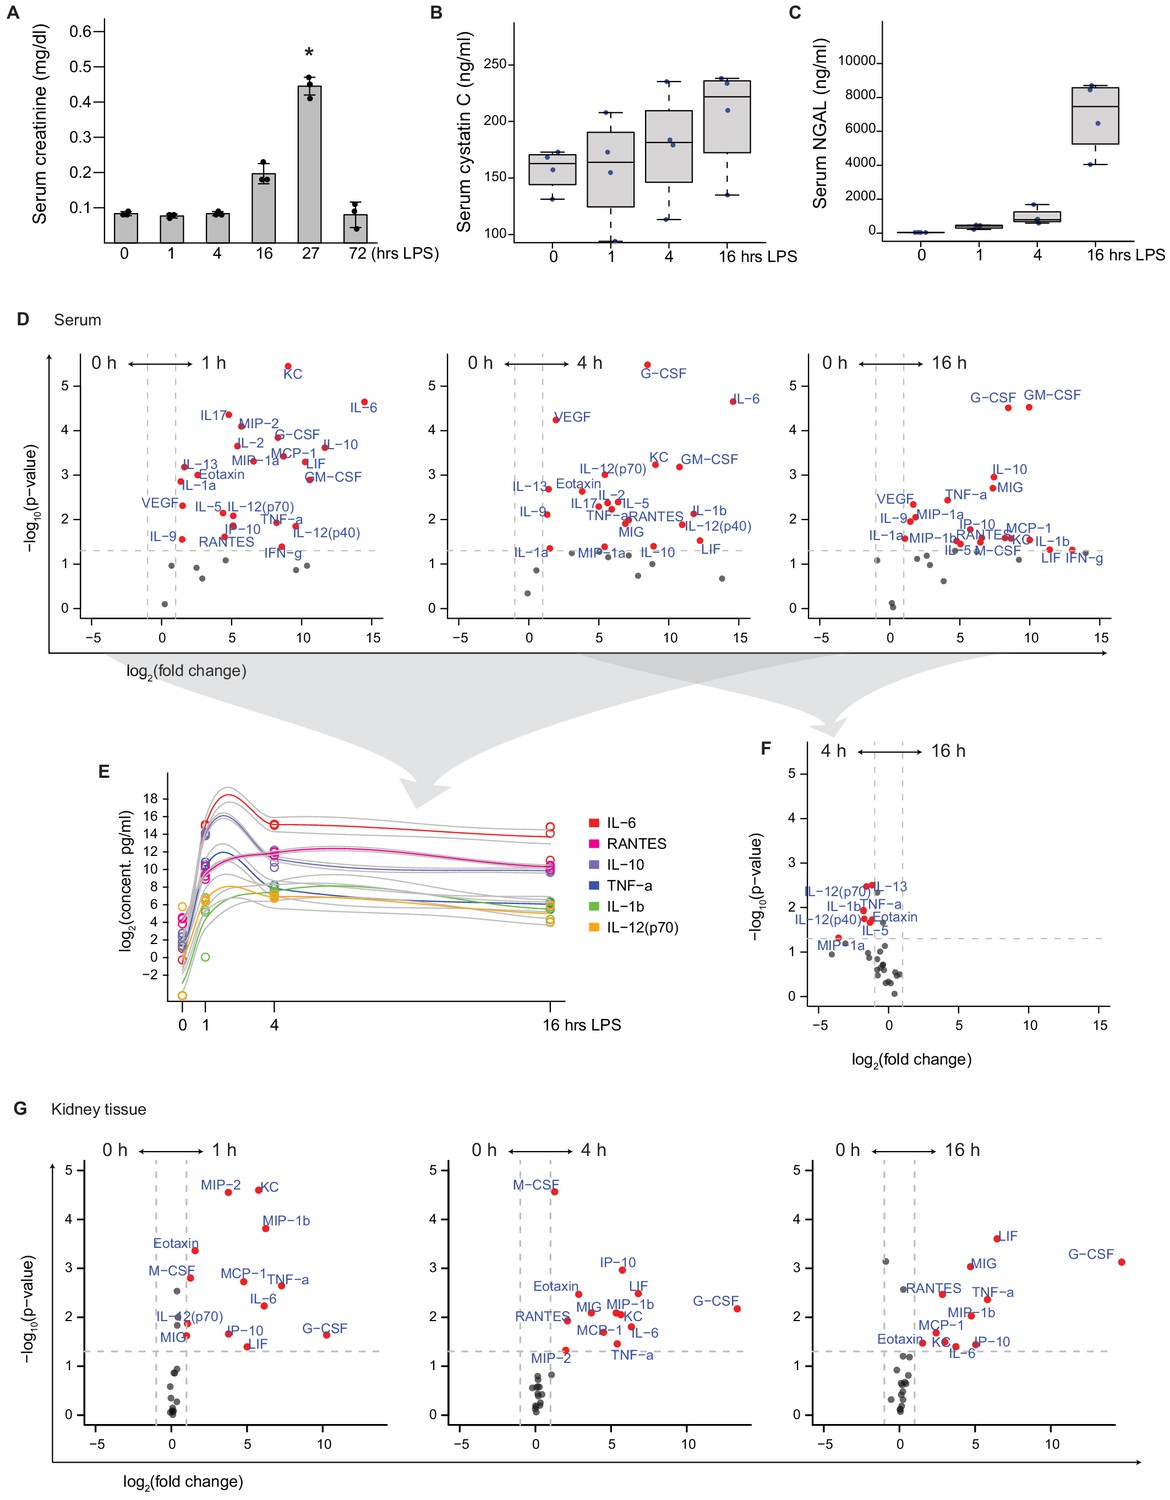
Serum biomarkers and chemokine/cytokine levels.
(A) Serum creatinine levels at indicated time points after 5 mg/kg LPS i.v. n = 3, *p<0.05 vs other time points. (B, C) Serum cystatin C and NGAL levels. n = 4. (D–F) Comparison of serum chemokine/cytokine levels under indicated time points after 5 m/gkg LPS i.v. as determined by 32 multiplex assay (Milliplex, n = 4 per time point). (G) Bulk kidney tissue chemokine/cytokine levels.
Author response image 1
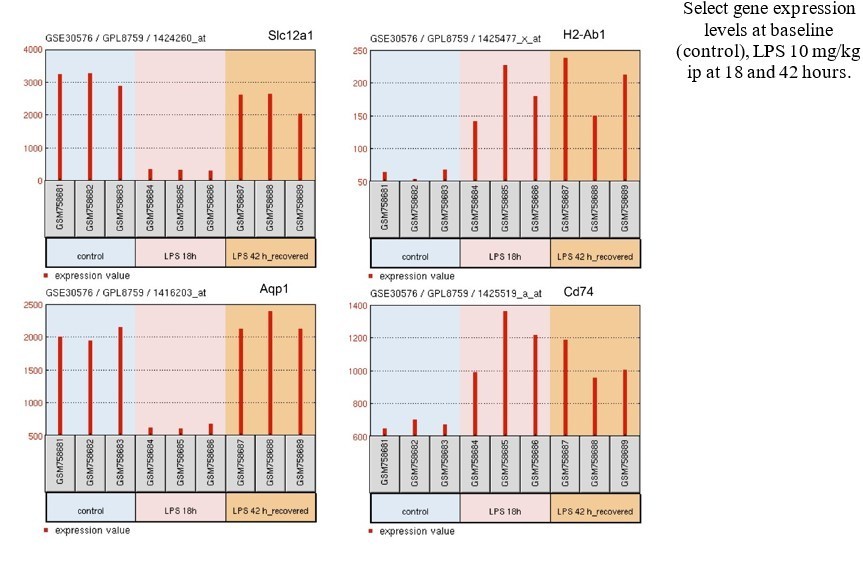
Bulk kidney microarray data.
Author response image 2
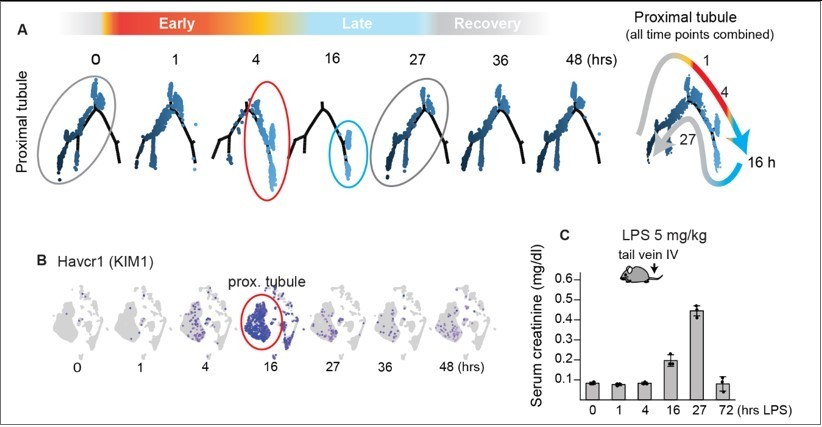
Timeline of murine LPS model.
(A) Adapted from Figure 4. Single-cell RNA-seq data demonstrating overall time-dependent gene expression changes in proximal tubules after LPS challenge. Proximal tubules exhibit major phenotypic changes at 4 hrs (red circle) and they show the most extreme phenotype at 16 hrs (blue circle). By 27 hrs, the overall phenotype returns toward baseline, suggesting that tubules are in recovery phase (gray circles). (B) Changes in gene expression levels of Kidney Injury Marker 1/KIM1 (an AKI biomarker). (C) Serum creatinine levels exhibit known lag (Adapted from Figure 7—figure supplement 2).
Tables
Key resources table
| Reagent type (species) or resource | Designation | Source or reference | Identifiers | Additional information |
|---|---|---|---|---|
| Commercial assay, kit | RNAscope probe-Mm-Agt | Advance Cell Diagnosis | Cat. No. 426941 | |
| Commercial assay, kit | RNAscope probe-Mm-Aqp1 | Advance Cell Diagnosis | Cat. No. 504741-C2 | |
| Commercial assay, kit | Milliplex MAP Mouse Cytokine/Chemokine Magnetic Bead Panel–Premixed 32 Plex | Millipore | Cat. No. MCYTMAG-70K-PX32 | |
| Commercial assay, kit | Annexin V dead cell removal kit | Stem Cell Technologies | Cat. No. 17899 | |
| Commercial assay, kit | Multi-Tissue Dissociation Kit 2 | Miltenyi Biotec | Cat. No. 130-110-203 | |
| Commercial assay, kit | Chromium Single Cell 3' Library and gel bead kit | 10x Genomics | Cat. no. 1000121 | |
| Commercial assay, kit | NovaSeq 6000 S1 reagent kit | Illumina | Cat. No. 20012865 | |
| Commercial assay, kit | Visium Spatial Gene Expression library preparation slide | 10x Genomics | Cat. No. 1000200 | |
| Chemical compound, drug | Red blood cell lysing buffer Hybri-Max | Sigma | Cat. No. R7757 | |
| Antibody | NFkB P65 (D14E12 rabbit monoclonal) | Cell Signaling | Cat. 8242S | |
| Chemical compound, drug | CldU | Sigma | Cat. C6891 | |
| Strain, strain background (Escherichia coli) | LPS E. coli serotype o111:B4 | Sigma | Cat. No. L2630 Lot No. 095M4163V | |
| Biological samples | Human renal biopsy bulk AKI RNAseq data | PMID:30507610 | GEO: GSE122274 | |
| Software, algorithm | Monocle | Cao et al., 2019 | PMID:30787437 | |
| Software, algorithm | Seurat | Stuart et al., 2019; Butler et al., 2018 | RRID:SCR_016341 | https://satijalab.org/ |
| Software, algorithm | SCENIC | Aibar et al., 2017 | PMID:28991892 | |
| Software, algorithm | Cellphone DB | Efremova et al., 2020; Vento-Tormo et al., 2018 | https://www.cellphonedb.org/ | |
| Software, algorithm | RNA velocity | La Manno et al., 2018 | PMID:30089906 | |
| Software, algorithm | SingleR | Aran et al., 2019 | PMID:30643263 | |
| Software, algorithm | Harmony and Palantir | Nowotschin et al., 2019; Setty et al., 2019 | PMID:30959515 PMID:30899105 | |
| Software, algorithm | R | R Project for Statistical Computing | RRID:SCR_001905 | http://www.r-project.org/ |
| Commercial protocol | RNAscope multiplex Fluorescent Reagent Kit v2 | Advance Cell Diagnosis Inc | ||
| Other | Dead cell removal protocol using Annexin V | https://cdn.stemcell.com/media/files/pis/DX21956-PIS_1_0_1.pdf?_ga=2.34218465.1547447083.1547219505%E2%80%93776976877.1534951026 | Commercial protocol | |
| Other | Chromium Single Cell 3’ Reagent Kits V3 User Guide | https://assets.ctfassets.net/an68im79xiti/51xGuiJhVKOeIIceW88gsQ/1db2c9b5c9283d183ff4599fb489a720/CG000183_ChromiumSingleCell3__v3_UG_Rev-A.pdf | Commercial protocol | |
| Other | Dissociation of mouse kidney using the Multi Tissue Dissociation Kit 2 | https://www.miltenyibiotec.com/upload/assets/IM0015569.PDF | Commercial protocol |
Additional files
-
Supplementary file 1
Cluster-defining markers.
- https://cdn.elifesciences.org/articles/62270/elife-62270-supp1-v1.xlsx
-
Supplementary file 2
Receptor-ligand interaction.
- https://cdn.elifesciences.org/articles/62270/elife-62270-supp2-v1.xlsx
-
Supplementary file 3
SCENIC regulon activity.
- https://cdn.elifesciences.org/articles/62270/elife-62270-supp3-v1.xlsx
-
Supplementary file 4
Differentially expressed genes for each time point across the mouse endotoxemia timeline.
- https://cdn.elifesciences.org/articles/62270/elife-62270-supp4-v1.xlsx
-
Supplementary file 5
Human kidney biopsy data.
- https://cdn.elifesciences.org/articles/62270/elife-62270-supp5-v1.xlsx
-
Supplementary file 6
Human kidney biopsy data: genes used for generating Figure 7D heatmap.
- https://cdn.elifesciences.org/articles/62270/elife-62270-supp6-v1.xlsx
-
Transparent reporting form
- https://cdn.elifesciences.org/articles/62270/elife-62270-transrepform-v1.pdf
Download links
A two-part list of links to download the article, or parts of the article, in various formats.
Downloads (link to download the article as PDF)
Open citations (links to open the citations from this article in various online reference manager services)
Cite this article (links to download the citations from this article in formats compatible with various reference manager tools)
The orchestrated cellular and molecular responses of the kidney to endotoxin define a precise sepsis timeline
eLife 10:e62270.
https://doi.org/10.7554/eLife.62270


