Virus infection of the CNS disrupts the immune-neural-synaptic axis via induction of pleiotropic gene regulation of host responses
- Laboratory of Infectious Diseases, National Institute of Allergy and Infectious Diseases, National Institutes of Health, United States
- Research Technologies Branch, Genomics Unit, National Institute of Allergy and Infectious Diseases, National Institutes of Health, United States
- Infectious Disease Pathogenesis Section, Comparative Medicine Branch, National Institute of Allergy and Infectious Diseases, National Institutes of Health, United States
Figures
Figure 1
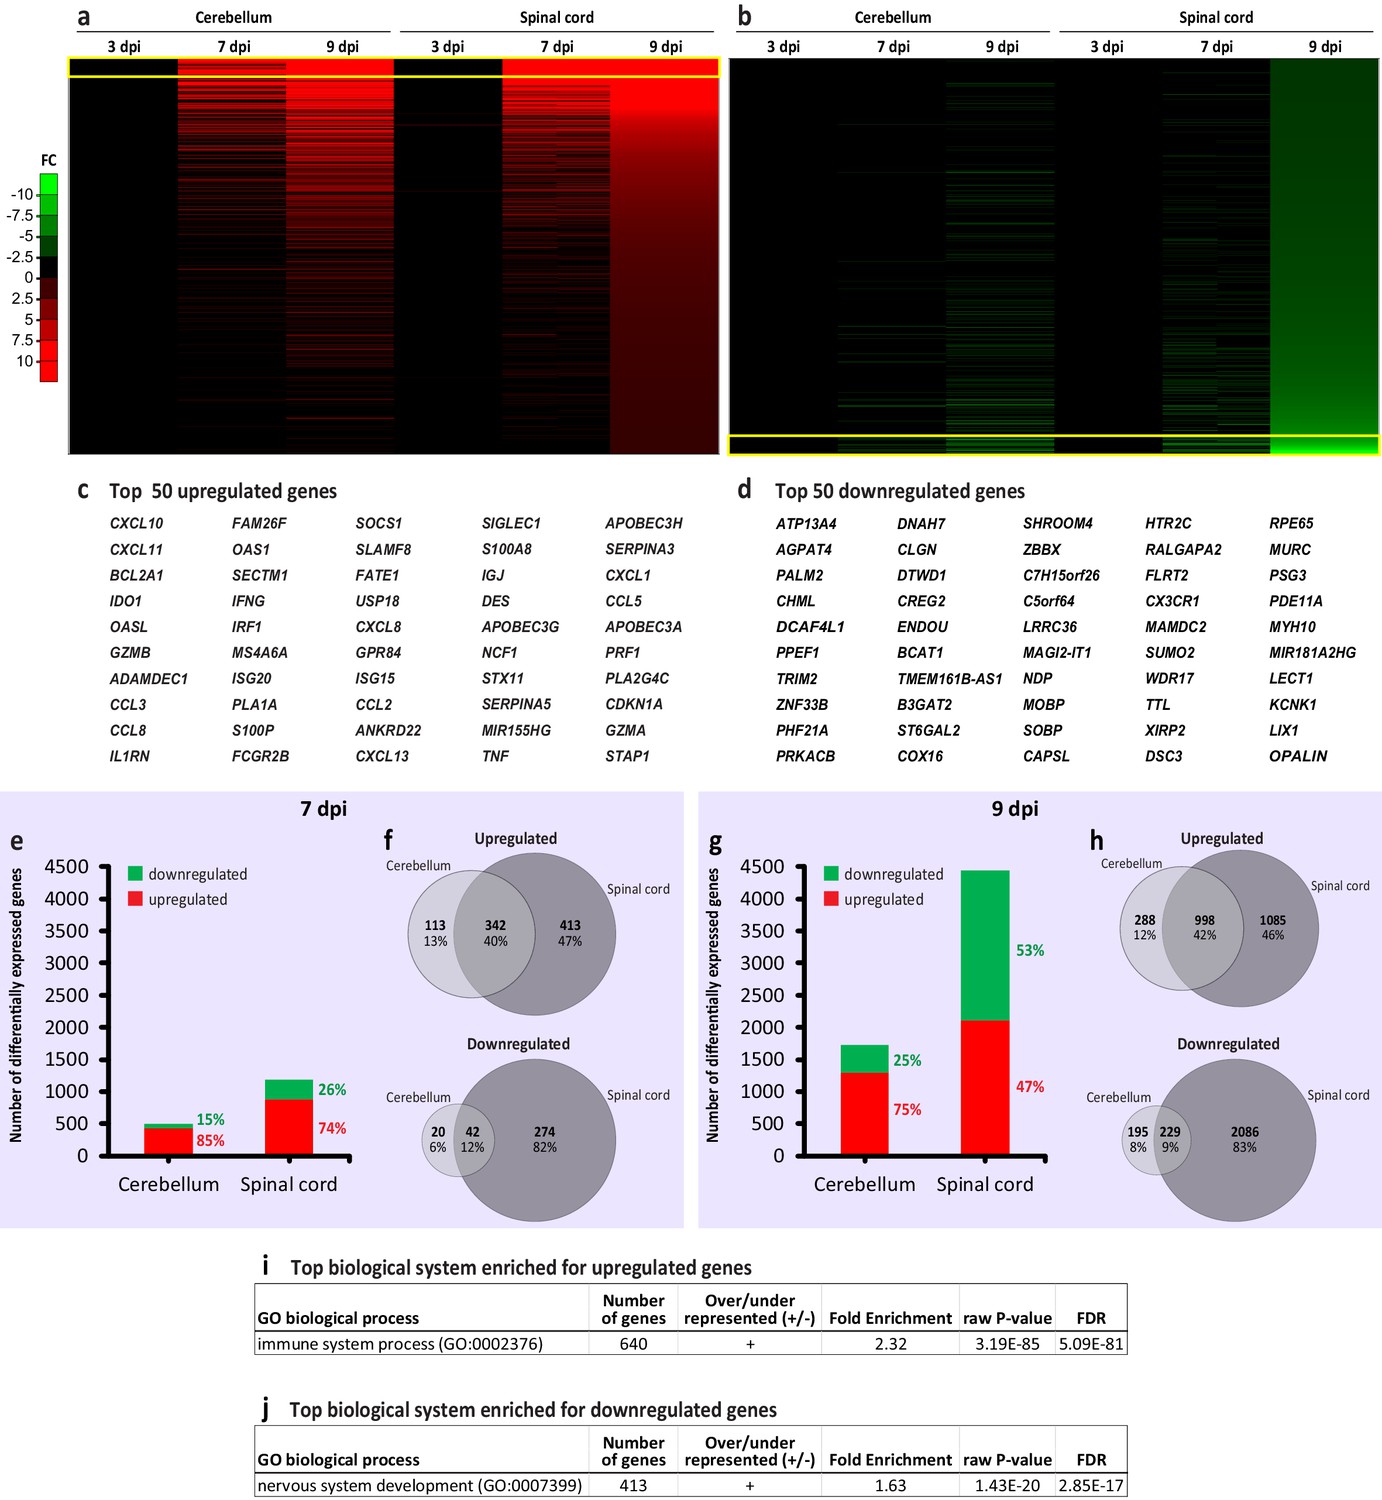
Transcriptional changes during progression of West Nile virus neurological disease (WNV-ND) converge on the immune and nervous system processes in a central nervous system (CNS)-region-specific manner.
(a and b) Heatmaps for the upregulated (a) or downregulated (b) genes in the cerebellum and spinal cord at indicated days post-inoculation (dpi) with WNV (three animals per time point for each CNS region); based on the fold change (FC) over mock (one animal per time point, pooled). The arbitrary threshold for the visualization is −10 to 10 FC. (c and d) Listed are the top 50 upregulated or downregulated genes that correspond to the yellow boxed areas in a and b, respectively. (e–h) Ratios of the upregulated to downregulated genes (e and g) and Venn diagram comparison of the upregulated and downregulated genes (f and h) in the cerebellum and spinal cord during indicated stages of WNV-ND. (i and j) Identification of the top biological systems significantly enriched for the upregulated (i) or downregulated genes (j) by ORT. FDR, false discovery rate.
Figure 2
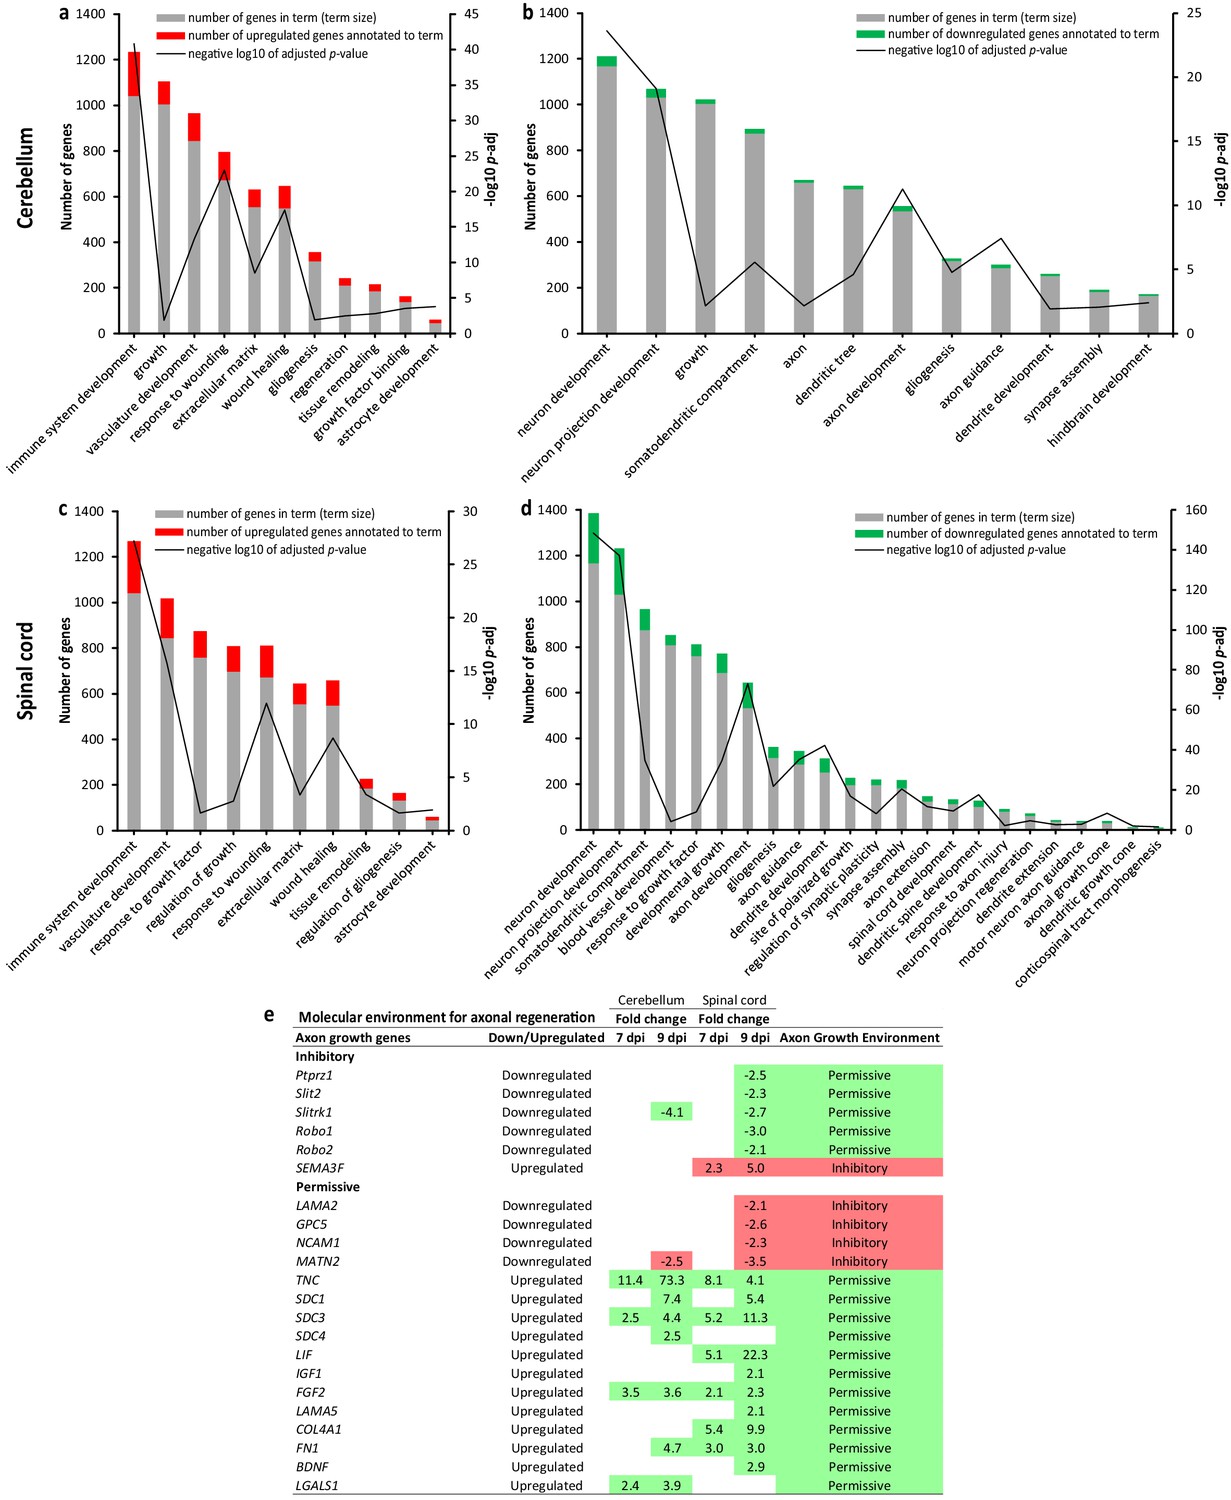
West Nile virus (WNV) infection alters transcriptional regulation of the developmental and repair processes in the central nervous system (CNS).
(a–d) Enrichment of the developmental process and/or repair in WNV-infected cerebellum (a and b) and spinal cord (c and d) based on the ratios between GO term size (number of genes in term) and intersection size (number of differentially expressed genes annotated to term) at the advanced-symptomatic stage of WNV neurological disease (WNV-ND; 9 dpi). (e) Dissection of the molecular environment for axonal regeneration based on the differential transcriptional regulation of the molecules with established inhibitory or permissive roles in the regulation of axon growth.
Figure 3

Visualization of the affected immune and neuronal system pathways during symptomatic stages of West Nile virus neurological disease (WNV-ND).
(a and b) Reference Reactome biological domain bursts for the immune system (a) and neuronal system (b). Each reference burst visualizes the pathways specific to a respective biological system. The largest central node of each burst corresponds to the uppermost level of the domain hierarchy and successive concentrically positioned nodes and arcs represent more specific pathway levels. The major pathway nodes are indicated for each system. (c–j) Diagrams illustrate the coverage of reference bursts for the immune system (c), (d), (g), and (h) or neuronal system (e), (f), (i), and (j) by pathways affected during the early-symptomatic (7 dpi) and advanced-symptomatic (9 dpi) stages of WNV-ND in the cerebellum (c–f) or spinal cord (g–j). Each diagram (c–j) displays the enriched pathway coverage by overlaying the reference domain bursts (light pink) with an orange gradient color based on the p-values derived from an overrepresentation test (reference gradient is provided in each diagram based on the range of p-values from 0 to 0.05; darker colors indicate smaller p-values). Select nodes/pathways are enumerated and listed in the legends at the bottom of the figure.
Figure 4
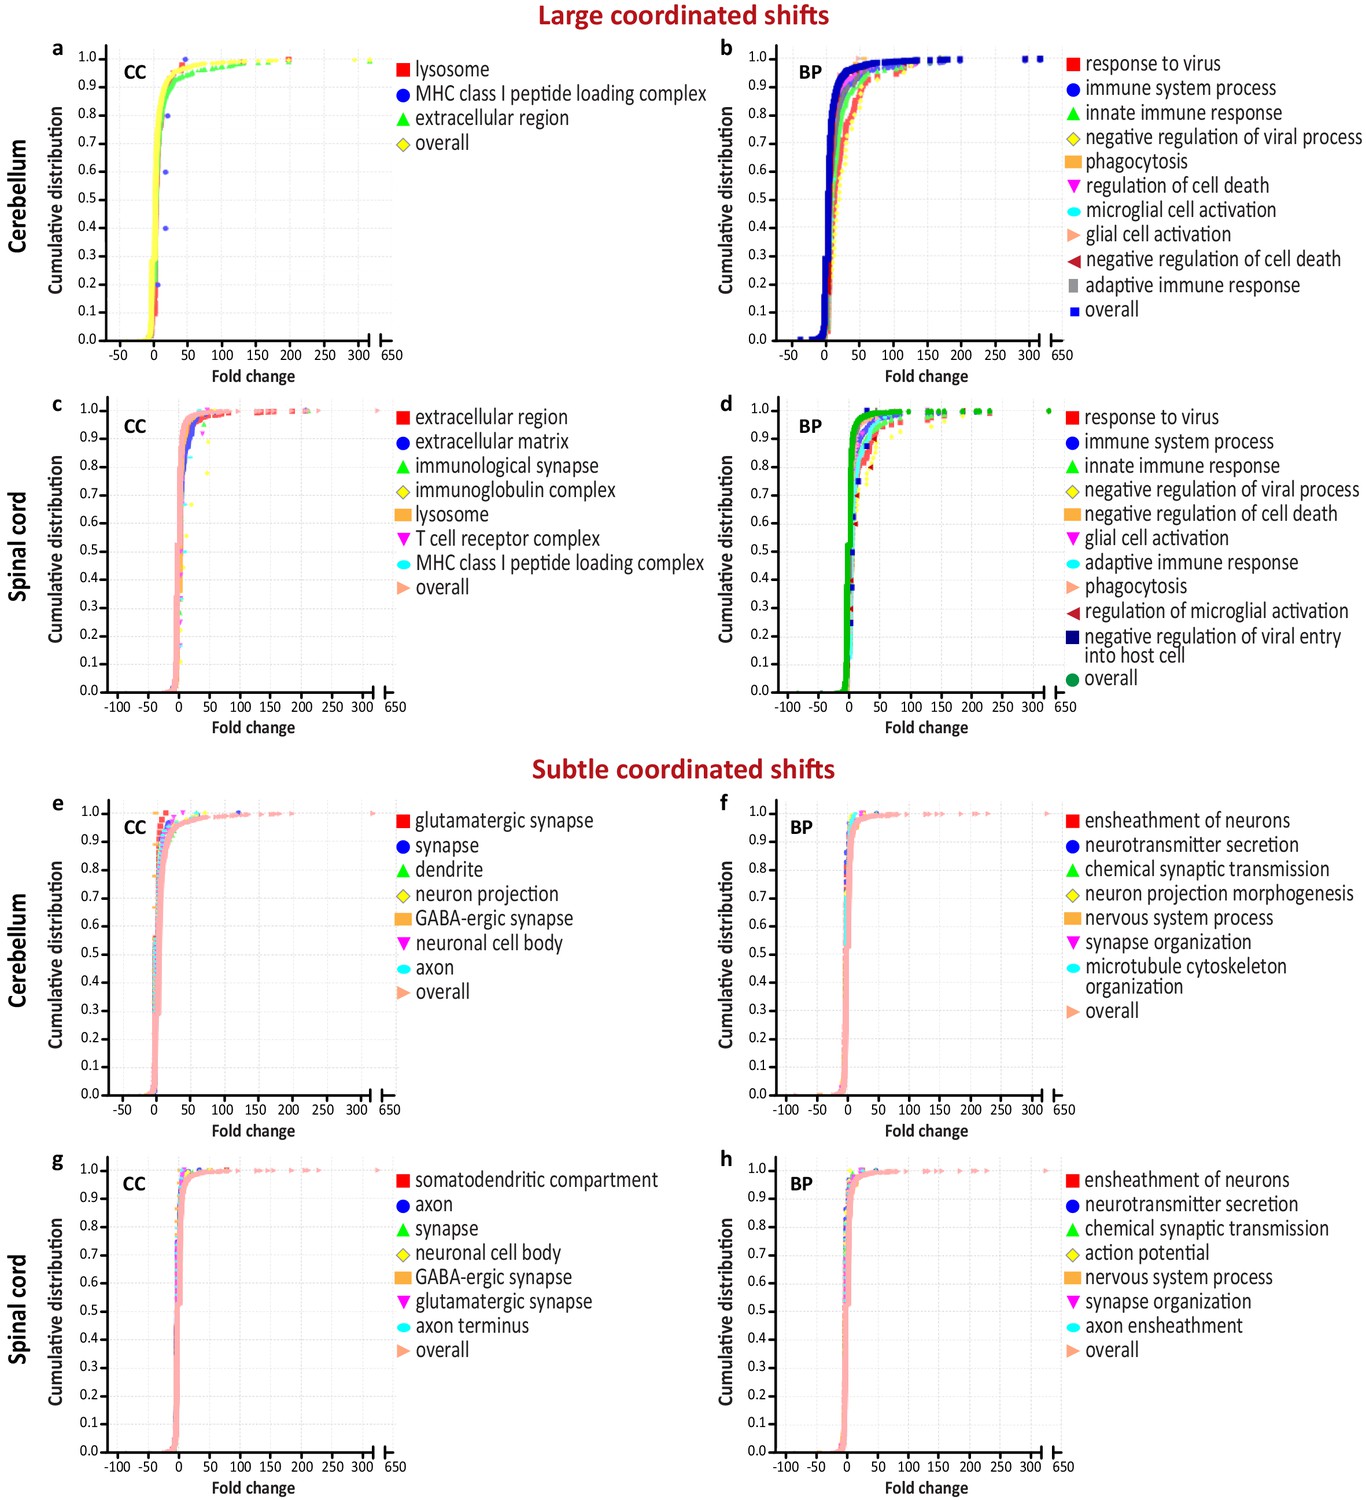
Coordinated transcriptional shifts during the advanced-symptomatic stage of West Nile virus neurological disease (WNV-ND).
(a–h) Graphs show the cumulative distribution of fold change values for groups of differentially expressed genes and select large coordinated shifts from the overall distribution (predominantly under the curve) (a–d) or subtle coordinated shifts from the overall distribution (predominantly above the curve) (e–h) in the cerebellum (a), (b), (e), and (f) and spinal cord (c), (d), (g), and (h). Significantly enriched GO terms (FDR < 0.05) for the plotted groups of genes are shown in the corresponding legends. BP, biological process; CC, cellular component; GO, gene ontology.
Figure 5
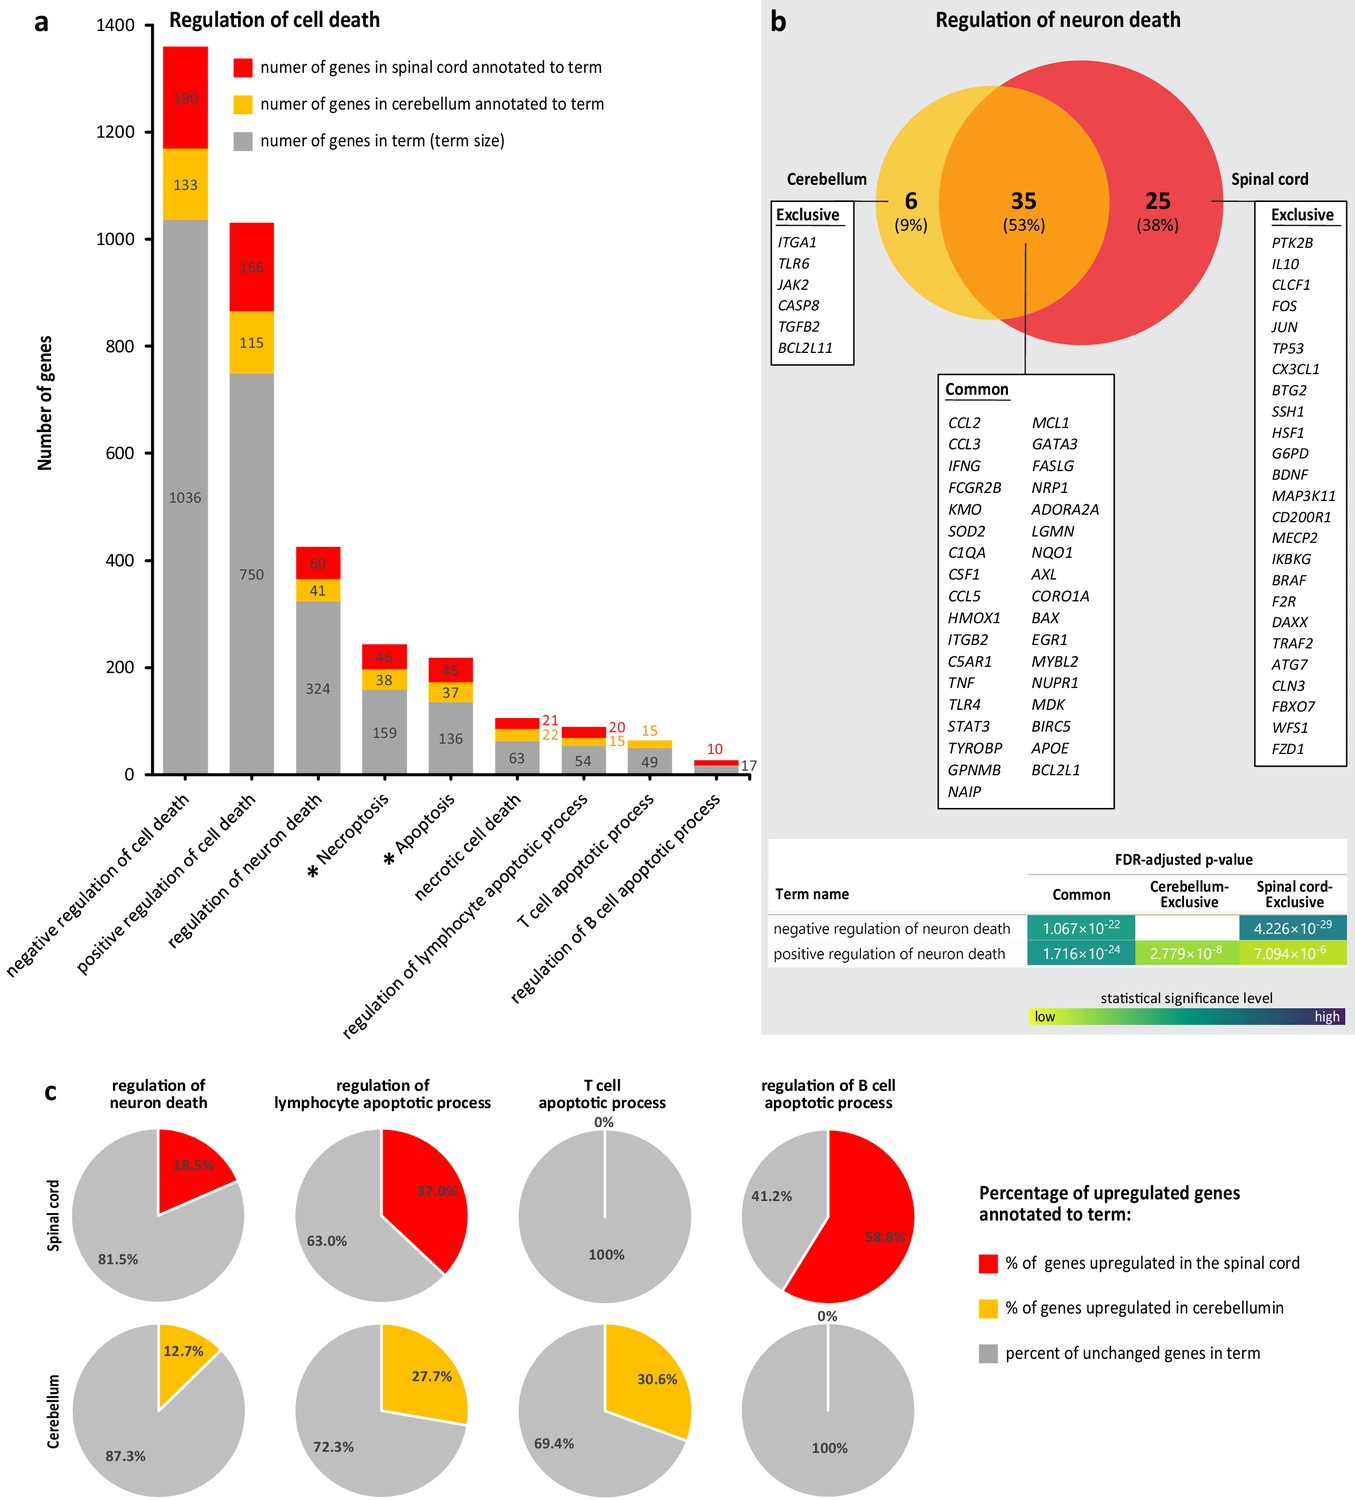
Dissection of transcriptional regulation of cell death processes during advanced-symptomatic West Nile virus neurological disease (WNV-ND).
(a) Comparative analysis of the number of upregulated genes annotated to significantly enriched (FDR < 0.05) terms associated with cell death processes (BP GO terms) and pathways (KEGG pathways; asterisks) in the cerebellum and spinal cord (numbers of upregulated genes annotated to each term and term sizes are indicated). (b) Venn diagram comparison of the upregulated genes annotated to the term ‘regulation of neuron death’ in the cerebellum and spinal cord with functional characterization of each indicated gene set (gene symbols and statistical details for enriched GO BP terms are provided for each component of Venn diagram; blank: not significant). (c) Percentages of genes in indicated cell-specific terms of interest that were upregulated in WNV-ND relative to the term size (calculated from data in a).
Figure 6
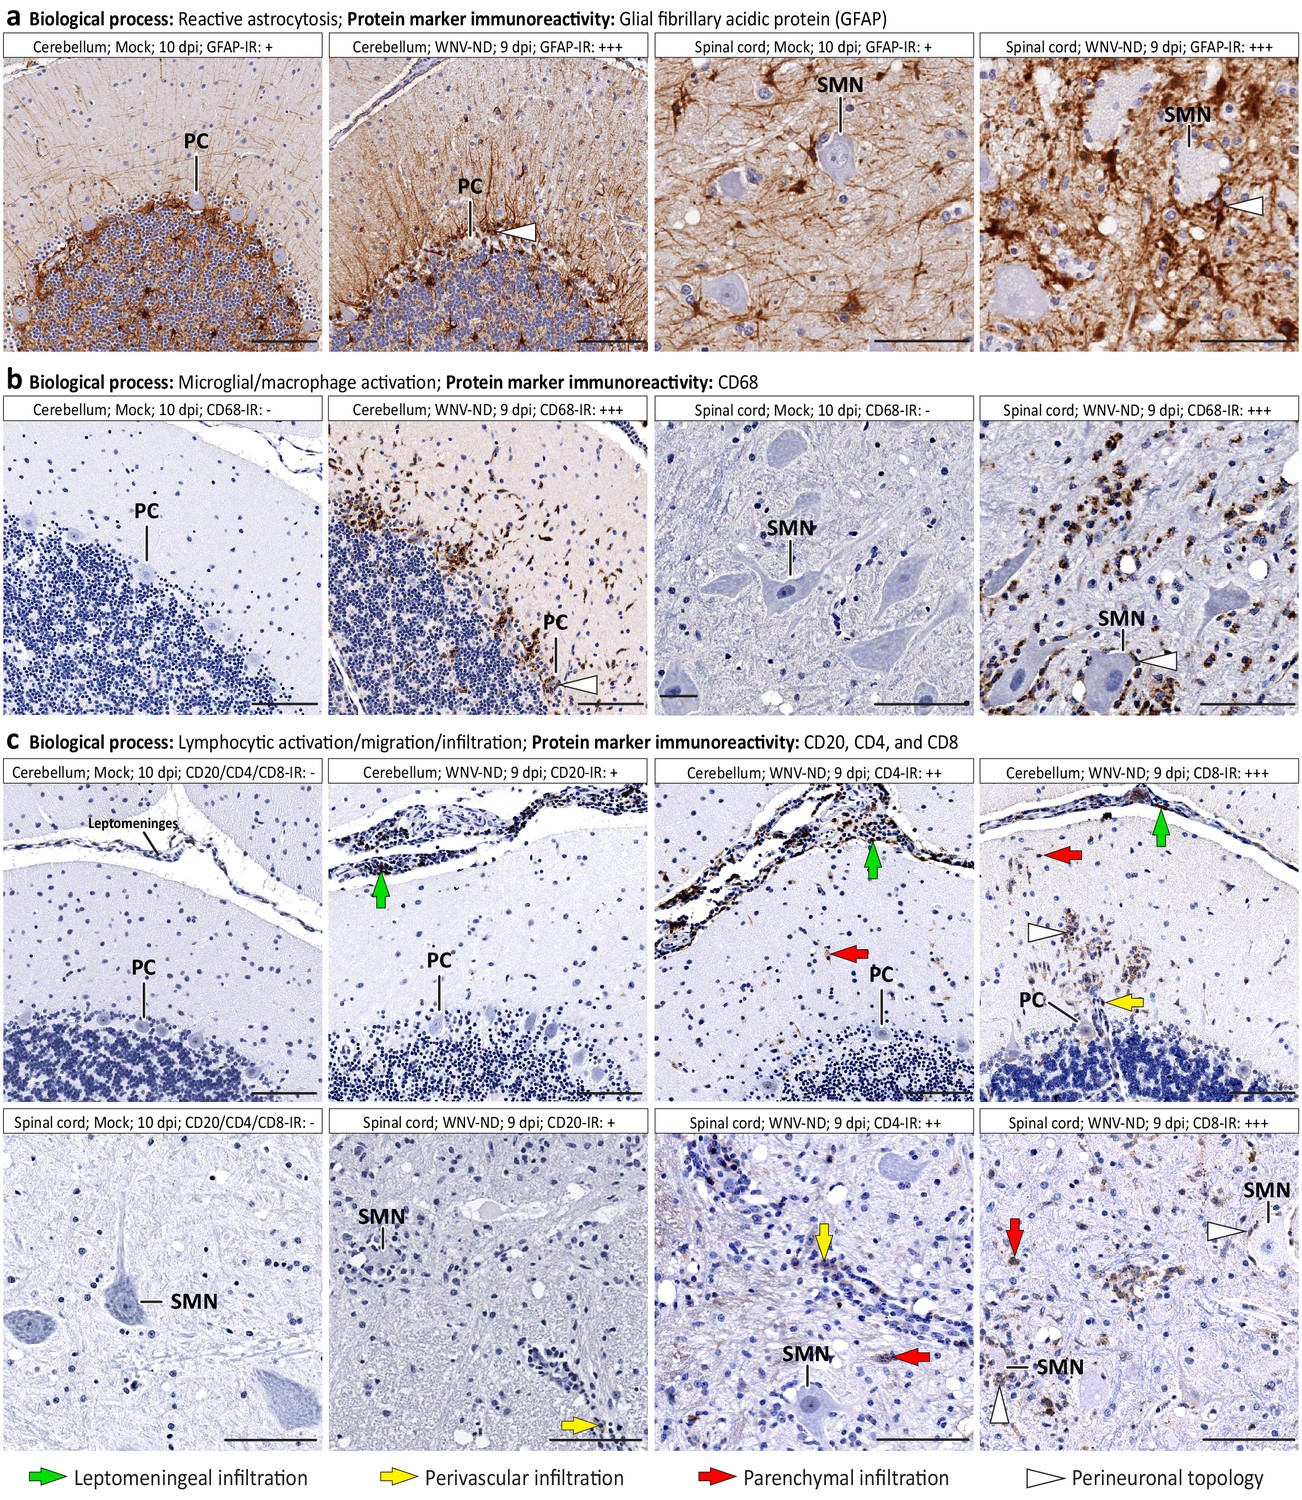
Immune cell morphology and topology during advanced-symptomatic West Nile virus neurological disease (WNV-ND).
Representative images illustrate major cellular immune responses (indicated in a–c) by displaying immunoreactivity (IR) for relevant protein markers (brown) in WNV-infected cerebellum and spinal cord versus mock. Labeling keys are provided at the bottom of the figure. Semi-quantitative assessment of the IR is as follows: -, negative; +, minimal; ++; moderate; +++, strong. PC, Purkinje cell. SMN, spinal motor neuron. Scale bars: 100 μm.
Figure 7
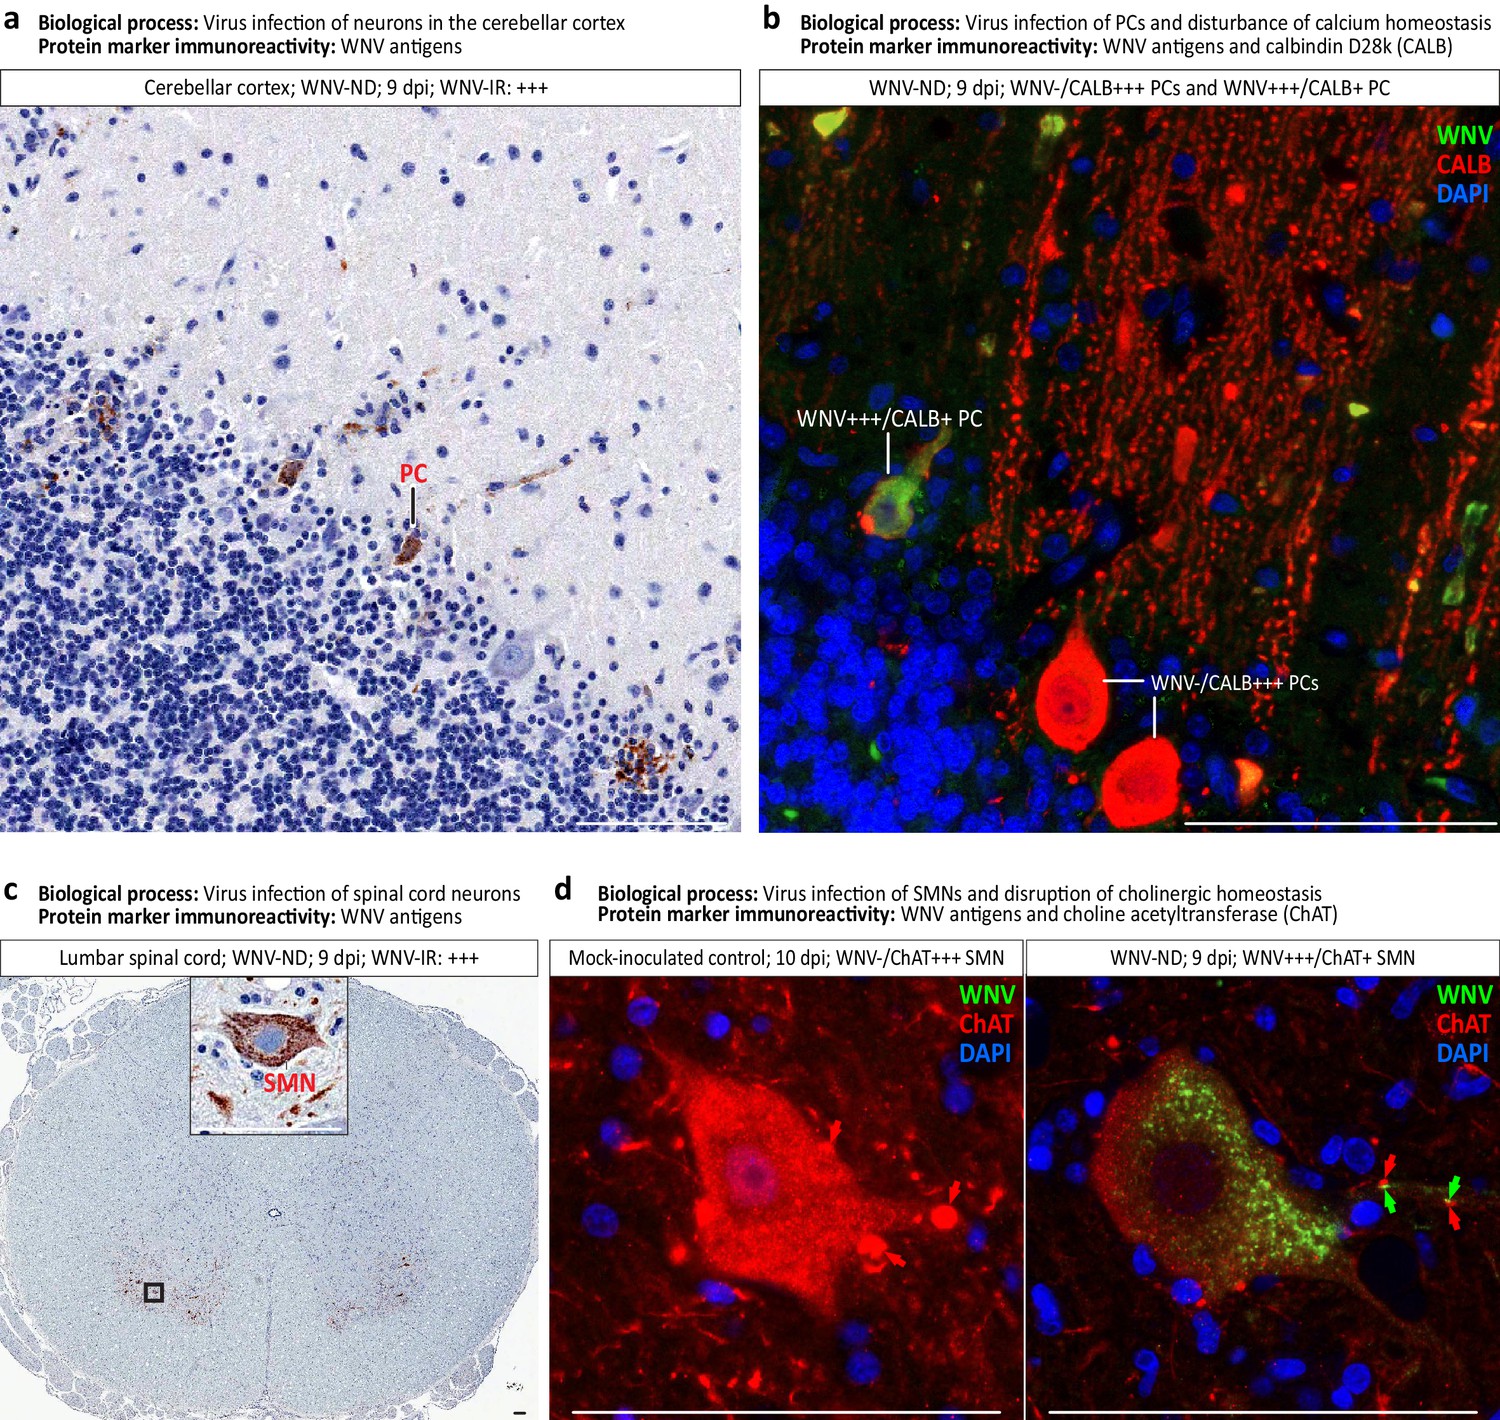
Virus-infected neuronal cell types and loss of neuronal cell-specific protein markers in West Nile virus neurological disease (WNV-ND).
(a–d) Representative images illustrate identification of the types of neurons infected with WNV in the cerebellar cortex (a and b) and ventral horns of the gray matter in the spinal cord (c and d). Viral infection of specific neuronal types as a major biological process, and immunoreactivity (IR) for each protein marker ((a) and (c): brown; (b) and (d): colors are indicated in top-right corners) are provided for each panel. Red arrows in (d) indicate the ChAT-positive cholinergic presynaptic C-boutons innervating the somata and proximal dendrites of SMNs. Green arrows in (d) point to focal accumulations of WNV+++ granules in the proximal dendrites of WNV-infected SMN. Note that WNV+++ granules are immediately adjacent to few remaining ChAT+ C-boutons. Semi-quantitative assessment of the IR is as follows: -, negative; +, minimal; ++; moderate; +++, strong. PC, Purkinje cell. SMN, spinal motor neuron. Scale bars: 100 μm.
Figure 8
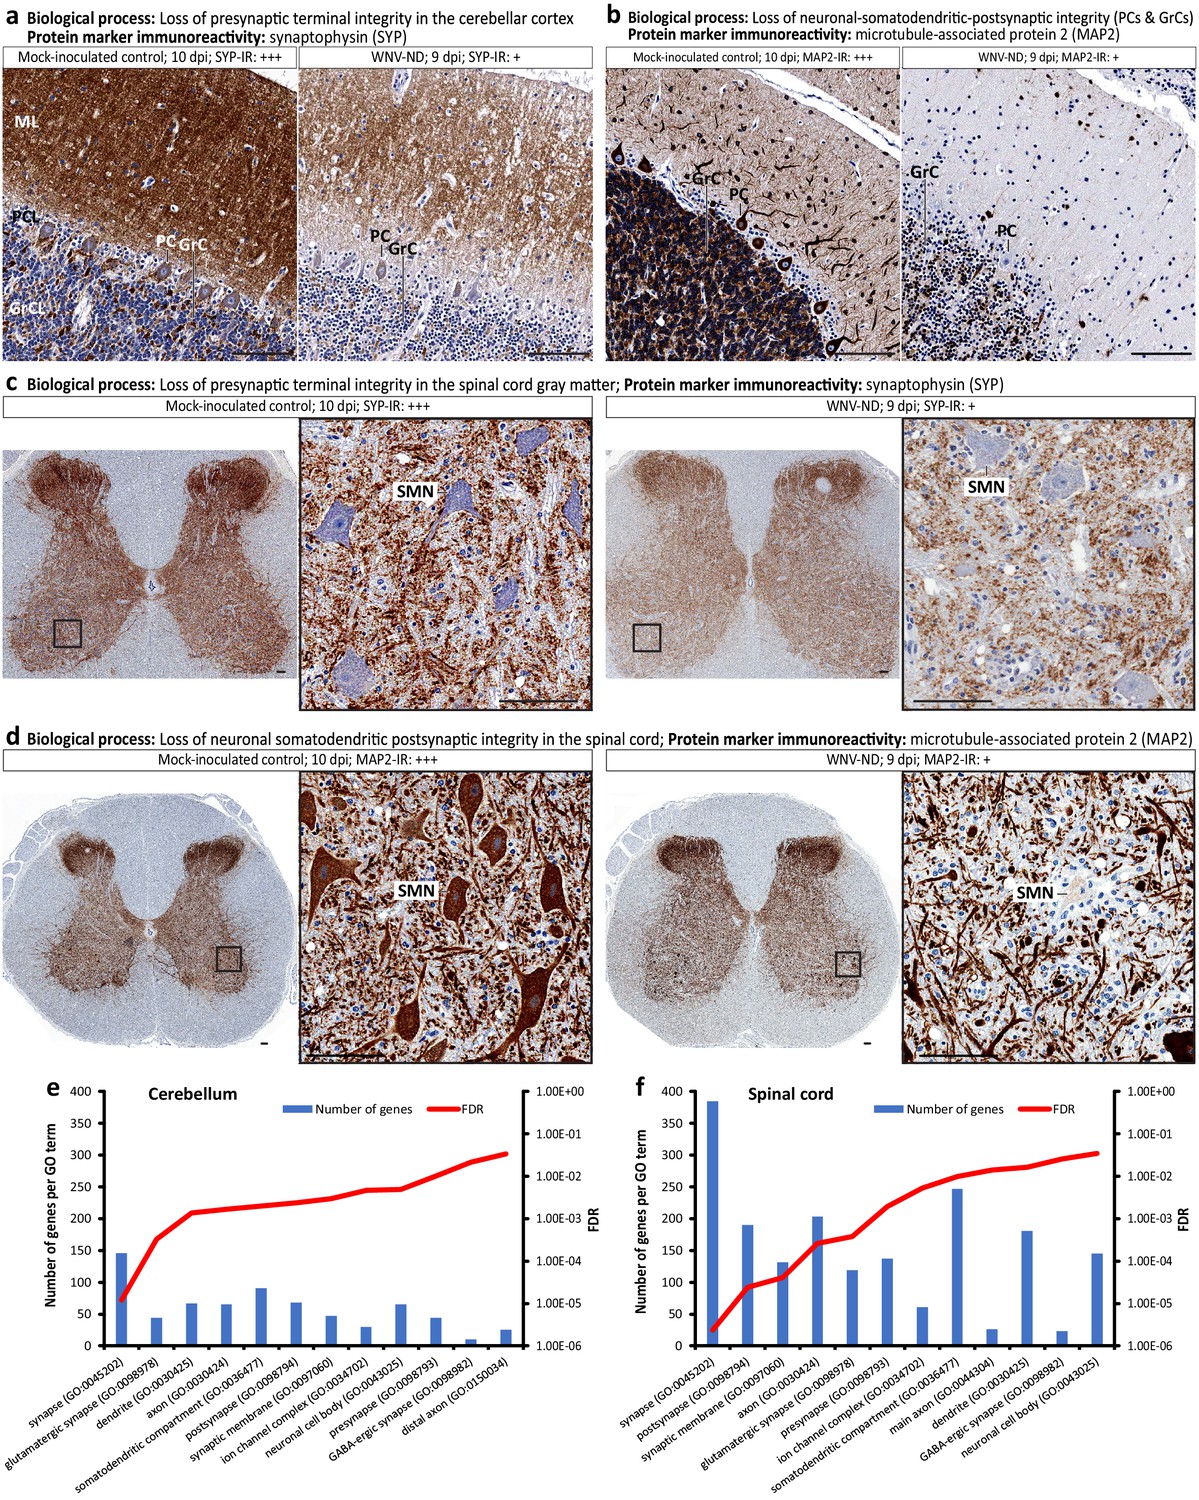
Loss of neuronal cell structural organization and function during advanced-symptomatic West Nile virus neurological disease (WNV-ND).
(a–d) Representative images illustrate major pathological processes in the cerebellar cortex and spinal cord gray matter (indicated above each panel) by displaying the immunoreactivity (IR) for relevant protein markers (brown) in WNV-infected cerebellum and spinal cord versus mock-inoculated control. Semi-quantitative assessment of the IR is as follows: -, negative; +, minimal; ++; moderate; +++, strong. (e and f) Ranking of neuronal CC GO terms based on their enrichment values in the cerebellum (e) and spinal cord (f) at the advanced-symptomatic stage (9 dpi) of WNV-ND. Plotted for each CC GO term (x-axes) are the number of differentially expressed genes (left y-axes) and FDR-adjusted p-values (right y-axes). ML, molecular layer. PCL, Purkinje cell layer. GrCL, granule cell layer. PC, Purkinje cell. GrC, granule cell. SMN, spinal motor neuron. Scale bars: 100 μm.
Figure 9

Visualization of transcriptional dysregulation of the synaptic organization and function in West Nile virus neurological disease (WNV-ND).
(a and b) Reference sunburst diagrams for synaptic location (a) and synaptic function (b) gene ontologies (GOs). The top-level GO terms ‘synapse’ and ‘process in synapse’ are at the center of corresponding sunbursts. GO terms representing major synaptic subcompartments (a) or synaptic functions (b) are positioned in the next level from the center, color-coded and shown in the legends. Child GO terms are positioned in the successive rings and colored by progressively darkening hues. (c–f) Transcriptional synaptic dysregulation in the cerebellum (c and d) and spinal cord (e and f) is visualized by the overlaying reference sunbursts with a color based on the -log10 Q values (FDR corrected raw p-values) for enriched synaptic GO terms. Specific synaptic GO terms are listed in Table 2. Stringent high-level evidence SynGO settings were applied.
Figure 10
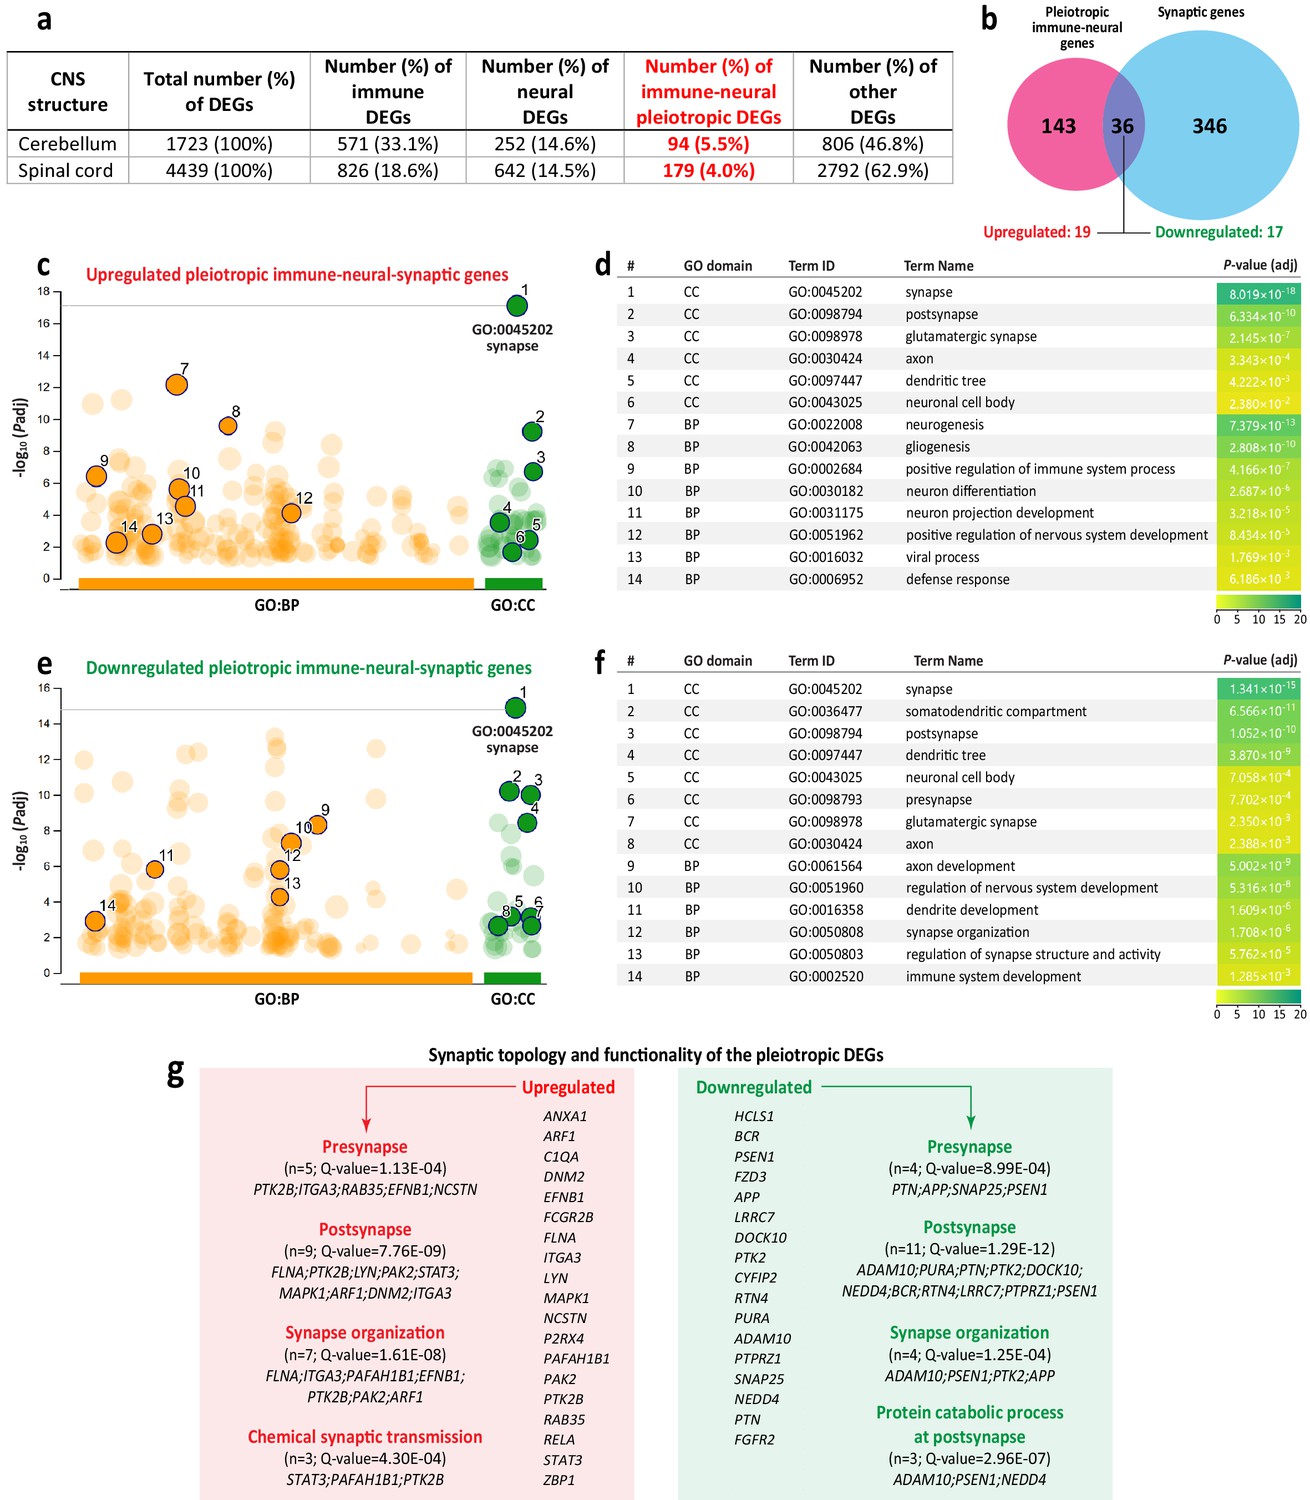
Identification and functional analysis of pleiotropic immune-neural-synaptic genes induced by West Nile virus (WNV) infection.
(a) Distribution of differentially expressed genes (DEGs) annotated to the immune or nervous system, or both (immune-neural pleiotropic DEGs; highlighted in red), relative to the total number of DEGs in indicated central nervous system (CNS) structures at the advanced-symptomatic stage of WNV neurological disease (WNV-ND). (b) Venn diagram shows the overlap (n = 36) between the immune-neural pleiotropic and synaptic DEGs in the spinal cord at the advanced-symptomatic stage of WNV-ND (numbers of the up- or downregulated genes in the overlap are indicated). (c–f) Select significantly enriched BP and CC GO terms (orange and green solid circles, respectively) and their respective statistical data (identified using gProfiler) for the upregulated (c and d) or downregulated (e and f) immune-neural-synaptic pleiotropic DEGs. (g) Gene symbols, significantly enriched SynGO terms, and respective statistical data for immune-neural-synaptic pleiotropic DEGs.
Tables
Table 1
Dissection of West Nile virus (WNV)-induced coordinated transcriptional shifts at the protein marker and cell morphology/ topology/function levels.
| Biological process | Enriched GO terms | Protein marker IR* | Cellular morphology/topology/function | Representative images |
|---|---|---|---|---|
| Reactive astrocytosis | glial cell activation (GO:0061900); regulation of cell migration (GO:0030334) | GFAP ↑ | Astrocytes: hypertrophy of somata and processes; neuron-centripetal migration; perineuronal topology | Figure 6a |
| Microglia/macrophage activation and migration | innate immune response (GO:0045087); glial cell activation (GO:0061900); regulation of cell migration (GO:0030334); regulation of microglial cell activation (GO:1903978); macrophage activation (GO:0042116); regulation of macrophage chemotaxis (GO:0010758); phagocytosis (GO:0006909); lysosome (GO:0005764) | CD68 ↑ | Microglial cells: hypertrophy of somata and processes; neuron-centripetal migration; perineuronal topology; phagocytic activity | Figure 6b |
| Lymphocytic activation, migration, and infiltration | adaptive immune response (GO:0002250); lymphocyte activation (GO:0046649); lymphocyte migration (GO:0072676); B cell mediated immunity (GO:0019724); regulation of T cell mediated immunity (GO:0002709); regulation of CD4-positive, alpha-beta T cell activation (GO:2000514); regulation of CD8-positive, alpha-beta T cell activation (GO:2001185) | CD20 ↑ | B cells: leptomeningeal infiltration in the cerebellar cortex; perivascular infiltration if the spinal cord gray matter; no parenchymal migration | Figure 6c |
| CD4 ↑ | T helper cells: leptomeningeal infiltration; perivascular infiltration; minimal parenchymal migration | Figure 6c | ||
| CD8 ↑ | Cytotoxic T lymphocytes: leptomeningeal infiltration; perivascular infiltration; parenchymal infiltration; neuron-centripetal migration; perineuronal topology | Figure 6c | ||
| Virus infection of specific neuronal cell types | negative regulation of viral process (GO:0048525); regulation of viral entry into host cell (GO:0046596) | WNV-Ag positivity | Purkinje cells (PCs; CALB-positive): presence of viral antigens in neuronal perikarya and processes Spinal motor neurons (SMNs; ChAT-positive): presence of viral antigens in neuronal perikarya and processes | Figure 7a and b Figure 7c and d |
| Disruption of structural integrity and function of infected neurons | neuronal cell body (GO:0043025); somatodendritic compartment (GO:0036477); dendrite (GO:0030425); regulation of cytosolic calcium ion concentration (GO:0051480); cellular calcium ion homeostasis (GO:0006874); calcium ion-regulated exocytosis of neurotransmitter (GO:0048791); neurotransmitter secretion (GO:0007269); synapse (GO:0045202); neuron to neuron synapse (GO:0098984); presynapse (GO:0098793); asymmetric synapse (GO:0032279); distal axon (GO:0150034); glutamatergic synapse (GO:0098978); GABA-ergic synapse (GO:0098982); synapse organization (GO:0050808); synaptic signaling (GO:0099536); chemical synaptic transmission (GO:0007268) | CALB ↓ | Purkinje cells: decrease of CALB-IR in somatodendritic compartments of WNV-infected PCs; disturbance of cellular calcium homeostasis in infected PCs | Figure 7b |
| ChAT ↓ | Spinal motor neurons: decrease of ChAT-IR in SMN cytoplasm and synapses innervating SMNs; disruption of neurotransmitter secretion in SMNs and their afferent innervation | Figure 7d | ||
| SYP ↓ | Decrease in IR for structural constituent of synaptic vesicles (SYP-IR) in the cerebellar cortex and spinal cord. Disruption of structural integrity of presynaptic compartments. Cerebellar cortex: putatively affected synapses innervating PCs: CF-PC and PF-PC (asymmetric-glutamatergic) in ML; BC-PC (GABA-ergic) in ML and PCL; and SC-PC (GABA-ergic) in ML Spinal gray matter: putatively affected synapses innervating SMNs: cholinergic C- boutons (ChAT-IR); asymmetric-glutamatergic synapses from descending tracts; and inhibitory synapses from local inhibitory neuron networks | Figure 8a and c Figure 8a Figure 7d and Figure 8c | ||
| neuronal cell body (GO:0043025); somatodendritic compartment (GO:0036477); dendrite (GO:0030425); postsynapse (GO:0098794); microtubule cytoskeleton organization (GO:0000226) | MAP2 ↓ | Cerebellar cortex and spinal gray matter: loss of postsynaptic cellular targets for asymmetric (axodendritic) and symmetric (axosomatic) synapses; disruption of integrity of microtubule cytoskeleton | Figure 8b and d |
-
*IR, immunoreactivity. ↑ - increased compared to mock. ↓ - decreased compared to mock. GFAP, glial fibrillary acidic protein. WNV-Ag, WNV antigens. CALB, calbindin D28k. ChAT, choline acetyltransferase. SYP, synaptophysin. MAP2, microtubule associated protein 2. ML. molecular layer. PCL, Purkinje cell (PC) layer. CF-PC, climbing fiber to PC synapses. PF-PC, parallel fiber to PC synapses. BC-PC basket cell to PC synapses. SC-PC, stellate cell to PC synapses.
Table 2
Enriched GO terms for the synaptic genes dysregulated in the cerebellum and spinal cord in WNV-ND.
| GO term ID | GO domain | GO term name - hierarchical structure | Q-value | |
|---|---|---|---|---|
| Spinal cord | Cerebellum | |||
| GO:0045202 | CC | synapse | 7.13E-113 | 3.56E-35 |
| GO:0097060 | CC | ├─ synaptic membrane | 6.07E-03 | |
| GO:0098793 | CC | ├─ presynapse | 4.20E-51 | 4.19E-17 |
| GO:0099523 | CC | │ ├─ presynaptic cytosol | 7.07E-05 | 1.79E-03 |
| GO:0048786 | CC | │ ├─ presynaptic active zone | 1.52E-15 | |
| GO:0048787 | CC | │ │ └─ presynaptic active zone membrane | 3.25E-11 | 1.08E-06 |
| GO:0098833 | CC | │ ├─ presynaptic endocytic zone | 6.87E-03 | |
| GO:0008021 | CC | │ ├─ synaptic vesicle | 6.06E-05 | |
| GO:0098992 | CC | │ ├─ neuronal dense core vesicle | 4.44E-03 | |
| GO:0042734 | CC | │ ├─ presynaptic membrane | 4.46E-21 | 3.52E-10 |
| GO:0043083 | CC | ├─synaptic cleft | 5.66E-07 | 2.40E-05 |
| GO:0098794 | CC | ├─ postsynapse | 5.38E-80 | 4.68E-24 |
| GO:0099524 | CC | │ ├─ postsynaptic cytosol | 1.61E-02 | |
| GO:0099571 | CC | │ ├─ postsynaptic cytoskeleton | 2.60E-05 | |
| GO:0099572 | CC | │ ├─ postsynaptic specialization | 4.46E-44 | 4.94E-11 |
| GO:0014069 | CC | │ │ ├─ postsynaptic density | 1.73E-34 | 3.60E-08 |
| GO:0045211 | CC | │ ├─ postsynaptic membrane | 1.12E-21 | 6.60E-10 |
| SYNGO:postsyn_ser | CC | │ └─ postsynaptic SER | 3.30E-04 | |
| SYNGO:synprocess | BP | process in the synapse | 1.30E-87 | 2.74E-35 |
| SYNGO:presynprocess | BP | ├─ process in the presynapse | 4.96E-21 | 4.11E-07 |
| GO:0099509 | BP | │ ├─ regulation of presynaptic cytosolic calcium levels | 7.25E-04 | |
| GO:0099504 | BP | │ ├─ synaptic vesicle cycle | 5.53E-21 | 2.01E-04 |
| GO:0016079 | BP | │ │ ├─ synaptic vesicle exocytosis | 9.78E-13 | 3.58E-03 |
| GO:0099502 | BP | │ │ │ ├─ calcium-dependent activation of synaptic vesicle fusion | 4.74E-04 | |
| GO:2000300 | BP | │ │ │ ├─ regulation of synaptic vesicle exocytosis | 1.82E-04 | |
| GO:0016082 | BP | │ │ │ └─ synaptic vesicle priming | 4.88E-05 | |
| GO:0048488 | BP | │ │ └─ synaptic vesicle endocytosis | 6.15E-06 | |
| SYNGO:postsynprocess | BP | ├─ process in the postsynapse | 5.44E-17 | 8.45E-06 |
| GO:0099566 | BP | │ ├─ regulation of postsynaptic cytosolic calcium levels | 2.92E-03 | |
| GO:0060078 | BP | │ ├─ regulation of postsynaptic membrane potential | 2.75E-07 | 1.63E-03 |
| GO:0099072 | BP | │ ├─ regulation of postsynaptic membrane neurotransmitter receptor levels | 6.34E-08 | 1.10E-02 |
| GO:0099645 | BP | │ │ ├─ neurotransmitter receptor localization to postsynaptic specialization membrane | 1.70E-05 | |
| GO:0099149 | BP | │ │ └─ regulation of postsynaptic neurotransmitter receptor endocytosis | 9.33E-05 | |
| GO:0099537 | BP | │ ├─ trans-synaptic signaling | 1.47E-20 | 8.11E-13 |
| GO:0007268 | BP | │ │ └─ chemical synaptic transmission | 1.11E-17 | 1.43E-10 |
| GO:0050804 | BP | │ │ ├─ modulation of chemical synaptic transmission | 8.44E-11 | 1.63E-07 |
| GO:0099171 | BP | │ │ │ └─ presynaptic modulation of chemical synaptic transmission | 9.43E-05 | 7.08E-04 |
| GO:0099170 | BP | │ │ └─ postsynaptic modulation of chemical synaptic transmission | 2.89E-04 | |
| GO:0050808 | BP | ├─ synapse organization | 4.53E-45 | 4.99E-14 |
| GO:0099173 | BP | │ ├─ postsynapse organization | 5.47E-15 | 1.91E-02 |
| GO:0099010 | BP | │ │ └─ modification of postsynaptic structure | 1.92E-05 | |
| GO:0099181 | BP | │ │ ├─ structural constituent of presynapse | 1.46E-06 | |
| GO:0098882 | BP | │ │ │ ├─ structural constituent of active zone | 9.80E-06 | |
| GO:0099186 | BP | │ │ └─ structural constituent of postsynapse | 2.40E-03 | |
| GO:0099560 | BP | │ ├─ synapse adhesion between pre- and post-synapse | 8.52E-06 | 4.79E-03 |
| GO:0007416 | BP | │ ├─ synapse assembly | 1.75E-10 | 2.01E-04 |
| GO:0099054 | BP | │ │ ├─ presynapse assembly | 8.02E-03 | |
| GO:0051963 | BP | │ │ ├─ regulation of synapse assembly | 4.99E-07 | 1.19E-04 |
| GO:1905606 | BP | │ │ │ ├─ regulation of presynapse assembly | 1.37E-04 | 2.76E-04 |
| GO:0097107 | BP | │ │ │ └─ postsynaptic density assembly | 1.03E-02 | |
| GO:0060074 | BP | │ ├─ synapse maturation | 6.28E-05 | |
| GO:0099188 | BP | │ └─ postsynaptic cytoskeleton organization | 2.89E-04 | 1.46E-03 |
| SYNGO:metabolism | BP | ├─ metabolism | 1.69E-02 | |
| SYNGO:catabolic_postsynapse | BP | │ │ └─ protein catabolic process at postsynapse | 2.40E-03 | |
| SYNGO:transport | BP | └─ transport | 1.48E-03 | |
| GO:0098887 | BP | │ └─ neurotransmitter receptor transport, endosome to postsynaptic membrane | 2.40E-03 | |
-
Note: The top-level GO terms 'synapse' and 'process in the synapse' and major successive terms for synaptic subcompartments and processes are highlighted for the cerebellum and spinal cord at the advanced-symptomatic stage of WNV-ND. CC, cellular component; BP, biological process.
Table 3
Enriched GO terms for the upregulated or downregulated synaptic genes in WNV-infected cerebellum and spinal cord.
| Number of upregulated genes (percent) | Enriched GO terms | Number of downregulated genes (percent) | Enriched GO terms | |
| Early-symptomatic | ||||
| Cerebellum | 24 (80%) | postsynaptic specialization | 6 (20%) | presynapse |
| Spinal cord | 44 (51.2%) | presynapse; postsynapse; postsynaptic specialization; synapse organization; synapse assembly; chemical synaptic transmission | 42 (48.8%) | postsynapse; postsynaptic specialization; synapse organization; regulation of postsynaptic membrane neurotransmitter receptor levels; modulation of chemical synaptic transmission |
| Advanced-symptomatic | ||||
| Cerebellum | 67 (45.9%) | synapse organization; regulation of synapse assembly; presynaptic active zone membrane; presynaptic modulation of chemical synaptic transmission; postsynaptic specialization; metabolism | 79 (54.1%) | regulation of synapse organization; regulation of presynapse assembly; presynaptic cytosol; presynaptic active zone membrane; regulation of presynaptic membrane potential; postsynaptic actin cytoskeleton organization; postsynaptic specialization; regulation of postsynaptic membrane neuro-transmitter receptor levels; regulation of postsynaptic membrane potential; synapse adhesion between pre- and postsynapse; regulation of synaptic vesicle cycle; modulation of chemical synaptic transmission |
| Spinal cord | 109 (28.5%) | synapse organization; regulation of synapse assembly; synaptic vesicle membrane; synapse adhesion between pre- and post-synapse; synaptic cleft; presynaptic active zone membrane; presynaptic modulation of chemical synaptic transmission; postsynaptic specialization; synaptic vesicle cycle; modulation of chemical synaptic transmission | 274 (71.5%) | regulation of synapse organization; synaptic vesicle membrane; neuronal dense core vesicle; regulation of synaptic vesicle cycle; synaptic vesicle neurotransmitter loading; synaptic vesicle priming; synapse adhesion between pre- and postsynapse; synaptic cleft; structural constituent of presynapse; presynaptic cytosol; presynaptic active zone cytoplasmic component; presynaptic active zone membrane; presynaptic endocytic zone; regulation of presynapse assembly; regulation of presynaptic cytosolic calcium levels; regulation of presynaptic membrane potential; presynaptic modulation of chemical synaptic transmission; structural constituent of postsynapse; regulation of postsynapse organization; postsynaptic cytosol; regulation of modification of postsynaptic actin cytoskeleton; modification of postsynaptic structure; postsynaptic specialization assembly; regulation of postsynaptic cytosolic calcium levels; regulation of calcium-dependent activation of synaptic vesicle fusion; protein catabolic process at postsynapse; regulation of postsynaptic membrane neurotransmitter receptor levels; regulation of postsynaptic neurotransmitter receptor activity; regulation of postsynaptic membrane potential; postsynaptic modulation of chemical synaptic transmission; transport; metabolism |
Table 4
Neuronal cell compartments and neural functions controlled by West Nile virus (WNV)-induced immune-neural pleiotropic differentially expressed genes (DEGs).
| GO domain | GO term | No. of genes | Gene symbols |
|---|---|---|---|
| Cerebellum | |||
| CC | somatodendritic compartment (GO:0036477) | 19 | MBP, HCLS1, ITGA4, PTX3, FCGR2B, ZBP1, CCR2, CYFIP1, CTSL2, CIB1, AIF1, SOS1, ANXA3, CD3E, S100B, FLNA, MAPK1, ITGA1, TGFB2 |
| CC | neuron projection (GO:0043005) | 19 | MBP, EPHA2, HCLS1, ITGA4, FCGR2B, ZBP1, VIM, CCR2, BCL11B, CYFIP1, CTSL2, CIB1, ANXA3, CD3E, FLNA, MAPK1, ITGA1, TGFB2, ODZ1 |
| CC | postsynapse (GO:0098794) | 11 | JAK2, HCLS1, C1QA, FCGR2B, ZBP1, CYFIP1, STAT3, SOS1, CD3E, FLNA, MAPK1 |
| BP | neuron projection development (GO:0031175) | 25 | EPHA2, JAK2, IL6, HCLS1, ITGA4, ADM, RHOG, SHC1, BCL11B, CYFIP1, SDC4, LST1, DOK2, CXCR4, SEMA4A, CSF1R, SOS1, CD3E, S100B, HMGB1, GATA3, MAPK1, CXCL12, ITGA1, NCKAP1L |
| BP | positive regulation of neuron death (GO:1901216) | 13 | PTX3, C1QA, FCGR2B, IFNG, BAX, TYROBP, TNF, BCL2L11, GRN, TLR4, ITGA1, TGFB2, CCL3 |
| BP | microglial cell activation (GO:0001774) | 10 | JAK2, C1QA, IFNG, TLR2, TYROBP, TNF, FPR2, AIF1, GRN, C5AR1 |
| BP | astrocyte activation (GO:0048143) | 7 | C1QA, IFNG, TNF, FPR2, IL1B, GRN, C5AR1 |
| BP | glial cell migration (GO:0008347) | 4 | P2RY12, CCL2, TGFB2, CCL3 |
| BP | axon guidance (GO:0007411) | 12 | EPHA2, RHOG, SHC1, BCL11B, CYFIP1, DOK2, CXCR4, CSF1R, SOS1, GATA3, MAPK1, CXCL12 |
| BP | postsynapse to nucleus signaling pathway (GO:0099527) | 3 | JAK2, STAT3, RELA |
| BP | regulation of synapse structure or activity (GO:0050803) | 8 | HCLS1, FCGR2B, TLR2, SEMA4D, CYFIP1, TNF, SLC7A11, SEMA4A |
| BP | positive regulation of glutamate receptor signaling pathway (GO:1900451) | 3 | IFNG, CCR2, CCL2 |
| BP | synapse pruning (GO:0098883) | 2 | C1QA, C3 |
| Spinal cord | |||
| CC | somatodendritic compartment (GO:0036477) | 39 | REG1A, HSP90AA1, HCLS1, DAB2IP, DHX36, ITGA4, PTX3, FCGR2B, ZBP1, CX3CL1, BCR, HSP90AB1, PTK2B, RARA, FZD3, PSEN1, CCR2, APP, CASP3, PAFAH1B1, DOCK10, ALCAM, ARHGEF7, CTSL2, CIB1, AIF1, PTK2, P2RX4, RTN4, KIF5B, PURA, ADAM10, SNAP25, DNM2, FLNA, MAPK1, NEDD4, BECN1, ITGA1 |
| CC | neuron projection (GO:0043005) | 46 | REG1A, EPHA2, HSP90AA1, HCLS1, DAB2IP, DHX36, ITGA4, FCGR2B, ZBP1, CX3CL1, BCR, HSP90AB1, PTK2B, RARA, FZD3, PSEN1, VIM, CCR2, APP, LRRC7, BSG, PAFAH1B1, DOCK10, ALCAM, ARHGEF7, CTSL2, CIB1, ARF1, PTK2, ITGA3, CYFIP2, P2RX4, KIF5B, PURA, ADAM10, NCAM1, SNAP25, DNM2, FLNA, MAPK1, NEDD4, BECN1, ITGA1, CEP290, ODZ1, BRAF |
| CC | axon (GO:0030424) | 25 | REG1A, HSP90AA1, DAB2IP, DHX36, ITGA4, ZBP1, BCR, HSP90AB1, PTK2B, FZD3, PSEN1, APP, LRRC7, BSG, PAFAH1B1, ALCAM, CIB1, ITGA3, P2RX4, KIF5B, ADAM10, SNAP25, DNM2, FLNA, MAPK1 |
| CC | synapse (GO:0045202) | 37 | HCLS1, C1QA, FCGR2B, ZBP1, RAB35, BCR, PTK2B, FZD3, PSEN1, FZD3, NCSTN, APP, LRRC7, STAT3, PAFAH1B1, DOCK10, LYN, ARF1, PTK2, ITGA3, CYFIP2, EFNB1, RELA, P2RX4, RTN4, PURA, ADAM10, PTPRZ1, SNAP25, DNM2, FLNA, MAPK1, NEDD4, PTN, FGFR2, PAK2, ANXA1 |
| CC | glutamatergic synapse (GO:0098978) | 14 | BCR, PTK2B, FZD3, STAT3, LYN, ARF1, RELA, PURA, ADAM10, SNAP25, DNM2, FLNA, NEDD4, PAK2 |
| BP | neuron projection development (GO:0031175) | 50 | EPHA2, HSP90AA1, HCLS1, IL6, DAB2IP, PIK3R1, ITGA4, SLC11A2, HES1, ADM, JUN, RAB35, HSP90AB1, SEC24B, PTK2B, FZD3, APP, SHC1, PTPN11, CASP3, LST1, BSG, PAFAH1B1, DOK2, DOCK10, ALCAM, LYN, RPS6KA5, PTK2, EIF2AK4, SRF, CYFIP2, SEMA4A, EFNB1, CSF1R, RTN4, KIF5B, PTPRZ1, NCAM1, HMGB1, DNM2, GATA3, MAPK1, CXCL12, NEDD4, PTN, ITGA1, STK4, FGFR2, PAK2 |
| BP | microglial cell activation (GO:0001774) | 14 | TREM2, C1QA, IFNGR1, JUN, IFNG, CX3CL1, TLR2, APP, TYROBP, TNF, FPR2, AIF1, GRN, C5AR1 |
| BP | astrocyte activation (GO:0048143) | 11 | TREM2, C1QA, IFNGR1, IFNG, PSEN1, APP, TNF, FPR2, IL1B, GRN, C5AR1 |
| BP | regulation of glial cell migration (GO:1903975) | 8 | TREM2, CX3CL1, CCR2, GPR183, CSF1, P2RY12, P2RX4, CCL3 |
| BP | regulation of synapse structure or activity (GO:0050803) | 17 | HCLS1, DAB2IP, DHX36, FCGR2B, TLR2, FZD3, APP, SEMA4D, TNF, PAFAH1B1, SLC7A11, PTK2, SEMA4A, ADAM10, DNM2, NEDD4, PTN |
| BP | synapse pruning (GO:0098883) | 3 | TREM2, C1QA, CX3CL1 |
Key resources table
| Reagent type (species) or resource | Designation | Source or reference | Identifiers | Additional information |
|---|---|---|---|---|
| Antibody | Mouse polyclonal anti-WNV | ATCC | Cat. #: ATCCVR-1267 AF | IHC (1:1000) |
| Antibody | Mouse monoclonal anti-synaptophysin (SY38) | Abcam | Cat. #: ab8049 RRID: AB_2198854 | IHC (1:10) |
| Antibody | Mouse monoclonal anti-MAP2 (5F9) | Millipore-Sigma | Cat. #: 05–346 RRID: AB_309685 | IHC (1:6000) |
| Antibody | Mouse monoclonal anti-CD68 (KP1) | Biocare Medical https://biocare.net/product/cd68-antibody/ | Cat. #: CM 033 | IHC (1:500) |
| Antibody | Rabbit polyclonal anti-GFAP | Agilent | Cat. #: Z0334 RRID: AB_10013382 | IHC (1:4000) |
| Antibody | Mouse monoclonal anti-CD4 (4B12) | Biocare Medical https://biocare.net/product/cd4-4b12/ | Cat. #: ACI 3148 | IHC (1:10) |
| Antibody | Rabbit polyclonal Anti-CD8 | Abcam | Cat. #: ab4055 RRID: AB_304247 | IHC (1:400) |
| Antibody | Mouse monoclonal anti-CD20 Clone L26 | Agilent | Cat. #: M0755 RRID: AB_2282030 | IHC (1:200) |
| Antibody | Rabbit polyclonal anti-Calbindin 28K | Millipore-Sigma | Cat. #: AB1778 RRID: AB_2068336 | IHC (1:1000) |
| Antibody | Rabbit monoclonal anti-ChAT Clone EPR16590 | Abcam https://www.abcam.com/choline-acetyltransferase-antibody-epr16590-ab178850.html | Cat. #: ab178850 | IHC (1:1000) |
| Software, algorithm | Next-Generation Clustered Heatmaps interactive tool | PMID:29092932 https://build.ngchm.net/NGCHM-web-builder/View_HeatMap.html?adv=Y | ||
| Software, algorithm | PANTHER | PMID:30804569 | RRID:SCR_004869 | |
| Software, algorithm | Reactome Knowledgebase | PMID:29145629 | RRID:SCR_003485 | |
| Software, algorithm | SynGO | PMID:31171447 | RRID:SCR_017330 | |
| Software, algorithm | gProfiler | PMID:31066453 | RRID:SCR_006809 |
Additional files
-
Supplementary file 1
Coordinated transcriptional shifts.
- https://cdn.elifesciences.org/articles/62273/elife-62273-supp1-v1.xlsx
-
Supplementary file 2
Synaptic genes differentially expressed during WNV-ND.
- https://cdn.elifesciences.org/articles/62273/elife-62273-supp2-v1.xlsx
-
Supplementary file 3
SynGO enrichment analysis results.
- https://cdn.elifesciences.org/articles/62273/elife-62273-supp3-v1.xlsx
-
Supplementary file 4
SynGO enrichment: up- and downregulated synaptic genes.
- https://cdn.elifesciences.org/articles/62273/elife-62273-supp4-v1.xlsx
-
Supplementary file 5
Venn-diagram results for immune and neural DEGs.
- https://cdn.elifesciences.org/articles/62273/elife-62273-supp5-v1.xlsx
-
Supplementary file 6
ORT: Immune-neural pleiotropic DEGs.
- https://cdn.elifesciences.org/articles/62273/elife-62273-supp6-v1.xlsx
-
Supplementary file 7
Immune-neural-synaptic pleiotropic genes.
- https://cdn.elifesciences.org/articles/62273/elife-62273-supp7-v1.xlsx
-
Supplementary file 8
gProfiler: Immune-neural-synaptic pleiotropic DEGs.
- https://cdn.elifesciences.org/articles/62273/elife-62273-supp8-v1.docx
-
Supplementary file 9
Pleiotropic DEGs: Synaptic topology and functionality.
- https://cdn.elifesciences.org/articles/62273/elife-62273-supp9-v1.xlsx
-
Supplementary file 10
WNV-ND transcriptome validation.
- https://cdn.elifesciences.org/articles/62273/elife-62273-supp10-v1.docx
-
Transparent reporting form
- https://cdn.elifesciences.org/articles/62273/elife-62273-transrepform-v1.docx
Download links
A two-part list of links to download the article, or parts of the article, in various formats.
Downloads (link to download the article as PDF)
Open citations (links to open the citations from this article in various online reference manager services)
Cite this article (links to download the citations from this article in formats compatible with various reference manager tools)
Virus infection of the CNS disrupts the immune-neural-synaptic axis via induction of pleiotropic gene regulation of host responses
eLife 10:e62273.
https://doi.org/10.7554/eLife.62273


