Effects of an urban sanitation intervention on childhood enteric infection and diarrhea in Maputo, Mozambique: A controlled before-and-after trial
- London School of Hygiene & Tropical Medicine, Faculty of Infectious Tropical Diseases, Disease Control Department, United Kingdom
- Georgia Institute of Technology, School of Civil and Environmental Engineering, United States
- WE Consult ltd, Mozambique
- Georgia Institute of Technology, School of Chemical and Biomolecular Engineering, United States
- University of North Carolina at Chapel Hill, Gillings School of Global Public Health, Department of Epidemiology, United States
- Instituto Nacional de Saúde, Mozambique
- University of North Carolina at Chapel Hill, Gillings School of Global Public Health, Department of Environmental Sciences and Engineering, United States
- London School of Hygiene & Tropical Medicine, Faculty of Epidemiology and Population Health, Department of Medical Statistics, United Kingdom
- Georgia Institute of Technology, School of Biological Sciences, United States
- Yale-NUS College, Division of Social Science, Singapore
Figures
Figure 1
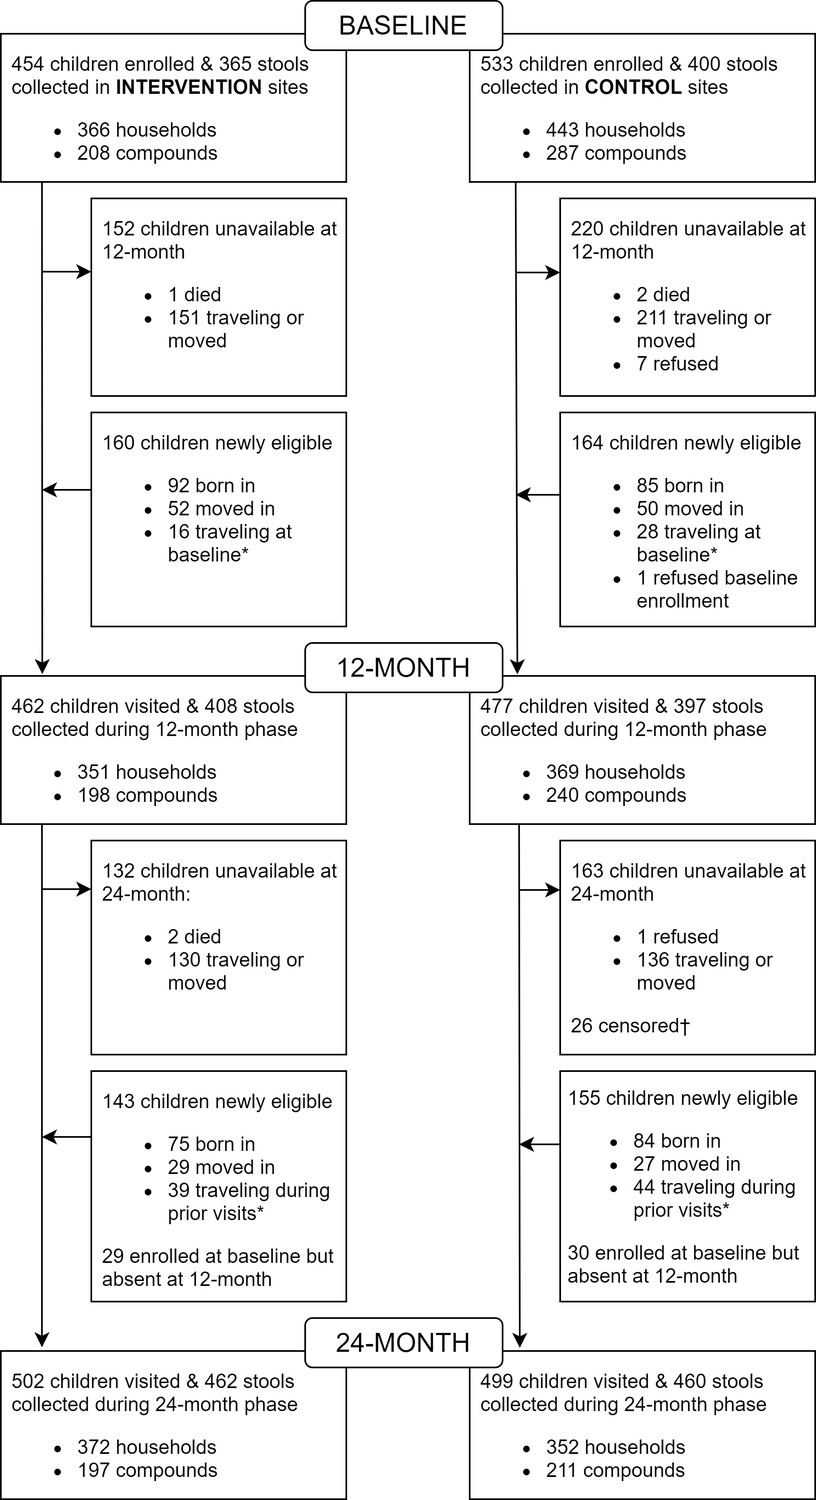
Trial profile.
*Eligible for enrollment at baseline and/or 12 months but traveling at time of visit. †Children removed from 24-month analysis because their compound received an intervention after completion of the baseline phase. Source files available in Figure 1—source data 1 and Figure 1—source code 1.
-
Figure 1—source code 1
Trial profile.
- https://cdn.elifesciences.org/articles/62278/elife-62278-fig1-code1-v3.zip
-
Figure 1—source data 1
Trial profile.
- https://cdn.elifesciences.org/articles/62278/elife-62278-fig1-data1-v3.xlsx
Appendix 1—figure 1
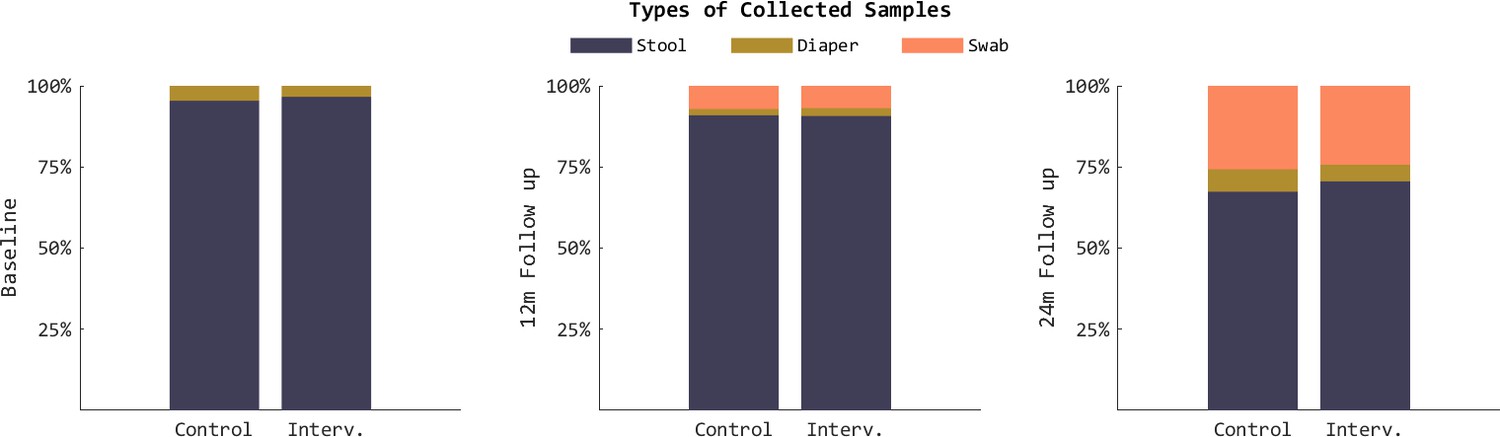
Proportion of each type of sample collected during the baseline, 12-month, and 24-month phases.
Results stratified by study arm. Rectal swabs were not introduced until the 12-month phase of the study.
Appendix 1—figure 2
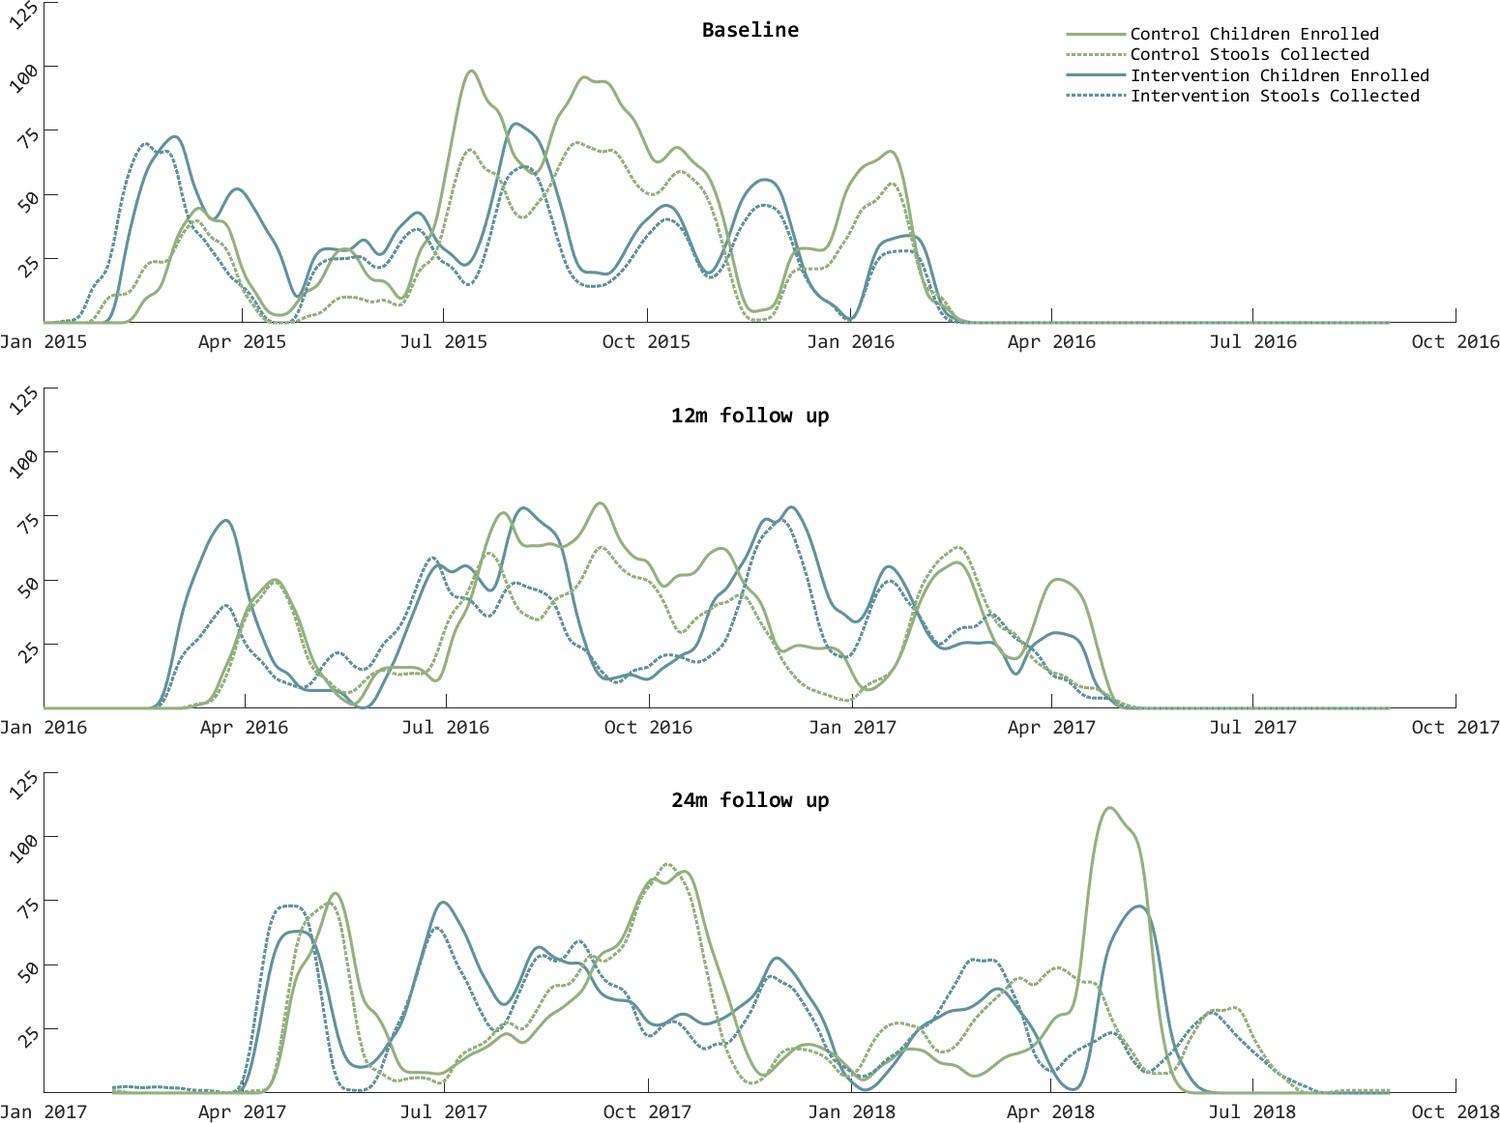
Enrollment and stool sample collection profile.
Graphs depict 4-week rolling average of the number of intervention and control children enrolled/visited (solid lines) and the number of stool samples collected (including whole stool, diaper samples, and rectal swabs) during the baseline, 12-month, and 24-month phases. The overall success of stool sample collection was 78% at baseline, 86% at 12 month, and 90% at 24 month. The increase in success rate was due to the introduction of rectal swab collection during the 12-month phase.
Appendix 1—figure 3
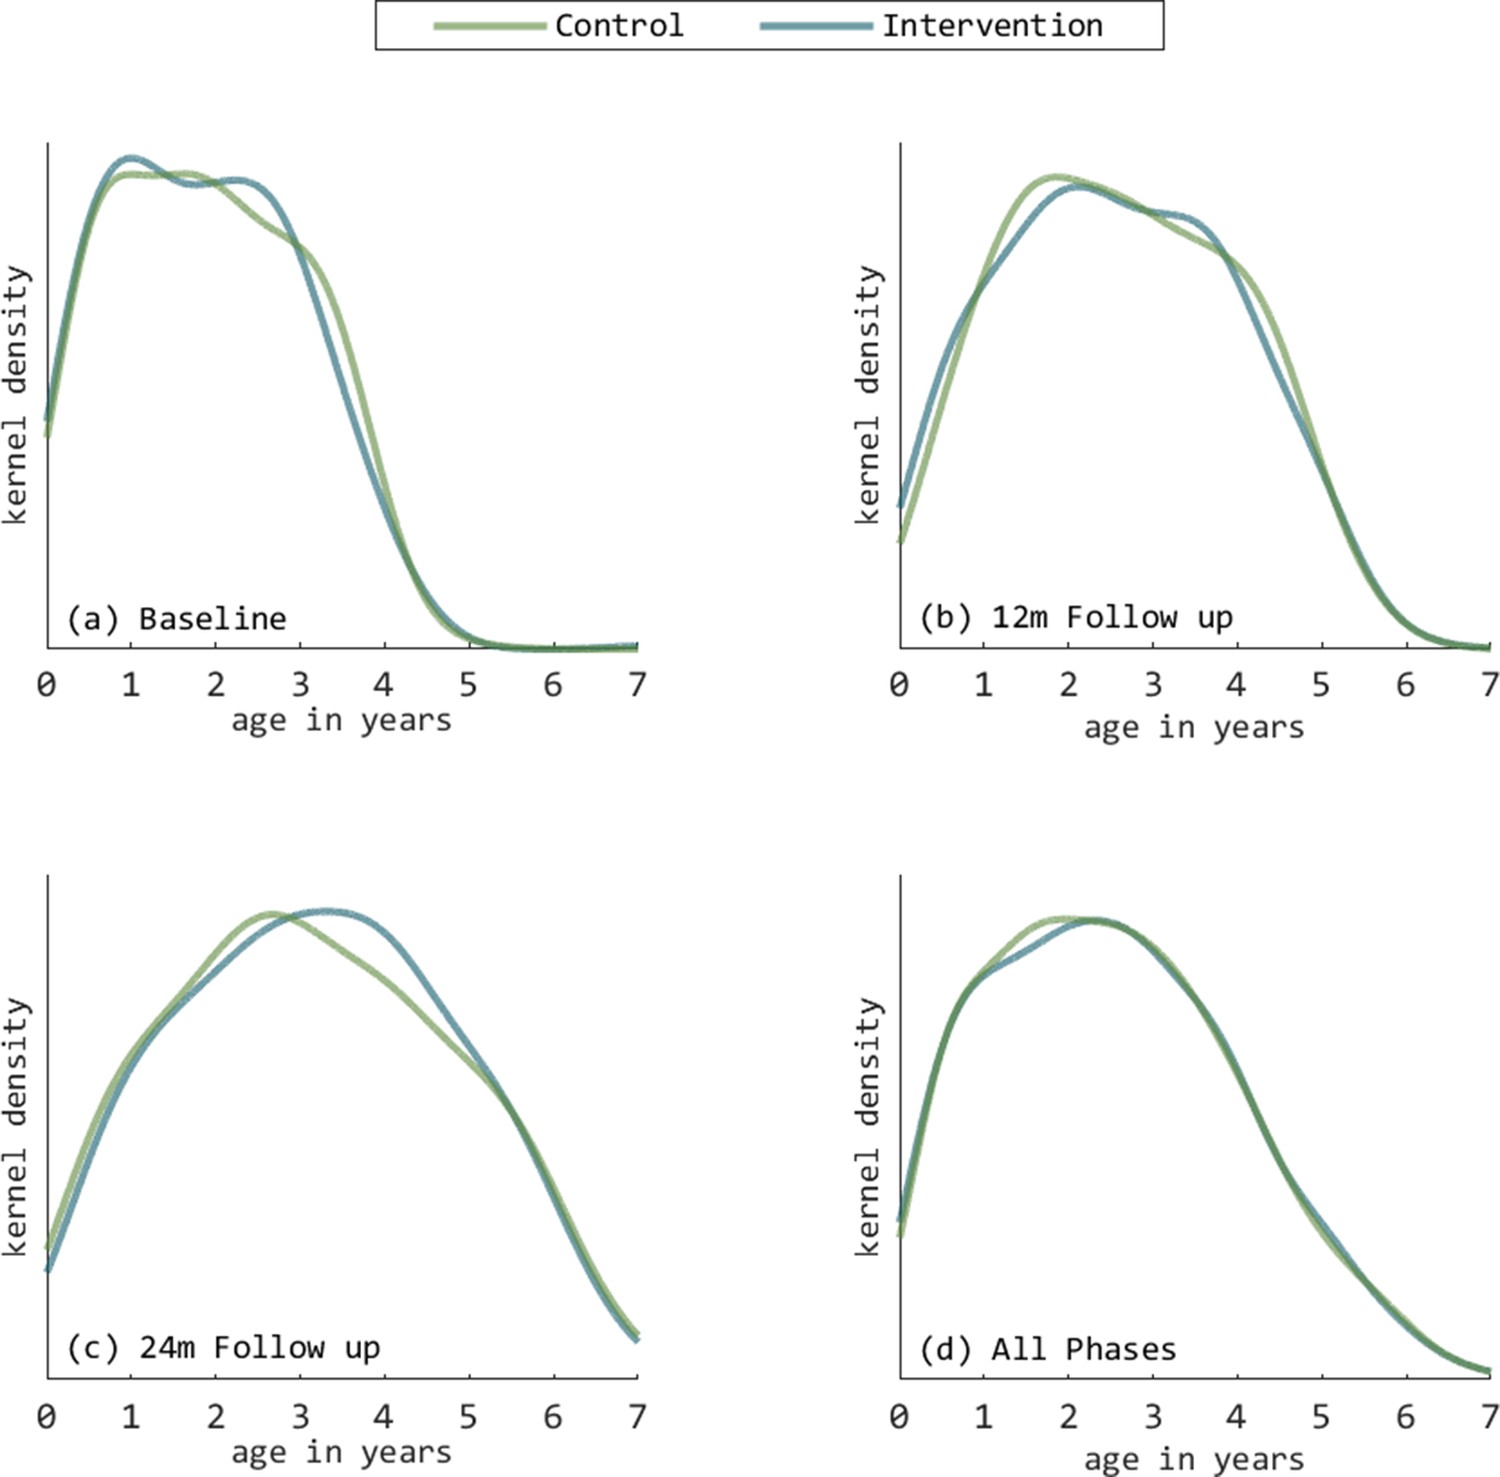
Distribution of age (years) of enrolled children at each phase.
Results are presented as kernel density plots and stratified by study arm (intervention=blue, control=green) and phase: (a) Baseline phase, (b) 12-month follow-up, (c) 24-month follow-up, and (d) All phases combined.
Appendix 1—figure 4
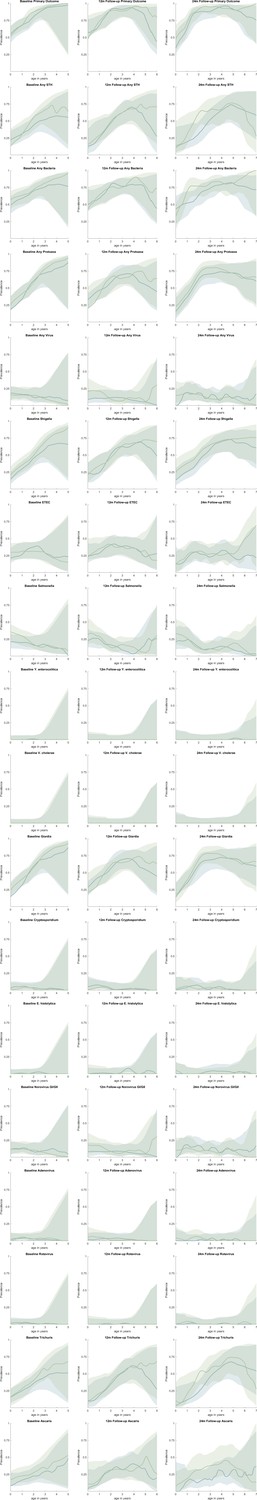
Prevalence of pathogens by age at baseline, 12-month, and 24-month phases.
Results are smoothed averages stratified by study arm with 95% confidence intervals represented by shaded areas.
Appendix 1—figure 5
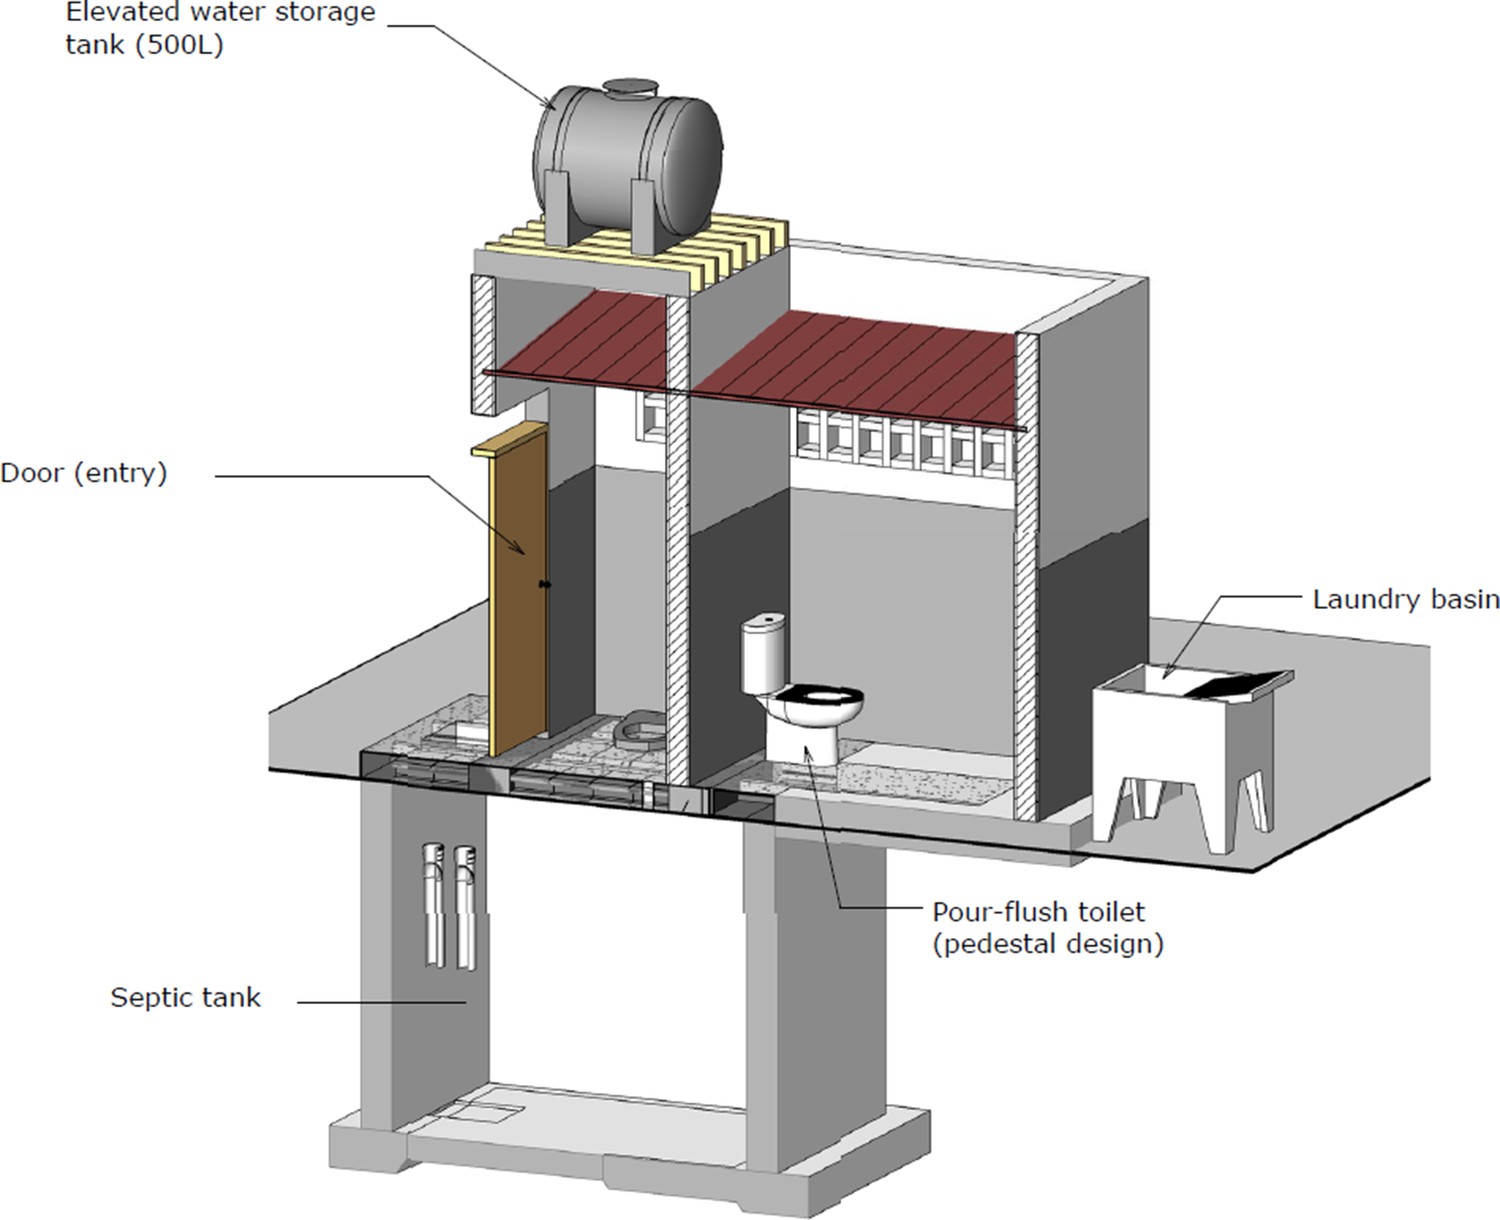
Schematic of communal sanitation block design from the NGO (Water and Sanitation for the Urban Poor).
Pictured: two latrine stalls, two pour-flush toilets, septic tank, elevated water storage tank, laundry basin, door. Not pictured: soakaway pit. Source: Water and Sanitation for the Urban Poor.
Appendix 1—figure 6

Construction of a soakaway pit for discharge of liquid effluent from intervention latrines.
Appendix 1—figure 7
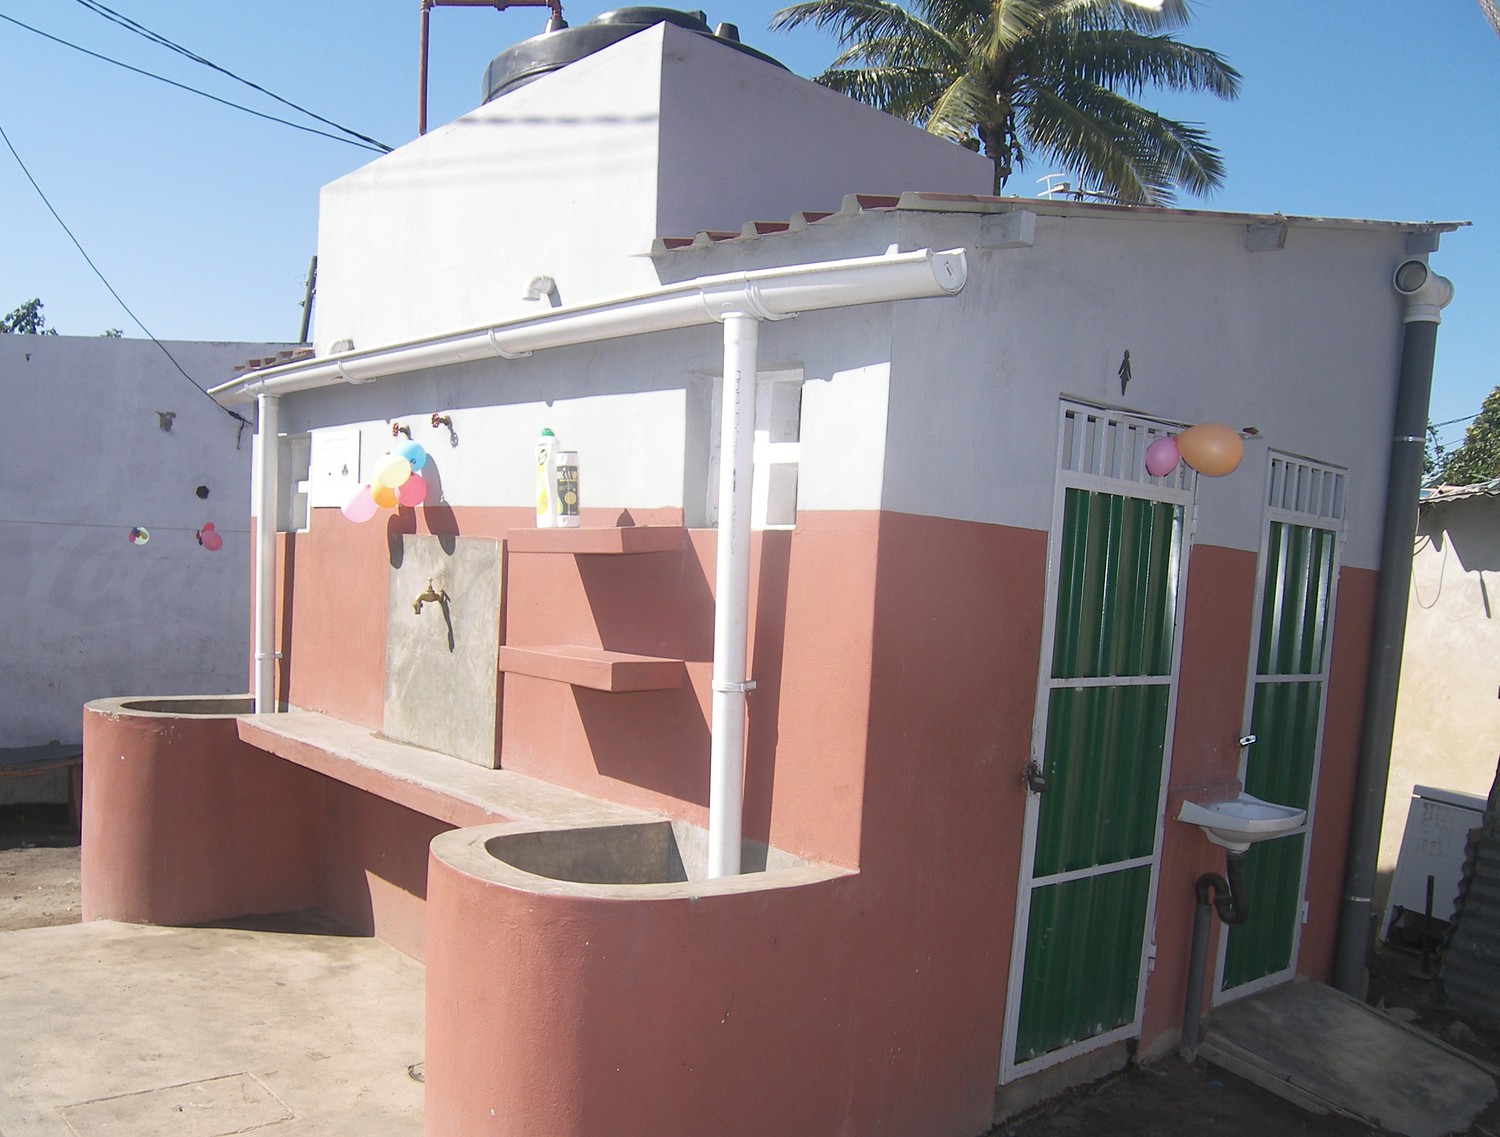
Photo of communal sanitation block as constructed.
Appendix 1—figure 8
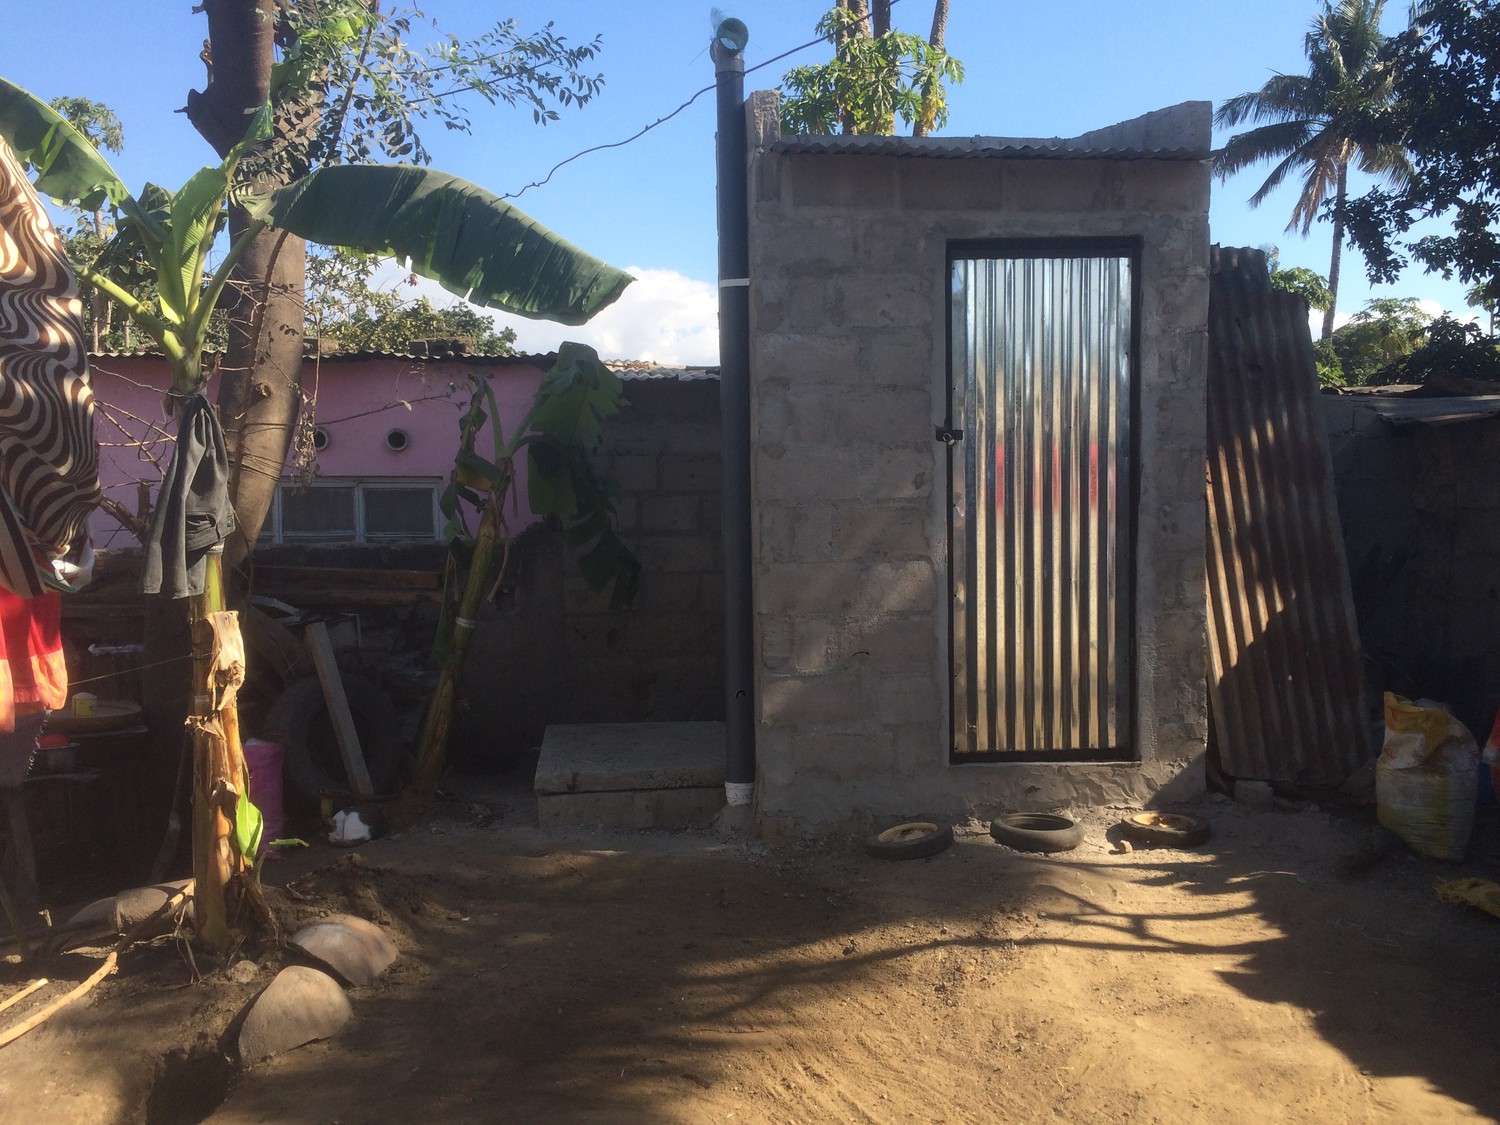
Photo of shared latrine as constructed.
Appendix 1—figure 9
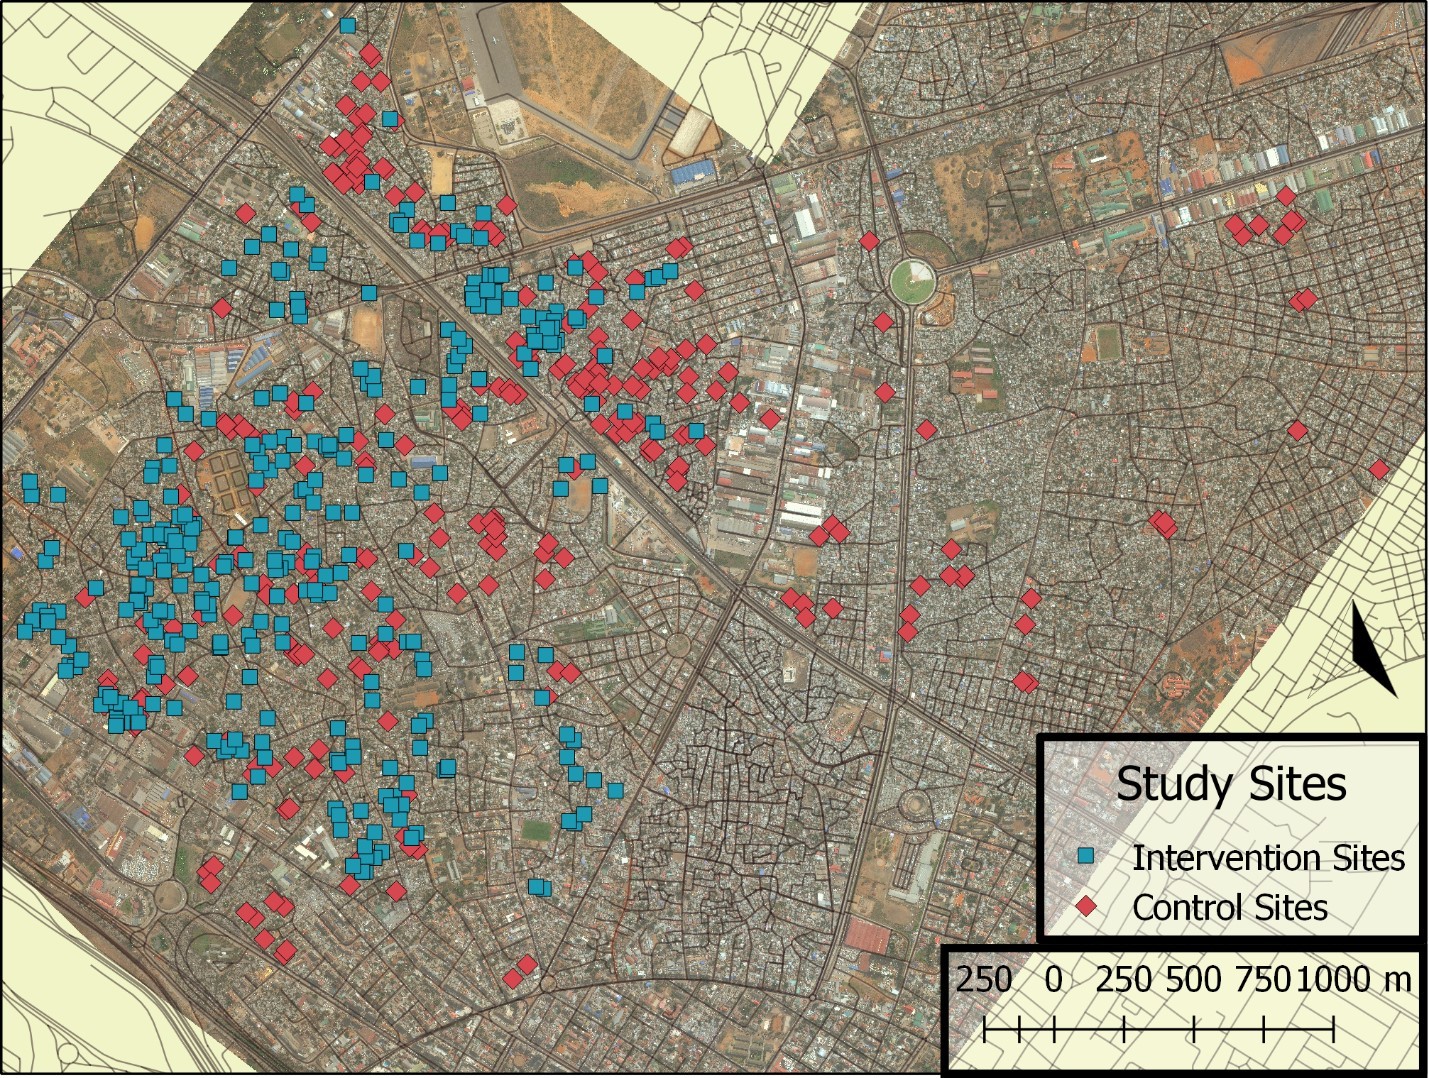
Map illustrating locations of intervention (n=208) and control sites (n=287) compounds.
Tables
Table 1
Baseline characteristics of enrolled children, households, and compounds.
| Control | Intervention | |||
|---|---|---|---|---|
| N | n (%) or mean (SD) | N | n (%) or mean (SD) | |
| Child level variables | ||||
| Age at survey, days* | 520 | 700 (405) | 441 | 694 (403) |
| Sex, female | 520 | 266 (51%) | 444 | 227 (51%) |
| Child is breastfed with or without complementary feeding | 526 | 169 (32%) | 448 | 143 (32%) |
| Child is exclusively breastfed | 526 | 49 (9.3%) | 448 | 37 (8.3%) |
| Child feces reported to be disposed of in a latrine | 526 | 148 (28%) | 448 | 141 (31%) |
| Child wears diapers | 526 | 342 (65%) | 447 | 294 (66%) |
| Caregiver completed primary school | 528 | 287 (54%) | 451 | 239 (53%) |
| Child's mother is alive | 513 | 503 (98%) | 435 | 426 (98%) |
| Respondent is child's mother | 519 | 368 (71%) | 443 | 284 (64%) |
| Household level variables | ||||
| Household population | 441 | 5.4 (2.4) | 365 | 6.1 (3.0) |
| Household wealth score, 0 (poorer) - 1 (wealthier)† | 440 | 0.45 (0.10) | 365 | 0.44 (0.10) |
| Household crowding, >3 persons/room | 440 | 54 (12%) | 365 | 60 (17%) |
| Household floor is covered‡ | 440 | 426 (97%) | 365 | 333 (91%) |
| Household wall made of bricks, concrete, or similar‡ | 440 | 304 (69%) | 365 | 215 (59%) |
| Household drinking water source inside compound | 435 | 324 (74%) | 360 | 294 (82%) |
| Latrine used by household has a ceramic or masonry pedestal‡ | 432 | 153 (35%) | 359 | 142 (40%) |
| Latrine used by household has a drop-hole cover‡ | 434 | 232 (53%) | 359 | 224 (62%) |
| Compound level variables | ||||
| Number of compound members | 287 | 14 (6.2) | 208 | 19 (12) |
| Number of households | 287 | 3.8 (2.1) | 208 | 4.4 (3.7) |
| Number of water taps in compound | 283 | 0.98 (0.95) | 207 | 1.4 (1.6) |
| Number of latrines in compound | 287 | 1.0 (0.20) | 207 | 1.1 (0.57) |
| Number of people sharing a latrine | 285 | 14 (6.2) | 197 | 17 (8.9) |
| Number of households sharing a latrine | 285 | 3.7 (1.8) | 197 | 4.0 (2.8) |
| Latrine walls made of brick, concrete or similar‡ | 282 | 72 (26%) | 204 | 67 (33%) |
| Compound population density, persons/square meter§ | 281 | 0.071 (0.04) | 205 | 0.087 (0.05) |
| Compound has electricity that normally functions | 287 | 251 (87%) | 208 | 189 (91%) |
| Compound is prone to flooding | 287 | 184 (64%) | 208 | 120 (58%) |
| Any animals observed in compound‡ | 287 | 170 (59%) | 208 | 132 (63%) |
| Dog(s) observed‡ | 287 | 14 (4.9%) | 208 | 14 (6.7%) |
| Chicken(s) or duck(s) observed‡ | 287 | 40 (14%) | 208 | 30 (14%) |
| Cat(s) observed‡ | 287 | 149 (52%) | 208 | 116 (56%) |
-
Data are n (%) or mean (standard deviation) and collected by questionnaire unless otherwise noted.
* Age range 32–1819 days, IQR 339–1021 days. Age distributions available in Appendix 1—figure 3.
-
†Assessed using Simple Poverty Scorecard for Mozambique (http://www.simplepovertyscorecard.com/MOZ_2008_ENG.pdf).
‡Data collected by direct observation.
-
§Calculated as # of people living in the compound divided by the area of the compound in square meters. Source files available in Table 1—source data 1 and Table 1—source code 1.
-
Table 1—source code 1
Baseline characteristics.
- https://cdn.elifesciences.org/articles/62278/elife-62278-table1-code1-v3.zip
-
Table 1—source data 1
Baseline characteristics.
- https://cdn.elifesciences.org/articles/62278/elife-62278-table1-data1-v3.xlsx
Table 2
Effect of the intervention on bacterial, protozoan, viral, and STH infection and diarrhea at 12 and 24 months post-intervention.
| Prevalence | 12-month Prevalence ratio (95% CI), p-value * | 24-month Prevalence ratio (95% CI), p-value† | |||||
|---|---|---|---|---|---|---|---|
| Baseline | 12 month | 24 month | Unadjusted | Adjusted§ | Unadjusted | Adjusted§ | |
| Any bacterial or protozoan infection‡ | |||||||
| Control | 313/392 (80%) | 334/395 (85%) | 403/459 (88%) | .. | .. | .. | .. |
| Intervention | 278/361 (77%) | 347/408 (85%) | 392/462 (85%) | 1.04 (0.94–1.15), p=0.41 | 1.04 (0.94–1.15), p=0.41 | 1.00 (0.91–1.10), p=1.0 | 0.99 (0.91–1.09), p=0.89 |
| Any STH infection‡ | |||||||
| Control | 170/360 (47%) | 143/283 (51%) | 142/253 (56%) | .. | .. | .. | .. |
| Intervention | 138/329 (42%) | 150/305 (49%) | 136/292 (47%) | 1.12 (0.89–1.40), p=0.33 | 1.11 (0.89–1.38), p=0.35 | 0.94 (0.75–1.17), p=0.59 | 0.95 (0.77–1.17), p=0.62 |
| Diarrhea‡ | |||||||
| Control | 67/526 (13%) | 40/430 (9.3%) | 53/390 (14%) | .. | .. | .. | .. |
| Intervention | 59/448 (13%) | 59/436 (14%) | 53/410 (13%) | 1.41 (0.80–2.48), p=0.24 | 1.69 (0.89–3.21), p=0.11 | 0.92 (0.55–1.54), p=0.76 | 0.84 (0.47–1.51), p=0.56 |
| Any bacteria | |||||||
| Control | 271/392 (69%) | 285/395 (72%) | 345/459 (75%) | .. | .. | .. | .. |
| Intervention | 227/361 (63%) | 292/408 (72%) | 324/462 (70%) | 1.09 (0.95–1.25), p=0.25 | 1.09 (0.95–1.26), p=0.20 | 1.03 (0.90–1.18), p=0.69 | 1.00 (0.87–1.15), p=0.96 |
| Shigella | |||||||
| Control | 179/392 (46%) | 204/395 (52%) | 269/459 (59%) | .. | .. | .. | .. |
| Intervention | 152/361 (42%) | 218/408 (53%) | 245/462 (53%) | 1.13 (0.91–1.39), p=0.28 | 1.12 (0.92–1.38), p=0.27 | 0.98 (0.80–1.20), p=0.86 | 0.95 (0.79–1.16), p=0.64 |
| ETEC | |||||||
| Control | 116/392 (30%) | 142/395 (36%) | 127/459 (28%) | .. | .. | .. | .. |
| Intervention | 110/361 (30%) | 143/408 (35%) | 126/462 (27%) | 0.93 (0.68–1.28), p=0.66 | 0.96 (0.69–1.33), p=0.81 | 0.95 (0.67–1.35), p=0.77 | 0.83 (0.57–1.19), p=0.31 |
| Campylobacter | |||||||
| Control | 39/392 (9.9%) | 32/395 (8.1%) | 48/459 (10%) | .. | .. | .. | .. |
| Intervention | 21/361 (5.8%) | 35/408 (8.6%) | 34/462 (7.4%) | 1.78 (0.89–3.56), p=0.10 | 1.68 (0.82–3.45), p=0.16 | 1.20 (0.60–2.39), p=0.60 | 1.28 (0.62–2.62), 0.50 |
| C. difficile | |||||||
| Control | 22/392 (5.6%) | 13/395 (3.3%) | 13/459 (2.8%) | .. | .. | .. | .. |
| Intervention | 13/361 (3.6%) | 17/408 (4.2%) | 11/462 (2.4%) | 1.95 (0.71–5.35), p=0.20 | 2.09 (0.77–5.64), p=0.15 | 1.32 (0.47–3.73), p=0.60 | 1.41 (0.46–4.30), p=0.54 |
| E. coli O157 | |||||||
| Control | 13/392 (3.3%) | 19/395 (4.8%) | 25/459 (5.5%) | .. | .. | .. | .. |
| Intervention | 18/361 (5.0%) | 14/408 (3.4%) | 16/462 (3.5%) | 0.48 (0.18–1.27), p=0.14 | 0.46 (0.18–1.21), p=0.12 | 0.43 (0.15–1.29), p=0.13 | 0.52 (0.17–1.59), p=0.25 |
| STEC | |||||||
| Control | 3/392 (0.77%) | 9/395 (2.3%) | 17/459 (3.7%) | .. | .. | .. | .. |
| Intervention | 10/361 (2.8%) | 5/408 (1.2%) | 15/462 (3.3%) | 0.14 (0.03–0.67), p=0.014 | 0.15 (0.03–0.70), p=0.016 | 0.23 (0.05–1.03), p=0.055 | 0.24 (0.05–1.01), p=0.052 |
| Any protozoa | |||||||
| Control | 205/392 (52%) | 236/395 (60%) | 303/459 (66%) | .. | .. | .. | .. |
| Intervention | 195/361 (54%) | 259/408 (63%) | 296/462 (64%) | 1.04 (0.87–1.24), p=0.69 | 1.03 (0.86–1.22), p=0.76 | 0.93 (0.78–1.11), p=0.40 | 0.91 (0.76–1.09), p=0.29 |
| Giardia | |||||||
| Control | 201/392 (51%) | 230/395 (58%) | 294/459 (64%) | .. | .. | .. | .. |
| Intervention | 186/361 (52%) | 251/408 (62%) | 289/462 (63%) | 1.06 (0.88–1.27), p=0.55 | 1.05 (0.88–1.25), p=0.58 | 0.96 (0.80–1.14), p=0.61 | 0.93 (0.78–1.11), p=0.44 |
| Cryptosporidium | |||||||
| Control | 8/392 (2%) | 8/395 (2%) | 14/459 (3.0%) | .. | .. | .. | .. |
| Intervention | 16/361 (4.4%) | 15/408 (3.7%) | 15/462 (3.3%) | 0.89 (0.23–3.43), p=0.87 | 0.89 (0.24–3.31), p=0.86 | 0.46 (0.11–1.93), p=0.29 | 0.53 (0.13–2.14), p=0.37 |
| Any virus | |||||||
| Control | 53/392 (14%) | 52/395 (13%) | 59/459 (13%) | .. | .. | .. | .. |
| Intervention | 52/361 (14%) | 45/408 (11%) | 62/462 (13%) | 0.77 (0.45–1.32), p=0.35 | 0.75 (0.44–1.27), p=0.29 | 0.96 (0.55–1.68), p=0.88 | 1.03 (0.57–1.86), p=0.92 |
| Norovirus GI/GII | |||||||
| Control | 38/392 (9.7%) | 44/395 (11%) | 47/459 (10%) | .. | .. | .. | .. |
| Intervention | 39/361 (11%) | 37/408 (9.1%) | 55/462 (12%) | 0.71 (0.38–1.33), p=0.28 | 0.68 (0.36–1.27), p=0.23 | 1.00 (0.52–1.93), p=0.99 | 1.10 (0.55–2.18), p=0.79 |
| Adenovirus 40/41 | |||||||
| Control | 13/392 (3.3%) | 9/395 (2.3%) | 7/459 (1.5%) | .. | .. | .. | .. |
| Intervention | 9/361 (2.5%) | 9/408 (2.2%) | 6/462 (1.3%) | 1.34 (0.34–5.23), p=0.68 | 1.24 (0.32–4.83), p=0.76 | 1.18 (0.23–5.98), p=0.84 | 0.97 (0.18–5.19), p=0.97 |
| Coinfection, ≥2 GPP pathogens | |||||||
| Control | 206/392 (53%) | 237/395 (60%) | 302/459 (66%) | .. | .. | .. | .. |
| Intervention | 185/361 (51%) | 257/408 (63%) | 282/462 (61%) | 1.08 (0.90–1.29), p=0.39 | 1.08 (0.91–1.29), p=0.37 | 0.95 (0.80–1.12), p=0.54 | 0.93 (0.79–1.10), p=0.41 |
| Trichuris | |||||||
| Control | 139/360 (39%) | 116/283 (41%) | 124/253 (49%) | .. | .. | .. | .. |
| Intervention | 117/329 (36%) | 120/305 (39%) | 117/292 (40%) | 1.05 (0.82–1.35), p=0.68 | 1.01 (0.79–1.28), p=0.96 | 0.89 (0.69–1.16), p=0.40 | 0.86 (0.67–1.10), p=0.22 |
| Ascaris | |||||||
| Control | 95/360 (26%) | 82/283 (29%) | 78/253 (31%) | .. | .. | .. | .. |
| Intervention | 68/329 (21%) | 87/305 (29%) | 56/292 (19%) | 1.26 (0.87–1.82), p=0.22 | 1.33 (0.92–1.93), p=0.13 | 0.80 (0.52–1.21), p=29 | 0.83 (0.54–1.27), p=0.39 |
| Coinfection, ≥2 STH | |||||||
| Control | 64/360 (18%) | 55/283 (19%) | 60/253 (24%) | .. | .. | .. | .. |
| Intervention | 47/329 (14%) | 57/305 (19%) | 37/292 (13%) | 1.16 (0.76–1.77), p=0.50 | 1.17 (0.76–1.79), p=0.49 | 0.67 (0.40–1.13), p=0.13 | 0.63 (0.37–1.07), p=0.084 |
-
Prevalence results are presented as (n/N (%)). All effect estimates are presented as prevalence ratios (ratio of ratios) and estimated using generalized estimating equations to fit Poisson regression models with robust standard errors.
*Analysis includes all children measured at baseline and 12-month visits.
-
†Analysis includes all children measured at baseline and 24 month visits.
‡Outcome was pre-specified in trial registration. All other outcomes are exploratory.
-
§Pathogen outcomes adjusted for child age and sex, caregiver’s education, and household wealth index. Reported diarrhea was also adjusted for baseline presence of a drop-hole cover and reported use of a tap on compound grounds as primary drinking water source. Sample sizes for adjusted analyses are slightly smaller than numbers presented in prevalence estimates due to missing covariate data. Y. enterocolitica, V. cholerae, E. histolytica, and rotavirus were detected in <2% of samples in each arm at each phase. Descriptive data for these pathogens are available in the Appendix 1—table 2. Source files available in Table 2—source data 1 and Table 2—source code 1.
-
Table 2—source code 1
Intervention effect at 12 and 24 months.
- https://cdn.elifesciences.org/articles/62278/elife-62278-table2-code1-v3.zip
-
Table 2—source data 1
Intervention effect at 12 and 24 months.
- https://cdn.elifesciences.org/articles/62278/elife-62278-table2-data1-v3.xlsx
Table 3
Effect of intervention on bacterial, protozoan, viral, and STH infection and reported diarrhea in children born into study sites post-intervention (post-baseline) but by 24-month visit compared with children of a similar age at baseline (<2 years old).
| Prevalence (<2 years old) | Prevalence ratio (95% CI), p-value | |||
|---|---|---|---|---|
| Baseline | 24 month, Born-in | Unadjusted | Adjusted† | |
| Any bacterial or protozoan infection* | ||||
| Control | 158/228 (69%) | 79/106 (75%) | .. | .. |
| Intervention | 129/201 (64%) | 71/107 (66%) | 0.96 (0.77–1.21), p=0.74 | 0.99 (0.80–1.22), p=0.92 |
| Any STH infection* | ||||
| Control | 67/205 (33%) | 25/68 (37%) | .. | .. |
| Intervention | 52/183 (28%) | 13/75 (17%) | 0.52 (0.26–1.05), p=0.069 | 0.51 (0.27–0.95), p=0.035 |
| Diarrhea* | ||||
| Control | 46/283 (16%) | 18/105 (17%) | .. | .. |
| Intervention | 43/238 (18%) | 22/100 (22%) | 1.20 (0.57–2.5), p=0.64 | 1.37 (0.47–4.03), p=0.57 |
| Any bacteria | ||||
| Control | 142/228 (62%) | 70/106 (66%) | .. | .. |
| Intervention | 102/201 (51%) | 51/107 (48%) | 0.89 (0.66–1.20), p=0.44 | 0.90 (0.67–1.19), p=0.45 |
| Shigella | ||||
| Control | 67/228 (29%) | 36/106 (34%) | .. | .. |
| Intervention | 49/201 (24%) | 15/107 (14%) | 0.48 (0.28–0.83), p=0.009 | 0.49 (0.28–0.85), p=0.011 |
| ETEC | ||||
| Control | 70/228 (31%) | 30/106 (28%) | .. | .. |
| Intervention | 58/201 (29%) | 24/107 (22%) | 0.84 (0.46–1.52), p=0.56 | 0.85 (0.48–1.51), p=0.58 |
| Campylobacter | ||||
| Control | 27/228 (12%) | 14/106 (13%) | .. | .. |
| Intervention | 14/201 (7%) | 13/107 (12%) | 1.75 (0.63–4.87), p=0.29 | 1.75 (0.61–4.98), p=0.30 |
| C. difficile | ||||
| Control | 20/228 (8.8%) | 7/106 (6.6%) | .. | .. |
| Intervention | 13/201 (6.5%) | 7/107 (6.5%) | 1.33 (0.36–4.86), p=0.67 | 1.49 (0.41–5.44), p=0.55 |
| E. coli O157 | ||||
| Control | 7/228 (3.1%) | 3/106 (2.8%) | .. | .. |
| Intervention | 9/201 (4.5%) | 2/107 (1.9%) | 0.45 (0.06–3.66), p=0.46 | 0.53 (0.07–4.24), p=0.55 |
| STEC | ||||
| Control | 1/228 (0.44%) | 2/106 (1.9%) | .. | .. |
| Intervention | 9/201 (4.5%) | 1/107 (0.93%) | 0.05 (0.00–1.13), p=0.059 | 0.05 (0.00–1.26), p=0.070 |
| Any protozoa | ||||
| Control | 82/228 (36%) | 47/106 (44%) | .. | .. |
| Intervention | 74/201 (37%) | 43/107 (40%) | 0.84 (0.55–1.28), p=0.42 | 0.90 (0.62–1.30), p=0.58 |
| Giardia | ||||
| Control | 79/228 (35%) | 44/106 (42%) | .. | .. |
| Intervention | 68/201 (34%) | 41/107 (38%) | 0.90 (0.58–1.39), p=0.63 | 0.93 (0.64–1.36), p=0.70 |
| Cryptosporidium | ||||
| Control | 7/228 (3.1%) | 5/106 (4.7%) | .. | .. |
| Intervention | 12/201 (6%) | 5/107 (4.7%) | 0.45 (0.08–2.57), p=0.37 | 0.64 (0.12–3.51), p=0.61 |
| Any virus | ||||
| Control | 34/228 (15%) | 18/106 (17%) | .. | .. |
| Intervention | 36/201 (18%) | 18/107 (17%) | 0.83 (0.37–1.83), p=0.64 | 0.83 (0.37–1.87), p=0.66 |
| Norovirus GI/GII | ||||
| Control | 26/228 (11%) | 12/106 (11%) | .. | .. |
| Intervention | 26/201 (13%) | 17/107 (16%) | 1.24 (0.48–3.17), p=0.66 | 1.29 (0.49–3.41), p=0.61 |
| Adenovirus 40/41 | ||||
| Control | 7/228 (3.1%) | 4/106 (3.8%) | .. | .. |
| Intervention | 7/201 (3.5%) | 0/107 (0.0%) | ..§ | ..§ |
| Coinfection, ≥2 GPP pathogens | ||||
| Control | 92/228 (40%) | 52/106 (49%) | .. | .. |
| Intervention | 74/201 (37%) | 39/107 (36%) | 0.82 (0.56–1.21), p=0.33 | 0.86 (0.59–1.24), p=0.41 |
| Trichuris | ||||
| Control | 48/205 (23%) | 18/68 (26%) | .. | .. |
| Intervention | 41/183 (22%) | 5/75 (6.7%) | 0.25 (0.09–0.68), p=0.006 | 0.24 (0.10–0.60), p=0.002 |
| Ascaris | ||||
| Control | 45/205 (22%) | 16/68 (24%) | .. | .. |
| Intervention | 29/183 (16%) | 9/75 (12%) | 0.70 (0.30–1.64), p=0.42 | 0.68 (0.30–1.54), p=0.36 |
| Coinfection, ≥2 STH | ||||
| Control | 26/205 (13%) | 9/68 (13%) | .. | .. |
| Intervention | 18/183 (9.8%) | 1/75 (1.3%) | 0.13 (0.02–1.08), p=0.059 | 0.12 (0.01–1.02), p=0.052 |
-
Analysis includes children < 2 years old at baseline and children born into the study after baseline and <2 years old at the time of the 24-month visit. Prevalence results are presented as (n/N (%)). All effect estimates are presented as prevalence ratios (ratio of ratios) and estimated using generalized estimating equations to fit Poisson regression models with robust standard errors.
*Outcome was pre-specified in trial registration. All other outcomes are exploratory.
-
†Pathogen outcomes adjusted for child age and sex, caregiver’s education, and household wealth index. Reported diarrhea was also adjusted for baseline presence of a drop-hole cover and reported use of a tap on compound grounds as primary drinking water source. Sample sizes for adjusted analyses are slightly smaller than numbers presented in prevalence estimates due to missing covariate data.
§Models would not converge due to sparse data. Y. enterocolitica, V. cholerae, E. histolytica, and rotavirus were detected in <2% of samples in each arm at each phase and excluded. Descriptive data for these pathogens are available in the Appendix 1—table 2. Source files available in Table 3—source data 1 and Table 3—source code 1.
-
Table 3—source code 1
Intervention effect on children born after implementation.
- https://cdn.elifesciences.org/articles/62278/elife-62278-table3-code1-v3.zip
-
Table 3—source data 1
Intervention effect on children born after implementation.
- https://cdn.elifesciences.org/articles/62278/elife-62278-table3-data1-v3.xlsx
Appendix 1—table 1
Number and proportion of sample types collected in each arm at each phase.
| Baseline | 12 month | 24 month | ||||
|---|---|---|---|---|---|---|
| Control | Intervention | Control | Intervention | Control | Intervention | |
| Whole stool | 377 (96%) | 351 (97%) | 361 (91%) | 380 (93%) | 307 (67%) | 333 (72%) |
| Diarrheal diaper | 15 (3.8%) | 10 (2.8%) | 4 (1.0%) | 4 (0.98%) | 32 (7.0%) | 20 (4.3%) |
| Rectal swab* | 0 (0%) | 0 (0%) | 30 (7.6%) | 24 (5.9%) | 120 (26%) | 109 (24%) |
-
*Mean concentration of double-stranded DNA recovered from whole stool was 40.8 ng/μL (SD = 16.5, n = 33 with 57 samples excluded as their concentrations exceeded the upper detection limit of the assay), diaper samples was 28.7 ng/μL (SD = 16.9, n = 61 with 16 samples excluded as concentrations exceeded upper detection limit of assay), and rectal swabs was 26.3 ng/μL (SD = 15.5, n = 195 with 25 samples excluded as concentrations exceeded upper detection limit of assay). Only a subset of each sample type assayed for dsDNA concentration.
Appendix 1—table 2
Age stratified baseline prevalence of health outcomes.
| Baseline Prevalence | |||
|---|---|---|---|
| 1–11 months | 12–23 months | 24–48 months | |
| Any bacterial or protozoan infection | |||
| All children | 108/208 (52%) | 179/221 (81%) | 277/297 (93%) |
| Control | 57/109 (52%) | 101/119 (85%) | 143/152 (94%) |
| Intervention | 51/99 (52%) | 78/102 (76%) | 134/145 (92%) |
| Any STH infection | |||
| All children | 30/185 (16%) | 89/203 (44%) | 171/277 (62%) |
| Control | 17/93 (18%) | 50/112 (45%) | 94/144 (65%) |
| Intervention | 13/92 (14%) | 39/91 (43%) | 77/133 (58%) |
| Diarrhea | |||
| All children | 37/258 (14%) | 52/264 (20%) | 36/427 (8.4%) |
| Control | 19/138 (14%) | 27/146 (18%) | 20/234 (8.6%) |
| Intervention | 18/120 (15%) | 25/118 (21%) | 16/193 (8.3%) |
| Any bacterial infection | |||
| All children | 94/208 (45%) | 150/221 (68%) | 229/297 (77%) |
| Intervention | 53/109 (49%) | 89/119 (75%) | 117/152 (77%) |
| All children | 41/99 (41%) | 61/102 (60%) | 112/145 (77%) |
| Shigella | |||
| All children | 19/208 (9.1%) | 97/221 (44%) | 192/297 (65%) |
| Control | 10/109 (9.2%) | 57/119 (48%) | 101/152 (66%) |
| Intervention | 9/99 (9.1%) | 40/102 (39%) | 91/145 (63%) |
| ETEC | |||
| All children | 47/208 (23%) | 81/221 (37%) | 90/297 (30%) |
| Control | 25/109 (23%) | 45/119 (38%) | 43/152 (28%) |
| Intervention | 22/99 (22%) | 36/102 (35%) | 47/145 (32%) |
| Campylobacter | |||
| All children | 22/208 (11%) | 19/221 (8.6%) | 16/297 (5.4%) |
| Control | 14/109 (13%) | 13/119 (11%) | 10/152 (6.6%) |
| Intervention | 8/99 (8.1%) | 6/102 (5.9%) | 6/145 (4.1%) |
| C. difficile | |||
| All children | 23/208 (11%) | 10/221 (4.5%) | 2/297 (0.67%) |
| Control | 13/109 (12%) | 7/119 (5.9%) | 2/152 (1.3%) |
| Intervention | 10/99 (10%) | 3/102 (2.9%) | 0/145 (0.0%) |
| E. coli o157 | |||
| All children | 6/208 (2.9%) | 10/221 (4.5%) | 15/297 (5%) |
| Control | 4/109 (3.7%) | 3/119 (2.5%) | 6/152 (4%) |
| Intervention | 2/99 (2%) | 7/102 (6.9%) | 9/145 (6.2%) |
| STEC | |||
| All children | 3/208 (1.4%) | 7/221 (3.2%) | 3/297 (1%) |
| Control | 0/109 (0.0%) | 1/119 (0.84%) | 2/152 (1.3%) |
| Intervention | 3/99 (3%) | 6/102 (5.9%) | 1/145 (0.69%) |
| Y. enterocolitica | |||
| All children | 0/208 (0.0%) | 1/221 (0.45%) | 0/297 (0.0%) |
| Control | 0/109 (0.0%) | 0/119 (0.0%) | 0/152 (0.0%) |
| Intervention | 0/99 (0.0%) | 1/102 (0.98%) | 0/145 (0.0%) |
| V. cholerae | |||
| All children | 0/208 (0.0%) | 0/221 (0.0%) | 0/297 (0.0%) |
| Control | 0/109 (0.0%) | 0/119 (0.0%) | 0/152 (0.0%) |
| Intervention | 0/99 (0.0%) | 0/102 (0.0%) | 0/145 (0.0%) |
| Any Protozoa | |||
| All children | 36/208 (17%) | 120/221 (54%) | 223/297 (75%) |
| Control | 14/109 (13%) | 68/119 (57%) | 114/152 (75%) |
| Intervention | 22/99 (22%) | 52/102 (51%) | 109/145 (75%) |
| Giardia | |||
| All children | 28/208 (13%) | 119/221 (54%) | 219/297 (74%) |
| Control | 12/109 (11%) | 67/119 (56%) | 113/152 (74%) |
| Intervention | 16/99 (16%) | 52/102 (51%) | 106/145 (73%) |
| Cryptosporidium | |||
| All children | 10/208 (4.8%) | 9/221 (4.1%) | 5/297 (1.7%) |
| Control | 2/109 (1.8%) | 5/119 (4.2%) | 1/152 (0.66%) |
| Intervention | 8/99 (8.1%) | 4/102 (3.9%) | 4/145 (2.8%) |
| E. histolytica | |||
| All children | 1/208 (0.48%) | 0/221 (0.0%) | 3/297 (1%) |
| Control | 0/109 (0.0%) | 0/119 (0.0%) | 0/152 (0.0%) |
| Intervention | 1/99 (1%) | 0/102 (0.0%) | 3/145 (2.1%) |
| Any virus | |||
| All children | 36/208 (17%) | 34/221 (15%) | 33/297 (11%) |
| Control | 15/109 (14%) | 19/119 (16%) | 19/152 (13%) |
| Intervention | 21/99 (21%) | 15/102 (15%) | 14/145 (9.7%) |
| Norovirus GI/GII | |||
| All children | 27/208 (13%) | 25/221 (11%) | 23/297 (7.7%) |
| Control | 12/109 (11%) | 14/119 (12%) | 12/152 (7.9%) |
| Intervention | 15/99 (15%) | 11/102 (11%) | 11/145 (7.6%) |
| Adenovirus 40/41 | |||
| All children | 7/208 (3.4%) | 7/221 (3.2%) | 8/297 (2.7%) |
| Control | 4/109 (3.7%) | 3/119 (2.5%) | 6/152 (4%) |
| Intervention | 3/99 (3%) | 4/102 (3.9%) | 2/145 (1.4%) |
| Rotavirus A | |||
| All children | 3/208 (1.4%) | 5/221 (2.3%) | 2/297 (0.67%) |
| Control | 0/109 (0.0%) | 2/119 (1.7%) | 1/152 (0.66%) |
| Intervention | 3/99 (3%) | 3/102 (2.9%) | 1/145 (0.69%) |
| Coinfection, ≥2 GPP pathogens | |||
| All children | 48/208 (23%) | 118/221 (53%) | 203/297 (68%) |
| Control | 23/109 (21%) | 69/119 (58%) | 104/152 (68%) |
| Intervention | 25/99 (25%) | 49/102 (48%) | 99/145 (68%) |
| Trichuris | |||
| All children | 20/185 (11%) | 69/203 (34%) | 150/277 (54%) |
| Control | 10/93 (11%) | 38/112 (34%) | 82/144 (57%) |
| Intervention | 10/92 (11%) | 31/91 (34%) | 68/133 (51%) |
| Ascaris | |||
| All children | 21/185 (11%) | 53/203 (26%) | 81/277 (29%) |
| Control | 12/93 (13%) | 33/112 (29%) | 47/144 (33%) |
| Intervention | 9/92 (9.8%) | 20/91 (22%) | 34/133 (26%) |
| Coinfection, ≥2 STH | |||
| All children | 11/185 (6%) | 33/203 (16%) | 60/277 (22%) |
| Control | 5/93 (5.4%) | 21/112 (19%) | 35/144 (24%) |
| Intervention | 6/92 (6.5%) | 12/91 (13%) | 25/133 (19%) |
| Number of GPP infections | |||
| All children | 0.94 (1.1) | 1.8 (1.2) | 1.9 (0.95) |
| Control | 0.88 (1.1) | 1.8 (1.1) | 2 (0.93) |
| Intervention | 1 (1.1) | 1.7 (1.3) | 1.9 (0.98) |
| Number of STH infections | |||
| All children | 0.23 (0.55) | 0.61 (0.75) | 0.86 (0.76) |
| Control | 0.24 (0.54) | 0.64 (0.78) | 0.9 (0.76) |
| Intervention | 0.23 (0.56) | 0.57 (0.72) | 0.8 (0.76) |
-
Data presented n/N (%) or mean (standard deviation). All bacterial, protozoan, and viral pathogens were measured using the Luminex Gastrointestinal Pathogen panel. STH were measured using the Kato-Katz method. Diarrhea was measured via caregiver report in household surveys.
Appendix 1—table 3
Baseline enrollment characteristics of children with and without repeated measures at the 12-month phase.
Results are presented for all children combined and stratified by study arm.
| All children | Control | Intervention | |||||||
|---|---|---|---|---|---|---|---|---|---|
| BL and 12M* | BL only† | Std. diff.‡ | BL and 12M | BL only | Std. diff. | BL and 12M | BL only | Std. diff. | |
| Outcomes | |||||||||
| Diarrhea | 83/609 (14%) | 43/365 (12%) | 0.06 | 38/310 (12%) | 29/216 (13%) | 0.03 | 45/299 (15%) | 14/149 (9.4%) | 0.17 |
| Any bacterial or protozoan infection | 376/485 (78%) | 215/268 (80%) | 0.07 | 184/234 (79%) | 129/158 (82%) | 0.08 | 192/251 (76%) | 86/110 (78%) | 0.04 |
| Any GPP infection | 390/485 (80%) | 225/268 (84%) | 0.09 | 188/234 (80%) | 135/158 (85%) | 0.14 | 202/251 (80%) | 90/110 (82%) | 0.03 |
| Any bacterial infection | 311/485 (64%) | 187/268 (70%) | 0.12 | 157/234 (67%) | 114/158 (72%) | 0.11 | 154/251 (61%) | 73/110 (66%) | 0.10 |
| Shigella | 200/485 (41%) | 131/268 (49%) | 0.15 | 101/234 (43%) | 78/158 (49%) | 0.12 | 99/251 (39%) | 53/110 (48%) | 0.18 |
| ETEC | 147/485 (30%) | 79/268 (29%) | 0.02 | 68/234 (29%) | 48/158 (30%) | 0.03 | 79/251 (31%) | 31/110 (28%) | 0.07 |
| Campylobacter | 37/485 (7.6%) | 23/268 (8.6%) | 0.03 | 22/234 (9.4%) | 17/158 (11%) | 0.05 | 15/251 (6%) | 6/110 (5.5%) | 0.02 |
| C. difficile | 23/485 (4.7%) | 12/268 (4.5%) | 0.01 | 15/234 (6.4%) | 7/158 (4.4%) | 0.09 | 8/251 (3.2%) | 5/110 (4.5%) | 0.07 |
| E. coli O157 | 19/485 (3.9%) | 12/268 (4.5%) | 0.03 | 9/234 (3.9%) | 4/158 (2.5%) | 0.07 | 10/251 (4%) | 8/110 (7.3%) | 0.14 |
| STEC | 7/485 (1.4%) | 6/268 (2.2%) | 0.06 | 1/234 (0.43%) | 2/158 (1.3%) | 0.09 | 6/251 (2.4%) | 4/110 (3.6%) | 0.07 |
| Any protozoan infection | 257/485 (53%) | 143/268 (53%) | 0.01 | 126/234 (54%) | 79/158 (50%) | 0.08 | 131/251 (52%) | 64/110 (58%) | 0.12 |
| Giardia | 247/485 (51%) | 140/268 (52%) | 0.03 | 122/234 (52%) | 79/158 (50%) | 0.04 | 125/251 (50%) | 61/110 (55%) | 0.11 |
| Cryptosporidium | 20/485 (4.1%) | 4/268 (1.5%) | 0.16 | 7/234 (3%) | 1/158 (0.63%) | 0.18 | 13/251 (5.2%) | 3/110 (2.7%) | 0.13 |
| E. histolytica | 2/485 (0.41%) | 2/268 (0.75%) | 0.04 | 0/234 (0.0%) | 0/158 (0.0%) | . .** | 2/251 (0.80%) | 2/110 (1.8%) | 0.09 |
| Any viral infection | 66/485 (14%) | 39/268 (15%) | 0.03 | 31/234 (13%) | 22/158 (14%) | 0.02 | 35/251 (14%) | 17/110 (15%) | 0.04 |
| Adenovirus 40/41 | 14/485 (2.9%) | 8/268 (3%) | 0.01 | 8/234 (3.4%) | 5/158 (3.2%) | 0.01 | 6/251 (2.4%) | 3/110 (2.7%) | 0.02 |
| Norovirus GI/GII | 50/485 (10%) | 27/268 (10%) | 0.01 | 23/234 (9.8%) | 15/158 (9.5%) | 0.01 | 27/251 (11%) | 12/110 (11%) | 0.00 |
| Rotavirus A | 5/485 (1%) | 5/268 (1.9%) | 0.07 | 1/234 (0.43%) | 2/158 (1.3%) | 0.09 | 4/251 (1.6%) | 3/110 (2.7%) | 0.08 |
| Coinfection, ≥2 GPP infections | 251/485 (52%) | 140/268 (52%) | 0.01 | 126/234 (54%) | 80/158 (51%) | 0.06 | 125/251 (50%) | 60/110 (55%) | 0.10 |
| Any STH infection | 202/447 (45%) | 106/242 (44%) | 0.03 | 106/218 (49%) | 64/142 (45%) | 0.07 | 96/229 (42%) | 42/100 (42%) | 0.00 |
| Ascaris | 109/447 (24%) | 54/242 (22%) | 0.05 | 65/218 (30%) | 30/142 (21%) | 0.20 | 44/229 (19%) | 24/100 (24%) | 0.12 |
| Trichuris | 170/447 (38%) | 86/242 (36%) | 0.05 | 85/218 (39%) | 54/142 (38%) | 0.02 | 85/229 (37%) | 32/100 (32%) | 0.11 |
| Coinfection,≥2 STH infections | 77/447 (17%) | 34/242 (14%) | 0.09 | 44/218 (20%) | 20/142 (14%) | 0.16 | 33/229 (14%) | 14/100 (14%) | 0.01 |
| Number of GPP infections | 1.6 (1.1) | 1.7 (1.1) | 0.07 | 1.6 (1.1) | 1.6 (1.1) | 0.02 | 1.6 (1.1) | 1.7 (1.2) | 0.14 |
| Number of STH infections | 0.64 (0.77) | 0.58 (0.73) | 0.08 | 0.7 (0.79) | 0.59 (0.73) | 0.14 | 0.59 (0.75) | 0.57 (0.73) | 0.03 |
| Child-, household-, compound-level characteristics | |||||||||
| Child sex, female | 319/614 (52%) | 174/350 (50%) | 0.04 | 169/312 (54%) | 97/208 (47%) | 0.15 | 150/302 (50%) | 77/142 (54%) | 0.09 |
| Child breastfed | 206/609 (34%) | 106/365 (29%) | 0.10 | 107/310 (35%) | 62/216 (29%) | 0.13 | 99/299 (33%) | 44/149 (30%) | 0.08 |
| Child exclusively breastfed | 51/609 (8.4%) | 35/365 (9.6%) | 0.04 | 27/310 (8.7%) | 22/216 (10%) | 0.05 | 24/299 (8%) | 13/149 (8.7%) | 0.03 |
| Child age at survey, days | 697 (409) | 697 (396) | 0.00 | 698 (409) | 703 (400) | 0.01 | 696 (409) | 689 (391) | 0.02 |
| Child age at sampling, days | 668 (399) | 656 (382) | 0.03 | 661 (397) | 655 (395) | 0.02 | 674 (402) | 657 (364) | 0.04 |
| Child wears diapers | 402/609 (66%) | 234/364 (64%) | 0.04 | 209/310 (67%) | 133/216 (62%) | 0.12 | 193/299 (65%) | 101/148 (68%) | 0.08 |
| Child feces disposed in latrine | 173/609 (28%) | 116/365 (32%) | 0.07 | 79/310 (25%) | 69/216 (32%) | 0.14 | 94/299 (31%) | 47/149 (32%) | 0.00 |
| Caregiver completed primary school | 333/614 (54%) | 193/365 (53%) | 0.03 | 163/312 (52%) | 124/216 (57%) | 0.10 | 170/302 (56%) | 69/149 (46%) | 0.20 |
| Mother alive | 576/590 (98%) | 353/358 (99%) | 0.07 | 295/301 (98%) | 208/212 (98%) | 0.01 | 281/289 (97%) | 145/146 (99%) | 0.16 |
| Respondent is child's mother | 414/605 (68%) | 238/357 (67%) | 0.04 | 222/307 (72%) | 146/212 (69%) | 0.08 | 192/298 (64%) | 92/145 (63%) | 0.02 |
| Household floors covered | 575/615 (94%) | 349/368 (95%) | 0.06 | 300/313 (96%) | 211/217 (97%) | 0.08 | 275/302 (91%) | 138/151 (91%) | 0.01 |
| Household walls made of sturdy material | 399/615 (65%) | 243/368 (66%) | 0.02 | 216/313 (69%) | 154/217 (71%) | 0.04 | 183/302 (61%) | 89/151 (59%) | 0.03 |
| Latrine has drop-hole | 359/604 (59%) | 193/364 (53%) | 0.13 | 169/307 (55%) | 109/214 (51%) | 0.08 | 190/297 (64%) | 84/150 (56%) | 0.16 |
| Latrine has vent-pipe | 93/605 (15%) | 44/364 (12%) | 0.10 | 21/308 (6.8%) | 12/214 (5.6%) | 0.05 | 72/297 (24%) | 32/150 (21%) | 0.07 |
| Latrine has ceramic or concrete slab or pedestal | 224/602 (37%) | 133/363 (37%) | 0.01 | 101/305 (33%) | 80/213 (38%) | 0.09 | 123/297 (41%) | 53/150 (35%) | 0.13 |
| Latrine has sturdy walls | 193/605 (32%) | 110/363 (30%) | 0.03 | 84/306 (27%) | 58/215 (27%) | 0.01 | 109/299 (36%) | 52/148 (35%) | 0.03 |
| Water tap on compound grounds | 468/606 (77%) | 285/364 (78%) | 0.03 | 224/308 (73%) | 162/214 (76%) | 0.07 | 244/298 (82%) | 123/150 (82%) | 0.00 |
| Household crowding,≥3 persons/room | 122/615 (20%) | 45/368 (12%) | 0.21 | 55/313 (18%) | 22/217 (10%) | 0.22 | 67/302 (22%) | 23/151 (15%) | 0.18 |
| Compound electricity normally functions | 556/615 (90%) | 331/372 (89%) | 0.05 | 272/313 (87%) | 195/220 (89%) | 0.05 | 284/302 (94%) | 136/152 (89%) | 0.17 |
| Standing water observed in compound | 44/605 (7.3%) | 26/363 (7.2%) | 0.00 | 7/306 (2.3%) | 7/215 (3.3%) | 0.06 | 37/299 (12%) | 19/148 (13%) | 0.01 |
| Leaking or standing wastewater observed in compound | 371/605 (61%) | 233/363 (64%) | 0.06 | 214/306 (70%) | 149/215 (69%) | 0.01 | 157/299 (53%) | 84/148 (57%) | 0.09 |
| Any animal observed | 395/615 (64%) | 226/372 (61%) | 0.07 | 189/313 (60%) | 129/220 (59%) | 0.04 | 206/302 (68%) | 97/152 (64%) | 0.09 |
| Dog observed | 51/615 (8.3%) | 23/372 (6.2%) | 0.08 | 18/313 (5.8%) | 10/220 (4.5%) | 0.05 | 33/302 (11%) | 13/152 (8.6%) | 0.08 |
| Chicken or duck observed | 94/615 (15%) | 36/372 (9.7%) | 0.17 | 43/313 (14%) | 27/220 (12%) | 0.04 | 51/302 (17%) | 9/152 (5.9%) | 0.35 |
| Cat observed | 341/615 (55%) | 205/372 (55%) | 0.01 | 167/313 (53%) | 120/220 (55%) | 0.02 | 174/302 (58%) | 85/152 (56%) | 0.03 |
| Faeces or used diapers observed around compound | 276/605 (46%) | 177/363 (49%) | 0.06 | 166/306 (54%) | 116/215 (54%) | 0.01 | 110/299 (37%) | 61/148 (41%) | 0.09 |
| Compound floods during rain | 377/615 (61%) | 226/372 (61%) | 0.01 | 211/313 (67%) | 137/220 (62%) | 0.11 | 166/302 (55%) | 89/152 (59%) | 0.07 |
| Number of household members | 6.4 (3.3) | 5.6 (2.6) | 0.27 | 6 (3) | 5.2 (2.1) | 0.33 | 6.8 (3.5) | 6.3 (3.1) | 0.18 |
| Household wealth score, 0–1 | 0.43 (0.1) | 0.44 (0.099) | 0.10 | 0.44 (0.1) | 0.45 (0.097) | 0.15 | 0.43 (0.1) | 0.43 (0.1) | 0.01 |
| Number of households in compound | 5.2 (4.6) | 4.7 (4.4) | 0.11 | 4.4 (2.9) | 3.8 (1.7) | 0.21 | 6.1 (5.6) | 6 (6.4) | 0.02 |
| Compound population | 21 (15) | 19 (14) | 0.18 | 17 (8.1) | 15 (6.1) | 0.22 | 26 (18) | 24 (20) | 0.11 |
| Number of water taps in compound | 1.5 (2.2) | 1.2 (1) | 0.22 | 1 (1.1) | 0.97 (0.83) | 0.04 | 2.1 (2.8) | 1.4 (1.2) | 0.30 |
| Number of latrines/drop-holes in compound | 1.1 (0.63) | 1.1 (0.65) | 0.00 | 1 (0.24) | 1 (0.2) | 0.04 | 1.2 (0.86) | 1.3 (0.97) | 0.03 |
| Compound population density | 0.084 (0.046) | 0.078 (0.045) | 0.13 | 0.076 (0.04) | 0.07 (0.039) | 0.14 | 0.092 (0.051) | 0.089 (0.05) | 0.06 |
-
Results are presented as prevalence (n/N (%)) or mean (standard deviation) at baseline.
*Prevalence (or mean (SD)) for children with repeated observations at baseline and 12-month visits.
-
†Prevalence (or mean (SD)) for children with observations at baseline visit and not the 12-month visit.
‡Standardized mean difference between observations of children with and without repeated measures at baseline and 12-month visits.
-
§ Could not be calculated.
Appendix 1—table 4
Baseline enrollment characteristics of children with and without repeated measures at the 24-month phase.
Results are presented for all children combined and stratified by study arm.
| All children | Control | Intervention | |||||||
|---|---|---|---|---|---|---|---|---|---|
| BL and 24M* | BL only† | Std. Diff.‡ | BL and 24M | BL only | Std. Diff. | BL and 24M | BL only | Std. Diff. | |
| Outcomes | |||||||||
| Diarrhea | 75/504 (15%) | 51/470 (11%) | 0.12 | 35/244 (14%) | 32/282 (11%) | 0.09 | 40/260 (15%) | 19/188 (10%) | 0.16 |
| Any bacterial or protozoan infection | 310/394 (79%) | 281/359 (78%) | 0.01 | 144/183 (79%) | 169/209 (81%) | 0.05 | 166/211 (79%) | 112/150 (75%) | 0.09 |
| Any GPP infection | 322/394 (82%) | 293/359 (82%) | 0.00 | 148/183 (81%) | 175/209 (84%) | 0.07 | 174/211 (82%) | 118/150 (79%) | 0.10 |
| Any bacterial infection | 251/394 (64%) | 247/359 (69%) | 0.11 | 120/183 (66%) | 151/209 (72%) | 0.14 | 131/211 (62%) | 96/150 (64%) | 0.04 |
| Shigella | 158/394 (40%) | 173/359 (48%) | 0.16 | 74/183 (40%) | 105/209 (50%) | 0.20 | 84/211 (40%) | 68/150 (45%) | 0.11 |
| ETEC | 115/394 (29%) | 111/359 (31%) | 0.04 | 53/183 (29%) | 63/209 (30%) | 0.03 | 62/211 (29%) | 48/150 (32%) | 0.06 |
| Campylobacter | 31/394 (7.9%) | 29/359 (8.1%) | 0.01 | 18/183 (9.8%) | 21/209 (10%) | 0.01 | 13/211 (6.2%) | 8/150 (5.3%) | 0.04 |
| C. difficile | 18/394 (4.6%) | 17/359 (4.7%) | 0.01 | 10/183 (5.5%) | 12/209 (5.7%) | 0.01 | 8/211 (3.8%) | 5/150 (3.3%) | 0.02 |
| E. coli O157 | 17/394 (4.3%) | 14/359 (3.9%) | 0.02 | 7/183 (3.8%) | 6/209 (2.9%) | 0.05 | 10/211 (4.7%) | 8/150 (5.3%) | 0.03 |
| STEC | 6/394 (1.5%) | 7/359 (1.9%) | 0.03 | 2/183 (1.1%) | 1/209 (0.48%) | 0.07 | 4/211 (1.9%) | 6/150 (4%) | 0.12 |
| Any protozoan infection | 214/394 (54%) | 186/359 (52%) | 0.05 | 96/183 (52%) | 109/209 (52%) | 0.01 | 118/211 (56%) | 77/150 (51%) | 0.09 |
| Giardia | 204/394 (52%) | 183/359 (51%) | 0.02 | 92/183 (50%) | 109/209 (52%) | 0.04 | 112/211 (53%) | 74/150 (49%) | 0.08 |
| Cryptosporidium | 20/394 (5.1%) | 4/359 (1.1%) | 0.23 | 7/183 (3.8%) | 1/209 (0.48%) | 0.23 | 13/211 (6.2%) | 3/150 (2%) | 0.21 |
| E. histolytica | 2/394 (0.51%) | 2/359 (0.56%) | 0.01 | 0/183 (0.0%) | 0/209 (0.0%) | ..§ | 2/211 (0.95%) | 2/150 (1.3%) | 0.04 |
| Any viral infection | 55/394 (14%) | 50/359 (14%) | 0.00 | 22/183 (12%) | 31/209 (15%) | 0.08 | 33/211 (16%) | 19/150 (13%) | 0.09 |
| Adenovirus 40/41 | 14/394 (3.5%) | 8/359 (2.2%) | 0.08 | 7/183 (3.8%) | 6/209 (2.9%) | 0.05 | 7/211 (3.3%) | 2/150 (1.3%) | 0.13 |
| Norovirus GI/GII | 42/394 (11%) | 35/359 (9.8%) | 0.03 | 15/183 (8.2%) | 23/209 (11%) | 0.10 | 27/211 (13%) | 12/150 (8%) | 0.16 |
| Rotavirus A | 3/394 (0.76%) | 7/359 (1.9%) | 0.10 | 1/183 (0.55%) | 2/209 (0.96%) | 0.05 | 2/211 (0.95%) | 5/150 (3.3%) | 0.17 |
| Coinfection,≥2 GPP infections | 206/394 (52%) | 185/359 (52%) | 0.02 | 97/183 (53%) | 109/209 (52%) | 0.02 | 109/211 (52%) | 76/150 (51%) | 0.02 |
| Any STH infection | 156/362 (43%) | 152/327 (46%) | 0.07 | 80/171 (47%) | 90/189 (48%) | 0.02 | 76/191 (40%) | 62/138 (45%) | 0.10 |
| Ascaris | 85/362 (23%) | 78/327 (24%) | 0.01 | 50/171 (29%) | 45/189 (24%) | 0.12 | 35/191 (18%) | 33/138 (24%) | 0.14 |
| Trichuris | 128/362 (35%) | 128/327 (39%) | 0.08 | 63/171 (37%) | 76/189 (40%) | 0.07 | 65/191 (34%) | 52/138 (38%) | 0.08 |
| Coinfection,≥2 STH infections | 57/362 (16%) | 54/327 (17%) | 0.02 | 33/171 (19%) | 31/189 (16%) | 0.08 | 24/191 (13%) | 23/138 (17%) | 0.12 |
| Number of GPP infections | 1.6 (1.1) | 1.6 (1.2) | 0.04 | 1.6 (1.1) | 1.7 (1.1) | 0.10 | 1.6 (1.1) | 1.6 (1.2) | 0.01 |
| Number of STH infections | 0.61 (0.75) | 0.64 (0.76) | 0.04 | 0.67 (0.78) | 0.65 (0.75) | 0.03 | 0.55 (0.72) | 0.63 (0.77) | 0.10 |
| Child-, household-, compound-level characteristics | |||||||||
| Child sex, female | 260/503 (52%) | 233/461 (51%) | 0.02 | 124/241 (51%) | 142/279 (51%) | 0.01 | 136/262 (52%) | 91/182 (50%) | 0.04 |
| Child breastfed | 172/504 (34%) | 140/470 (30%) | 0.09 | 87/244 (36%) | 82/282 (29%) | 0.14 | 85/260 (33%) | 58/188 (31%) | 0.04 |
| Child exclusively breastfed | 35/504 (6.9%) | 51/470 (11%) | 0.14 | 19/244 (7.8%) | 30/282 (11%) | 0.10 | 16/260 (6.2%) | 21/188 (11%) | 0.18 |
| Child age at survey, days | 698 (403) | 696 (405) | 0.01 | 689 (400) | 709 (410) | 0.05 | 707 (406) | 675 (398) | 0.08 |
| Child age at sampling, days | 675 (406) | 651 (379) | 0.06 | 666 (403) | 652 (390) | 0.04 | 682 (409) | 650 (364) | 0.08 |
| Child wears diapers | 343/504 (68%) | 293/469 (62%) | 0.12 | 171/244 (70%) | 171/282 (61%) | 0.20 | 172/260 (66%) | 122/187 (65%) | 0.02 |
| Child feces disposed in latrine | 138/504 (27%) | 151/470 (32%) | 0.10 | 57/244 (23%) | 91/282 (32%) | 0.20 | 81/260 (31%) | 60/188 (32%) | 0.02 |
| Caregiver completed primary school | 274/507 (54%) | 252/472 (53%) | 0.01 | 131/245 (53%) | 156/283 (55%) | 0.03 | 143/262 (55%) | 96/189 (51%) | 0.08 |
| Mother alive | 474/486 (98%) | 455/462 (98%) | 0.07 | 232/236 (98%) | 271/277 (98%) | 0.03 | 242/250 (97%) | 184/185 (99%) | 0.20 |
| Respondent is child's mother | 337/500 (67%) | 315/462 (68%) | 0.02 | 173/241 (72%) | 195/278 (70%) | 0.04 | 164/259 (63%) | 120/184 (65%) | 0.04 |
| Household floors covered | 469/507 (93%) | 455/476 (96%) | 0.13 | 233/245 (95%) | 278/285 (98%) | 0.13 | 236/262 (90%) | 177/191 (93%) | 0.09 |
| Household walls made of sturdy material | 337/507 (66%) | 305/476 (64%) | 0.05 | 184/245 (75%) | 186/285 (65%) | 0.22 | 153/262 (58%) | 119/191 (62%) | 0.08 |
| Latrine has drop-hole | 294/497 (59%) | 258/471 (55%) | 0.09 | 133/239 (56%) | 145/282 (51%) | 0.08 | 161/258 (62%) | 113/189 (60%) | 0.05 |
| Latrine has vent-pipe | 80/497 (16%) | 57/472 (12%) | 0.12 | 18/239 (7.5%) | 15/283 (5.3%) | 0.09 | 62/258 (24%) | 42/189 (22%) | 0.04 |
| Latrine has ceramic or concrete slab or pedestal | 184/494 (37%) | 173/471 (37%) | 0.01 | 77/236 (33%) | 104/282 (37%) | 0.09 | 107/258 (41%) | 69/189 (37%) | 0.10 |
| Latrine has sturdy walls | 165/501 (33%) | 138/467 (30%) | 0.07 | 67/240 (28%) | 75/281 (27%) | 0.03 | 98/261 (38%) | 63/186 (34%) | 0.08 |
| Water tap on compound grounds | 389/498 (78%) | 364/472 (77%) | 0.02 | 171/239 (72%) | 215/283 (76%) | 0.10 | 218/259 (84%) | 149/189 (79%) | 0.14 |
| Household crowding,≥3 persons/room | 114/507 (22%) | 53/476 (11%) | 0.31 | 45/245 (18%) | 32/285 (11%) | 0.20 | 69/262 (26%) | 21/191 (11%) | 0.40 |
| Compound electricity normally functions | 454/507 (90%) | 433/480 (90%) | 0.02 | 214/245 (87%) | 253/288 (88%) | 0.02 | 240/262 (92%) | 180/192 (94%) | 0.08 |
| Standing water observed in compound | 39/501 (7.8%) | 31/467 (6.6%) | 0.04 | 7/240 (2.9%) | 7/281 (2.5%) | 0.03 | 32/261 (12%) | 24/186 (13%) | 0.02 |
| Leaking or standing wastewater observed in compound | 308/501 (61%) | 296/467 (63%) | 0.04 | 164/240 (68%) | 199/281 (71%) | 0.05 | 144/261 (55%) | 97/186 (52%) | 0.06 |
| Any animal observed | 337/507 (66%) | 284/480 (59%) | 0.15 | 156/245 (64%) | 162/288 (56%) | 0.15 | 181/262 (69%) | 122/192 (64%) | 0.12 |
| Dog observed | 49/507 (9.7%) | 25/480 (5.2%) | 0.17 | 17/245 (6.9%) | 11/288 (3.8%) | 0.14 | 32/262 (12%) | 14/192 (7.3%) | 0.17 |
| Chicken or duck observed | 71/507 (14%) | 59/480 (12%) | 0.05 | 32/245 (13%) | 38/288 (13%) | 0.00 | 39/262 (15%) | 21/192 (11%) | 0.12 |
| Cat observed | 294/507 (58%) | 252/480 (53%) | 0.11 | 143/245 (58%) | 144/288 (50%) | 0.17 | 151/262 (58%) | 108/192 (56%) | 0.03 |
| Feces or used diapers observed around compound | 218/501 (44%) | 235/467 (50%) | 0.14 | 120/240 (50%) | 162/281 (58%) | 0.15 | 98/261 (38%) | 73/186 (39%) | 0.03 |
| Compound floods during rain | 310/507 (61%) | 293/480 (61%) | 0.00 | 166/245 (68%) | 182/288 (63%) | 0.10 | 144/262 (55%) | 111/192 (58%) | 0.06 |
| Number of household members | 6.7 (3.4) | 5.5 (2.6) | 0.39 | 6.3 (3) | 5.2 (2.2) | 0.42 | 7.1 (3.6) | 6.1 (3) | 0.31 |
| Household wealth score, 0–1 | 0.43 (0.11) | 0.44 (0.097) | 0.12 | 0.44 (0.1) | 0.45 (0.095) | 0.10 | 0.42 (0.11) | 0.43 (0.1) | 0.11 |
| Number of households in compound | 5.3 (4.7) | 4.7 (4.3) | 0.13 | 4.4 (3.1) | 3.9 (1.8) | 0.21 | 6.1 (5.7) | 5.9 (6.2) | 0.03 |
| Compound population | 22 (15) | 18 (14) | 0.26 | 17 (8.1) | 15 (6.5) | 0.27 | 27 (18) | 23 (19) | 0.18 |
| Number of water taps in compound | 1.6 (2.2) | 1.2 (1.3) | 0.24 | 1 (1) | 0.99 (0.92) | 0.02 | 2.2 (2.8) | 1.4 (1.8) | 0.31 |
| Number of latrines in compound | 1.1 (0.62) | 1.1 (0.65) | 0.01 | 1 (0.25) | 1 (0.19) | 0.04 | 1.2 (0.82) | 1.3 (0.99) | 0.08 |
| Compound population density | 0.084 (0.049) | 0.079 (0.042) | 0.13 | 0.072 (0.038) | 0.075 (0.04) | 0.05 | 0.096 (0.055) | 0.084 (0.044) | 0.23 |
-
Results are presented as prevalence (n/N (%)) or mean (standard deviation) at baseline.
*Prevalence (or mean (SD)) for children with repeated observations at baseline and 24-month visits.
-
†Prevalence (or mean (SD)) for children with observations at the baseline visit and not the 24-month visit.
‡Standardized mean difference between observations of children with and without repeated measures at baseline and 24-month visits.
-
§Could not be calculated.
Appendix 1—table 5
Balance of characteristics measured at 12-month visits between children with repeat observations at baseline and 12-month and children with observations at the 12-month phase only.
| All Children | Control | Intervention | ||||||||
|---|---|---|---|---|---|---|---|---|---|---|
| BL and 12M* | 12M only† | Std. Diff.‡ | BL and 12M | 12M only | Std. Diff. | BL and 12M | 12M only | Std. Diff. | Std. Diff. Control v. Interv.§ | |
| Child sex, female | 319/614 (52%) | 156/313 (50%) | 0.04 | 169/312 (54%) | 73/155 (47%) | 0.14 | 150/302 (50%) | 83/158 (53%) | 0.06 | 0.11 |
| Child breastfed | 27/562 (4.8%) | 161/305 (53%) | 1.25 | 13/280 (4.6%) | 76/151 (50%) | 1.19 | 14/282 (5%) | 85/154 (55%) | 1.31 | 0.10 |
| Child exclusively breastfed | 3/562 (0.53%) | 38/305 (12%) | 0.50 | 2/280 (0.71%) | 16/151 (11%) | 0.44 | 1/282 (0.35%) | 22/154 (14%) | 0.56 | 0.11 |
| Caregiver completed primary school | 305/614 (50%) | 144/309 (47%) | 0.06 | 156/312 (50%) | 62/153 (41%) | 0.19 | 149/302 (49%) | 82/156 (53%) | 0.06 | 0.24 |
| Child wears diapers | 83/563 (15%) | 194/305 (64%) | 1.16 | 40/281 (14%) | 92/151 (61%) | 1.10 | 43/282 (15%) | 102/154 (66%) | 1.21 | 0.11 |
| Respondent is child's mother | 365/563 (65%) | 236/305 (77%) | 0.28 | 188/281 (67%) | 121/151 (80%) | 0.30 | 177/282 (63%) | 115/154 (75%) | 0.26 | 0.13 |
| Household floors covered | 584/615 (95%) | 305/321 (95%) | 0.00 | 299/313 (96%) | 155/163 (95%) | 0.02 | 285/302 (94%) | 150/158 (95%) | 0.03 | 0.01 |
| Household walls made of sturdy material | 398/615 (65%) | 189/321 (59%) | 0.12 | 212/313 (68%) | 101/163 (62%) | 0.12 | 186/302 (62%) | 88/158 (56%) | 0.12 | 0.13 |
| Household crowding,≥3 persons/room | 210/615 (34%) | 106/321 (33%) | 0.02 | 111/313 (35%) | 54/163 (33%) | 0.05 | 99/302 (33%) | 52/158 (33%) | 0.00 | 0.00 |
| Compound electricity normally functions | 575/615 (94%) | 304/324 (94%) | 0.01 | 286/313 (91%) | 152/164 (93%) | 0.05 | 289/302 (96%) | 152/160 (95%) | 0.03 | 0.10 |
| Any animal observed | 505/611 (83%) | 275/324 (85%) | 0.06 | 235/309 (76%) | 131/164 (80%) | 0.09 | 270/302 (89%) | 144/160 (90%) | 0.02 | 0.29 |
| Dog observed | 134/611 (22%) | 81/324 (25%) | 0.07 | 57/309 (18%) | 37/164 (23%) | 0.10 | 77/302 (26%) | 44/160 (28%) | 0.05 | 0.11 |
| Chicken or duck observed | 77/611 (13%) | 42/324 (13%) | 0.01 | 34/309 (11%) | 18/164 (11%) | 0.00 | 43/302 (14%) | 24/160 (15%) | 0.02 | 0.12 |
| Cat observed | 469/611 (77%) | 249/324 (77%) | 0.00 | 218/309 (71%) | 118/164 (72%) | 0.03 | 251/302 (83%) | 131/160 (82%) | 0.03 | 0.24 |
| Compound floods during rain | 220/615 (36%) | 119/324 (37%) | 0.02 | 132/313 (42%) | 64/164 (39%) | 0.06 | 88/302 (29%) | 55/160 (34%) | 0.11 | 0.10 |
| Child age at survey, days | 1114 (415) | 622 (502) | 1.07 | 1105 (413) | 684 (535) | 0.88 | 1122 (417) | 560 (461) | 1.28 | 0.25 |
| Child age at sampling, days | 1102 (417) | 605 (484) | 1.10 | 1080 (414) | 649 (516) | 0.92 | 1122 (420) | 563 (450) | 1.29 | 0.18 |
| Number of household members | 6.5 (3.2) | 6.3 (3.3) | 0.06 | 6.2 (3) | 6.4 (3.5) | 0.05 | 6.8 (3.3) | 6.2 (3.2) | 0.17 | 0.05 |
| Household wealth score, 0–1 | 0.4 (0.11) | 0.39 (0.11) | 0.02 | 0.4 (0.11) | 0.39 (0.11) | 0.12 | 0.39 (0.1) | 0.4 (0.1) | 0.10 | 0.11 |
| Number of households in compound | 5.2 (4.7) | 5.4 (5.5) | 0.04 | 4.2 (2.9) | 4 (2.3) | 0.09 | 6.3 (5.9) | 6.9 (7.3) | 0.09 | 0.53 |
| Compound population | 23 (22) | 24 (26) | 0.04 | 18 (9.7) | 18 (8.7) | 0.05 | 28 (29) | 30 (35) | 0.07 | 0.50 |
| Compound population density | 0.086 (0.049) | 0.084 (0.051) | 0.04 | 0.08 (0.043) | 0.078 (0.044) | 0.05 | 0.091 (0.054) | 0.089 (0.058) | 0.03 | 0.22 |
-
Results are presented as prevalence (n/N (%)) or mean (standard deviation) at 12-month visit.
*Prevalence (or mean (SD)) for children with repeated observations at baseline and 12-month visits.
-
†Prevalence (or mean (SD)) for children with observations at the 12-month visit only.
‡Standardized mean difference between observations of children with and without repeated measures at baseline and 12-month visits.
-
§Standardized mean difference between observations from control and intervention children measured at 12-month visit only.
Appendix 1—table 6
Balance of characteristics measured at 24-month visits between children with repeat observations at baseline and 24-month and children with observations at the 24-month phase only.
| All Children | Control | Intervention | ||||||||
|---|---|---|---|---|---|---|---|---|---|---|
| BL and 24M* | 24M only† | Std. Diff.† | BL and 24M | 24M only | Std. Diff. | BL and 24M | 24M only | Std. Diff. | Std. Diff. Control v. Interv.§ | |
| Child sex, female | 260/503 (52%) | 190/428 (44%) | 0.15 | 124/241 (51%) | 96/222 (43%) | 0.16 | 136/262 (52%) | 94/206 (46%) | 0.13 | 0.05 |
| Child breastfed | 0/418 (0.0%) | 129/381 (34%) | 1.01 | 0/195 (0.0%) | 68/194 (35%) | 1.04 | 0/223 (0.0%) | 61/187 (33%) | 0.98 | 0.05 |
| Child exclusively breastfed | 0/418 (0.0%) | 36/381 (9.4%) | 0.46 | 0/195 (0.0%) | 16/194 (8.3%) | 0.42 | 0/223 (0.0%) | 20/187 (11%) | 0.49 | 0.08 |
| Caregiver completed primary school | 199/507 (39%) | 164/427 (38%) | 0.02 | 88/245 (36%) | 82/221 (37%) | 0.02 | 111/262 (42%) | 82/206 (40%) | 0.05 | 0.06 |
| Child wears diapers | 3/419 (0.72%) | 196/381 (51%) | 1.42 | 1/196 (0.51%) | 101/194 (52%) | 1.44 | 2/223 (0.9%) | 95/187 (51%) | 1.39 | 0.03 |
| Respondent is child's mother | 259/419 (62%) | 298/381 (78%) | 0.36 | 129/196 (66%) | 161/194 (83%) | 0.40 | 130/223 (58%) | 137/187 (73%) | 0.32 | 0.24 |
| Household floors covered | 484/507 (95%) | 459/467 (98%) | 0.16 | 237/245 (97%) | 234/239 (98%) | 0.07 | 247/262 (94%) | 225/228 (99%) | 0.24 | 0.06 |
| Household walls made of sturdy material | 352/507 (69%) | 296/467 (63%) | 0.13 | 180/245 (73%) | 157/239 (66%) | 0.17 | 172/262 (66%) | 139/228 (61%) | 0.10 | 0.10 |
| Household crowding,≥3 persons/room | 137/507 (27%) | 108/467 (23%) | 0.09 | 74/245 (30%) | 66/239 (28%) | 0.06 | 63/262 (24%) | 42/228 (18%) | 0.14 | 0.22 |
| Compound electricity normally functions | 485/507 (96%) | 472/494 (96%) | 0.01 | 230/245 (94%) | 237/254 (93%) | 0.02 | 255/262 (97%) | 235/240 (98%) | 0.04 | 0.23 |
| Any animal observed | 384/507 (76%) | 359/494 (73%) | 0.07 | 162/245 (66%) | 182/254 (72%) | 0.12 | 222/262 (85%) | 177/240 (74%) | 0.27 | 0.05 |
| Dog observed | 70/507 (14%) | 78/494 (16%) | 0.06 | 30/245 (12%) | 40/254 (16%) | 0.10 | 40/262 (15%) | 38/240 (16%) | 0.02 | 0.00 |
| Chicken or duck observed | 63/507 (12%) | 52/494 (11%) | 0.06 | 22/245 (9%) | 32/254 (13%) | 0.12 | 41/262 (16%) | 20/240 (8.3%) | 0.23 | 0.14 |
| Cat observed | 360/507 (71%) | 340/494 (69%) | 0.05 | 154/245 (63%) | 174/254 (69%) | 0.12 | 206/262 (79%) | 166/240 (69%) | 0.22 | 0.01 |
| Compound floods during rain | 182/507 (36%) | 184/494 (37%) | 0.03 | 89/245 (36%) | 107/254 (42%) | 0.12 | 93/262 (36%) | 77/240 (32%) | 0.07 | 0.21 |
| Child age at survey, days | 1518 (407) | 740 (518) | 1.67 | 1520 (406) | 749 (541) | 1.61 | 1516 (408) | 731 (494) | 1.73 | 0.04 |
| Child age at sampling, days | 1510 (415) | 694 (478) | 1.82 | 1505 (408) | 716 (512) | 1.70 | 1516 (422) | 672 (439) | 1.96 | 0.09 |
| Number of household members | 6.6 (3.1) | 6.3 (3.4) | 0.10 | 6.5 (3) | 6.6 (3.8) | 0.04 | 6.7 (3.1) | 6 (2.8) | 0.26 | 0.20 |
| Household wealth score, 0–1 | 0.41 (0.11) | 0.41 (0.11) | 0.01 | 0.41 (0.12) | 0.4 (0.11) | 0.11 | 0.41 (0.1) | 0.42 (0.097) | 0.15 | 0.19 |
| Number of households in compound | 5.3 (4.9) | 5.5 (5.5) | 0.04 | 4.3 (2.8) | 4.4 (3.2) | 0.03 | 6.2 (6.1) | 6.6 (6.9) | 0.06 | 0.41 |
| Compound population | 21 (15) | 21 (16) | 0.04 | 18 (9.5) | 17 (8.9) | 0.07 | 25 (19) | 25 (21) | 0.00 | 0.47 |
| Compound population density | 0.08 (0.047) | 0.08 (0.047) | 0.01 | 0.074 (0.037) | 0.075 (0.042) | 0.03 | 0.087 (0.053) | 0.085 (0.052) | 0.03 | 0.22 |
-
Results are presented as prevalence (n/N (%)) or mean (standard deviation) at 24-month visit.
* Prevalence (or mean (SD)) for children with repeated observations at baseline and 24-month visits.
-
†Prevalence (or mean (SD)) for children with observations at the 24-month visit only.
‡Standardized mean difference between observations of children with and without repeated measures at baseline and 24-month visits.
-
§Standardized mean difference between observations from control and intervention children measured at 24-month visit only.
Appendix 1—table 7
Sensitivity analysis assessing the impact of reported deworming on STH effect estimates 12 and 24 months after the intervention.
| 12-month Prevalence ratio | 24-month Prevalence ratio | |||||
|---|---|---|---|---|---|---|
| Main analysis, all children* | Adjusted for reported deworming † | Restricted to children dewormed at baseline ‡ | Main analysis, all children* | Adjusted for reported deworming † | Adjusted for time since deworming§ | |
| n = 1239 | n = 1239 | n = 1031 | n = 1161 | n = 1161 | N = 1159 | |
| Any STH infection | 1.11 (0.89–1.38) | 1.09 (0.87–1.35) | 1.06 (0.84–1.33) | 0.95 (0.77–1.17) | 0.93 (0.77–1.16) | 0.93 (0.75–1.14) |
| Trichuris | 1.01 (0.79–1.28) | 0.98 (0.77–1.24) | 0.96 (0.74–1.23) | 0.86 (0.67–1.10) | 0.85 (0.66–1.08) | 0.86 (0.67–1.09) |
| Ascaris | 1.33 (0.92–1.93) | 1.30 (0.90–1.88) | 1.30 (0.87–1.94) | 0.83 (0.54–1.27) | 0.84 (0.55–1.29) | 0.78 (0.51–1.18) |
| Coinfection,≥2 STH | 1.17 (0.76–1.79) | 1.12 (0.73–1.71) | 1.16 (0.73–1.85) | 0.63 (0.37–1.07) | 0.63 (0.37–1.08) | 0.60 (0.35–1.03) |
-
All effect estimates are presented as prevalence ratios (ratio of ratios) with 95% confidence intervals and estimated using generalized estimating equations to fit Poisson regression models with robust standard errors. All models adjusted for child age, sex, caregiver education level, and household wealth.
*Analysis includes all children regardless of caregiver-reported deworming status.
-
†Analysis is adjusted for reported deworming status. Effect estimates at 12 month are adjusted for baseline deworming confirmation, effect estimates at 24 month are adjusted for baseline and/or 12 month deworming confirmation.
‡Analysis is restricted to children whose caregivers confirmed baseline deworming.
-
§ Adjusted for time between 12 month deworming and 24 month sample collection, time broken into three intervals: 0–3 months, 4–6 months, and >6 months. The NDC performed 12 month deworming activities at the end of the 12 month phase instead of concurrent to 12 month sample collection resulting in some variation in the amount of time between 12 month deworming and 24 month sample collection among participants. All samples collected during 12 month phase were collected >6 months after deworming and no adjustment for time since deworming was made.
Appendix 1—table 8
Sensitivity analysis assessing impact of independent upgrading of control sanitation facilities on effect estimates.
| 12-month adjusted prevalence ratio | 24 month adjusted prevalence ratio | |||
|---|---|---|---|---|
| Main analysis, all children* | Excluding controls with upgraded sanitation† | Main analysis, all children* | Excluding controls with upgraded sanitation† | |
| Any bacterial or protozoan infection | 1.04 (0.94–1.15), n = 1510 | 1.05 (0.95–1.16), n = 1491 | 0.99 (0.91–1.09), n = 1536 | 1.00 (0.91–1.10), n = 1502 |
| Any STH infection | 1.11 (0.89–1.38), n = 1239 | 1.11 (0.89–1.38), n = 1225 | 0.95 (0.77–1.17), n = 1161 | 0.94 (0.76–1.16), n = 1148 |
| Diarrhea | 1.69 (0.89–3.21), n = 1594 | 1.76 (0.91–3.39), n = 1575 | 0.84 (0.47–1.51), n = 1502 | 0.81 (0.45–1.48), n = 1471 |
-
All effect estimates are presented as prevalence ratios (ratio of ratios) with 95% confidence intervals and estimated using generalized estimating equations to fit Poisson regression models with robust standard errors. All infection outcomes are adjusted for child age and sex, caregiver’s education, and household wealth index, and the diarrhea outcome is also adjusted for baseline presence of a drop-hole cover and reported use of a tap on compound grounds as primary drinking water source.
* Results represent effect estimates for the main analyses which included control children irrespective of whether their latrines had been independently upgraded (results also presented in Table 2 in main text).
-
† Results from sensitivity analyses which exclude control children living in compounds that independently upgraded their latrines to be similar to the intervention.
Appendix 1—table 9
Confounding assessment for primary outcome and both secondary outcomes (any STH, diarrhea) at 12 months.
| n/N (%) or mean (SD) at Baseline | Std diff.* | Primary outcome Unadjusted† | Primary outcome Adjusted‡ | Any STH Unadjusted† | Any STH Adjusted‡ | Diarrhea Unadjusted† | Diarrhea Adjusted‡ | ||
|---|---|---|---|---|---|---|---|---|---|
| Variable | Control | Inter-vention. | Comparator PR: 1.04 (0.94–1.15) | Comparator aPR: 1.04 (0.94–1.15) | Comparator PR: 1.12 (0.89–1.40) | Comparator aPR: 1.11 (0.90–1.38) | Comparator PR: 1.41 (0.80–2.48) | Comparator aPR: 1.32 (0.75–2.33) | |
| Female | 266/520 (51%) | 227/444 (51%) | 0.00 | 1.04 (0.94–1.15) | 1.04 (0.94–1.15) | 1.14 (0.91–1.42) | 1.11 (0.89–1.38) | 1.39 (0.79–2.46) | 1.32 (0.75–2.33) |
| Any breastfeeding | 169/526 (32%) | 143/448 (32%) | 0.00 | 1.05 (0.95–1.15) | 1.05 (0.95–1.15) | 1.11 (0.90–1.38) | 1.11 (0.90–1.38) | 1.39 (0.79–2.45) | 1.33 (0.75–2.35) |
| Caregiver completed primary school | 287/528 (54%) | 239/451 (53%) | 0.03 | 1.04 (0.94–1.15) | 1.04 (0.94–1.15) | 1.12 (0.90–1.41) | 1.11 (0.89–1.38) | 1.40 (0.80–2.48) | 1.32 (0.75–2.33) |
| Respondent is mother | 368/519 (71%) | 284/443 (64%) | 0.15 | 1.05 (0.95–1.16) | 1.04 (0.94–1.15) | 1.13 (0.90–1.42) | 1.11 (0.89–1.38) | 1.37 (0.78–2.42) | 1.29 (0.73–2.28) |
| Household floors covered | 511/530 (96%) | 413/453 (91%) | 0.22 | 1.04 (0.94–1.15) | 1.04 (0.94–1.15) | 1.12 (0.89–1.40) | 1.12 (0.90–1.39) | 1.39 (0.79–2.47) | 1.32 (0.74–2.34) |
| Household walls made of sturdy material | 370/530 (70%) | 272/453 (60%) | 0.21 | 1.04 (0.94–1.15) | 1.04 (0.94–1.15) | 1.12 (0.89–1.40) | 1.11 (0.89–1.38) | 1.41 (0.80–2.48) | 1.32 (0.75–2.33) |
| Drinking water source in compound | 386/522 (74%) | 367/448 (82%) | 0.19 | 1.03 (0.93–1.15) | 1.03 (0.93–1.14) | 1.08 (0.85–1.36) | 1.05 (0.83–1.33) | 1.65 (0.89–3.06) | 1.59 (0.85–2.95) |
| Faeces visible around compound grounds | 282/521 (54%) | 171/447 (38%) | 0.32 | 1.03 (0.93–1.13) | 1.03 (0.93–1.13) | 1.14 (0.91–1.43) | 1.12 (0.90–1.40) | 1.43 (0.81–2.54) | 1.35 (0.76–2.40) |
| Compound floods when it rains | 348/533 (65%) | 255/454 (56%) | 0.19 | 1.04 (0.94–1.15) | 1.04 (0.94–1.15) | 1.12 (0.89–1.40) | 1.11 (0.89–1.38) | 1.41 (0.80–2.49) | 1.32 (0.74–2.33) |
| Latrine drop-hole has cover | 278/521 (53%) | 274/447 (61%) | 0.16 | 1.04 (0.94–1.15) | 1.03 (0.93–1.15) | 1.11 (0.88–1.40) | 1.08 (0.85–1.36) | 1.74 (0.92–3.30) | 1.69 (0.89–3.20) |
| Latrine has ceramic/concrete slab or pedestal | 181/518 (35%) | 176/447 (39%) | 0.09 | 1.04 (0.94–1.15) | 1.04 (0.93–1.15) | 1.10 (0.87–1.39) | 1.07 (0.85–1.35) | 1.71 (0.90–3.24) | 1.65 (0.87–3.14) |
| Latrine walls made of sturdy material | 142/521 (27%) | 161/447 (36%) | 0.19 | 1.03 (0.93–1.14) | 1.03 (0.93–1.13) | 1.14 (0.91–1.43) | 1.12 (0.90–1.40) | 1.42 (0.80–2.51) | 1.33 (0.75–2.37) |
| Standing water observed around compound | 14/521 (2.7%) | 56/447 (13%) | 0.38 | 1.03 (0.93–1.14) | 1.03 (0.93–1.13) | 1.14 (0.91–1.42) | 1.12 (0.90–1.39) | 1.42 (0.80–2.51) | 1.34 (0.75–2.38) |
| Leaking or standing wastewater observed around grounds | 363/521 (70%) | 241/447 (54%) | 0.33 | 1.03 (0.93–1.14) | 1.03 (0.93–1.13) | 1.14 (0.91–1.43) | 1.12 (0.90–1.40) | 1.42 (0.80–2.51) | 1.34 (0.75–2.38) |
| Compound has electricity that normally functions | 467/533 (88%) | 420/454 (93%) | 0.16 | 1.04 (0.94–1.15) | 1.04 (0.94–1.15) | 1.11 (0.89–1.39) | 1.11 (0.89–1.38) | 1.41 (0.80–2.48) | 1.32 (0.75–2.34) |
| Any animal observed in compound | 318/533 (60%) | 303/454 (67%) | 0.15 | 1.04 (0.95–1.15) | 1.04 (0.95–1.15) | 1.13 (0.91–1.41) | 1.13 (0.91–1.40) | 1.39 (0.79–2.44) | 1.29 (0.73–2.28) |
| Dog observed | 28/533 (5.3%) | 46/454 (10%) | 0.18 | 1.05 (0.95–1.15) | 1.04 (0.95–1.15) | 1.13 (0.90–1.41) | 1.12 (0.90–1.39) | 1.38 (0.79–2.40) | 1.30 (0.75–2.27) |
| Chicken or duck observed | 70/533 (13%) | 60/454 (13%) | 0.00 | 1.05 (0.95–1.15) | 1.05 (0.95–1.16) | 1.12 (0.90–1.41) | 1.12 (0.90–1.40) | 1.37 (0.78–2.40) | 1.27 (0.72–2.23) |
| Cat observed | 287/533 (54%) | 259/454 (57%) | 0.06 | 1.05 (0.95–1.16) | 1.04 (0.95–1.15) | 1.14 (0.91–1.42) | 1.13 (0.91–1.41) | 1.39 (0.79–2.45) | 1.30 (0.74–2.29) |
| Compound density, terciles | 0.40 | 1.05 (0.95–1.16) | 1.05 (0.95–1.16) | 1.10 (0.88–1.38) | 1.10 (0.89–1.38) | 1.43 (0.81–2.50) | 1.32 (0.75–2.33) | ||
| 0 (least dense) | 199/519 (38%) | 120/447 (27%) | .. | .. | .. | .. | .. | .. | .. |
| 1 | 191/519 (37%) | 137/447 (31%) | .. | .. | .. | .. | .. | .. | .. |
| 2 (most dense) | 129/519 (25%) | 190/447 (43%) | .. | .. | .. | .. | .. | .. | .. |
| Child age at survey, days | 700 (405) | 694 (403) | 0.02 | .. | .. | .. | .. | 1.33 (0.76–2.34) | 1.32 (0.75–2.33) |
| Child age at sample, days | 659 (396) | 669 (391) | 0.03 | 1.04 (0.94–1.14) | 1.04 (0.94–1.15) | 1.09 (0.88–1.36) | 1.11 (0.89–1.38) | - | - |
| Cumulative monthly rainfall at survey, mm | 22 (23) | 23 (24) | 0.07 | .. | .. | .. | .. | 1.39 (0.79–2.44) | 1.30 (0.74–2.29) |
| Cumulative monthly rainfall at sample, mm | 25 (30) | 32 (38) | 0.19 | 1.04 (0.94–1.15) | 1.04 (0.95–1.15) | 1.13 (0.90–1.41) | 1.13 (0.91–1.40) | .. | .. |
| Survey collected during rainy season | 155/526 (29%) | 222/448 (50%) | 0.42 | .. | .. | .. | .. | 1.44 (0.81–2.54) | 1.34 (0.76–2.38) |
| Sample collected during rainy season | 136/409 (33%) | 183/370 (49%) | 0.33 | 1.05 (0.95–1.16) | 1.05 (0.95–1.16) | 1.12 (0.90–1.40) | 1.12 (0.90–1.39) | .. | .. |
| Wealth score | 0.44 (0.1) | 0.43 (0.1) | 0.16 | 1.04 (0.94–1.15) | 1.04 (0.94–1.15) | 1.12 (0.90–1.40) | 1.11 (0.89–1.38) | 1.39 (0.79–2.46) | 1.32 (0.75–2.33) |
| Number of household residents | 5.7 (2.7) | 6.6 (3.4) | 0.32 | 1.04 (0.94–1.15) | 1.04 (0.94–1.15) | 1.13 (0.90–1.41) | 1.12 (0.90–1.39) | 1.38 (0.78–2.44) | 1.31 (0.74–2.31) |
| Number of Compound residents | 16 (7.3) | 25 (19) | 0.64 | 1.04 (0.94–1.15) | 1.04 (0.94–1.15) | 1.10 (0.88–1.37) | 1.09 (0.88–1.35) | 1.39 (0.79–2.45) | 1.31 (0.74–2.32) |
| Number of households in compound | 4.1 (2.5) | 6.1 (5.9) | 0.42 | 1.04 (0.94–1.15) | 1.04 (0.94–1.15) | 1.11 (0.89–1.37) | 1.09 (0.88–1.36) | 1.40 (0.79–2.46) | 1.31 (0.74–2.32) |
| Number of compound latrines | 1.0 (0.22) | 1.2 (0.9) | 0.33 | 1.04 (0.94–1.15) | 1.04 (0.94–1.15) | 1.13 (0.91–1.40) | 1.12 (0.90–1.39) | 1.40 (0.79–2.47) | 1.33 (0.75–2.35) |
| Number of compound waterpoints | 0.99 (0.98) | 1.9 (2.4) | 0.47 | 1.03 (0.93–1.14) | 1.03 (0.93–1.14) | 1.13 (0.91–1.42) | 1.12 (0.90–1.39) | 1.45 (0.82–2.56) | 1.37 (0.77–2.43) |
-
*Standardized difference between arms in baseline covariates. † Compared with 12-month unadjusted prevalence ratio (12 month difference-in-difference estimator). ‡ Compared with 12-month prevalence ratio adjusted for a priori covariates child age, sex, caregiver education, and poverty (wealth score).
Appendix 1—table 10
Effect estimates (prevalence ratios) for main analyses and all sub-group analyses adjusted for a priori covariates and age-squared.
| Main analysis, all children† | Sub-group analysis, children born after intervention* | Sub-group analysis, children with repeated (longitudinal) measurements† | Age stratified, children aged > 24 months old‡ | ||||
|---|---|---|---|---|---|---|---|
| 12 month | 24 month | 12 month | 24 month | 12 month | 24 month | 24 month | |
| Any bacterial or protozoan infection | 1.05 (0.96–1.15), p=0.29 | 1.00 (0.92–1.09), p=0.97 | 0.95 (0.64–1.42), p=0.81 | 0.97 (0.79–1.18), p=0.73 | 1.02 (0.91–1.14), p=0.73 | 0.99 (0.89–1.11), p=0.89 | 0.98 (0.91–1.05), p=0.57 |
| Any STH infection | 1.16 (0.93–1.43), p=0.18 | 0.94 (0.77–1.15), p=0.54 | 1.38 (0.35–5.44), p=0.65 | 0.48 (0.26–0.92), p=0.026 | 1.20 (0.91–1.59), p=0.20 | 1.22 (0.85–1.75), p=0.27 | 1.04 (0.83–1.32), p=0.72 |
| Diarrhea | 1.73 (0.91–3.28), p=0.094 | 0.84 (0.46–1.51), p=0.55 | 1.66 (0.32–8.68), p=0.55 | 1.32 (0.45–3.90), p=0.61 | 1.71 (0.79–3.71), p=0.17 | 0.68 (0.31–1.48), p=0.33 | 0.82 (0.36–1.87), p=0.64 |
| Any Bacteria | 1.10 (0.96–1.26), p=0.15 | 1.01 (0.88–1.16), p=0.87 | 1.23 (0.75–2.02), p=0.42 | 0.88 (0.66–1.16), p=0.37 | 1.02 (0.86–1.20), p=0.85 | 1.02 (0.85–1.22), p=0.85 | 0.96 (0.84–1.11), p=0.61 |
| Shigella | 1.14 (0.94–1.38), p=0.18 | 0.97 (0.81–1.16), p=0.75 | 0.87 (0.25–3.02), p=0.83 | 0.48 (0.28–0.84), p=0.009 | 1.09 (0.87–1.35), p=0.47 | 0.96 (0.75–1.23), p=0.76 | 1.02 (0.85–1.23), p=0.82 |
| ETEC | 0.97 (0.70–1.35), p=0.86 | 0.83 (0.57–1.20), p=0.32 | 0.80 (0.33–1.95), p=0.63 | 0.84 (0.47–1.49), p=0.55 | 0.86 (0.58–1.29), p=0.47 | 0.86 (0.52–1.40), p=0.53 | 0.75 (0.47–1.20), p=0.23 |
| Campylobacter | 1.70 (0.83–3.49), p=0.15 | 1.29 (0.63–2.64), p=0.49 | 2.67 (0.59–12.00), p=0.2 | 1.63 (0.59–4.54), p=0.35 | 1.51 (0.60–3.76), p=0.38 | 1.52 (0.60–3.83), p=0.38 | 0.98 (0.30–3.21), p=0.97 |
| C. difficile | 2.06 (0.76–5.53), p=0.15 | 1.38 (0.45–4.20), p=0.57 | 1.42 (0.43–4.65), p=0.57 | 1.45 (0.40–5.25), p=0.57 | 1.35 (0.23–7.78), p=0.74 | 0.23 (0.02–2.67), p=0.24 | ..‡ |
| E. coli O157 | 0.47 (0.18–1.23), p=0.13 | 0.52 (0.17–1.59), p=0.25 | 0.00 (0.00–0.01), p=0.00 | 0.52 (0.07–4.14), p=0.54 | 0.68 (0.22–2.07), p=0.50 | 0.58 (0.12–2.86), p=0.51 | 0.48 (0.13–1.78), p=0.27 |
| STEC | 0.15 (0.03–0.71), p=0.017 | 0.24 (0.06–1.03), p=0.055 | ..‡ | 0.05 (0.00–1.26), p=0.069 | 0.11 (0.01–1.32), p=0.082 | 0.58 (0.07–5.00), p=0.62 | 1.70 (0.14–20.35), p=0.67 |
| Y. enterocolitica | ..‡ | ..‡ | ..‡ | ..‡ | ..‡ | ..‡ | ..‡ |
| V. cholerae | ..‡ | ..‡ | ..‡ | ..‡ | ..‡ | ..‡ | ..‡ |
| Any Protozoa | 1.05 (0.89–1.23), p=0.6 | 0.92 (0.78–1.09), p=0.34 | 0.42 (0.14–1.26), p=0.12 | 0.86 (0.60–1.23), p=0.41 | 1.20 (0.97–1.48), p=0.095 | 0.92 (0.73–1.16), p=0.49 | 0.94 (0.80–1.10), p=0.45 |
| Giardia | 1.07 (0.91–1.26), p=0.43 | 0.95 (0.80–1.12), p=0.51 | 0.46 (0.15–1.47), p=0.19 | 0.89 (0.62–1.28), p=0.52 | 1.19 (0.96–1.47), p=0.11 | 0.92 (0.73–1.16), p=0.47 | 0.96 (0.81–1.13), p=0.6 |
| Cryptosporidium | 0.89 (0.24–3.33), p=0.86 | 0.53 (0.13–2.17), p=0.38 | 0.33 (0.02–6.28), p=0.46 | 0.51 (0.09–2.78), p=0.44 | 1.46 (0.21–10.18), p=0.7 | 0.59 (0.06–5.45), p=0.64 | 0.20 (0.02–2.28), p=0.19 |
| E. histolytica | ..‡ | ..‡ | ..‡ | ..‡ | ..‡ | ..‡ | ..‡ |
| Any virus | 0.75 (0.44–1.28), p=0.29 | 1.03 (0.57–1.86), p=0.92 | 0.37 (0.14–1.03), p=0.056 | 0.79 (0.35–1.78), p=0.57 | 1.09 (0.52–2.29), p=0.83 | 0.95 (0.41–2.19), p=0.91 | 1.44 (0.61–3.38), p=0.41 |
| Norovirus GI/GII | 0.68 (0.36–1.28), p=0.23 | 1.10 (0.55–2.18), p=0.79 | 0.42 (0.12–1.41), p=0.16 | 1.25 (0.47–3.29), p=0.66 | 0.86 (0.37–2.00), p=0.73 | 0.74 (0.29–1.90), p=0.53 | 1.16 (0.45–3.04), p=0.76 |
| Adenovirus 40/41 | 1.26 (0.32–4.95), p=0.74 | 0.96 (0.18–5.20), p=0.96 | 0.85 (0.09–8.30), p=0.89 | ..‡ | 3.77 (0.48–29.56), p=0.21 | 6.17 (0.51–75.19), p=0.15 | 7.51 (0.72–77.98), p=0.091 |
| Rotavirus A | ..‡ | ..‡ | ..‡ | ..‡ | ..‡ | ..‡ | ..‡ |
| Coinfection,≥2 GPP pathogens | 1.10 (0.93–1.30), p=0.27 | 0.94 (0.80–1.11), p=0.49 | 0.75 (0.33–1.71), p=0.49 | 0.83 (0.58–1.17), p=0.29 | 1.15 (0.93–1.42), p=0.19 | 0.97 (0.78–1.21), p=0.81 | 0.93 (0.78–1.11), p=0.44 |
| Trichuris | 1.05 (0.83–1.32), p=0.68 | 0.85 (0.67–1.08), p=0.17 | 0.99 (0.23–4.27), p=0.98 | 0.24 (0.10–0.60), p=0.002 | 1.11 (0.80–1.52), p=0.54 | 1.14 (0.76–1.70), p=0.54 | 0.99 (0.77–1.27), p=0.92 |
| Ascaris | 1.38 (0.95–1.99), p=0.088 | 0.83 (0.54–1.26), p=0.37 | 3.11 (0.30–32.54), p=0.34 | 0.65 (0.29–1.47), p=0.3 | 1.20 (0.76–1.92), p=0.43 | 0.86 (0.42–1.75), p=0.68 | 0.86 (0.51–1.44), p=0.56 |
| Coinfection,≥2 STH | 1.21 (0.78–1.85), p=0.39 | 0.62 (0.37–1.06), p=0.079 | 1.76 (0.15–21), p=0.66 | 0.12 (0.01–1.06), p=0.057 | 1.01 (0.53–1.93), p=0.97 | 0.70 (0.30–1.62), p=0.40 | 0.72 (0.40–1.29), p=0.27 |
-
All effect estimates are presented as prevalence ratios (ratio of ratios) with 95% confidence intervals and estimated using generalized estimating equations to fit Poisson regression models with robust standard errors. All models are adjusted for a priori covariates (age, sex, wealth, caregiver education) and age squared to assess the impact of the age squared term on effect estimates. †Results from main analyses examining intervention effects among all enrolled children at 12 month and 24 month visits. Effect estimates compared with 12 month and 24 month results in Table 2.
*Results from sub-group analyses which compared children born after the intervention was implemented with children of a similar age at baseline. Effect estimates compared with results in Table 3 (24 month sub-group analysis results) and Appendix 1—table 13 (12 month sub-group analysis results).
-
† Results from sub-group analyses including children with repeated measures at baseline and the 12 month phase or baseline and the 24 month phase. Effect estimates compared with results in Appendix 1—tables 14 and 15.
‡ Results from sub-group analysis comparing children aged >2 years old at baseline and 24 month phase. Effect estimates compared with results in Appendix 1—table 12.
Appendix 1—table 11
Comparison of effect estimates (prevalence ratios) at 12- and 24-month adjusted for a priori covariates only and for a priori covariates and seasonality.
| 12-month prevalence ratio (95% CI) | 24-month prevalence ratio (95% CI) | |||
|---|---|---|---|---|
| Adjusted (a priori only)* | Adjusted + seasonality† | Adjusted (a priori only)* | Adjusted + seasonality† | |
| Any bacterial or protozoan infection | 1.04 (0.94–1.15), p=0.41 | 1.05 (0.95–1.15), p=0.37 | 0.99 (0.91–1.09), p=0.89 | 1.00 (0.91–1.10), p=0.95 |
| Any STH infection | 1.11 (0.89–1.38), p=0.35 | 1.12 (0.90–1.39), p=0.31 | 0.95 (0.77–1.17), p=0.62 | 0.94 (0.76–1.15), p=0.54 |
| Diarrhea | 1.69 (0.89–3.21), p=0.11 | 1.67 (0.88–3.17), p=0.12 | 0.84 (0.47–1.51), p=0.56 | 0.81 (0.44–1.46), p=0.48 |
| Any bacteria | 1.09 (0.95–1.26), p=0.20 | 1.10 (0.96–1.26), p=0.18 | 1.00 (0.87–1.15), p=0.95 | 1.03 (0.89–1.18), p=0.71 |
| Shigella | 1.12 (0.92–1.38), p=0.27 | 1.12 (0.91–1.37), p=0.28 | 0.95 (0.79–1.16), p=0.64 | 0.97 (0.80–1.17), p=0.72 |
| ETEC | 0.96 (0.69–1.33), p=0.81 | 0.98 (0.70–1.35), p=0.89 | 0.83 (0.57–1.19), p=0.31 | 0.88 (0.61–1.26), p=0.47 |
| Campylobacter | 1.68 (0.82–3.45), p=0.16 | 1.72 (0.84–3.49), p=0.14 | 1.28 (0.62–2.62), p=0.5 | 1.33 (0.65–2.71), p=0.43 |
| C. difficile | 2.09 (0.77–5.64), p=0.15 | 2.17 (0.81–5.86), p=0.13 | 1.41 (0.46–4.30), p=0.54 | 1.44 (0.48–4.37), p=0.52 |
| E. coli O157 | 0.46 (0.18–1.21), p=0.12 | 0.48 (0.18–1.26), p=0.14 | 0.52 (0.17–1.59), p=0.25 | 0.57 (0.19–1.74), p=0.32 |
| STEC | 0.15 (0.03–0.70), p=0.016 | 0.15 (0.03–0.74), p=0.019 | 0.24 (0.05–1.01), p=0.052 | 0.25 (0.06–1.06), p=0.061 |
| Y. enterocolitica | ..‡ | ..‡ | ..‡ | ..‡ |
| V. cholerae | ..‡ | ..‡ | ..‡ | ..‡ |
| Any Protozoa | 1.03 (0.86–1.22), p=0.76 | 1.03 (0.87–1.23), p=0.72 | 0.91 (0.76–1.09), p=0.29 | 0.91 (0.76–1.09), p=0.31 |
| Giardia | 1.05 (0.88–1.25), p=0.58 | 1.06 (0.88–1.26), p=0.54 | 0.93 (0.78–1.11), p=0.43 | 0.93 (0.78–1.12), p=0.45 |
| Cryptosporidium | 0.89 (0.24–3.31), p=0.86 | 0.83 (0.22–3.11), p=0.78 | 0.53 (0.13–2.14), p=0.37 | 0.46 (0.12–1.73), p=0.25 |
| E. histolytica | ..‡ | ..‡ | ..‡ | ..‡ |
| Any virus | 0.75 (0.44–1.27), p=0.29 | 0.74 (0.43–1.26), p=0.26 | 1.03 (0.57–1.86), p=0.92 | 0.97 (0.54–1.75), p=0.91 |
| Norovirus GI/GII | 0.68 (0.36–1.27), p=0.23 | 0.67 (0.35–1.27), p=0.22 | 1.10 (0.55–2.18), p=0.79 | 1.04 (0.53–2.07), p=0.90 |
| Adenovirus 40/41 | 1.24 (0.32–4.83), p=0.76 | 1.29 (0.33–5.13), p=0.71 | 0.97 (0.18–5.19), p=0.97 | 1.01 (0.19–5.30), p=0.99 |
| Rotavirus | ..‡ | ..‡ | ..‡ | ..‡ |
| Coinfection,≥2 GPP pathogens | 1.08 (0.91–1.29), p=0.37 | 1.09 (0.91–1.30), p=0.35 | 0.93 (0.79–1.10), p=0.41 | 0.94 (0.79–1.12), p=0.49 |
| Trichuris | 1.01 (0.79–1.28), p=0.96 | 1.02 (0.81–1.30), p=0.86 | 0.86 (0.67–1.10), p=0.22 | 0.85 (0.67–1.09), p=0.21 |
| Ascaris | 1.33 (0.92–1.93), p=0.13 | 1.35 (0.93–1.95), p=0.11 | 0.83 (0.54–1.27), p=0.39 | 0.81 (0.53–1.25), p=0.34 |
| Coinfection,≥2 STH | 1.17 (0.76–1.79), p=0.49 | 1.20 (0.78–1.83), p=0.40 | 0.63 (0.37–1.07), p=0.084 | 0.62 (0.36–1.06), p=0.079 |
-
All effect estimates are presented as prevalence ratios (ratio of ratios) with 95% confidence intervals and estimated using generalized estimating equations to fit Poisson regression models with robust standard errors.
*Models are adjusted for a priori covariates age, sex, caregiver’s education, and wealth and presented for comparison with seasonality-adjusted models.
-
†Models are adjusted for a priori covariates and seasonality using sine/cosine terms based on the date of sample (or survey) collection.
Appendix 1—table 12
Effect of the intervention on enteric infection and diarrhea in children > 2 years old after 24 months.
| Prevalence | Prevalence ratio (95% CI), p-value | |||
|---|---|---|---|---|
| Baseline, aged > 2 years | 24 month, aged > 2 years | Unadjusted | Adjusted* | |
| Any bacterial or protozoan infection† | ||||
| Control | 155/164 (95%) | 315/340 (93%) | .. | .. |
| Intervention | 149/160 (93%) | 312/344 (91%) | 0.99 (0.93–1.07), p=0.86 | 0.98 (0.91–1.05), p=0.60 |
| Any STH infection† | ||||
| Control | 103/155 (66%) | 113/175 (65%) | .. | .. |
| Intervention | 86/146 (59%) | 121/208 (58%) | 1.03 (0.82–1.30), p=0.79 | 1.05 (0.83–1.32), p=0.69 |
| Diarrhea‡ | ||||
| Control | 21/243 (8.6%) | 33/273 (12%) | .. | .. |
| Intervention | 16/210 (7.6%) | 31/303 (10%) | 0.96 (0.45–2.07), p=0.93 | 0.82 (0.36–1.86), p=0.63 |
| Any Bacteria | ||||
| Control | 129/164 (79%) | 267/340 (79%) | .. | .. |
| Intervention | 125/160 (78%) | 266/344 (77%) | 1.00 (0.87–1.15), p=0.98 | 0.97 (0.84–1.11), p=0.64 |
| Shigella | ||||
| Control | 112/164 (68%) | 227/340 (67%) | .. | .. |
| Intervention | 103/160 (64%) | 223/344 (65%) | 1.05 (0.87–1.26), p=0.63 | 1.03 (0.85–1.24), p=0.79 |
| ETEC | ||||
| Control | 46/164 (28%) | 93/340 (27%) | .. | .. |
| Intervention | 52/160 (33%) | 100/344 (29%) | 0.88 (0.56–1.38), p=0.58 | 0.74 (0.46–1.20), p=0.22 |
| Campylobacter | ||||
| Control | 12/164 (7.3%) | 33/340 (9.7%) | .. | .. |
| Intervention | 7/160 (4.4%) | 20/344 (5.8%) | 0.97 (0.33–2.90), p=0.96 | 1.00 (0.30–3.28), p=0.99 |
| C. difficile | ||||
| Control | 2/164 (1.2%) | 6/340 (1.8%) | .. | .. |
| Intervention | 0/160 (0.0%) | 4/344 (1.2%) | ..‡ | ..‡ |
| E. coli O157 | ||||
| Control | 6/164 (3.7%) | 21/340 (6.2%) | .. | .. |
| Intervention | 9/160 (5.6%) | 13/344 (3.8%) | 0.39 (0.11–1.40), p=0.15 | 0.47 (0.13–1.78), p=0.27 |
| STEC | ||||
| Control | 2/164 (1.2%) | 15/340 (4.4%) | .. | .. |
| Intervention | 1/160 (0.63%) | 13/344 (3.8%) | 1.54 (0.12–19.19), p=0.74 | 1.73 (0.14–20.75), p=0.67 |
| Y. enterocolitica | ||||
| Control | 0/164 (0.0%) | 0/340 (0.0%) | .. | .. |
| Intervention | 0/160 (0.0%) | 1/344 (0.29%) | ..‡ | ..‡ |
| V. cholerae | ||||
| Control | 0/164 (0.0%) | 0/340 (0.0%) | .. | .. |
| Intervention | 0/160 (0.0%) | 0/344 (0.0%) | ..‡ | ..‡ |
| Any Protozoa | ||||
| Control | 123/164 (75%) | 250/340 (74%) | .. | .. |
| Intervention | 121/160 (76%) | 245/344 (71%) | 0.96 (0.82–1.13), p=0.66 | 0.94 (0.80–1.11), p=0.47 |
| Giardia | ||||
| Control | 122/164 (74%) | 244/340 (72%) | .. | .. |
| Intervention | 118/160 (74%) | 240/344 (70%) | 0.99 (0.84–1.16), p=0.86 | 0.96 (0.81–1.13), p=0.62 |
| Cryptosporidium | ||||
| Control | 1/164 (0.61%) | 9/340 (2.6%) | .. | .. |
| Intervention | 4/160 (2.5%) | 8/344 (2.3%) | 0.20 (0.02–2.27), p=0.19 | 0.21 (0.02–2.46), p=0.21 |
| E. histolytica | ||||
| Control | 0/164 (0.0%) | 2/340 (0.59%) | .. | .. |
| Intervention | 3/160 (1.9%) | 10/344 (2.9%) | ..‡ | ..‡ |
| Any virus | ||||
| Control | 19/164 (12%) | 39/340 (11%) | .. | .. |
| Intervention | 16/160 (10%) | 43/344 (13%) | 1.24 (0.55–2.78), p=0.6 | 1.44 (0.61–3.38), p=0.41 |
| Norovirus GI/GII | ||||
| Control | 12/164 (7.3%) | 34/340 (10%) | .. | .. |
| Intervention | 13/160 (8.1%) | 37/344 (11%) | 0.96 (0.39–2.34), p=0.92 | 1.17 (0.45–3.03), p=0.75 |
| Adenovirus 40/41 | ||||
| Control | 6/164 (3.7%) | 2/340 (0.59%) | .. | .. |
| Intervention | 2/160 (1.3%) | 6/344 (1.7%) | 11 (0.97–119), p=0.053 | 7.5 (0.72–79), p=0.92 |
| Rotavirus A | ||||
| Control | 1/164 (0.61%) | 3/340 (0.88%) | .. | .. |
| Intervention | 1/160 (0.63%) | 1/344 (0.29%) | ..‡ | ..‡ |
| Coinfection,≥2 GPP pathogens | ||||
| Control | 114/164 (70%) | 243/340 (71%) | .. | .. |
| Intervention | 111/160 (69%) | 236/344 (69%) | 0.97 (0.82–1.15), p=0.71 | 0.93 (0.78–1.12), p=0.45 |
| Trichuris | ||||
| Control | 91/155 (59%) | 102/175 (58%) | .. | .. |
| Intervention | 76/146 (52%) | 110/208 (53%) | 1.04 (0.81–1.33), p=0.78 | 0.99 (0.77–1.27), p=0.96 |
| Ascaris | ||||
| Control | 50/155 (32%) | 61/175 (35%) | .. | .. |
| Intervention | 39/146 (27%) | 47/208 (23%) | 0.78 (0.47–1.29), p=0.33 | 0.86 (0.51–1.44), p=0.57 |
| Coinfection,≥2 STH | ||||
| Control | 38/155 (25%) | 50/175 (29%) | .. | .. |
| Intervention | 29/146 (20%) | 36/208 (17%) | 0.74 (0.42–1.28), p=0.28 | 0.72 (0.41–1.29), p=0.27 |
-
Analysis includes children >2 year old at baseline or the 24 month visit. Prevalence results are presented as (n/N (%)). All effect estimates are presented as prevalence ratios (ratio of ratios) with 95% confidence intervals and estimated using generalized estimating equations to fit Poisson regression models with robust standard errors.
* Pathogen outcomes adjusted for child age and sex, caregiver’s education, and household wealth index, reported diarrhea also adjusted for baseline presence of a drop-hole cover and reported use of a tap on compound grounds as primary drinking water source.
-
† Models did not converge due to sparse data.
Appendix 1—table 13
Effect of intervention on enteric infection and reported diarrhea in children born into study sites post implementation (post-baseline) and before 12 month visit compared with children of a similar age at baseline (<1 year old).
| Prevalence | Prevalence ratio | |||
|---|---|---|---|---|
| Baseline, children < 1 year old | 12 month, children born-in and <1 year old | unadjusted | adjusted† | |
| Any bacterial or protozoan infection | ||||
| Control | 57/109 (52%) | 31/48 (65%) | .. | .. |
| Intervention | 51/99 (52%) | 32/55 (58%) | 0.89 (0.60–1.33), p=0.58 | 0.97 (0.65–1.45), p=0.90 |
| Any STH infection | ||||
| Control | 17/93 (18%) | 3/25 (12%) | .. | .. |
| Intervention | 13/92 (14%) | 4/32 (13%) | 1.31 (0.32–5.42), p=0.71 | 1.38 (0.35–5.45), p=0.65 |
| Diarrhea | ||||
| Control | 19/138 (14%) | 6/50 (12%) | .. | .. |
| Intervention | 18/120 (15%) | 13/69 (19%) | 1.38 (0.47–4.01), p=0.56 | 1.80 (0.35–9.31), p=0.48 |
| Any Bacteria | ||||
| Control | 53/109 (49%) | 24/48 (50%) | .. | .. |
| Intervention | 41/99 (41%) | 29/55 (53%) | 1.22 (0.75–1.98), p=0.43 | 1.28 (0.78–2.10), p=0.33 |
| Shigella | ||||
| Control | 10/109 (9.2%) | 9/48 (19%) | .. | .. |
| Intervention | 9/99 (9.1%) | 9/55 (16%) | 0.87 (0.26–2.91), p=0.82 | 0.85 (0.26–2.81), p=0.79 |
| ETEC | ||||
| Control | 25/109 (23%) | 12/48 (25%) | .. | .. |
| Intervention | 22/99 (22%) | 11/55 (20%) | 0.82 (0.34–1.99), p=0.66 | 0.80 (0.33–1.92), p=0.62 |
| Campylobacter | ||||
| Control | 14/109 (13%) | 4/48 (8.3%) | .. | .. |
| Intervention | 8/99 (8.1%) | 5/55 (9.1%) | 1.76 (0.38–8.09), p=0.47 | 2.68 (0.59–12.2), p=0.20 |
| C. difficile | ||||
| Control | 13/109 (12%) | 7/48 (15%) | .. | .. |
| Intervention | 10/99 (10%) | 9/55 (16%) | 1.37 (0.42–4.45), p=0.60 | 1.49 (0.46–4.89), p=0.51 |
| E. coli O157 | ||||
| Control | 4/109 (3.7%) | 1/48 (2.1%) | .. | .. |
| Intervention | 2/99 (2%) | 0/55 (0.0%) | 0.01 (0.00–0.19), p=0.001 | ..‡ |
| STEC | ||||
| Control | 0/109 (0.0%) | 0/48 (0.0%) | .. | .. |
| Intervention | 3/99 (3%) | 1/55 (1.8%) | ..‡ | ..‡ |
| Y. enterocolitica | ||||
| Control | 0/109 (0.0%) | 0/48 (0.0%) | .. | .. |
| Intervention | 0/99 (0.0%) | 0/55 (0.0%) | ..‡ | ..‡ |
| V. cholerae | ||||
| Control | 0/109 (0.0%) | 0/48 (0.0%) | .. | .. |
| Intervention | 0/99 (0.0%) | 0/55 (0.0%) | ..‡ | ..‡ |
| Any Protozoa | ||||
| Control | 14/109 (13%) | 15/48 (31%) | .. | .. |
| Intervention | 22/99 (22%) | 9/55 (16%) | 0.35 (0.12–1.02), p=0.055 | 0.40 (0.13–1.20), p=0.10 |
| Giardia | ||||
| Control | 12/109 (11%) | 13/48 (27%) | .. | .. |
| Intervention | 16/99 (16%) | 8/55 (15%) | 0.41 (0.13–1.24), p=0.11 | 0.44 (0.14–1.40), p=0.17 |
| Cryptosporidium | ||||
| Control | 2/109 (1.8%) | 2/48 (4.2%) | .. | .. |
| Intervention | 8/99 (8.1%) | 2/55 (3.6%) | 0.25 (0.02–3.70), p=0.31 | 0.40 (0.02–7.9), p=0.55 |
| E. histolytica | ||||
| Control | 0/109 (0.0%) | 1/48 (2.1%) | .. | .. |
| Intervention | 1/99 (1%) | 0/55 (0.0%) | ..‡ | ..‡ |
| Any virus | ||||
| Control | 15/109 (14%) | 12/48 (25%) | .. | .. |
| Intervention | 21/99 (21%) | 7/55 (13%) | 0.33 (0.12–0.92), p=0.033 | 0.37 (0.14–1.03), p=0.056 |
| Norovirus GI/GII | ||||
| Control | 12/109 (11%) | 9/48 (19%) | .. | .. |
| Intervention | 15/99 (15%) | 6/55 (11%) | 0.43 (0.13–1.40), p=0.16 | 0.44 (0.13–1.47), p=0.18 |
| Adenovirus 40/41 | ||||
| Control | 4/109 (3.7%) | 4/48 (8.3%) | .. | .. |
| Intervention | 3/99 (3%) | 2/55 (3.6%) | 0.56 (0.06–5.05), p=0.61 | 0.91 (0.09–9.49), p=0.94 |
| Rotavirus A | ||||
| Control | 0/109 (0.0%) | 0/48 (0.0%) | .. | .. |
| Intervention | 3/99 (3%) | 0/55 (0.0%) | ..‡ | ..‡ |
| Coinfection,≥2 GPP pathogens | ||||
| Control | 23/109 (21%) | 16/48 (33%) | .. | .. |
| Intervention | 25/99 (25%) | 15/55 (27%) | 0.73 (0.31–1.71), p=0.47 | 0.74 (0.33–1.69), p=0.48 |
| Trichuris | ||||
| Control | 10/93 (11%) | 3/25 (12%) | .. | .. |
| Intervention | 10/92 (11%) | 4/32 (13%) | 1.04 (0.21–5.01), p=0.96 | 0.98 (0.23–4.29), p=0.98 |
| Ascaris | ||||
| Control | 12/93 (13%) | 1/25 (4%) | .. | .. |
| Intervention | 9/92 (9.8%) | 3/32 (9.4%) | 2.87 (0.30–27.85), p=0.36 | 3.10 (0.30–32.5), p=0.35 |
| Coinfection,≥2 STH | ||||
| Control | 5/93 (5.4%) | 1/25 (4%) | .. | .. |
| Intervention | 6/92 (6.5%) | 3/32 (9.4%) | 1.90 (0.16–22.73), p=0.61 | 1.76 (0.15–21.0), p=0.66 |
-
Analysis includes children < 1 year old at baseline and children born into the study after baseline and <1 year old at the time of the 12-month visit. Prevalence results are presented as (n/N (%)). All effect estimates are presented as prevalence ratios (ratio of ratios) with 95% confidence intervals and estimated using generalized estimating equations to fit Poisson regression models with robust standard errors.
*Pathogen outcomes adjusted for child age and sex, caregiver’s education, and household wealth index, reported diarrhea also adjusted for baseline presence of a drop-hole cover and reported use of a tap on compound grounds as primary drinking water source.
-
† Models did not converge due to sparse data.
Appendix 1—table 14
Effect of the intervention on children with repeated observations at baseline and 12-month visit.
| Prevalence | Prevalence ratio | |||
|---|---|---|---|---|
| Baseline | 12 month | Unadjusted | Adjusted† | |
| Any bacterial or protozoan infection | ||||
| Control | 161/207 (78%) | 187/207 (90%) | .. | .. |
| Intervention | 174/228 (76%) | 207/228 (91%) | 1.02 (0.91–1.16), p=0.70 | 1.01 (0.90–1.14), p=0.84 |
| Any STH infection | ||||
| Control | 67/132 (51%) | 80/132 (61%) | .. | .. |
| Intervention | 63/154 (41%) | 91/154 (59%) | 1.22 (0.92–1.61), p=0.17 | 1.16 (0.87–1.55), p=0.31 |
| Diarrhea | ||||
| Control | 36/277 (13%) | 17/277 (6.1%) | .. | .. |
| Intervention | 42/279 (15%) | 34/279 (12%) | 1.71 (0.78–3.77), p=0.18 | 1.71 (0.79–3.70), p=0.17 |
| Any Bacteria | ||||
| Control | 141/207 (68%) | 165/207 (80%) | .. | .. |
| Intervention | 142/228 (62%) | 170/228 (75%) | 1.02 (0.86–1.22), p=0.8 | 1.01 (0.85–1.20), p=0.92 |
| Shigella | ||||
| Control | 89/207 (43%) | 128/207 (62%) | ||
| Intervention | 90/228 (39%) | 142/228 (62%) | 1.10 (0.86–1.39), p=0.45 | 1.08 (0.85–1.37), p=0.54 |
| ETEC | ||||
| Control | 63/207 (30%) | 83/207 (40%) | ||
| Intervention | 71/228 (31%) | 79/228 (35%) | 0.84 (0.56–1.27), p=0.41 | 0.85 (0.57–1.28), p=0.44 |
| Campylobacter | ||||
| Control | 20/207 (9.7%) | 18/207 (8.7%) | ||
| Intervention | 13/228 (5.7%) | 18/228 (7.9%) | 1.54 (0.62–3.80), p=0.35 | 1.49 (0.60–3.71), p=0.39 |
| C. difficile | ||||
| Control | 15/207 (7.3%) | 4/207 (1.9%) | ||
| Intervention | 8/228 (3.5%) | 3/228 (1.3%) | 1.39 (0.24–8.00), p=0.71 | 1.45 (0.25–8.52), p=0.68 |
| E. coli O157 | ||||
| Control | 9/207 (4.3%) | 15/207 (7.3%) | .. | .. |
| Intervention | 9/228 (4.0%) | 10/228 (4.4%) | 0.67 (0.22–2.03), p=0.48 | 0.68 (0.22–2.06), p=0.49 |
| STEC | ||||
| Control | 1/207 (0.48%) | 6/207 (2.9%) | .. | .. |
| Intervention | 6/228 (2.6%) | 4/227 (1.8%) | 0.11 (0.01–1.31), p=0.081 | 0.11 (0.01–1.32), p=0.082 |
| Y. enterocolitica | ||||
| Control | 0/207 (0.0%) | 0/207 (0.0%) | .. | .. |
| Intervention | 1/228 (0.44%) | 0/227 (0.0%) | ..‡ | ..‡ |
| V. cholerae | ||||
| Control | 0/207 (0.0%) | 0/207 (0.0%) | .. | .. |
| Intervention | 0/228 (0.0%) | 0/227 (0.0%) | ..‡ | ..‡ |
| Any Protozoa | ||||
| Control | 109/207 (53%) | 130/207 (63%) | .. | .. |
| Intervention | 117/228 (51%) | 166/228 (73%) | 1.19 (0.95–1.48), p=0.13 | 1.18 (0.94–1.47), p=0.15 |
| Giardia | ||||
| Control | 106/207 (51%) | 130/207 (63%) | ||
| Intervention | 113/228 (50%) | 164/228 (72%) | 1.18 (0.94–1.48), p=0.15 | 1.17 (0.93–1.47), p=0.17 |
| Cryptosporidium | ||||
| Control | 6/207 (2.9%) | 2/207 (0.97%) | .. | .. |
| Intervention | 10/228 (4.4%) | 5/227 (2.2%) | 1.44 (0.21–9.82), p=0.71 | 1.45 (0.22–9.71), p=0.7 |
| E. histolytica | ||||
| Control | 0/207 (0.0%) | 0/207 (0.0) | .. | .. |
| Intervention | 2/228 (0.88%) | 7/228 (3.1%) | ..‡ | ..‡ |
| Any virus | ||||
| Control | 27/207 (13%) | 20/207 (9.7%) | .. | .. |
| Intervention | 31/228 (14%) | 25/228 (11%) | 1.05 (0.50–2.22), p=0.89 | 1.08 (0.51–2.26), p=0.84 |
| Norovirus GI/GII | ||||
| Control | 20/207 (9.7%) | 19/207 (9.2%) | ||
| Intervention | 23/228 (11%) | 19/228 (8.3%) | 0.83 (0.36–1.94), p=0.67 | 0.86 (0.37–1.99), p=0.72 |
| Adenovirus 40/41 | ||||
| Control | 7/207 (3.4%) | 2/207 (0.97%) | .. | .. |
| Intervention | 6/228 (2.6%) | 6/228 (2.6%) | 3.56 (0.46–27.24), p=0.22 | 3.59 (0.46–27.91), p=0.22 |
| Rotavirus A | ||||
| Control | 1/207 (0.48%) | 1/207 (0.48%) | .. | .. |
| Intervention | 4/228 (1.8%) | 1/228 (0.44%) | ..‡ | ..‡ |
| Coinfection,≥2 GPP pathogens | ||||
| Control | 114/207 (55%) | 135/207 (65%) | .. | .. |
| Intervention | 115/228 (50%) | 156/228 (68%) | 1.15 (0.92–1.43), p=0.23 | 1.14 (0.91–1.42), p=0.25 |
| Trichuris | ||||
| Control | 49/132 (37%) | 64/132 (48%) | .. | .. |
| Intervention | 53/154 (34%) | 77/154 (50%) | 1.12 (0.81–1.54), p=0.50 | 1.06 (0.76–1.48), p=0.72 |
| Ascaris | ||||
| Control | 40/132 (30%) | 46/132 (35%) | ||
| Intervention | 35/154 (23%) | 49/154 (32%) | 1.22 (0.77–1.93), p=0.4 | 1.17 (0.73–1.86), p=0.51 |
| Coinfection,≥2 STH | ||||
| Control | 22/132 (17%) | 30/132 (23%) | .. | .. |
| Intervention | 25/154 (16%) | 35/154 (23%) | 1.03 (0.55–1.93), p=0.94 | 0.97 (0.51–1.85), p=0.93 |
-
Analysis includes children with complete observations at baseline and 12-month visits. Prevalence results are presented as (n/N (%)). All effect estimates are presented as prevalence ratios (ratio of ratios) with 95% confidence intervals and estimated using generalized estimating equations to fit Poisson regression models with robust standard errors.
* Pathogen outcomes adjusted for child age and sex, caregiver’s education, and household wealth index, reported diarrhea also adjusted for baseline presence of a drop-hole cover and reported use of a tap on compound grounds as primary drinking water source.
-
† Models would not converge due to sparse data.
Appendix 1—table 15
Effect of the intervention on children with repeated observations at baseline and 24-month visit.
| Prevalence | Prevalence ratio | |||
|---|---|---|---|---|
| Baseline | 24 month | Unadjusted | Adjusted† | |
| Any bacterial or protozoan infection | ||||
| Control | 131/166 (79%) | 155/166 (93%) | .. | .. |
| Intervention | 151/192 (79%) | 175/192 (91%) | 0.98 (0.87–1.10), p=0.73 | 0.98 (0.87–1.10), p=0.70 |
| Any STH infection | ||||
| Control | 48/95 (51%) | 65/95 (68%) | .. | .. |
| Intervention | 38/106 (36%) | 62/106 (58%) | 1.20 (0.84–1.70), p=0.31 | 1.25 (0.87–1.78), p=0.23 |
| Diarrhea | ||||
| Control | 25/196 (13%) | 20/196 (10%) | .. | .. |
| Intervention | 34/221 (15%) | 20/221 (9.1%) | 0.72 (0.33–1.58), p=0.41 | 0.69 (0.31–1.50), p=0.35 |
| Any Bacteria | ||||
| Control | 109/166 (66%) | 138/166 (83%) | .. | .. |
| Intervention | 120/192 (63%) | 153/192 (80%) | 1.00 (0.84–1.21), p=0.96 | 1.01 (0.83–1.21), p=0.96 |
| Shigella | ||||
| Control | 66/166 (40%) | 121/166 (73%) | ||
| Intervention | 79/192 (41%) | 136/192 (71%) | 0.93 (0.71–1.22), p=0.60 | 0.93 (0.71–1.22), p=0.60 |
| ETEC | ||||
| Control | 47/166 (28%) | 47/166 (28%) | ||
| Intervention | 58/192 (30%) | 52/192 (27%) | 0.90 (0.55–1.46), p=0.66 | 0.85 (0.52–1.39), p=0.52 |
| Campylobacter | ||||
| Control | 16/166 (9.6%) | 12/166 (7.2%) | ||
| Intervention | 13/192 (6.8%) | 14/192 (7.3%) | 1.44 (0.56–3.72), p=0.45 | 1.52 (0.60–3.83), p=0.37 |
| C. difficile | ||||
| Control | 9/166 (5.4%) | 4/166 (2.4%) | .. | .. |
| Intervention | 8/192 (4.2%) | 1/192 (0.52%) | 0.28 (0.03–2.95), p=0.29 | 0.26 (0.03–2.59), p=0.25 |
| E. coli O157 | ||||
| Control | 7/166 (4.2%) | 9/166 (5.4%) | .. | .. |
| Intervention | 9/192 (4.7%) | 8/192 (4.2%) | 0.69 (0.14–3.40), p=0.65 | 0.59 (0.12–2.93), p=0.52 |
| STEC | ||||
| Control | 2/166 (1.2%) | 7/166 (4.2%) | .. | .. |
| Intervention | 3/192 (1.6%) | 7/192 (3.6%) | 0.66 (0.07–6.20), p=0.72 | 0.58 (0.07–4.89), p=0.61 |
| Y. enterocolitica | ||||
| Control | 0/166 (0.0%) | 0/166 (0.0%) | .. | .. |
| Intervention | 0/192 (0.0%) | 1/192 (0.52%) | ..‡ | ..‡ |
| V. cholerae | ||||
| Control | 0/166 (0.0%) | 0/166 (0.0%) | .. | .. |
| Intervention | 0/192 (0.0%) | 0/192 (0.0%) | ..‡ | ..‡ |
| Any Protozoa | ||||
| Control | 89/166 (54%) | 121/166 (73%) | .. | .. |
| Intervention | 109/192 (57%) | 138/192 (72%) | 0.93 (0.73–1.19), p=0.56 | 0.90 (0.69–1.15), p=0.39 |
| Giardia | ||||
| Control | 86/166 (52%) | 120/166 (72%) | ||
| Intervention | 104/192 (54%) | 135/192 (70%) | 0.93 (0.73–1.18), p=0.55 | 0.89 (0.69–1.15), p=0.38 |
| Cryptosporidium | ||||
| Control | 5/166 (3%) | 3/166 (1.8%) | .. | .. |
| Intervention | 11/192 (5.7%) | 4/192 (2.1%) | 0.57 (0.06–5.38), p=0.62 | 0.55 (0.06–4.93), p=0.59 |
| E. histolytica | ||||
| Control | 0/166 (0.0%) | 0/166 (0.0%) | .. | .. |
| Intervention | 2/192 (1%) | 8/192 (4.2%) | ..‡ | ..‡ |
| Any virus | ||||
| Control | 21/166 (13%) | 18/166 (11%) | .. | .. |
| Intervention | 30/192 (16%) | 22/192 (11%) | 0.86 (0.37–1.97), p=0.72 | 0.95 (0.41–2.19), p=0.91 |
| Norovirus GI/GII | ||||
| Control | 15/166 (9%) | 15/166 (9%) | .. | .. |
| Intervention | 26/192 (14%) | 17/192 (8.8%) | 0.65 (0.25–1.69), p=0.38 | 0.74 (0.28–1.90), p=0.53 |
| Adenovirus 40/41 | ||||
| Control | 6/166 (3.6%) | 1/166 (0.6%) | ||
| Intervention | 5/192 (2.6%) | 5/192 (2.6%) | 6.12 (0.48–78.34), p=0.16 | 6.01 (0.49–73.94), p=0.16 |
| Rotavirus A | ||||
| Control | 1/166 (0.6%) | 2/166 (1.2%) | .. | .. |
| Intervention | 1/192 (0.52%) | 1/192 (0.52%) | ..‡ | ..‡ |
| Coinfection,≥2 GPP pathogens | ||||
| Control | 89/166 (54%) | 120/166 (72%) | .. | .. |
| Intervention | 102/192 (53%) | 132/192 (69%) | 0.96 (0.77–1.19), p=0.69 | 0.95 (0.76–1.19), p=0.67 |
| Trichuris | ||||
| Control | 39/95 (41%) | 62/95 (65%) | .. | .. |
| Intervention | 32/106 (30%) | 57/106 (54%) | 1.11 (0.74–1.67), p=0.60 | 1.16 (0.77–1.75), p=0.47 |
| Ascaris | ||||
| Control | 27/95 (28%) | 34/95 (36%) | ||
| Intervention | 19/106 (18%) | 21/106 (20%) | 0.88 (0.43–1.79), p=0.72 | 0.89 (0.44–1.79), p=0.74 |
| Coinfection,≥2 STH | ||||
| Control | 18/95 (19%) | 31/95 (33%) | .. | .. |
| Intervention | 13/106 (12%) | 16/106 (15%) | 0.71 (0.30–1.70), p=0.44 | 0.72 (0.31–1.69), p=0.46 |
-
Analysis includes children with complete observations at baseline and 24-month visits. Prevalence results are presented as (n/N (%)). All effect estimates are presented as prevalence ratios (ratio of ratios) with 95% confidence intervals and estimated using generalized estimating equations to fit Poisson regression models with robust standard errors.
* Pathogen outcomes adjusted for child age and sex, caregiver’s education, and household wealth index, reported diarrhea also adjusted for baseline presence of a drop-hole cover and reported use of a tap on compound grounds as primary drinking water source.
-
† Models would not converge due to sparse data.
Appendix 1—table 16
Outcome and covariate descriptions, coding, and % missing.
| Baseline, n = 987 | 12 month, n = 939 | 24 month, n = 1001 | |||
|---|---|---|---|---|---|
| % missing | % missing | % missing | Variable description | Data source | |
| Outcome Data | |||||
| Enteric infection outcome data available | 24 | 14 | 8.0 | Binary; 0/1 | Based on collection of stool material and successful analysis by GPP |
| STH infection outcome data available | 30 | 37 | 46 | Binary; 0/1 | Based on collection of stool material and successful analysis by Kato-Katz |
| Caregiver-reported diarrhea, 7-day recall | 1.3 | 7.8 | 20 | Binary; 0/1 | Child Survey |
| Covariate data | |||||
| Child sex, female | 2.3 | 1.3 | 7.0 | Binary; 0=male, 1=female | Child Survey |
| Respondent is child's mother | 2.5 | 7.6 | 20 | Binary; 0/1 | Child Survey |
| Caregiver completed primary school | 0.8 | 1.7 | 6.7 | Binary; 0/1 | Child Survey |
| Child breast feeds with or without complementary feeding | 1.3 | 7.7 | 20 | Binary; 0/1 | Child Survey |
| Child exclusively breastfeeds | 1.3 | 7.7 | 20 | Binary; 0/1 | Child Survey |
| Child wears a diaper | 1.4 | 7.6 | 20 | Binary; 0/1 | Child Survey |
| Child feces is disposed of in a latrine | 1.3 | 7.1 | 20 | Binary; 0/1 | Created from survey questions in Child Survey |
| Child age at sampling, days | 23 | 16 | 17 | Integer | Created from birthdate (Child Survey) and date of sampling |
| Child age at survey, days | 2.6 | 7.5 | 19 | Integer | Created from birthdate (Child Survey) and date of Survey |
| 30-day cumulative rainfall at sampling | 21 | 14 | 10 | Continuous | Created from sample date and data from data from the National Oceanic and Atmospheric Administration’s National Centers for Environmental Information (https://www.ncdc.noaa. gov/cdo-web/datatools/findstation) |
| 30-day cumulative rainfall at survey | 1.3 | 7.1 | 19 | Continuous | Created from survey date and data from data from the National Oceanic and Atmospheric Administration’s National Centers for Environmental Information (https://www.ncdc.noaa. gov/cdo-web/datatools/findstation) |
| Sample collection during rainy season | 21 | 14 | 10 | Binary; 0/1 | Created from sample date. Rainy season defined as November – April. |
| Survey collection during rainy season | 1.3 | 7.1 | 19 | Binary; 0/1 | Created from survey date. Rainy season defined as November – April. |
| Household crowding, >3 persons/room | 0.4 | 0.3 | 2.7 | Binary; 0/1 | Created from questions in Household Survey |
| Household floor is covered | 0.4 | 0.3 | 2.7 | Binary; 0/1 | Observation |
| Household walls made of concrete, bricks or similar | 0.4 | 0.3 | 2.7 | Binary; 0/1 | Observation |
| Household population | 0.3 | 0.3 | 1.6 | Integer | Household survey |
| Number of rooms in household | 0.4 | 0.3 | 2.3 | Integer | Created from questions in Household Survey |
| Wealth score, 0 (poorest) - 1 (wealthiest), unitless | 0.4 | 0.3 | 2.7 | Continuous | Created from questions in Household Survey using Simple Poverty Scorecard for Mozambique (http://www.simplepovertyscorecard.com/MOZ_2008_ENG.pdf). Questions referencing latrine removed from 12 month and 24 month score. All scores normalized by total number of points available. |
| Household uses tap in compound as primary drinking water source | 1.7 | 1.0 | 2.0 | Binary 0/1 | Created from drinking water source question in Household Survey |
| Latrine has drop-hole cover | 1.9 | 0.0 | 0.0 | Binary; 0/1 | Observation |
| Latrine has a ventpipe | 1.8 | 0.0 | 0.0 | Binary; 0/1 | Observation |
| Latrine has a ceramic, tile, or concrete pedestal or slab | 2.2 | 0.1 | 0.1 | Binary; 0/1 | Observation |
| Latrine has sturdy walls made of concrete, bricks, or similar | 1.9 | 0.0 | 0.0 | Binary; 0/1 | Observation |
| Compound population | 0.0 | 0.0 | 0.0 | Integer | Compound Survey, enrollment checklists |
| Number of households in compound | 0.0 | 0.0 | 0.0 | Integer | Compound Survey, enrollment checklists |
| Number of latrines present in the compound | 0.1 | 0.0 | 0.0 | Integer | Compound Survey |
| Persons per latrine | 1.8 | 0.1 | 0.3 | Continuous | Created by dividing the compound population by the number of latrines/drop-holes |
| Households per latrine | 1.8 | 0.1 | 0.3 | Continuous | Created by dividing the number of households in the compound by the number of latrines in the compound |
| Number of water taps present in the compound | 1.1 | 0.0 | 0.0 | Integer | Compound Survey |
| Standing water visible around compound grounds | 1.9 | 0.3 | 0.0 | Binary; 0/1 | Observation |
| Standing or leaking wastewater visible around compound grounds | 1.9 | 0.3 | 0.0 | Binary; 0/1 | Observation |
| Faeces or used diapers observed around compound grounds or in solid waste | 1.9 | 0.3 | 0.0 | Binary; 0/1 | Observation |
| Compound floods when it rains | 0.0 | 0.0 | 0.0 | Binary; 0/1 | Compound Survey |
| Compound has electricity that normally functions | 0.0 | 0.0 | 0.0 | Binary; 0/1 | Compound Survey |
| Compound-level population density | 2.2 | 1.5 | 1.5 | Continuous, persons/m2 | Created by dividing the population of the compound by the measured area of the compound |
| Any animal present in the compound | 0.0 | 0.4 | 0.0 | Binary; 0/1 | Observation |
| Dog(s) present in the compound | 0.0 | 0.4 | 0.0 | Binary; 0/1 | Observation |
| Chicken(s) and/or duck(s) present in the compound | 0.0 | 0.4 | 0.0 | Binary; 0/1 | Observation |
| Cat(s) present in the compound | 0.0 | 0.4 | 0.0 | Binary; 0/1 | Observation |
| Any other animal(s) present in the compound | 0.0 | 0.4 | 0.0 | Binary; 0/1 | Observation |
Additional files
-
Transparent reporting form
- https://cdn.elifesciences.org/articles/62278/elife-62278-transrepform-v3.docx
-
Reporting standard 1
Consort 2010 checklist extension for cluster trials.
- https://cdn.elifesciences.org/articles/62278/elife-62278-repstand1-v3.docx
Download links
A two-part list of links to download the article, or parts of the article, in various formats.
Downloads (link to download the article as PDF)
Open citations (links to open the citations from this article in various online reference manager services)
Cite this article (links to download the citations from this article in formats compatible with various reference manager tools)
Effects of an urban sanitation intervention on childhood enteric infection and diarrhea in Maputo, Mozambique: A controlled before-and-after trial
eLife 10:e62278.
https://doi.org/10.7554/eLife.62278


