Mouse aging cell atlas analysis reveals global and cell type-specific aging signatures
- Department of Electrical Engineering, Stanford University, United States
- Department of Epidemiology, Harvard T.H. Chan School of Public Health, United States
- Program in Medical and Population Genetics, Broad Institute of MIT and Harvard, United States
- Chan-Zuckerberg Biohub, United States
- Department of Biomedical Data Science, Stanford University, United States
Figures
Figure 1 with 6 supplements
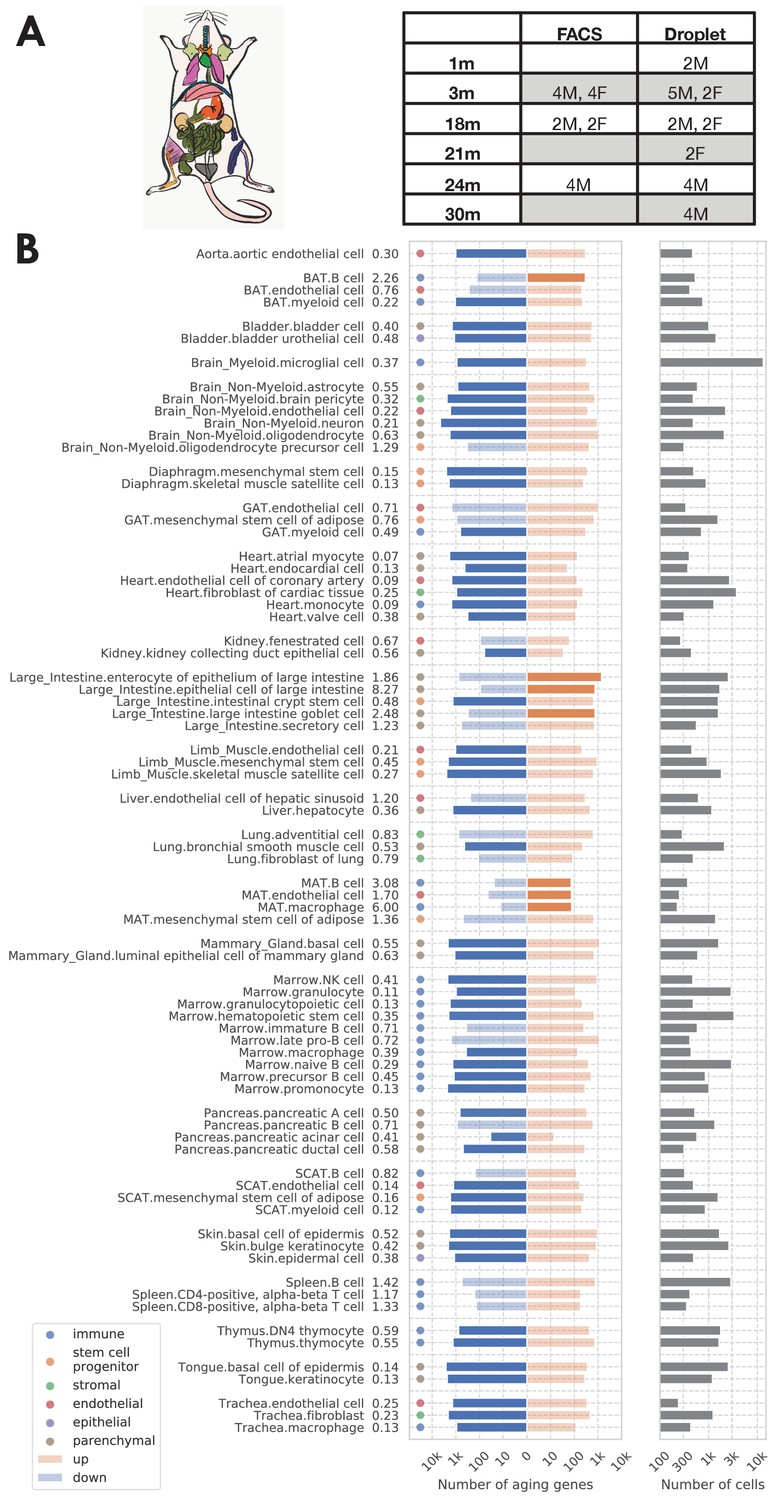
Analysis overview.
(A) Sample description. The TMS FACS data was collected from 16 C57BL/6JN mice (10 males, 6 females) with ages ranging from 3 months (20-year-old human equivalent) to 24 months (70-year-old human equivalent). (B) Significantly aging-dependent genes in all 76 tissue-cell types in the FACS data. The left panels show the number of aging-related genes (discoveries) for each tissue-cell type, broken down into the number of upregulated genes (orange) and the number of downregulated genes (blue), with the numbers on the left showing the ratio (up/down). Tissue-cell types with significantly more up/downregulated genes (ratio >1.5) are highlighted in solid color. Most tissue-cell types have significantly more downregulated aging genes. The right panel shows the number of cells sequenced for each tissue-cell type.
-
Figure 1—source data 1
Source data for Figure 1.
- https://cdn.elifesciences.org/articles/62293/elife-62293-fig1-data1-v2.xlsx
Figure 1—figure supplement 1
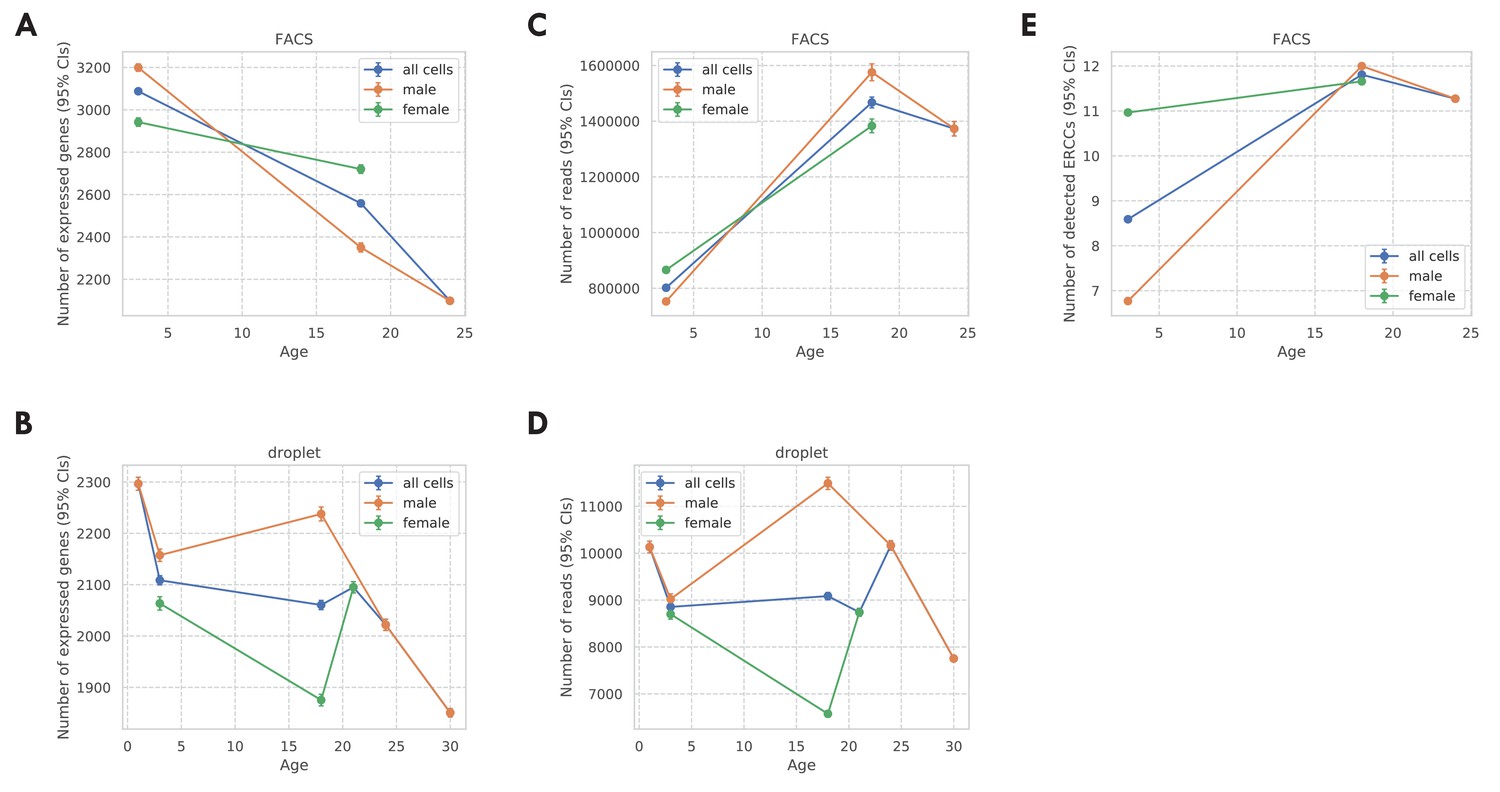
Covariates for the TMS FACS data and the TMS droplet data.
(A) Number of expressed genes per cell (CDR) for the TMS FACS data. (B) Number of expressed genes per cell (CDR) for the TMS droplet data. (C) Number of read counts per cell for the TMS FACS data. (D) Number of read counts (UMIs) per cell for the TMS droplet data. (E) Number of detected ERCC spike-ins per cell for the TMS FACS data. For all panels, results were presented for all cells (blue), male cells (orange), and female cells (green), separately. Also, the vertical bars represent 95% confidence intervals.
Figure 1—figure supplement 2
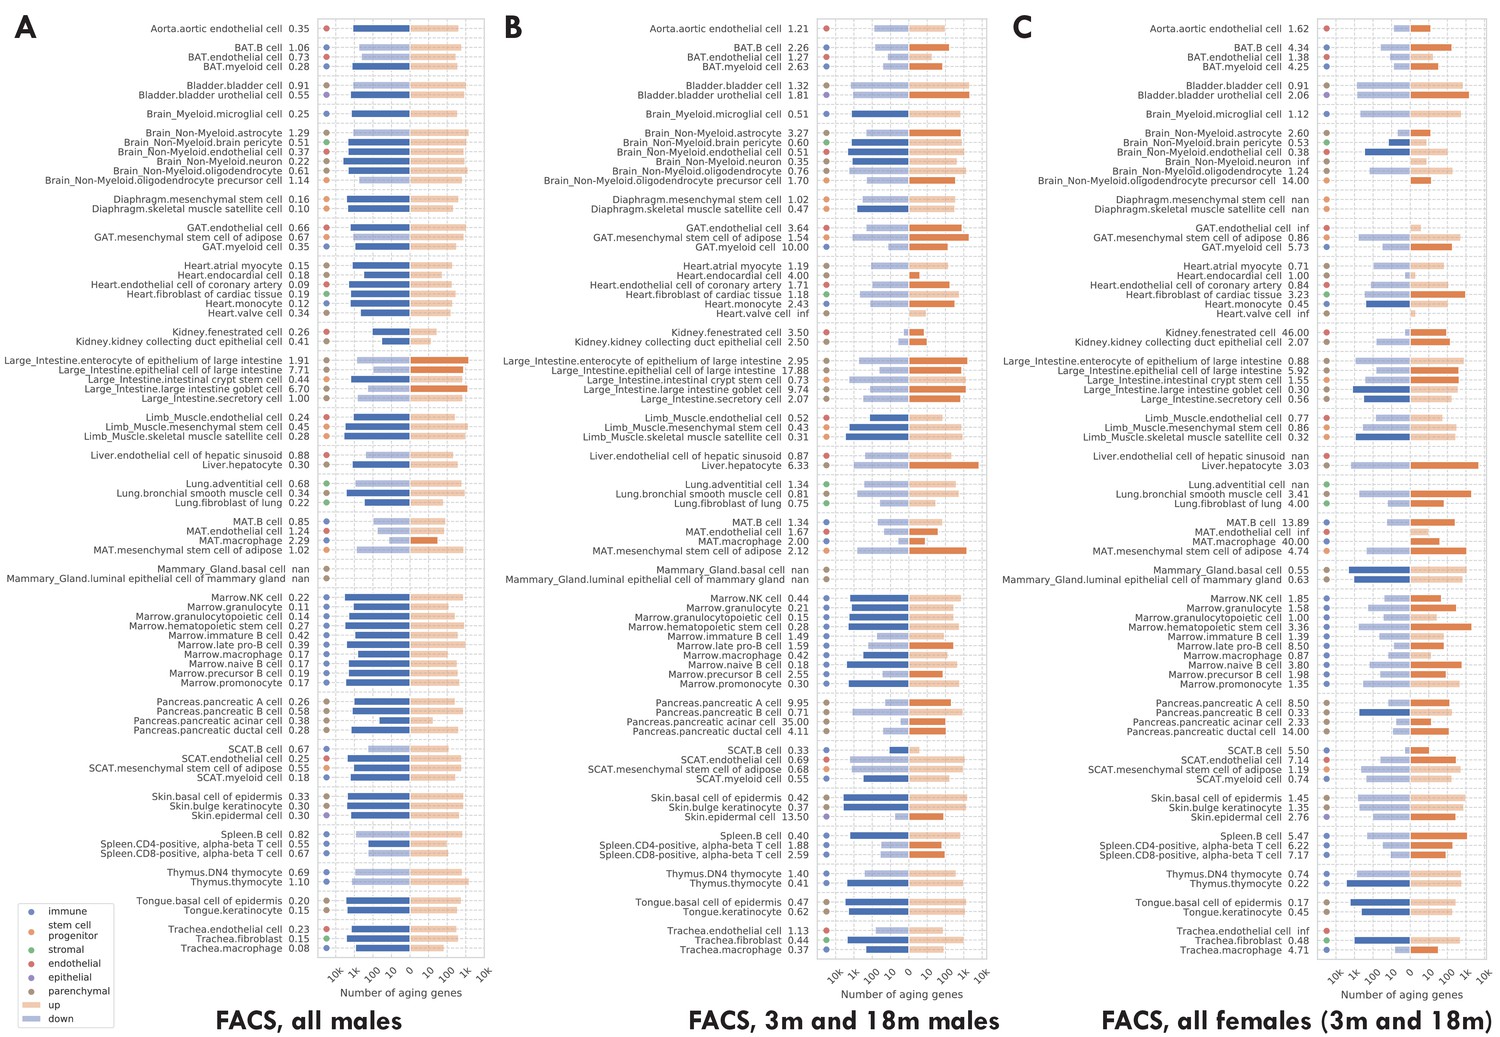
Number of significantly age-dependent genes for each tissue-cell type, from DGE analyses performed using subsets of mice in the TMS FACS data.
(A) Using only male mice. (B) Using only 3 m and 18 m male mice. (C) Using only female mice, which are either 3 m or 18 m. We can see that most tissue-cell types in panel A have significantly more downregulated aging-related genes, but such a pattern does not exist in panels B and C. The TMS FACS data has male mice in all three time points 3 m/18 m/24 m and female mice in only two time points 3 m/18 m. The comparison between panels A and B, both using male mice, indicates that the downregulation pattern is mainly driven by the 24 m mice. The comparison between panels B and C, both using 3 m/18 m mice, indicates that there is no systematic difference between male and female mice.
Figure 1—figure supplement 3
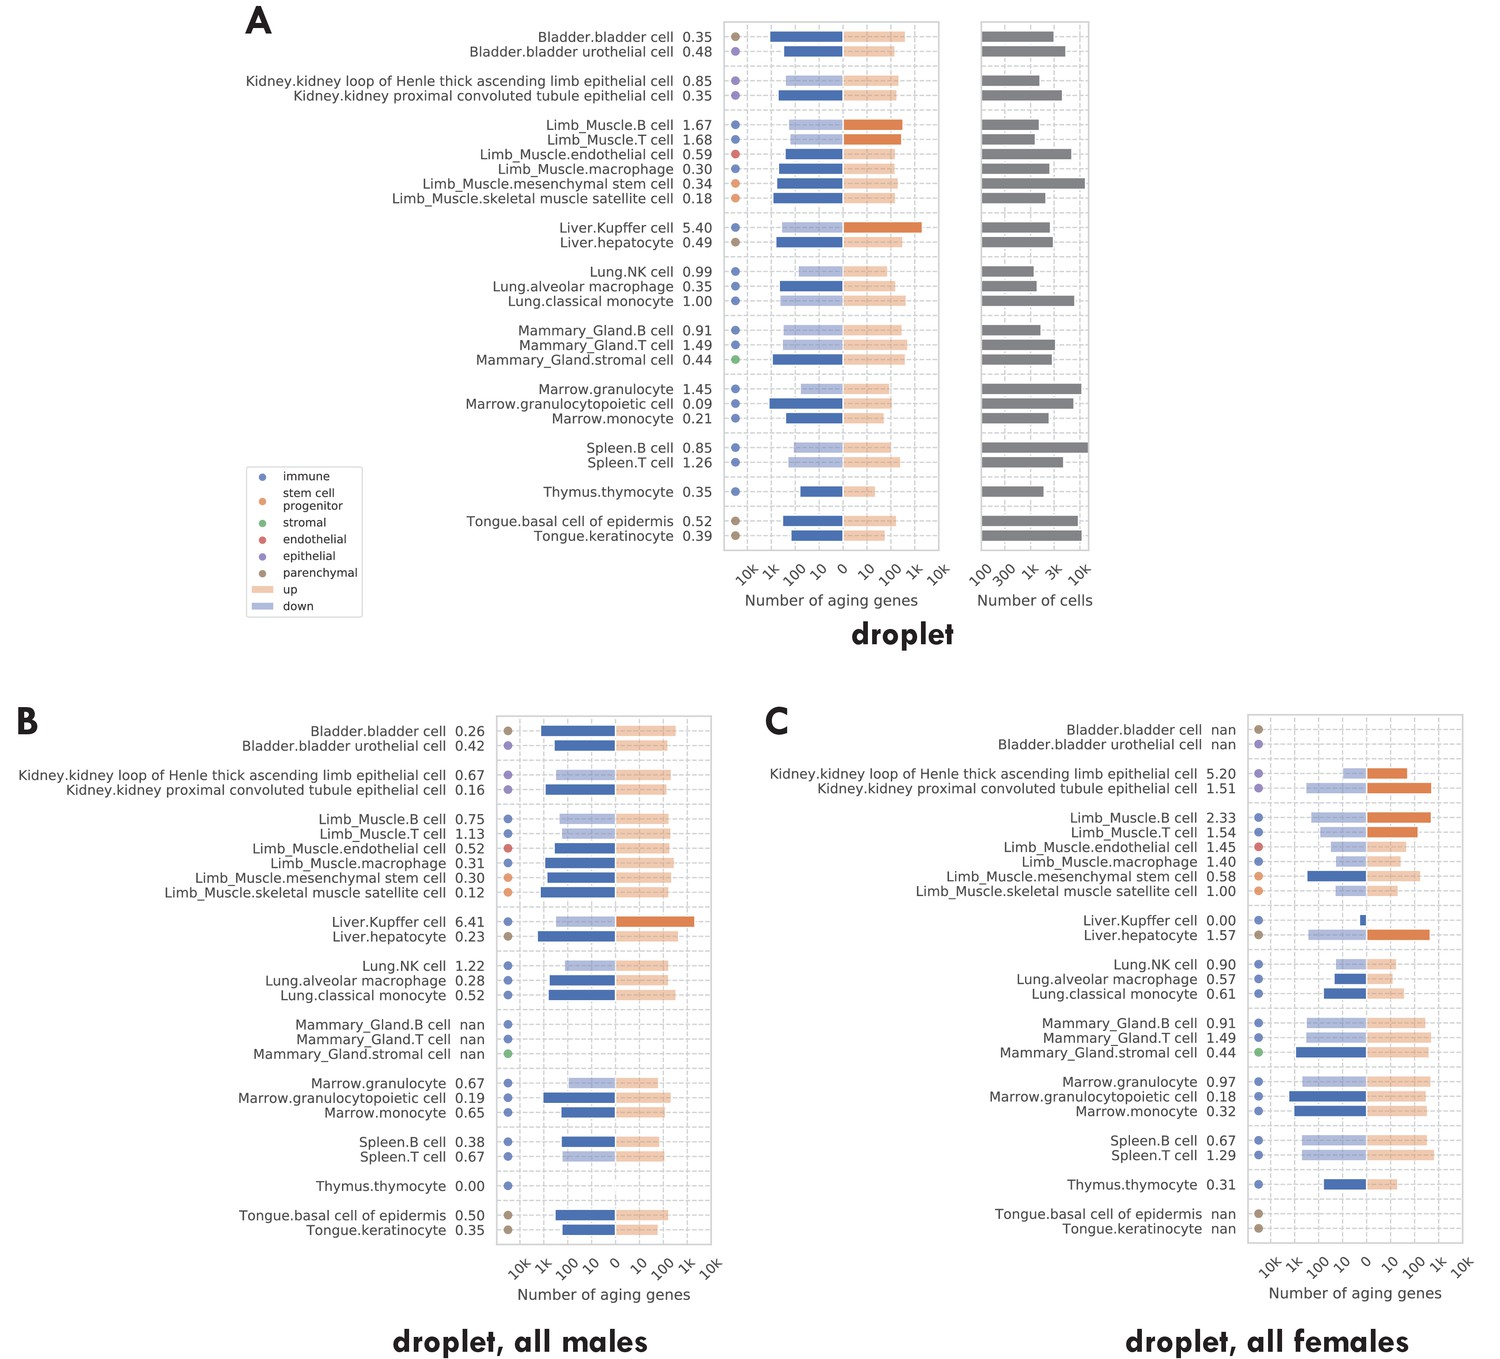
Number of significantly age-dependent genes for each tissue-cell type, from DGE analyses performed using subsets of mice in the TMS droplet data.
(A) Using all mice. (B) Using only male mice. (C) Using only female mice. We can see that there are more downregulated aging-related genes in all three panels. The comparison between panels B and C shows that there is no systematic difference between male and female mice.
Figure 1—figure supplement 4
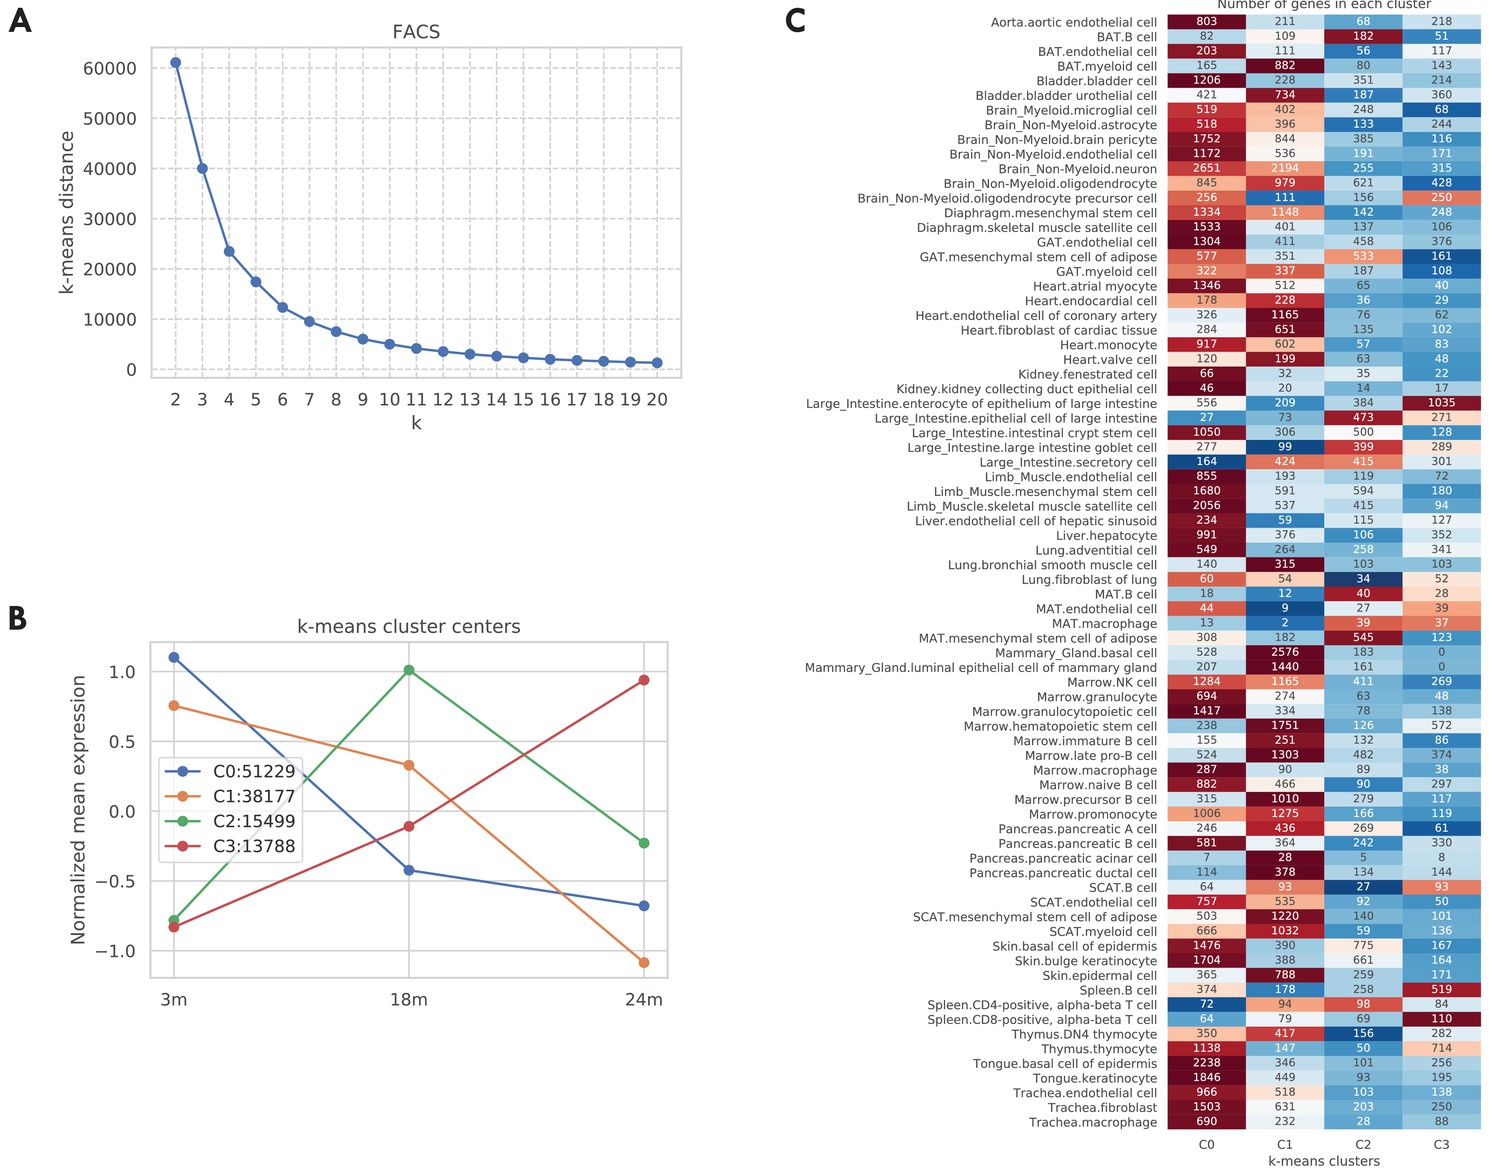
Aging trajectory of aging-related genes in the TMS FACS data.
For each aging-related tissue-cell-gene tuple (defined as the gene significantly related to aging in a tissue-cell type), we computed its aging trajectory by first computing the mean expression of each time point and then z-scored the expressions over the time points (making mean 0 and std 1). Next, in order to learn the typical aging trajectories, we used the k-means clustering algorithm to cluster the aging trajectories of all those 118,693 aging-related tissue-cell-gene tuples. As shown in panel A, according to the elbow method there are k = 4 clusters. We further visualized those four cluster centers in panel B. As indicated by the figure legend, most tuples are associated with cluster centers 0 and 1, corresponding to monotonically decreasing gene expressions from 3 m to 24 m. Interestingly, 15,499 tuples are associated with cluster center 2 whose gene expressions first increased from 3 m to 18 m and then decreased from 18 m to 24 m. Also, 13,788 tuples are associated with cluster center 3, corresponding to a monotonically increasing aging trajectory. In panel C, we further counted those tuples by tissue-cell types. While most tissue-cell types have aging-related genes belonging to cluster centers 0 and 1 corresponding to monotonically decreasing trajectories, B cells in the brown adipose tissue (BAT), epithelial cells in the large intestine, and mesenchymal stem cells of adipose in the mesenchymal adipose tissue (MAT) have more aging-related genes in cluster 2, where the gene expressions increased from 3 m to 18 m and then decreased from 18 m to 24 m. In addition, cell types in the MAT, large intestine, and spleen have more upregulated aging-related genes that correspond to clusters 2 and 3, consistent with Figure 1B.
Figure 1—figure supplement 5
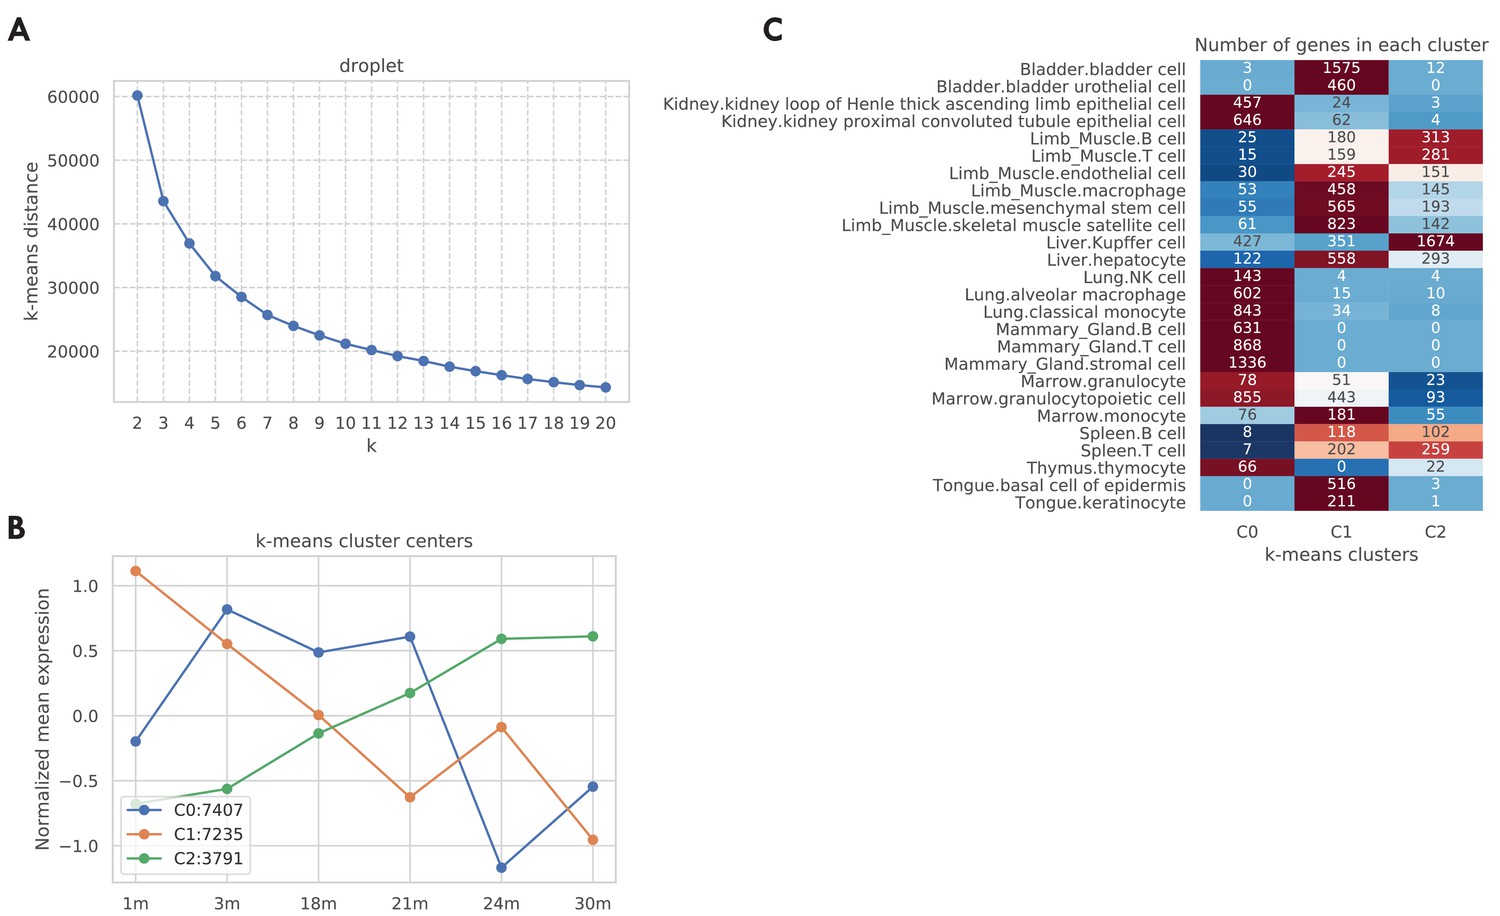
Aging trajectory of aging-related genes in the TMS droplet data.
We computed and clustered the aging trajectories for genes in the TMS droplet data similar to Figure 1—figure supplement 4. As shown in panel A, according to the elbow method there are k = 3 clusters. We further visualized those three cluster centers in panel B. As indicated by the figure legend, most tuples are associated with cluster centers 0 and 1, corresponding to a general decreasing pattern from 1 m to 30 m. 3791 tuples are associated with cluster center 2, corresponding to a monotonically increasing aging trajectory. In panel C, we further counted those tuples by tissue-cell types. While most tissue-cell types have aging-related genes belonging to clusters 0 and 1 corresponding to generally decreasing trajectories, cell types in the limb muscle, and Kupffer cells in the kidney have more upregulated aging-related genes that correspond to cluster 2, consistent with Figure 1—figure supplement 3A.
Figure 1—figure supplement 6
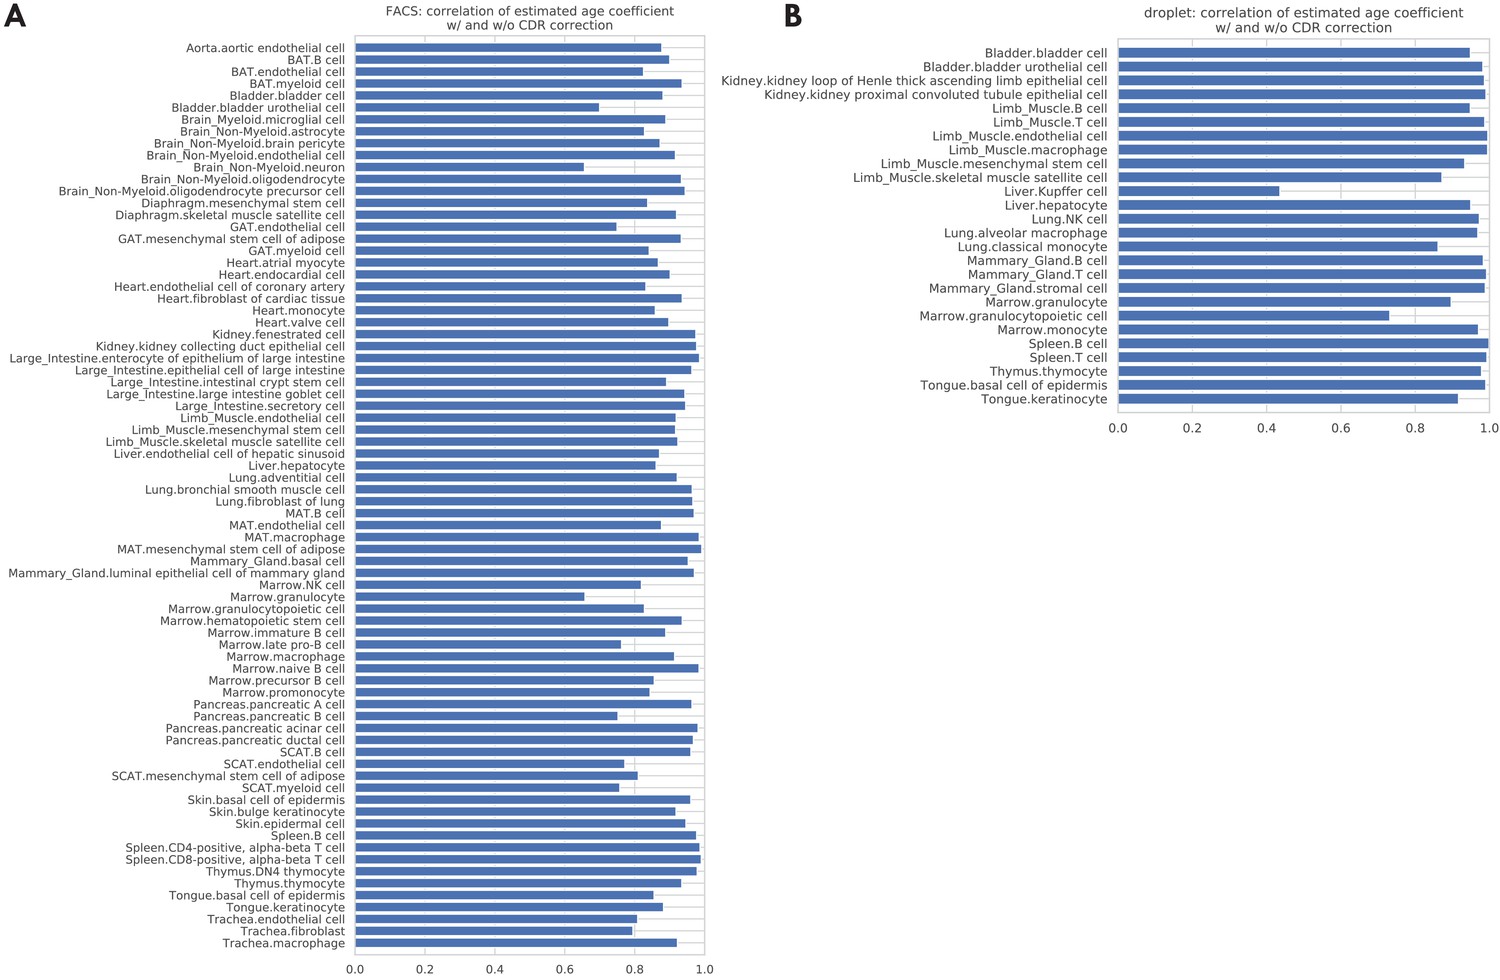
Correlations between the age coefficients estimated with and without CDR correction.
The bar plots show the correlation between age coefficients estimated with and without CDR correction, across all the genes, for each tissue-cell type separately. The average correlation, across all tissue-cell types, is 0.89 (std 0.08) for the FACS data (panel A) and 0.93 (std 0.12) for the droplet data (panel B).
Figure 2 with 4 supplements
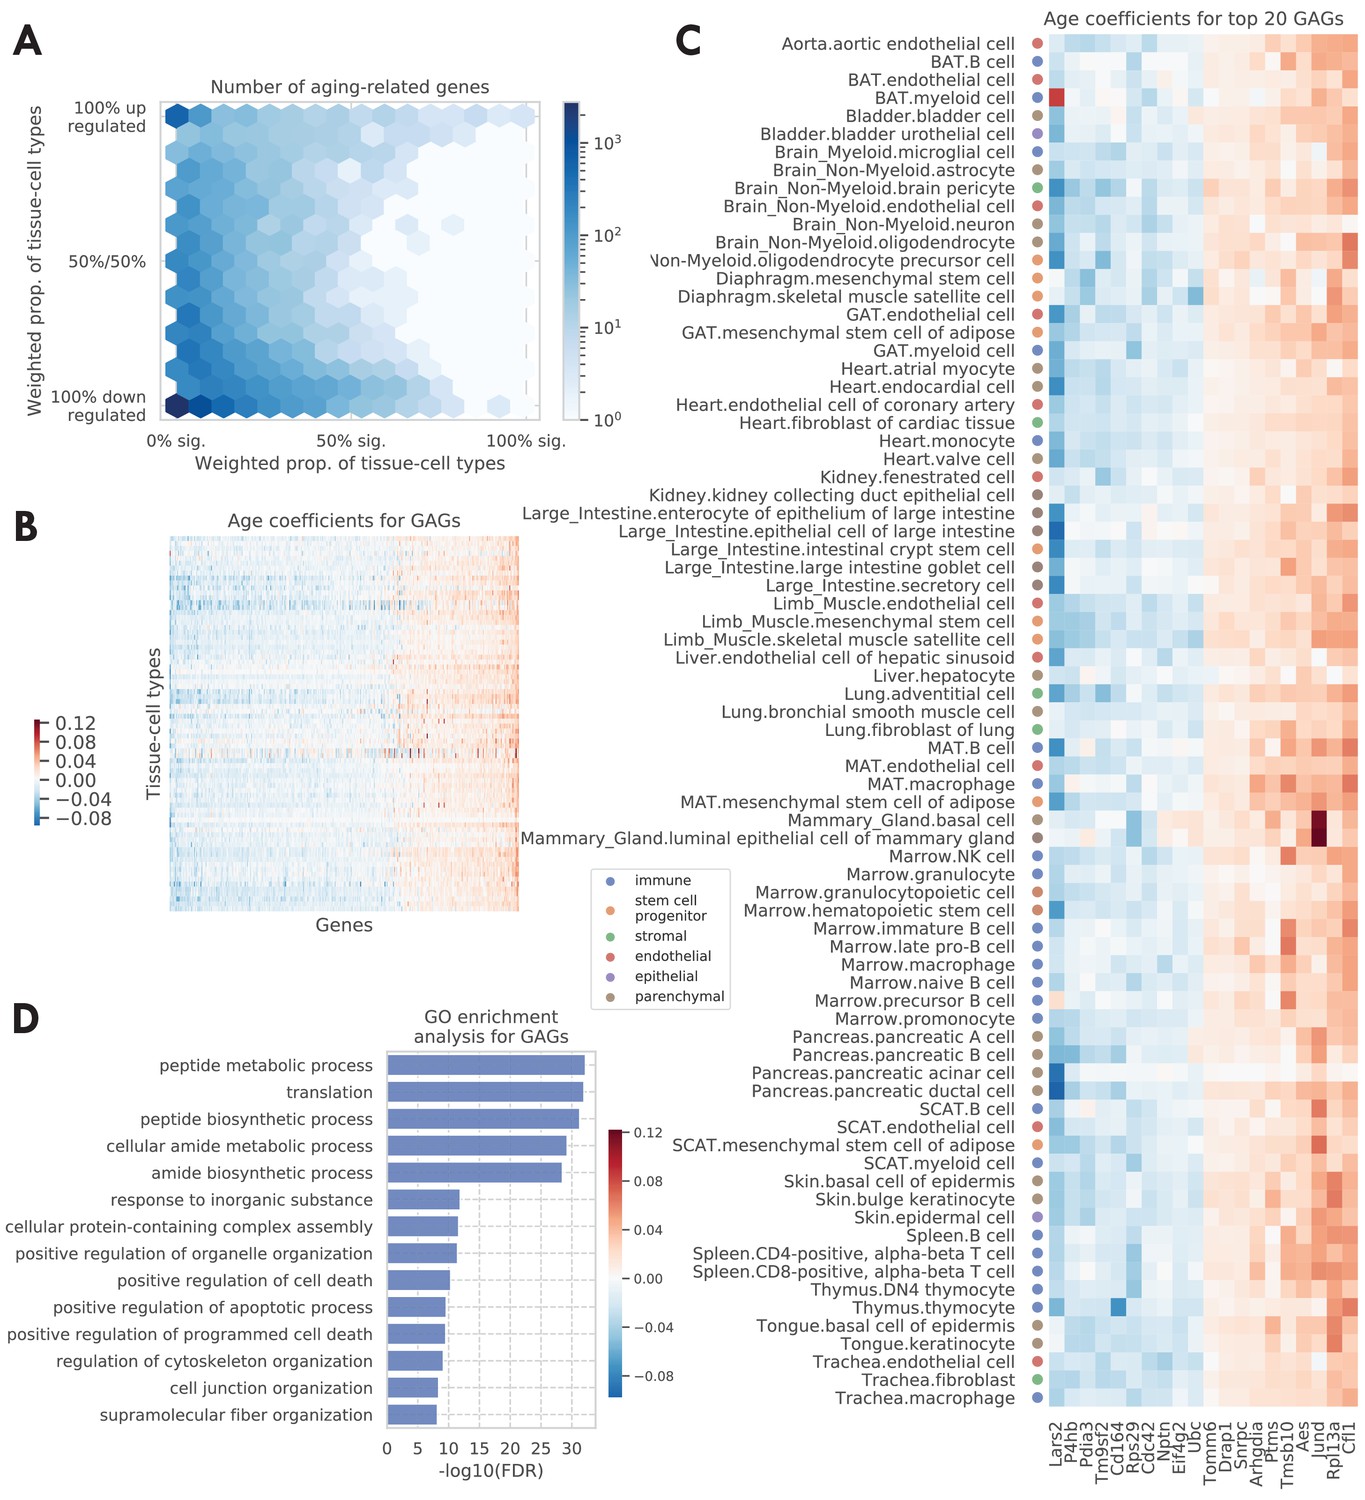
Tissue-cell level global aging genes (GAGs).
(A) Tissue-cell level aging-related genes with color indicating the number of the genes. The x-axis shows the weighted proportion of tissue-cell types (out of all 76 tissue-cell types) where the gene is significantly related to aging, while the y-axis shows the weighted proportion of tissue-cell types where the gene is upregulated. (B and C) Heatmap of age coefficients of the GAGs (panel B) and the top 20 GAGs (panel C). The age coefficients are in the unit of log fold change per month and blue/red represent down/upregulation. (D) Top GO biological pathways for the GAGs.
-
Figure 2—source data 1
Source data for Figure 2.
- https://cdn.elifesciences.org/articles/62293/elife-62293-fig2-data1-v2.xlsx
Figure 2—figure supplement 1

Comparison between aging-related genes discovered in the TMS FACS data and other gene sets, including the mouse aging genes and human aging genes in the GenAge database (Tacutu et al., 2018), senescence genes as provided by the IPA software (Krämer et al., 2014), transcription factors, eukaryotic initiation factors, and ribosomal protein genes (Rpl/Rps genes).
The figure axes are the same as Figure 2A. We observe significant overlap between the FACS aging-related genes and all six gene sets, as quantified by Fisher’s exact tests with p-values provided in the panel titles.
Figure 2—figure supplement 2
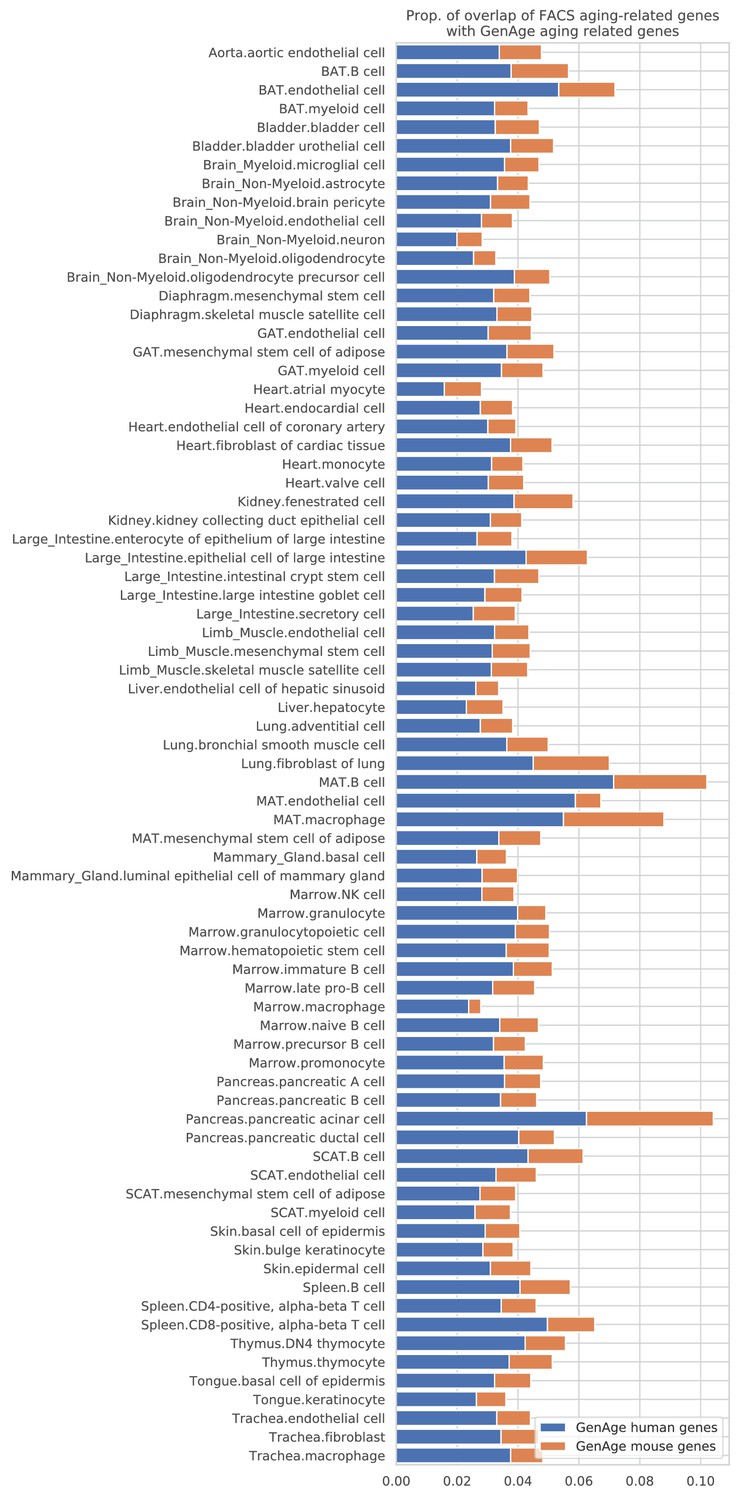
Overlap between the TMS FACS aging-related genes and the GenAge aging markers.
The figure shows, for each tissue-cell type, the proportion of aging-related genes that are also shared by the GenAge human aging genes (blue) and the GenAge mouse aging genes (orange). No tissue-cell type is particularly enriched with the GenAge human aging genes. There are 303 human aging genes and 136 mouse aging genes in the GenAge database (97 genes shared by the two sets), explaining why the FACS aging-related genes overlap more with the GenAge human aging genes.
Figure 2—figure supplement 3
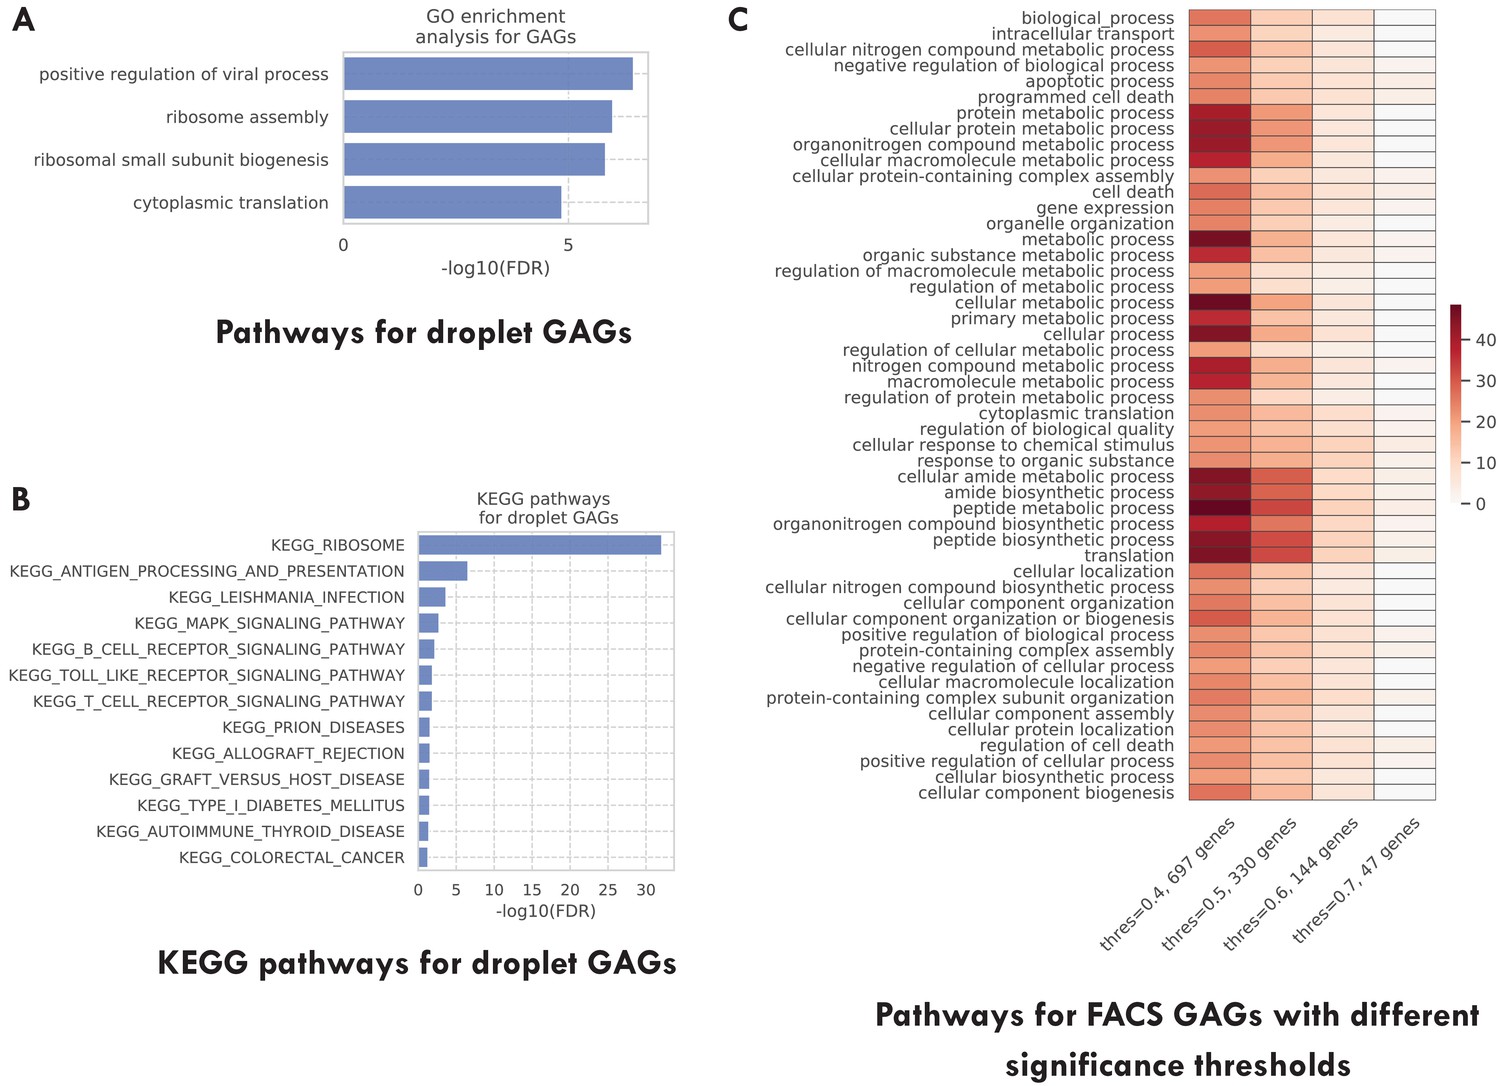
Additional pathway enrichment analysis results.
(A) Top GO biological pathways for the TMS droplet GAGs. (B) Top 20 KEGG pathways for the TMS droplet GAGs. (C) Top GO biological pathways for the TMS FACS GAGs selected with different significance thresholds (as indicated in the x-axis). The color represents the negative log10 FDR. As we can see, GAGs selected using different thresholds are associated with similar pathways.
Figure 2—figure supplement 4

KEGG pathways and IPA pathways for the 330 TMS FACS GAGs.
(A) Top 20 KEGG pathways for the GAGs. (B) Top IPA pathways for the GAGs. The ratio represents the proportion of pathway genes that are also GAGs. (C) Regulation prediction for mTOR pathway by IPA. Overall, the pathway is predicted to be downregulated, with related processes including translation, actin organization, and VEGF (vascular endothelial growth factor) signaling.
Figure 3 with 8 supplements
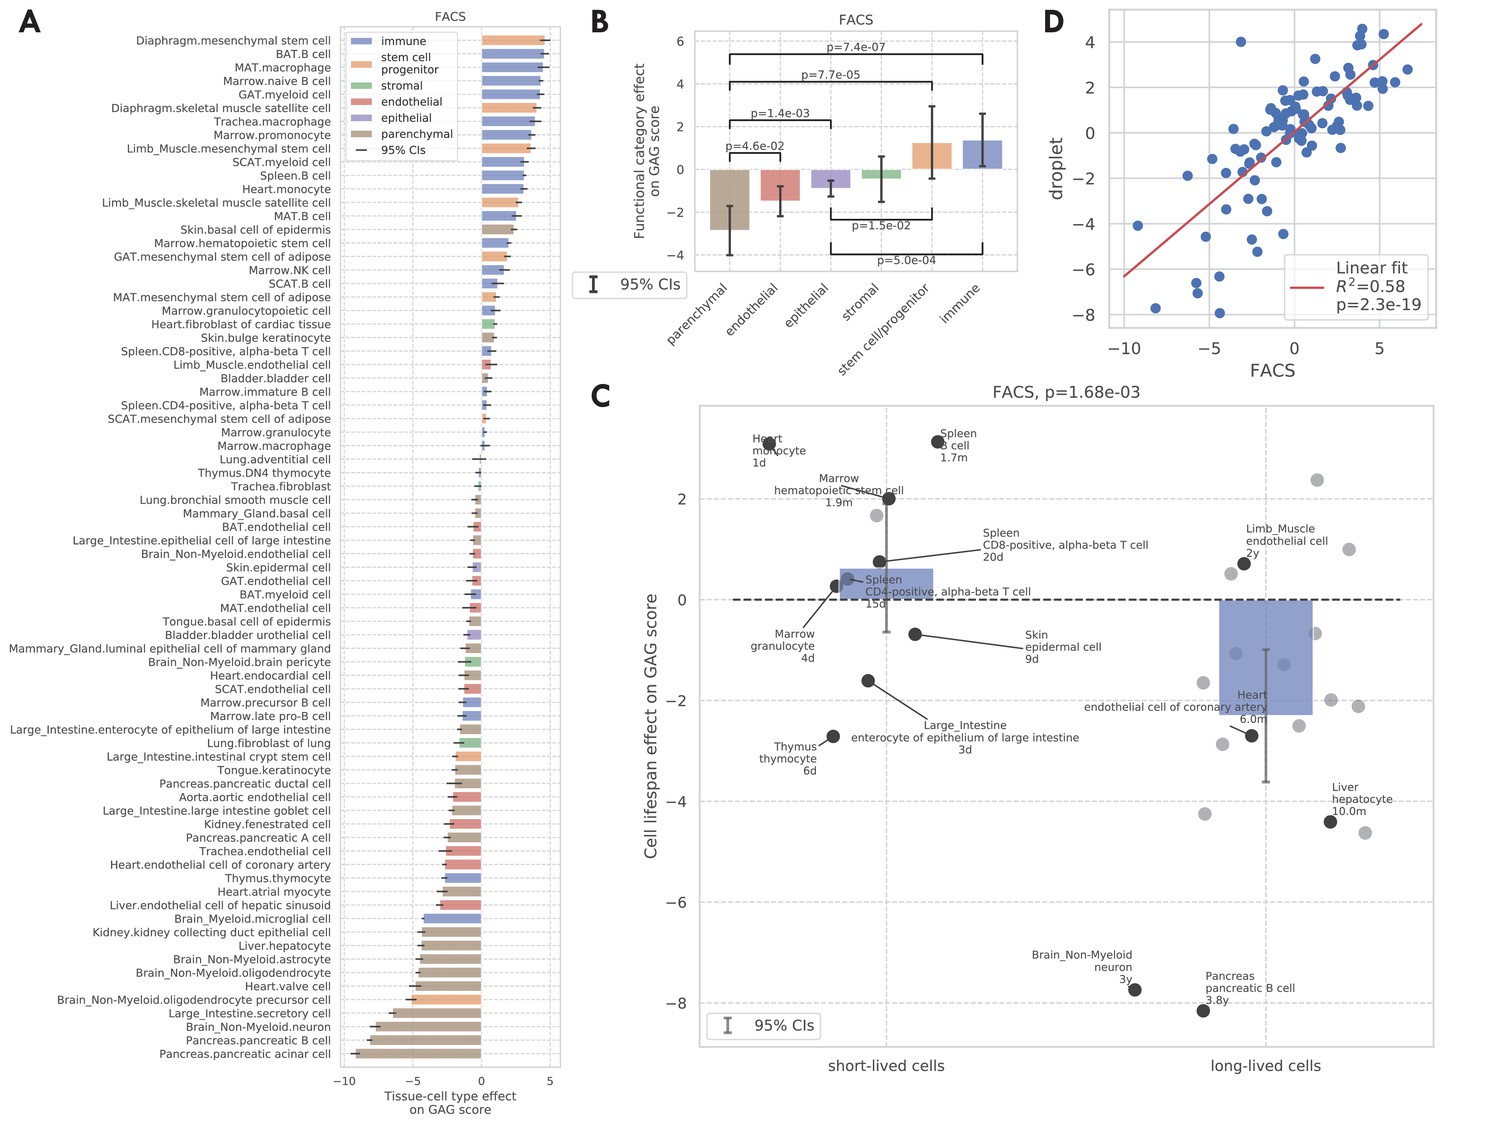
GAG score.
(A) Tissue-cell GAG score effects with 95% confidence intervals. The color represents the functional category of the tissue-cell type. (B and C) Effects of cell functional categories (panel B) and binary cell lifespan (panel C) on the GAG score, meta-analyzed over all tissue-cell types within the group. A positive y-value means that the cells in the group (functional category group for panel B and binary cell lifespan group for panel C) have higher GAG score values than other cells of the same age and sex. 95% confidence intervals and nominal p-values are provided to quantify the differences between categories. In panel C, the average lifespan annotation is also provided for a subset of tissue-cell types where such information is available. (D) Comparison between the tissue-cell GAG score effects estimated from the FACS data (x-axis) and the droplet data (y-axis). Each dot corresponds to a tissue-cell type, and a linear fit is provided showing that the estimates are consistent.
-
Figure 3—source data 1
Source data for Figure 3.
- https://cdn.elifesciences.org/articles/62293/elife-62293-fig3-data1-v2.xlsx
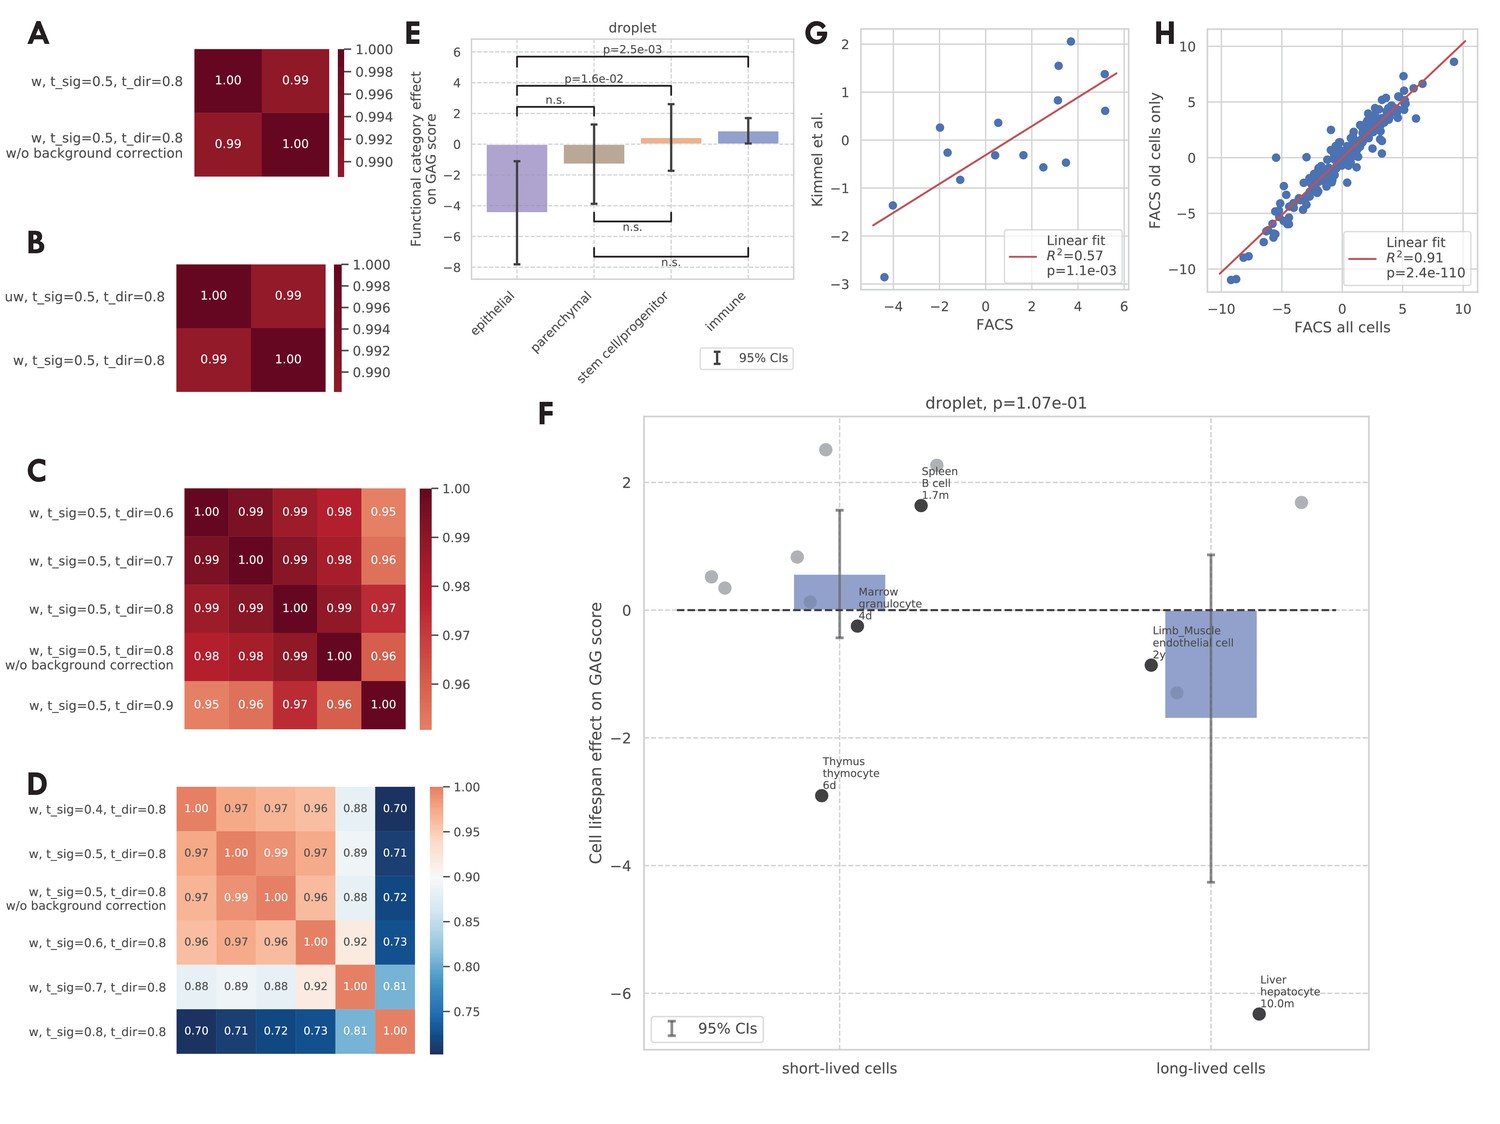
Figure 3—figure supplement 1
Additional validations of the GAG score.
(A–D) Correlation between the GAG scores computed using different scoring rules. The original GAG score was computed using genes that are significantly related to aging in >50% of weighted tissue-cell types and have the same directionality in >80% of weighted tissue-cell types (i.e., ‘‘w, t_sig = 0.5, t_dir = 0.8’). After that, a cell-wise background correction was performed. Panel A shows that the cell-wise background correction does not significantly change the GAG score. Panel B shows that weighted and unweighted tissue-cell types (w/uw) give similar results. Panel C shows that different directionality thresholds (t_dir) give similar results. Panel D shows that different significance thresholds (t_sig) give similar results, except that when t_sig = 0.9, which is probably too stringent. (E and F) Effects of functional categories (panel D) and binary cell lifespan (panel E) on the GAG score in the TMS droplet data, meta-analyzed over all tissue-cell types in the group. A positive y-value means that the cells in the group (functional category group for panel E and binary lifespan group for panel F) have higher GAG score values than other cells of the same age and sex. 95% confidence intervals and nominal p-values are provided to quantify the differences between categories. In panel F, the average cell lifespan annotations are also provided for a subset of tissue-cell types. (G) The comparison between the tissue-cell GAG score effects estimated from the FACS data (x-axis) and the Kimmel et al. data (Kimmel et al., 2019) (y-axis). Each dot corresponds to a tissue-cell type, and a linear fit is provided, showing that the estimates are consistent. (H) The comparison between the tissue-cell GAG score effects estimated using all cells in the FACS data (x-axis) and using only old cells in the FACS data (y-axis). Each dot corresponds to a tissue-cell type, and a linear fit is provided, showing that the estimates are consistent.
Figure 3—figure supplement 2
Additional validations of the GAG score.
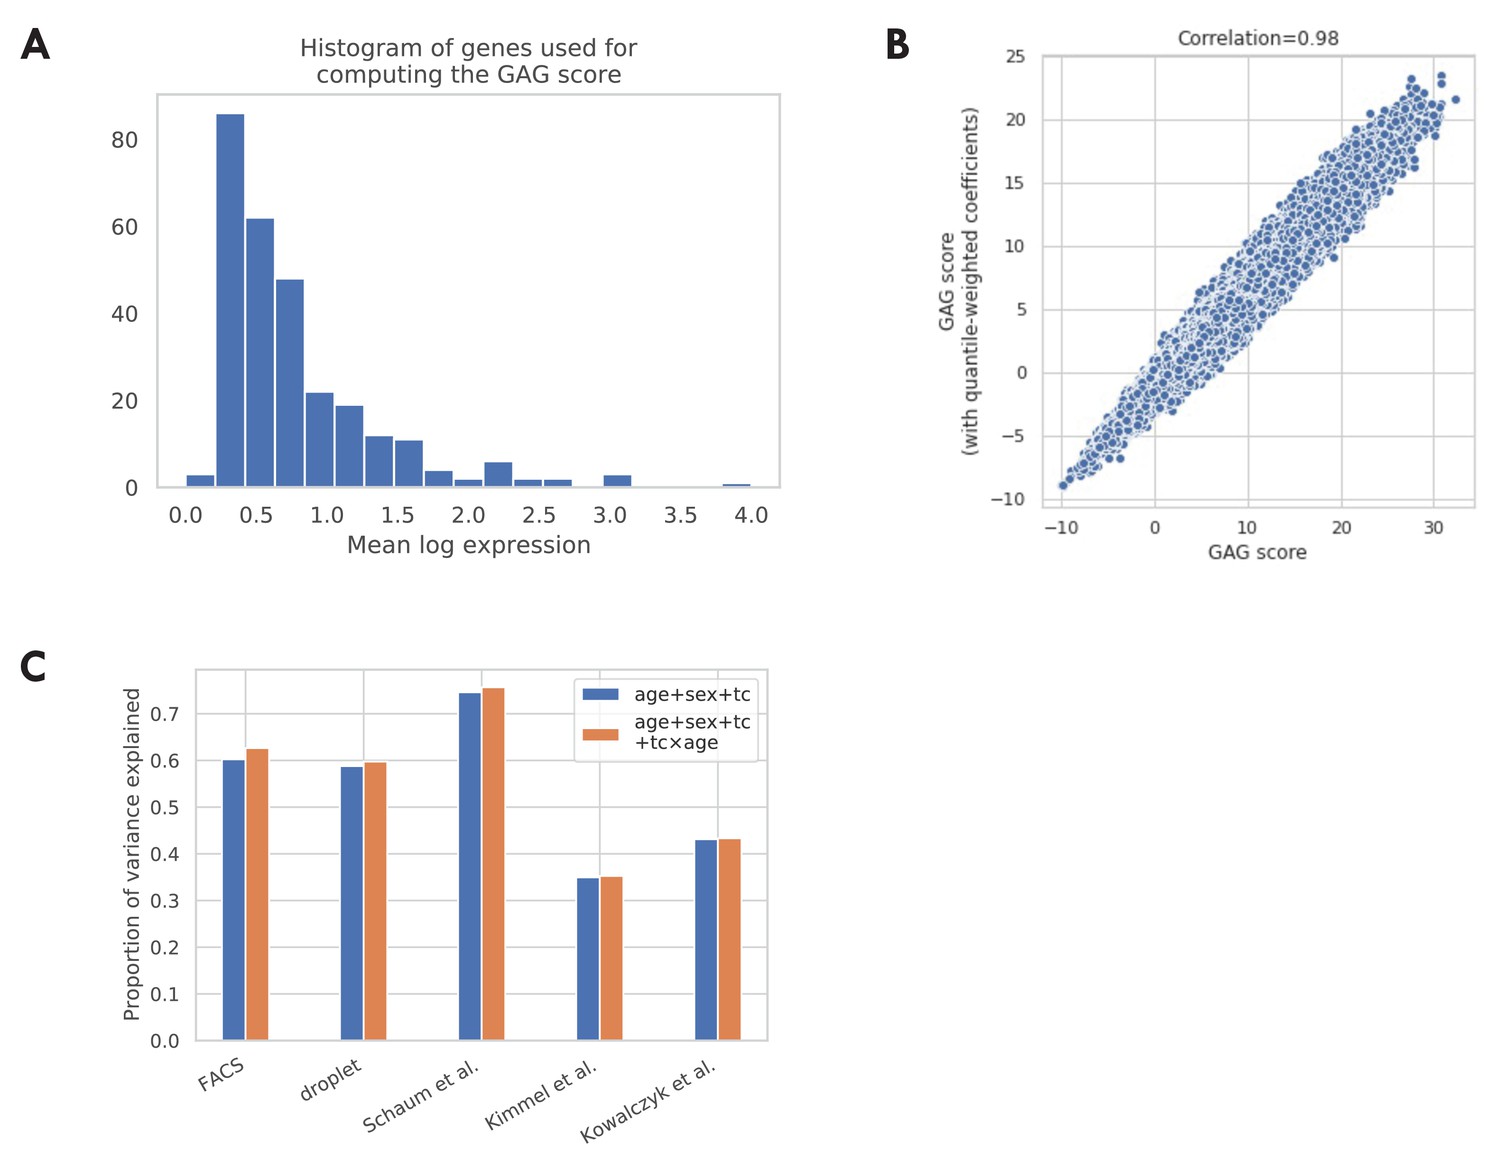
(A) Histogram of mean log expression of genes used for computing the GAG score. As shown in the figure, there are no genes with very high expression levels, indicating that the GAG score is unlikely to be dominated by a few highly expressed genes. (B) Comparison between the GAG scores computed using different gene weights. The x-axis corresponds to the GAG score computed using the unweighted average. This is the version used in the main analysis. The y-axis corresponds to an alternative version of GAG score computed using a weighted average, where the weights are inversely proportional to the dynamic range of the gene (95% quantile – 5% quantile in log expression). As shown in the figure, the two versions of GAG scores are highly correlated, indicating that the GAG score is robust to the choice of different gene weights. (C) Proportion of variance explained by different GAG score models. In the main analysis, we model GAG score as a linear combination of effects from chronological age, sex, and tissue-cell type (age + sex + tc). We also consider an alternative model by further adding the interaction terms between chronological age and each tissue-cell type (age + sex + tc + tc × age). We find that both models explain a good proportion of variance while the additional variance explained by the alternative model is small.
Figure 3—figure supplement 3
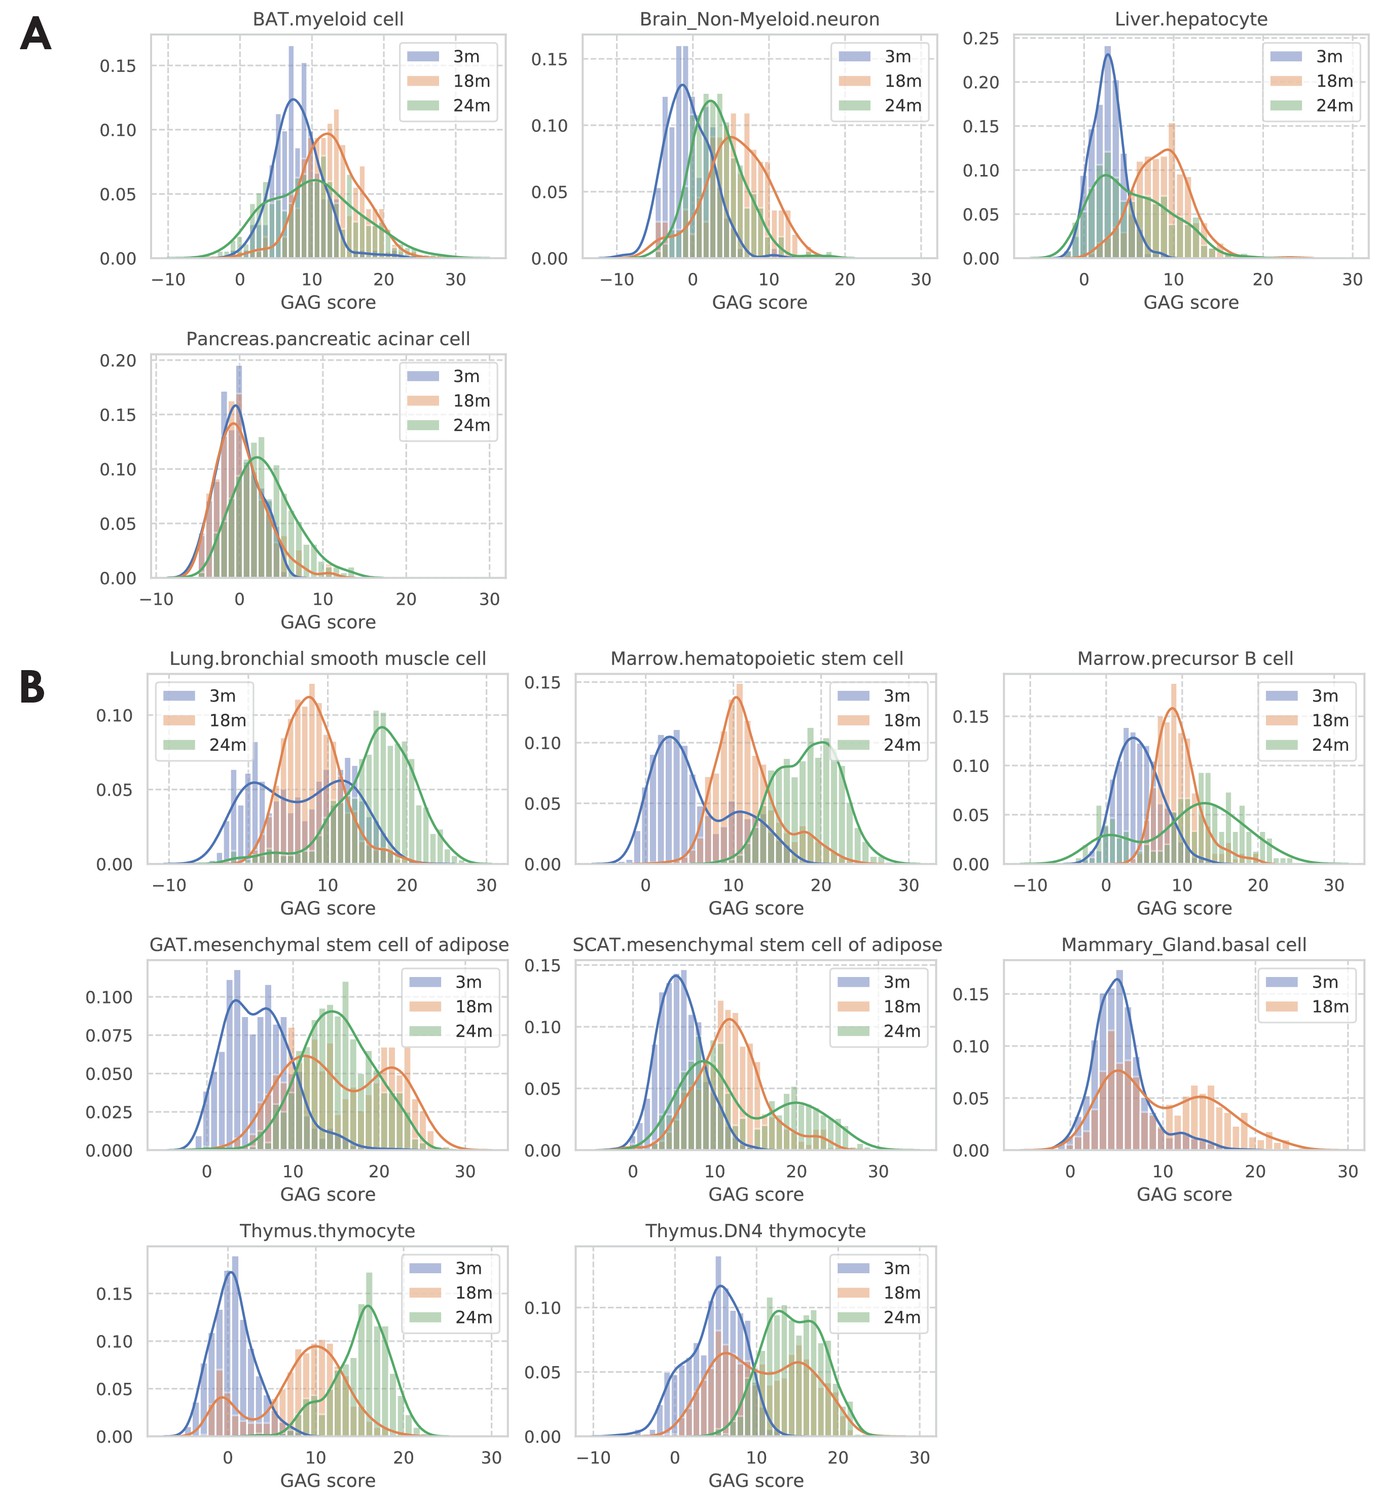
Distribution of GAG scores across cells; stratified by tissue-cell types and grouped by mice’s chronological age.
Most tissue-cell types have lower GAG scores for young cells and higher GAG scores for old cells. However, as shown by the GAG score distribution plots in panel A, we found four tissue-cell types whose GAG scores are similar between age groups, suggesting that the cells from these four tissue-cell types do not change much during aging. We also found eight tissue-cell types that each has a subpopulation of cells whose GAG scores are more similar to that of cells from a different age group (panel B). Specifically, bronchial smooth muscle cells in the lung and hematopoietic stem cells in the marrow have a subpopulation of 3 m cells that has larger GAG scores like old cells, suggesting that those young cells may have an aging status similar to that of old cells. On the other hand, each of the other six tissue-cell types has a subpopulation of old cells that has much smaller GAG scores, implying that those old cells may have an aging status similar to that of young cells.
Figure 3—figure supplement 4
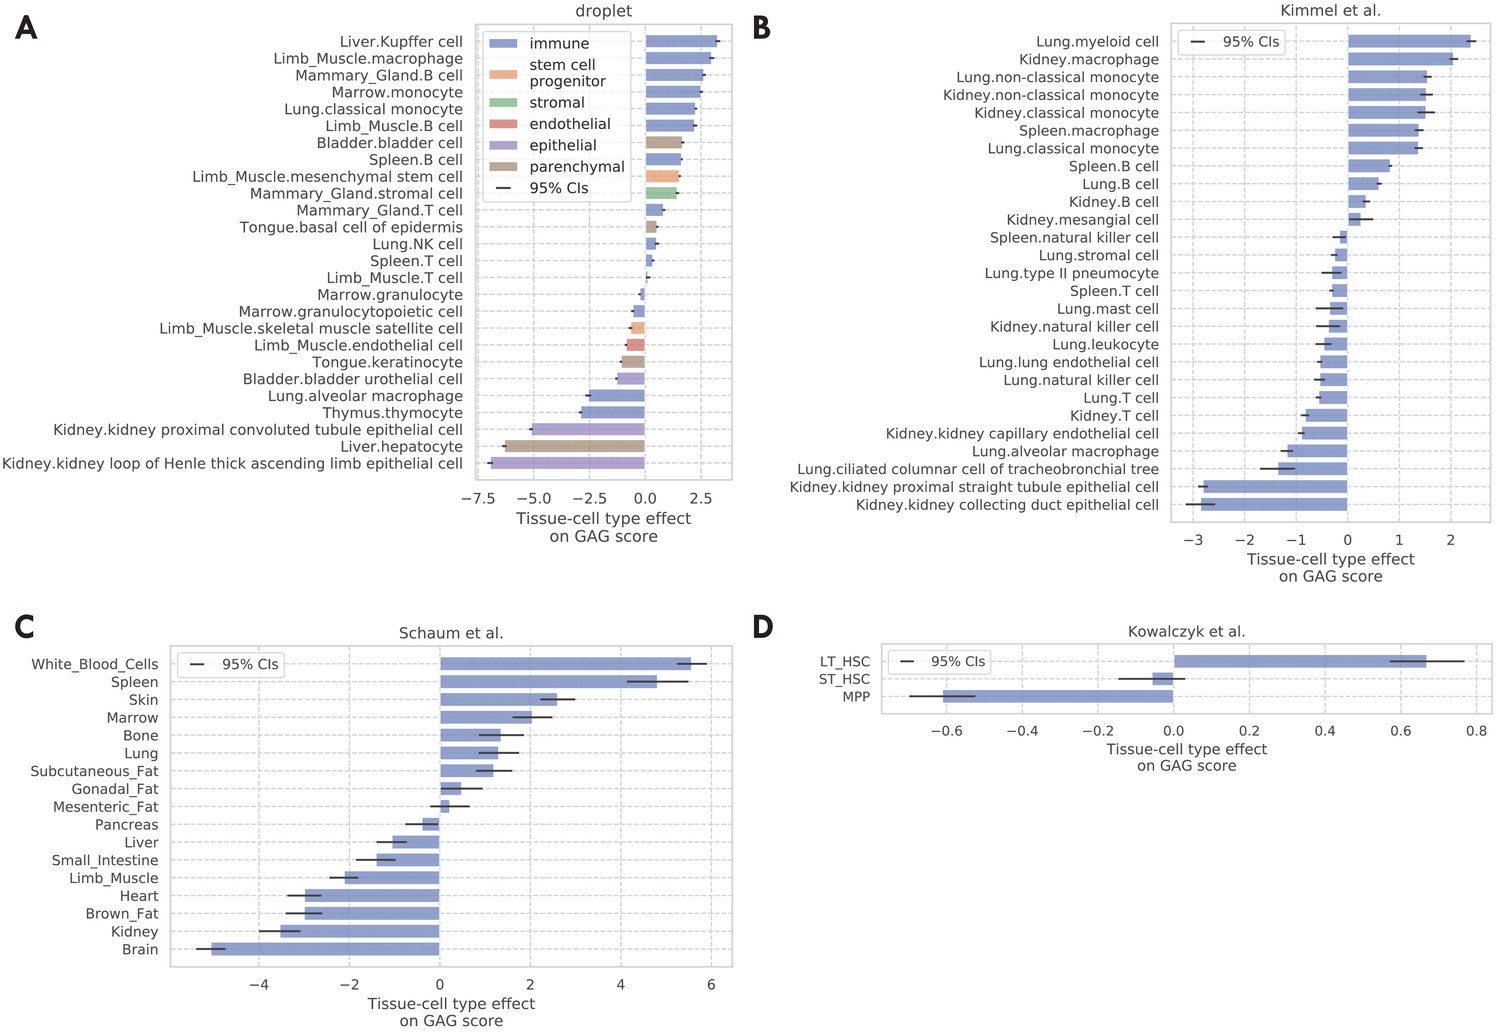
Tissue-cell GAG score effects for the four validation data sets.
(A) TMS droplet data. (B) Data (Kimmel et al., 2019). (C) The bulk data (Schaum et al., 2020). (D) Data (Kowalczyk et al., 2015).
Figure 3—figure supplement 5

Tissue-level analysis as validation.
(A) Number of discoveries for each tissue. The left panels show the number of aging genes (discoveries) for each tissue, broken down into the number of upregulated genes (orange), and the number of downregulated genes (blue), with the numbers on the left showing the ratio (up/down). Tissue types with significantly more up/downregulated genes (ratio >1.5) are highlighted in the solid color. We can see most tissues have significantly more downregulated aging genes. The right panels show the number of cells for each tissue. (B) Tissue-level aging-related genes with color indicating the number of genes. The x-axis shows the weighted proportion of tissue types (out of 23 tissues) where the gene is significantly related to aging, while the y-axis shows the weighted proportion of tissues where the gene is upregulated. (C) TMS FACS tissue-level GAG score effects with 95% confidence intervals. (D) Comparison between the FACS tissue-level GAG score effects and the droplet tissue-level GAG score effects. Each dot corresponds to a tissue type, and a linear fit is provided showing the estimates are consistent. Description of the tissue-level validation: We repeated the aging analyses at the tissue level in order to compare and assess the robustness of our tissue-cell level findings. We carried out a DGE analysis for every tissue by pooling the cells from all cell types in the tissue. The number of discoveries for each tissue is shown in A. Out of 23 tissues 18 have significantly more downregulated aging genes while there are significantly more upregulated aging genes in the large intestine, consistent with the tissue-cell level result in Figure 1B. We also observed a similar downregulation pattern in the droplet data in the tissue-level analysis, but a less clear pattern when looking at the bulk data (Figure 3—figure supplement 6). The tissue-level DGE result is summarized in B. Similar to the tissue-cell level analysis, we again observed a bimodal pattern and a consistent direction of change during aging for genes shared by more tissues. We also observed a similar bimodal pattern in the bulk data (C). We used a threshold of 0.8 for selecting tissue-level global aging genes (GAGs) and found 147 such genes, out of which 138 were also tissue-cell level GAGs, indicating a strong consistency (p<1e-100 via a Fisher’s exact test). We next computed the tissue-level GAG score effect for each tissue using the tissue-level GAGs. As shown in C, the tissue-level GAG score effects are qualitatively similar to the tissue-cell level GAG score effects, with the immune tissues (spleen, marrow, thymus) being at the top, and brain myeloid and pancreas being at the bottom. We observed a similar consistency in the droplet data and the bulk data (Figure 3—figure supplement 8). In addition, we observed a strong consistency between the tissue-level GAG score effects estimated from different data sets (D for comparison with the droplet data, Figure 3—figure supplement 7D for comparison with the bulk data), demonstrating the robustness of the GAG score analysis.
Figure 3—figure supplement 6
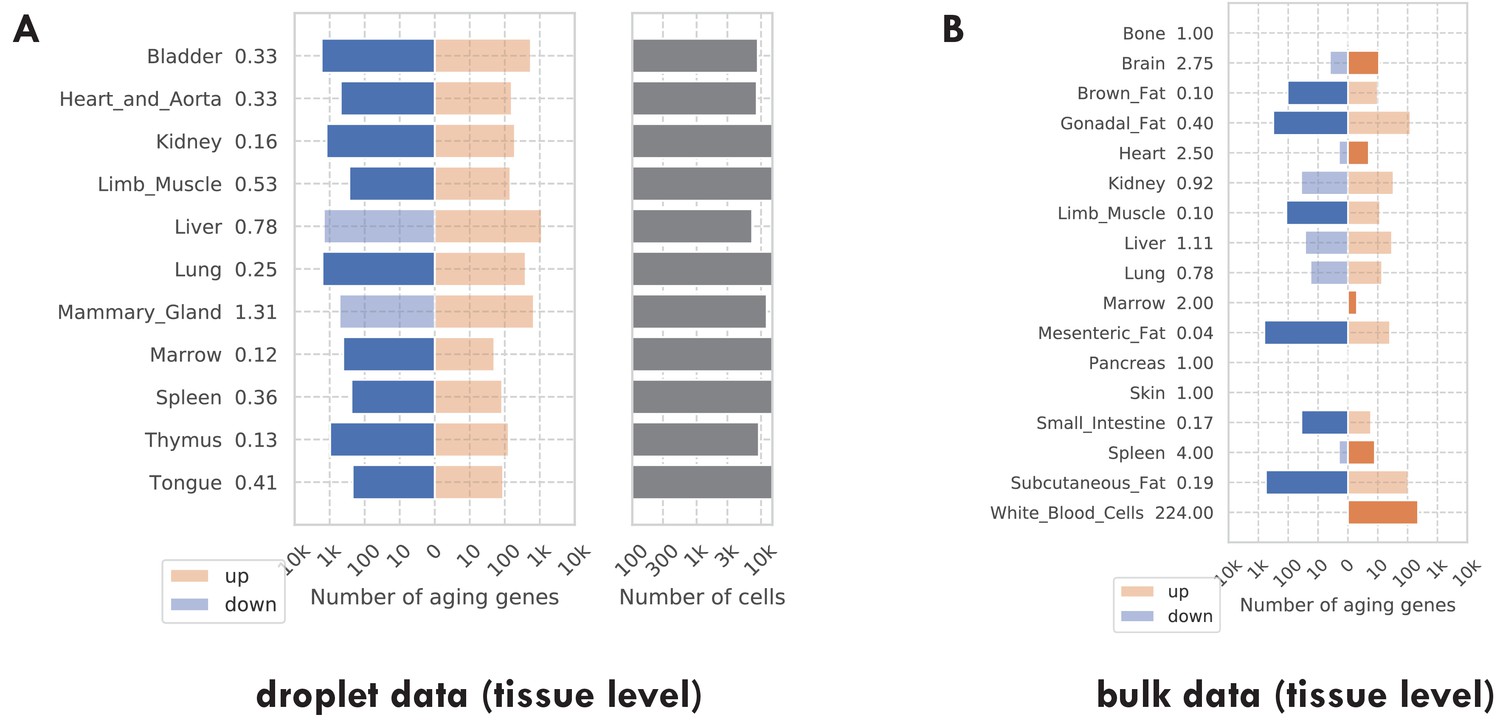
Number of discoveries for each tissue.
(A) TMS droplet data. (B) The bulk data. The left panels show the number of aging genes (discoveries) for each tissue, broken down into the number of upregulated genes (orange) and the number of downregulated genes (blue), with the numbers on the left showing the ratio (up/down). Tissue types with significantly more up/downregulated genes (ratio >1.5) are highlighted in the solid color. The right panels show the number of cells for each tissue.
Figure 3—figure supplement 7

Tissue-cell validations.
(A) Tissue-cell level aging-related genes for the TMS droplet data with color indicating the number of genes. (B) Tissue-level aging-related genes for the TMS droplet data with color indicating the number of genes. (C) Tissue-level aging-related genes for the bulk data with color indicating the number of genes. (D) Comparison between the FACS tissue-level GAG score effects and the bulk data tissue-level GAG score effects. Each dot corresponds to a tissue type, and a linear fit is provided showing that the estimates are consistent.
Figure 3—figure supplement 8
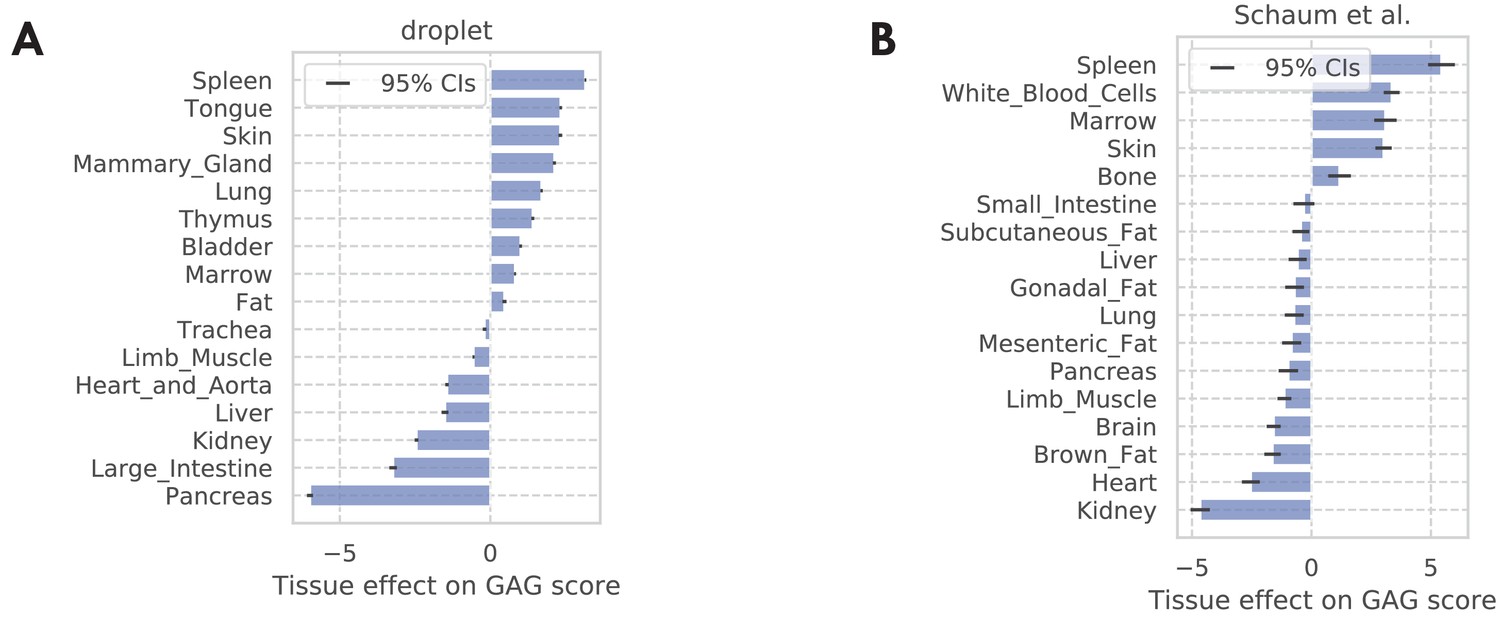
Tissue-level GAG score effects.
(A) TMS droplet data. (B) The bulk data. The results are consistent with the result in the FACS data as shown in Figure 3—figure supplement 5C, with the immune tissues (spleen, white blood cells, marrow, and thymus) being at the top, and pancreas being at the bottom.
Figure 4 with 3 supplements
Functional-category-specific genes.
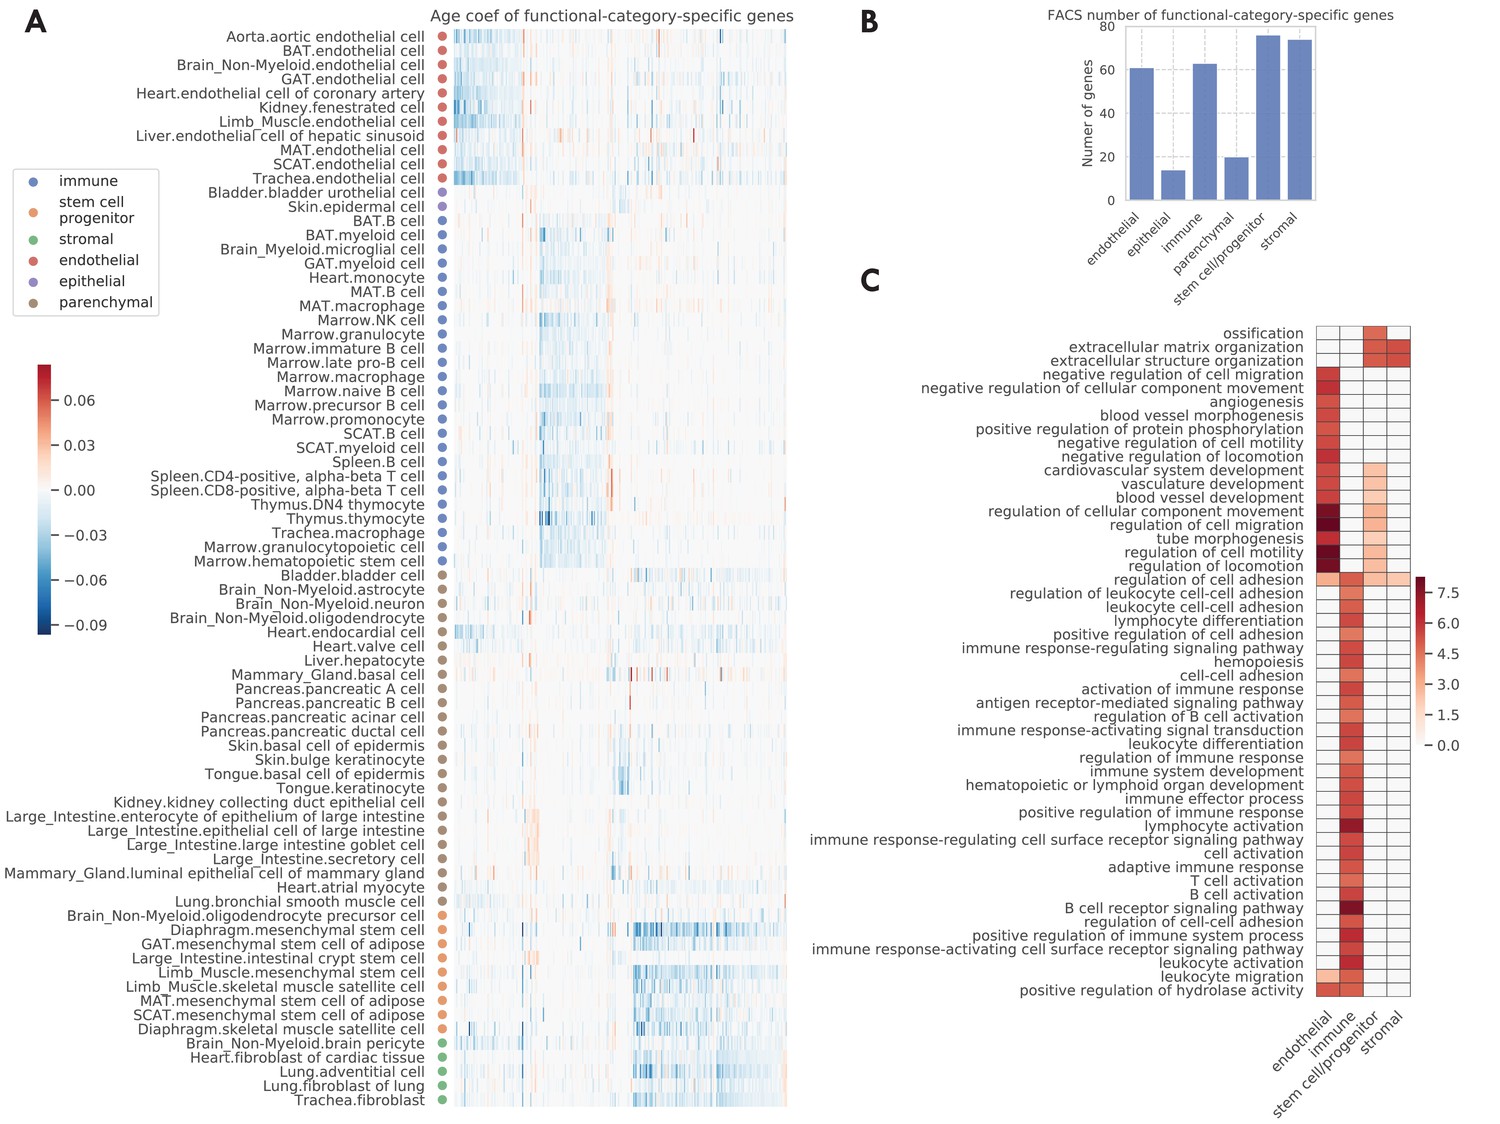
(A) Age coefficients, in the unit of log fold change per month, for functional-category-specific genes. Both genes in the x-axis and tissue-cell types in the y-axis are ordered by functional categories. For example, the upper-left block corresponds to endothelial-specific genes. (B) Number of functional-category-specific genes for each category. (C) GO biological pathways for functional-category-specific genes, with color representing the negative log10 FDR.
-
Figure 4—source data 1
Source data for Figure 4.
- https://cdn.elifesciences.org/articles/62293/elife-62293-fig4-data1-v2.xlsx
Figure 4—figure supplement 1
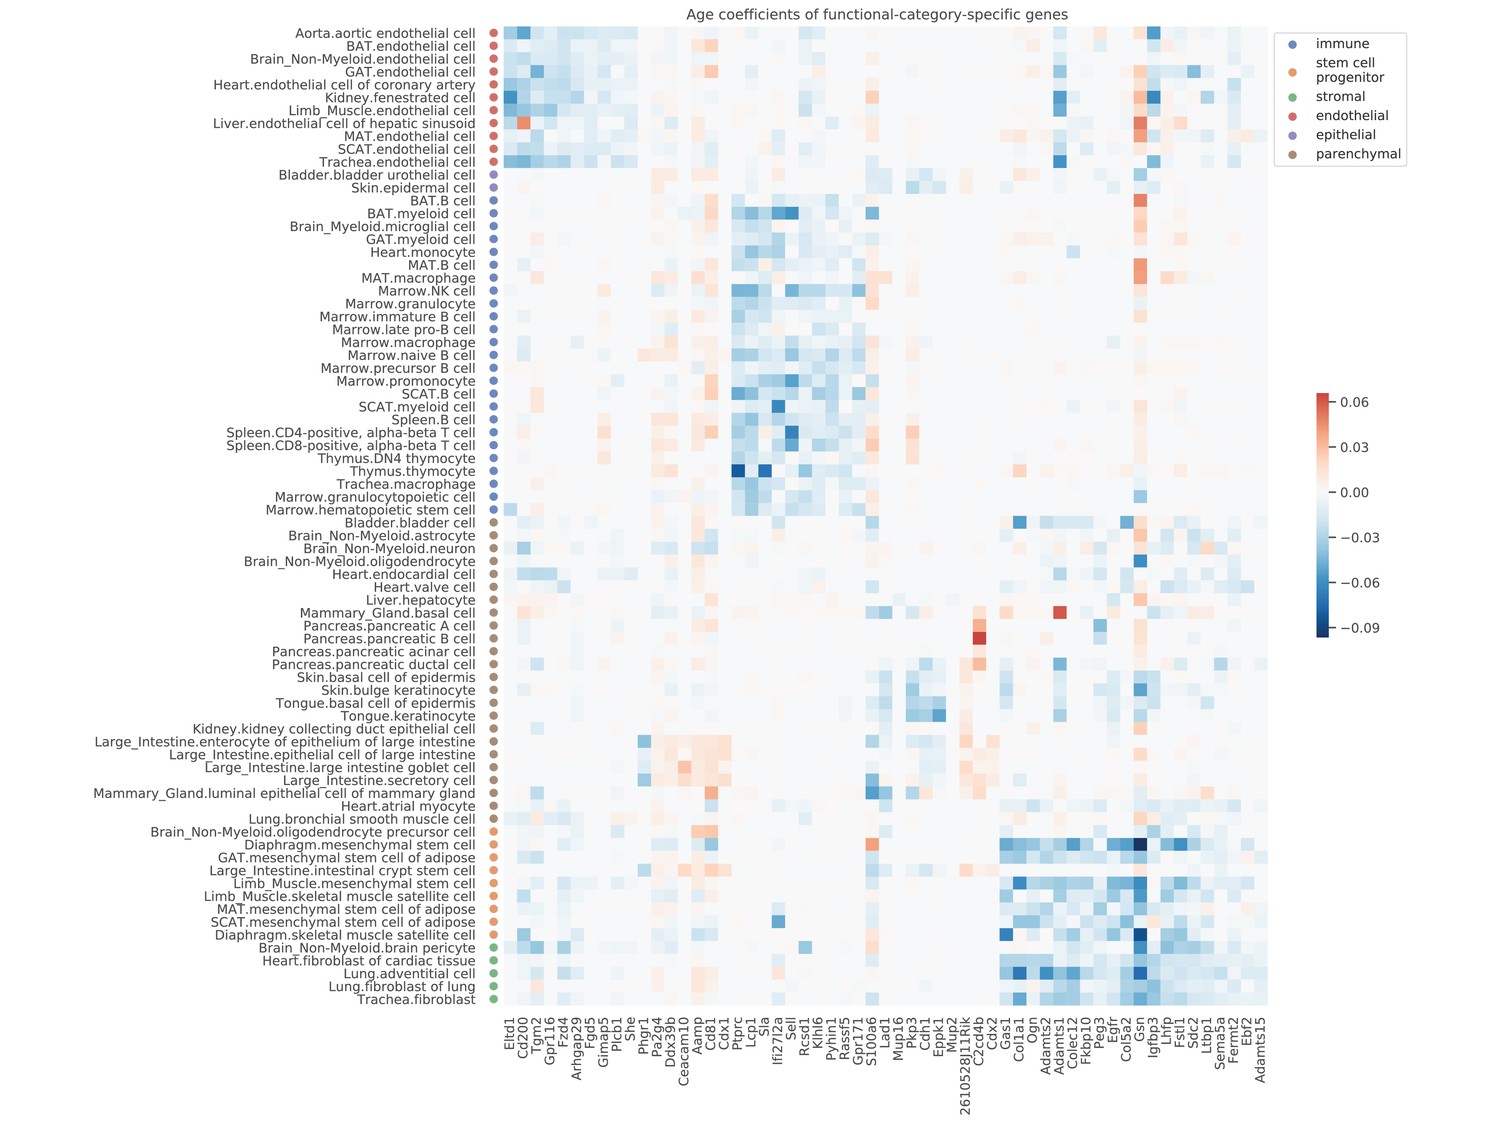
Age coefficients of top functional-category-specific genes.
Top 10 genes with the most significant p-values were selected for each category, ordered from left to right as the endothelial, epithelial, immune, stem/progenitor, stromal, and parenchymal category. For example, the upper-left block corresponds to genes specific to endothelial cells. The color represents the age coefficients, in the unit of log10 fold change per month.
Figure 4—figure supplement 2
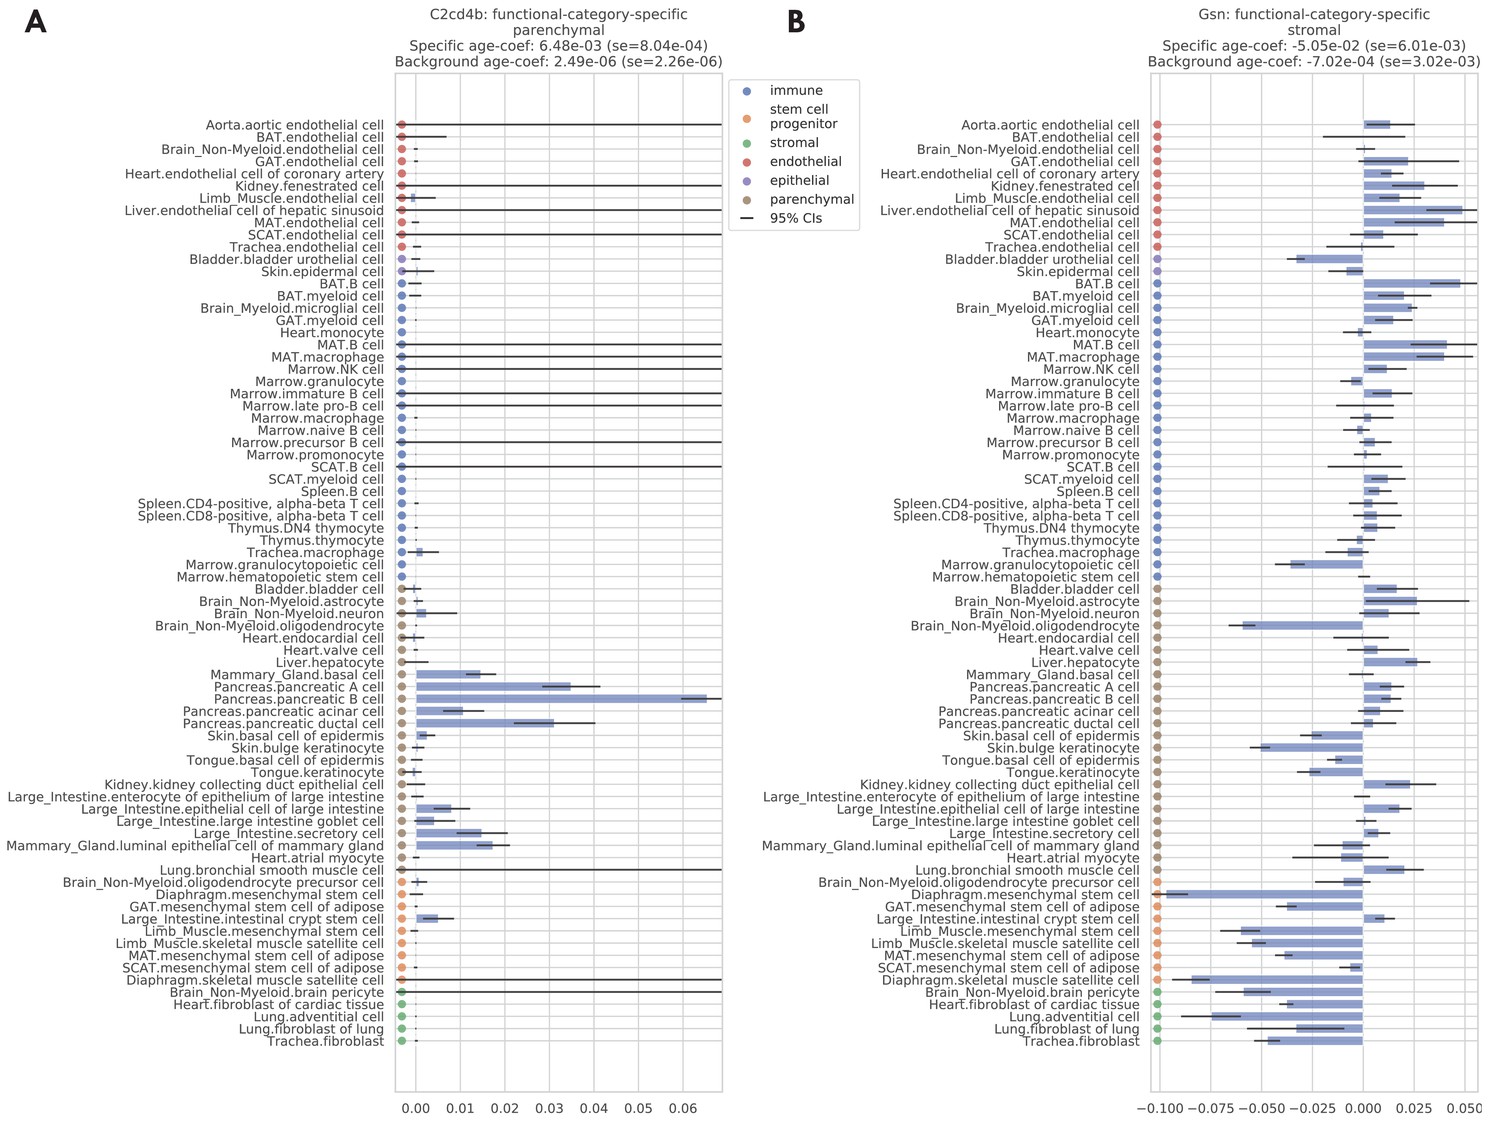
Two examples of functional-category-specific genes.
(A) C2cd4b which is parenchymal-specific. (B) Gsn which is stromal-specific. Estimated age coefficients are provided for each tissue-cell type with 95% confidence intervals. Within-set and outside-set meta age coefficients, estimated via meta-analysis, are provided in the panel titles.
Figure 4—figure supplement 3
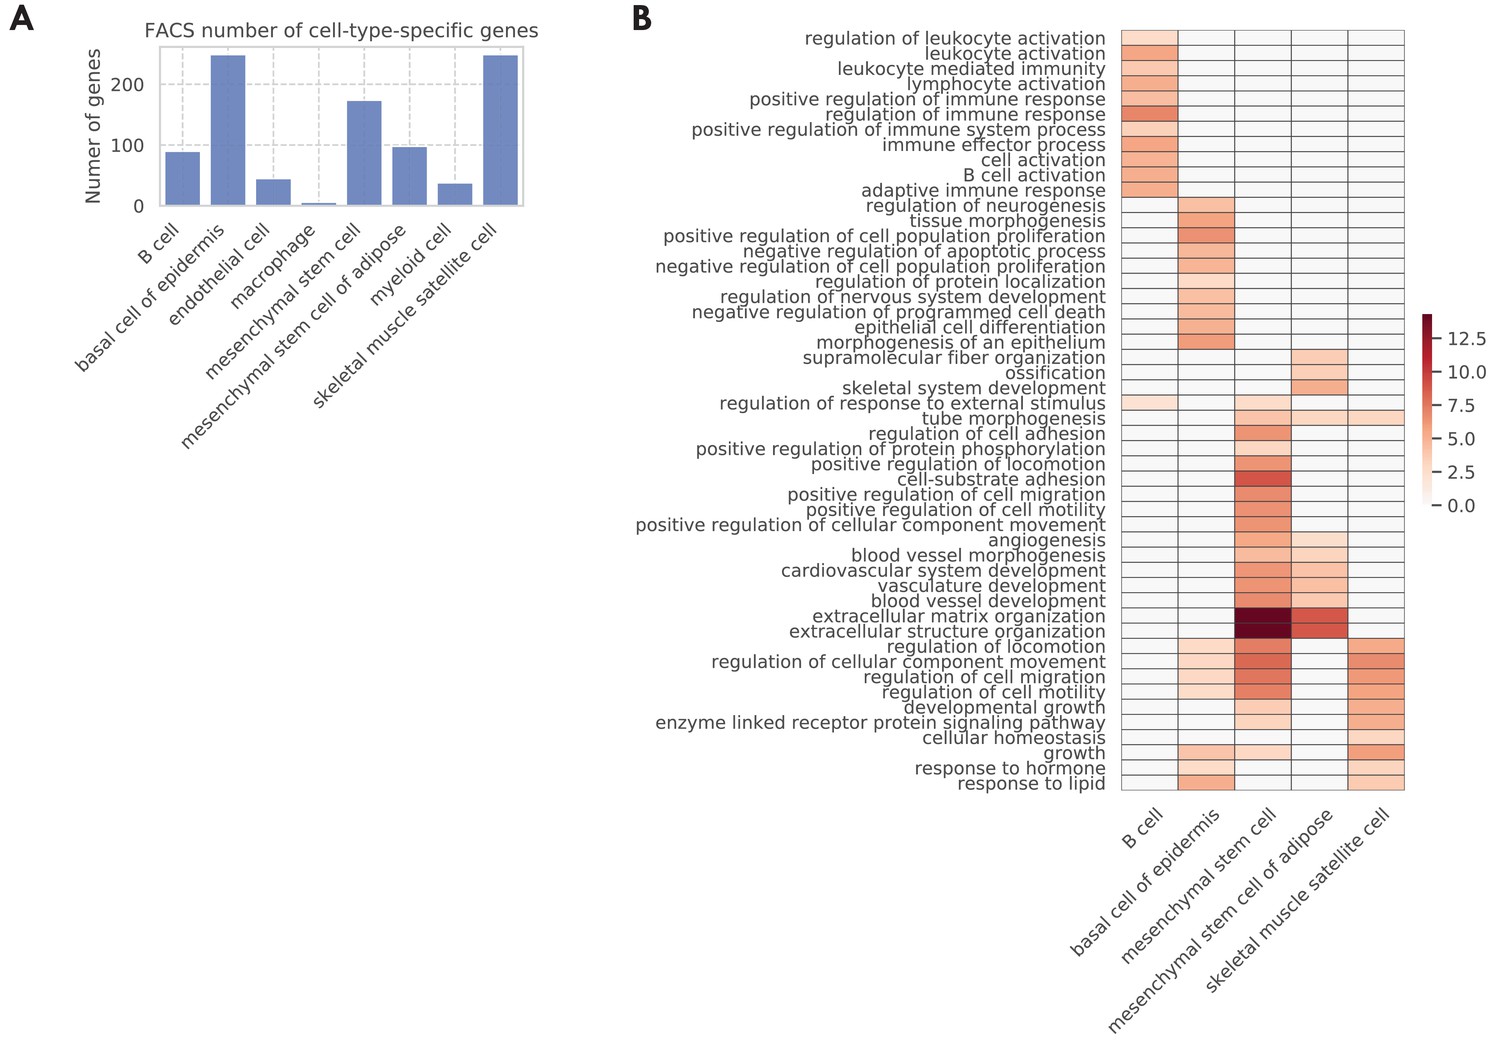
Cell type-specific genes.
(A) Number of cell type-specific genes. (B) GO biological pathways for the cell type-specific genes, with color representing the negative log10 FDR.
Additional files
-
Supplementary file 1
Summary of tissues and cell types for TMS FACS data, TMS droplet data, and the bulk data.
- https://cdn.elifesciences.org/articles/62293/elife-62293-supp1-v2.xlsx
-
Supplementary file 2
Significantly aging-related genes in each tissue-cell type for TMS FACS data and TMS droplet data.
- https://cdn.elifesciences.org/articles/62293/elife-62293-supp2-v2.xlsx
-
Supplementary file 3
Gene sets identified in the study, including GAGs and category-specific genes, for TMS FACS data and TMS droplet data.
- https://cdn.elifesciences.org/articles/62293/elife-62293-supp3-v2.xlsx
-
Transparent reporting form
- https://cdn.elifesciences.org/articles/62293/elife-62293-transrepform-v2.pdf
Download links
A two-part list of links to download the article, or parts of the article, in various formats.
Downloads (link to download the article as PDF)
Open citations (links to open the citations from this article in various online reference manager services)
Cite this article (links to download the citations from this article in formats compatible with various reference manager tools)
Mouse aging cell atlas analysis reveals global and cell type-specific aging signatures
eLife 10:e62293.
https://doi.org/10.7554/eLife.62293


