Modulation of flight and feeding behaviours requires presynaptic IP3Rs in dopaminergic neurons
- National Centre for Biological Sciences, TIFR, India
Figures
Figure 1
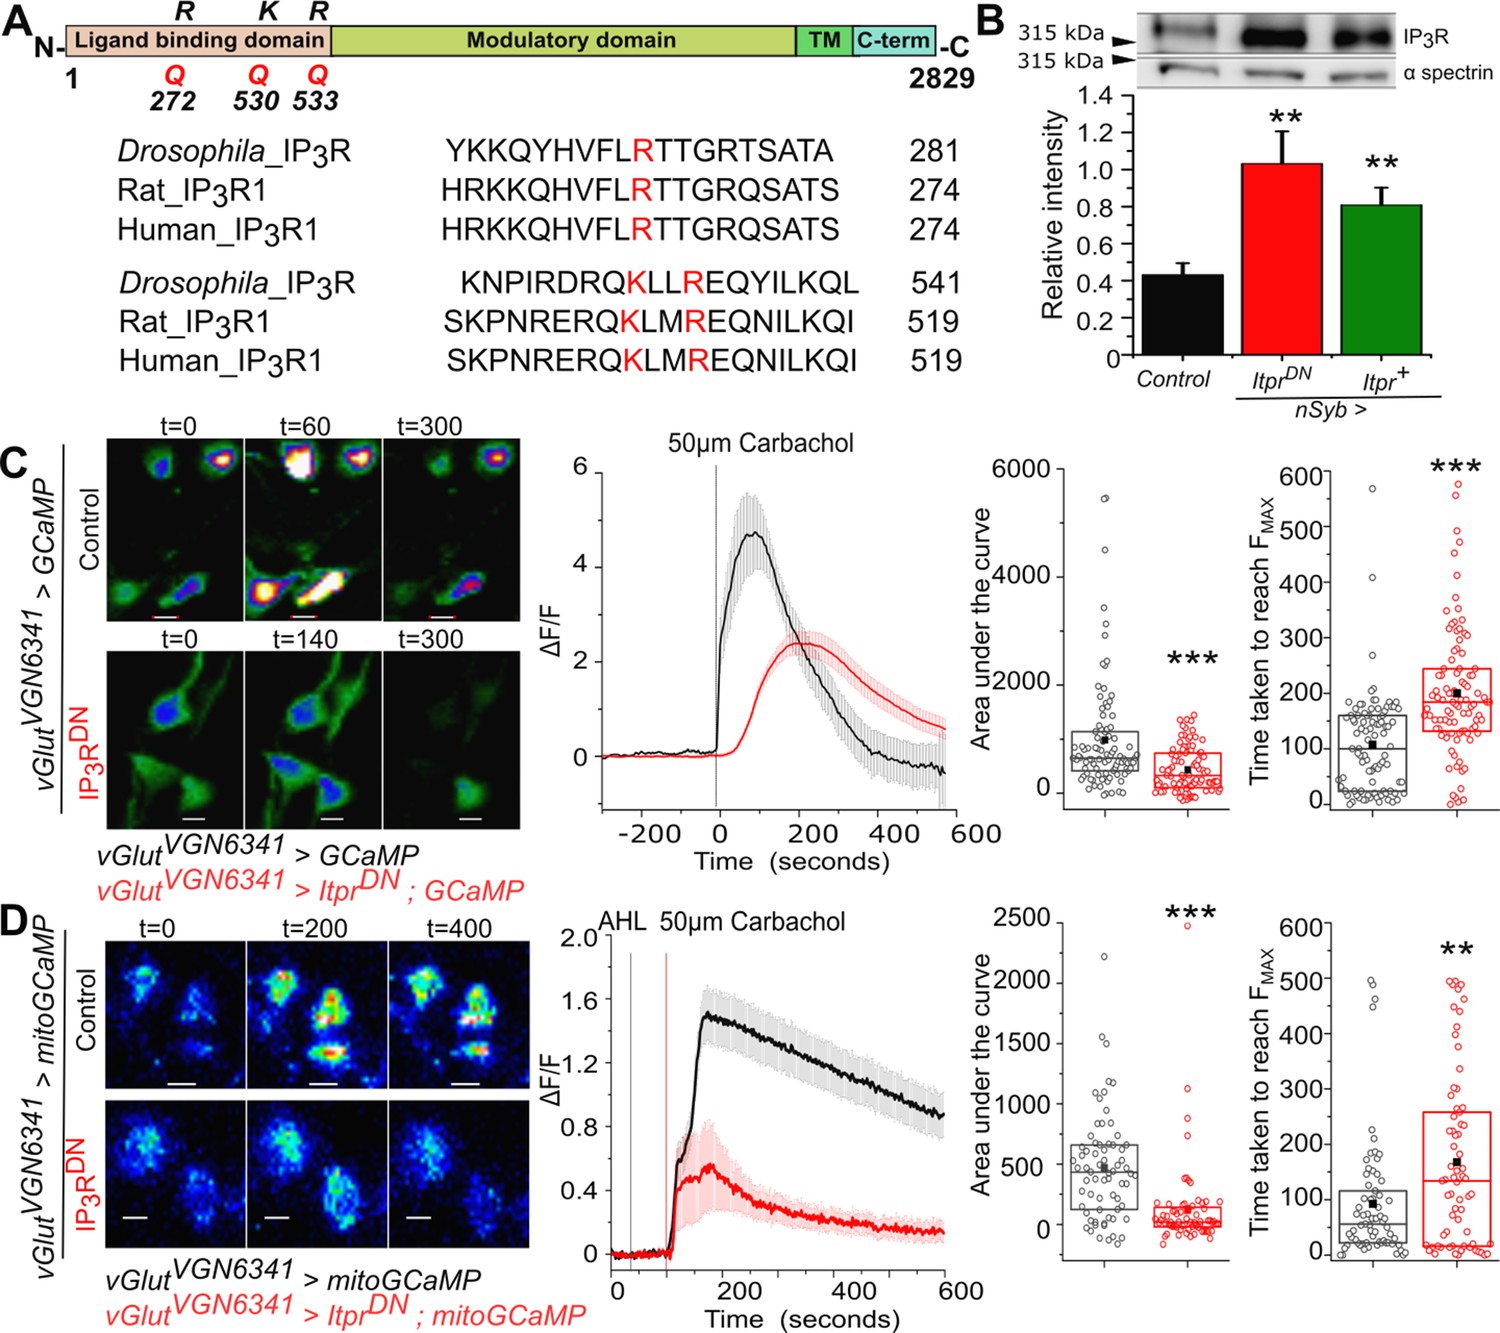
Generation and characterisation of a dominant negative IP3R (IP3RDN).
(A) Domain organisation of the Drosophila IP3R. The Arginine (R) and Lysine (K) residues mutated to Glutamine (Q) to generate a dominant-negative IP3R (IP3RDN) are shown (top). Alignment of the Drosophila IP3R with Rat IP3R1 and Human IP3R1 in the region of the mutated amino acids. All three residues (red) are conserved (below). (B) Significantly higher immuno-reactivity against the IP3R is observed upon pan-neuronal (nsybGAL4) expression of IP3RDN (UASitprDN) and IP3R (UASitpr+) in adult heads. Statistical comparison was made with respect to Canton S as control, n=5, **p< 0.05, t-test. (C) Representative images show changes in cytosolic Ca2+ in larval neurons of the indicated genotypes as judged by GCaMP6m fluorescence at the indicated time intervals after stimulation with Carbachol (Scale bars indicate 5 μm). Warmer colors denote increase in [Ca2+]cyt. Mean traces of normalized GCaMP6m fluorescence in response to Carbachol (4s/frame) in vGlutVGN6341GAL4 marked neurons, with (red) and without (black) IP3RDN (ΔF/F ± SEM) (middle panel). Area under the curve (right) was quantified from 0 - 420s from the traces in the middle. Time taken to reach peak fluorescence (FMAX) for individual cells (far right). vGlutVGN6341GAL4 > UAS GCaMP N = 6 brains, 92 cells; vGlutVGN6341GAL4 > UAS ItprDN; UAS GCaMP N = 6 brains, 95 cells. ***p< 0.005 (Two tailed Mann-Whitney U test). (D) Representative images show changes in mitochondrial Ca2+ in larval neurons of the indicated genotypes as judged by mitoGCaMP6m fluorescence at the indicated time intervals after stimulation with Carbachol (Scale bars indicate 5 μm). Warmer colors denote increase in [Ca2+]cyt. Mean traces of normalized mitoGCaMP6m fluorescence in response to Carbachol (2s/frame) in vGlutVGN6341GAL4 marked neurons, with (red) and without (black) IP3RDN (ΔF/F ± SEM) (middle panel). Area under the curve (right) was quantified from 100 to 400s from the traces in the middle. Time taken to reach peak fluorescence (FMAX) for individual cells (far right). vGlutVGN6341GAL4 > UAS mitoGCaMP N = 5 brains, 69 cells; vGlutVGN6341GAL4 > UAS ItprDN; UAS mitoGCaMP N = 5 brains, 68 cells. ***p< 0.005, **p< 0.05 (Two tailed Mann-Whitney U test).
-
Figure 1—source data 1
Western Blots for IP3R upon pan-neuronal expression of IP3RDN and IP3R WT in adult heads.
- https://cdn.elifesciences.org/articles/62297/elife-62297-fig1-data1-v1.pptx
Figure 2 with 2 supplements
The IP3R is required in central dopaminergic neurons for maintaining long flight bouts.
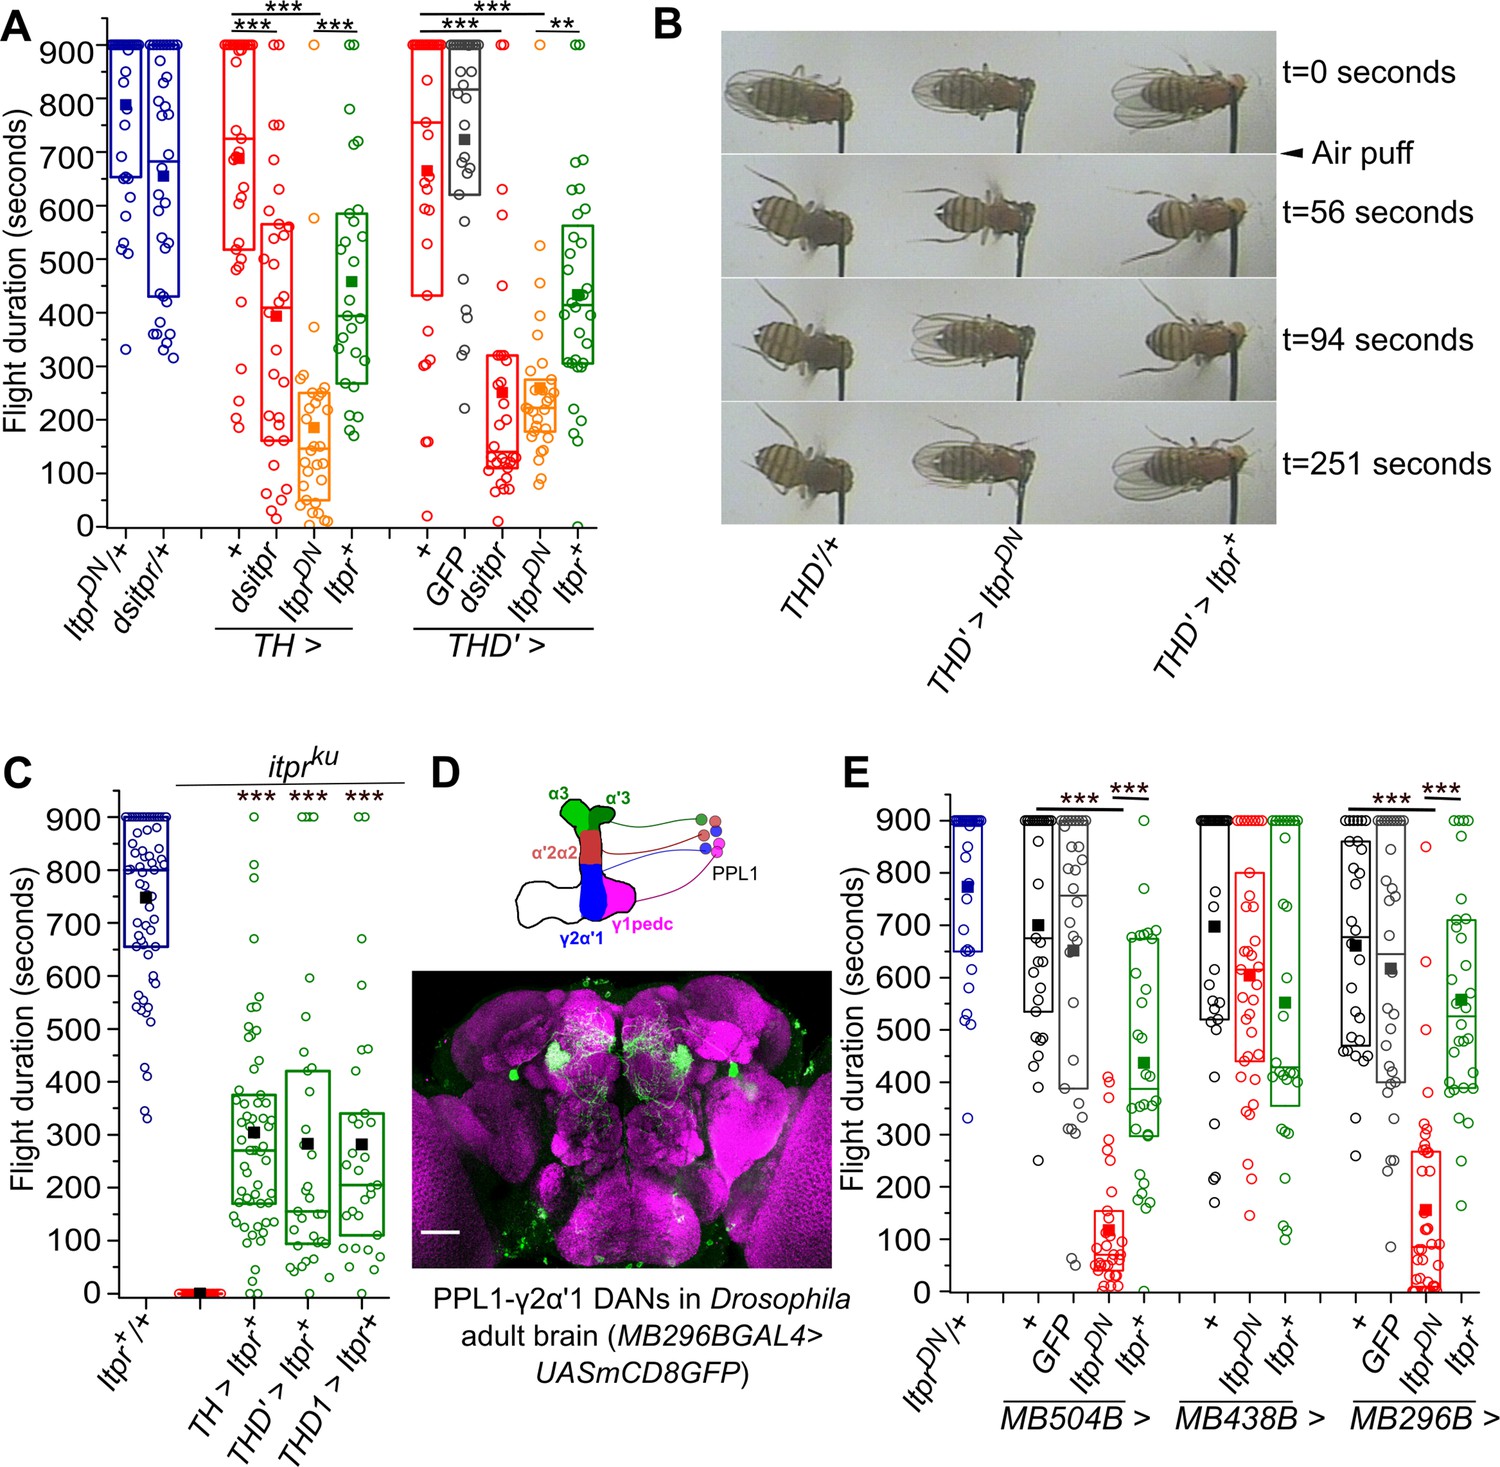
(A) Flight deficits observed in flies expressing IP3R RNAi (dsitpr), IP3RDN (ItprDN) and IP3RWT (Itpr+) across all dopaminergic and TH-expressing cells (TH) as well as a subset of dopaminergic neurons (THD’). Flight times of flies of the indicated genotypes are represented as box plots where the box represents 25-75% of the distribution, each circle is the flight time of an individual fly, the small filled square represents mean flight time and the horizontal line is the median. Flight was tested in flies with GFP in THD’ marked neurons as an over-expression control. (B) Snapshots from flight videos of air puff stimulated flight bouts in the indicated genotypes at the specified time points. (C) Box plots (as in A above) represent flight bout durations of control and itpr mutant flies (itprku). Expression of a wild-type cDNA for the IP3R (UAS Itpr+) with indicated dopaminergic GAL4s rescued flight to a significant extent. (D) A schematic of PPL1 DANs projecting to different lobes of one half of the mushroom body (top); An adult brain with GFP expression (green) driven by MB296BGAL4. GFP expression is restricted to PPL1-γ2α′1 neurons and the γ2α′1 MB lobe. The brain neuropil is immunostained with anti Brp (purple). Scale bar = 50 μm. (E) Box plots (as in A) of flight bout durations in flies expressing IP3RDN (ItprDN) and IP3RWT (Itpr+) in the indicated PPL1 DAN splitGAL4 strains, not significant at p < 0.05 by Mann-Whitney U test (for C) or Kruskal-Wallis test (for A and E). Comparisons for significance were with the control values except where marked by a horizontal line. Comparisons for significance were with itpr mutants in C.
-
Figure 2—source data 1
Flight duration for flies upon perturbing IP3R signaling in dopaminergic neurons.
- https://cdn.elifesciences.org/articles/62297/elife-62297-fig2-data1-v1.xlsx
-
Figure 2—source data 2
Flight duration of itpr mutant flies after overexpressing a wild type itpr transgene in various dopaminergic subs.
- https://cdn.elifesciences.org/articles/62297/elife-62297-fig2-data2-v1.xlsx
-
Figure 2—source data 3
Flight duration of flies upon perturbing IP3R signaling in PPL1 neurons.
- https://cdn.elifesciences.org/articles/62297/elife-62297-fig2-data3-v1.xlsx
-
Figure 2—source data 4
Flight duration of flies upon perturbing IP3R signaling pan neuronally.
- https://cdn.elifesciences.org/articles/62297/elife-62297-fig2-data4-v1.xlsx
-
Figure 2—source data 5
Flight duration of itpr mutant flies after overexpressing a wild type itpr transgene in various neuronal subsets in a short flight assay.
- https://cdn.elifesciences.org/articles/62297/elife-62297-fig2-data5-v1.xlsx
-
Figure 2—source data 6
Flight duration of flies upon perturbing IP3R signaling in subsets of PPL1 .neurons.
- https://cdn.elifesciences.org/articles/62297/elife-62297-fig2-data6-v1.xlsx
Figure 2—figure supplement 1
Perturbation of IP3R signaling in neurons affects the duration of flight bouts.
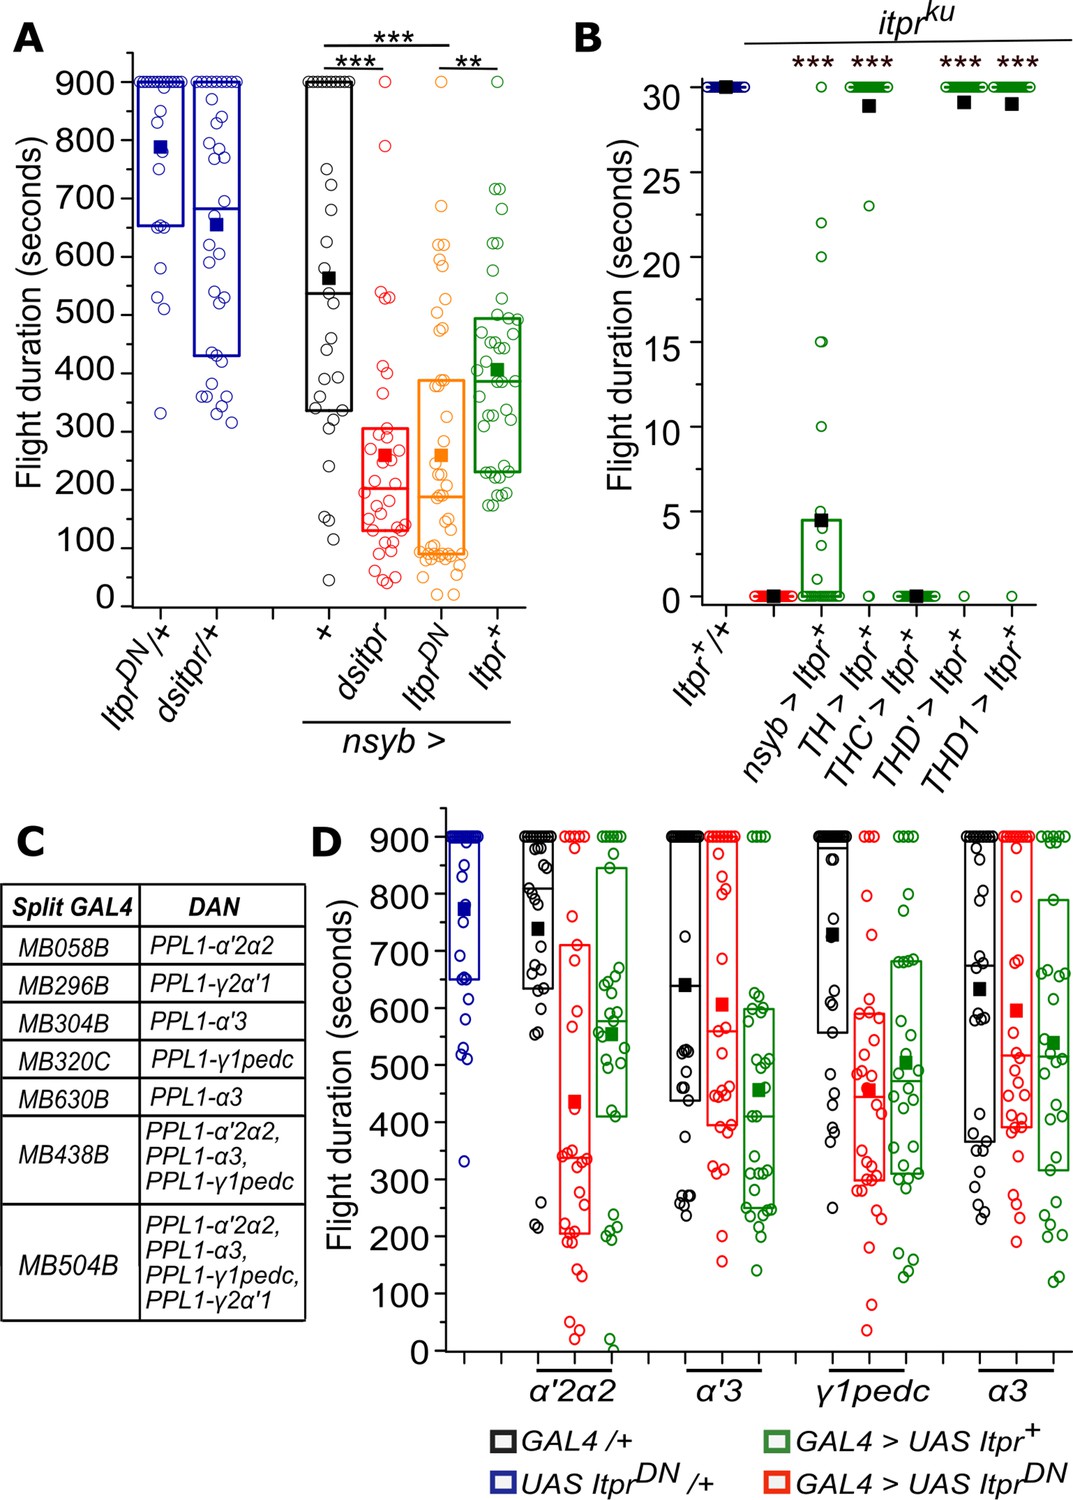
(A) Box plots represent flight deficits observed upon perturbing IP3R signaling after expressing IP3R RNAi (dsitpr), IP3RDN (ItprDN) and IP3RWT (Itpr+) across all classes of neurons with nsybGAL4. (B) Box plots represents flight bout durations of itpr mutant flies measured for 30 s, upon expression of UAS Itpr+ with the indicated GAL4s. (C) SplitGAL4 strains used to label subsets of PPL1 DANs. (D) Box plots represent flight bout durations of flies upon perturbing IP3R signaling after expressing IP3RDN (ItprDN) and IP3RWT (Itpr+) in the indicated PPL1 DAN expressing strains. Box plot symbols are as described in Materials and methods and Figure 2A; n≥30, ***p< 0.005 **p< 0.05, n.s., not significant at p <0.05 Mann-Whitney U test (for B) or Kruskal-Wallis test (for A and D). All comparisons for significance were with the control values except where marked by a horizontal line. Comparisons for significance were with itpr mutants in B.
Figure 2—video 1
Flight defect in THD’> ItprDN (Right) as compared to control (THD’/+, Left).
Figure 3 with 1 supplement
Adult flight phenotypes arise from late pupal expression of the IP3R and mAChR.
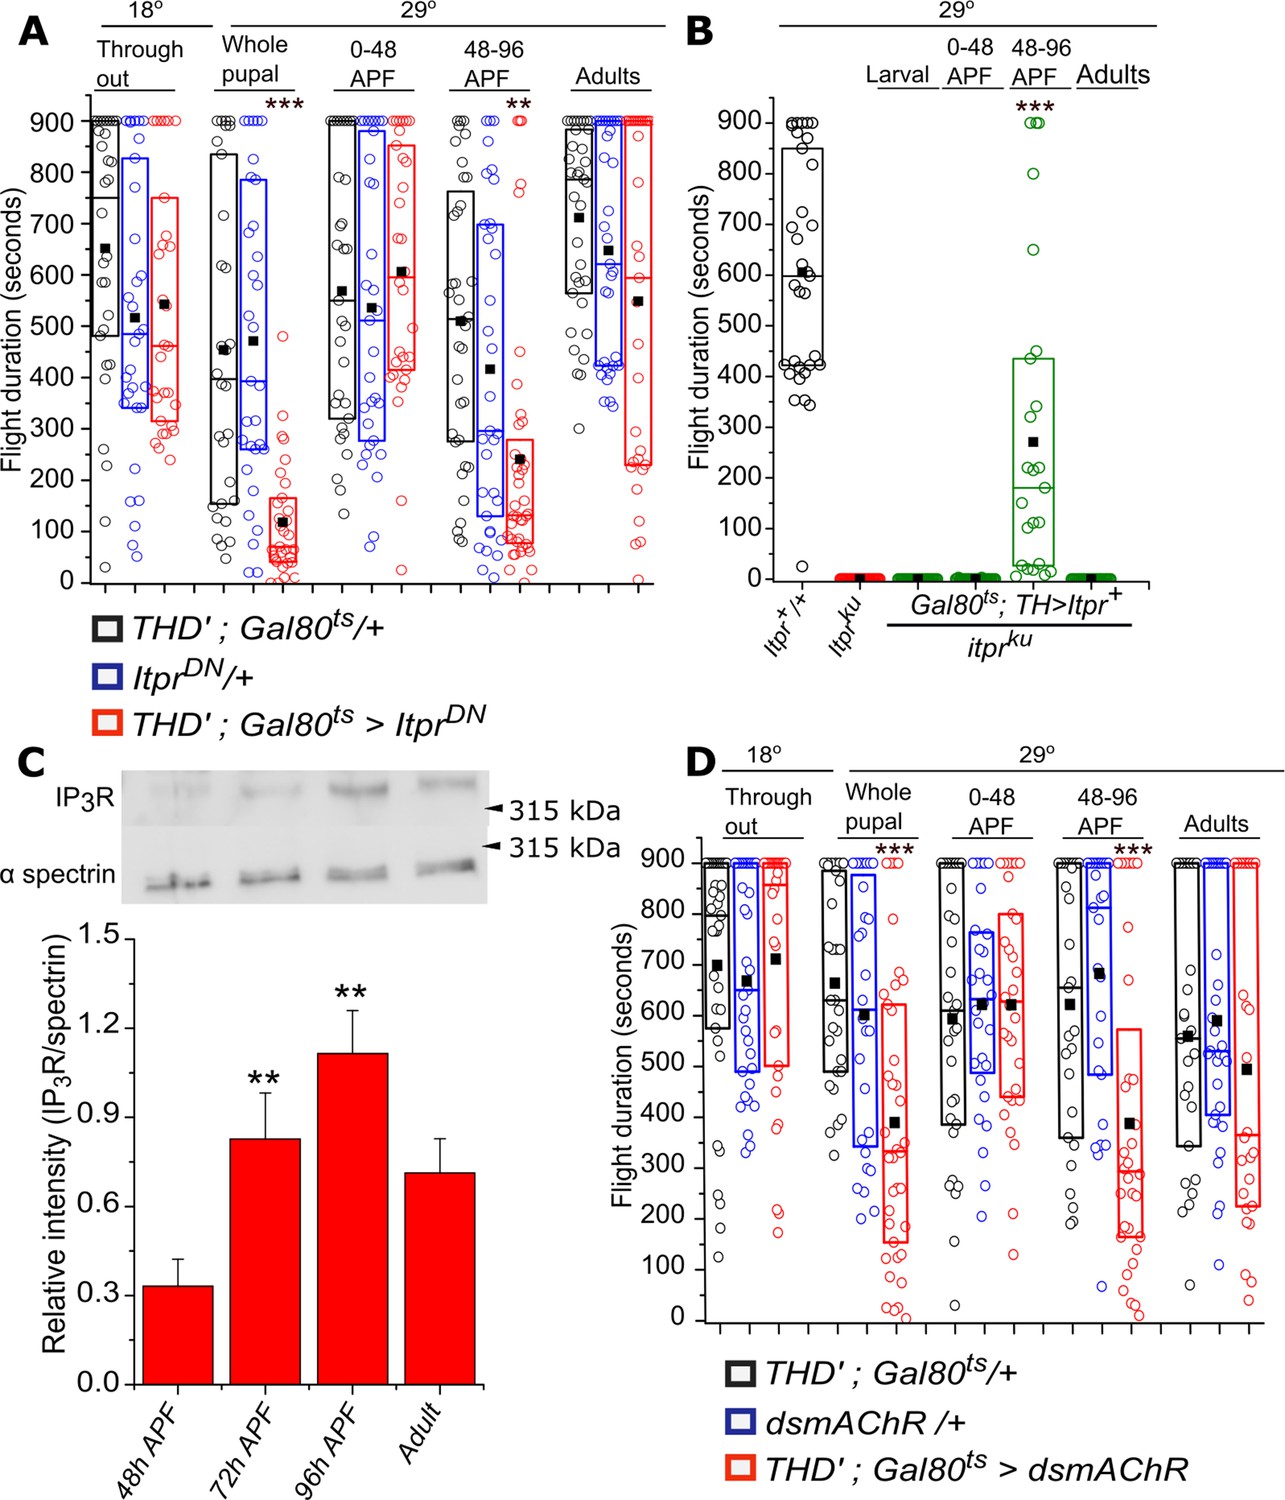
(A) Box plots of flight bout durations in adults after temporal expression of IP3RDN in THD’ neurons (THD’; TubGAL80ts > ItprDN) by transferring them to 29°C at the indicated stages of development. For adult expression, flies were transferred to 29°C immediately after eclosion and tested for flight after 3 days. (B) Box plots of flight bout durations after expressing the IP3R (Itpr+) in dopaminergic cells of itpr mutants at the indicated stages of development. For stage specific expression a TH; TubGAL80ts strain was used and the progeny transferred to 29°C at appropriate time developmental points. (C) Levels of the IP3R increase in late pupae between 72-96 hrs APF and plateau between 96hrs APF and adults (3 days). A representative western blot from lysates of dissected central nervous systems of Canton S probed with anti-IP3R and anti-spectrin is shown (top). Three independent lysates and blots were quantified (below). **p< 0.05, t-test. (D) Box plots with flight bout durations of adult flies after knockdown of the Muscarinic acetylcholine receptor (mAChR) in THD’ neurons (THD’;TubGAL80ts > dsmAChR) at the indicated stages of pupal development and in adults.Box plot symbols are as described in methods, n≥30, ***p< 0.005 *p< 0.05, n.s., not significant by Kruskal-Wallis test (for A and D) and n≥23, ***p< 0.005, at p < 0.05 by Mann-Whitney U test (for B). All comparisons for significance were with the control values for A and C, with itpr mutants for B.
-
Figure 3—source data 1
Flight duration of flies upon overexpression of IP3RDN at different stages of development.
- https://cdn.elifesciences.org/articles/62297/elife-62297-fig3-data1-v1.xlsx
-
Figure 3—source data 2
Flight duration of itpr mutant flies after overexpressing a wild type itpr transgene at different stages of development.
- https://cdn.elifesciences.org/articles/62297/elife-62297-fig3-data2-v1.xlsx
-
Figure 3—source data 3
Western blots of IP3R.
- https://cdn.elifesciences.org/articles/62297/elife-62297-fig3-data3-v1.pptx
-
Figure 3—source data 4
Flight duration of flies upon knockdown of mAChR in dopaminergic neurons at different stages of development.
- https://cdn.elifesciences.org/articles/62297/elife-62297-fig3-data4-v1.xlsx
-
Figure 3—source data 5
Flight duration of flies upon knockdown of mAChR in PPL1-γ2α′1 neurons.
- https://cdn.elifesciences.org/articles/62297/elife-62297-fig3-data5-v1.xlsx
Figure 3—figure supplement 1
Expression of IP3RDN and mAChR RNAi in THD’ and MB296B marked neurons.
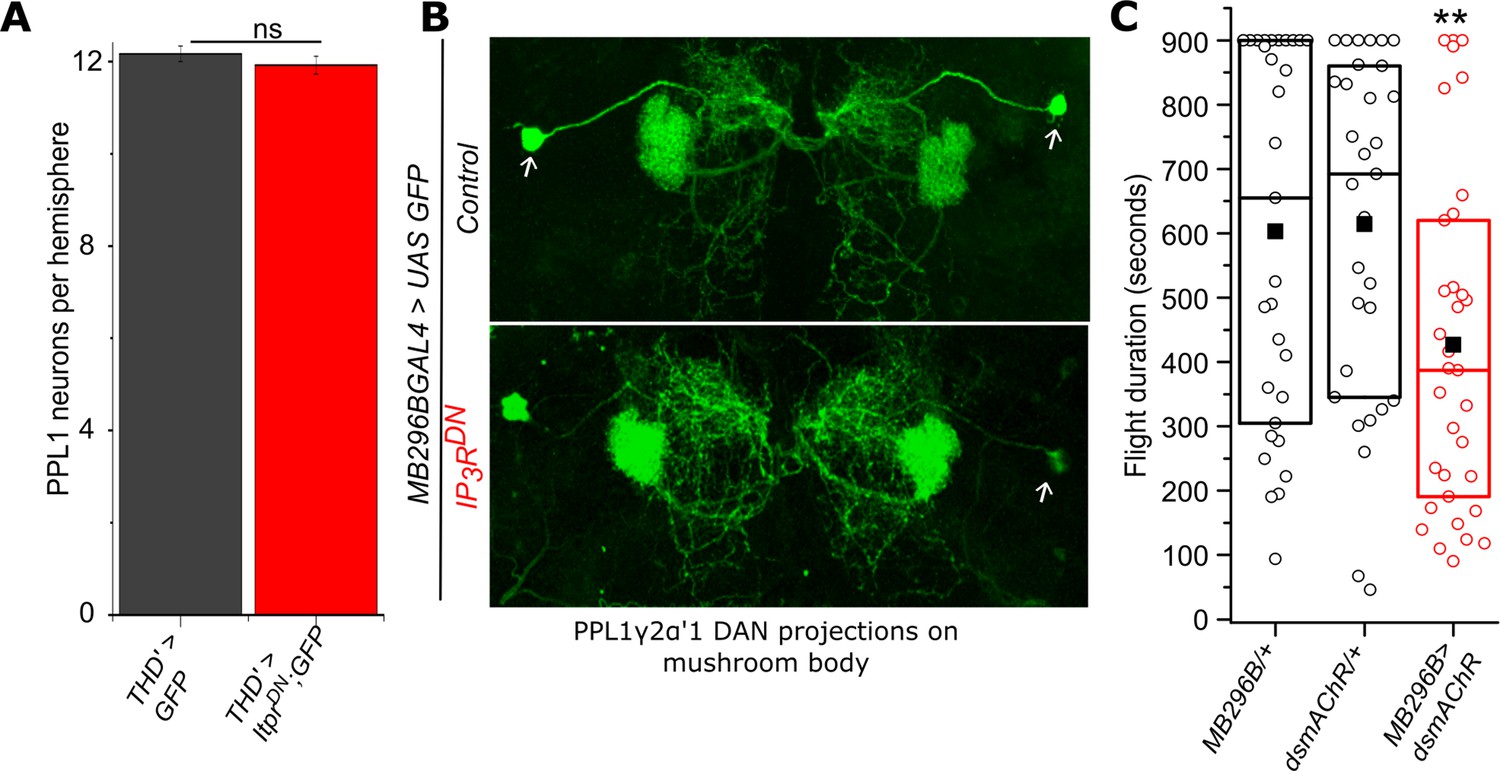
(A) Expression of IP3RDN does not change the number of PPL1 neurons. Cells were quantified from both hemi-segments of N=6 brains. (B) PPL1- γ2α′1 neurons marked by MB296BGAL4 are shown (white arrows) with their pattern of innervation to the MB neuropil as visualized using membrane-localized GFP. Expression of IP3RDN (lower panel) did not affect the pattern of MB innervation. (C) Box plots of flight bout durations in control flies and flies with knockdown of mAChR in MB296B cells. n≥ 30, **p< 0.05 by Kruskal-Wallis test.
Figure 4 with 3 supplements
Synaptic vesicle recycling and IP3R function are required in PPL1 dopaminergic neurons for adult flight and feeding.
(A) Quantification of flight deficits observed upon blocking synaptic vesicle recycling by expression of a temperature-sensitive Dynamin mutant, Shibirets in THD’ and MB296B cells. n≥30, ***p< 0.005, **p< 0.05 by Mann Whitney U test. (B) Food seeking by hungry flies is significantly diminished upon expression of IP3RDN in PPL1- γ2α′1 DANs (MB296B). Snapshots at the indicated time points from videos of starved male flies of the indicated genotype seeking a drop of yeast placed in the centre of a petriplate. (C) Quantification of food seeking behaviour in starved males of the indicated genotypes. Expression of IP3RDN in THD’ and MB296B cells reduced food seeking behaviour to a significant extent (red). Expression of GFP did not affect the behaviour (green). n≥30, ***p< 0.005 by Kruskal-Wallis test. (D) Quantification of food-seeking behaviour in starved males of the indicated genotypes. Knockdown of mAChR in THD’ and MB296B cells reduced food-seeking behaviour to a significant extent (red), n≥30, ***p< 0.005 at by Kruskal-Wallis test.
-
Figure 4—source data 1
Flight duration of flies upon expression of Shibirets in dopaminergic neurons at different developmental stages.
- https://cdn.elifesciences.org/articles/62297/elife-62297-fig4-data1-v1.xlsx
-
Figure 4—source data 2
Food seeking index of starved male flies after overexpression of IP3RDN in dopaminergic neurons.
- https://cdn.elifesciences.org/articles/62297/elife-62297-fig4-data2-v1.xlsx
-
Figure 4—source data 3
Food seeking index of starved male flies upon knockdown of mAChR in dopaminergic neurons.
- https://cdn.elifesciences.org/articles/62297/elife-62297-fig4-data3-v1.xlsx
-
Figure 4—source data 4
Flight duration of flies upon expression of Shibirets in dopaminergic neurons, grown at 25°C.
- https://cdn.elifesciences.org/articles/62297/elife-62297-fig4-data4-v1.xlsx
-
Figure 4—source data 5
Food seeking index of fed male flies after overexpression of IP3RDN in dopaminergic neurons.
- https://cdn.elifesciences.org/articles/62297/elife-62297-fig4-data5-v1.xlsx
-
Figure 4—source data 6
Food seeking index of fed male flies upon knockdown of mAChR in dopaminergic neurons.
- https://cdn.elifesciences.org/articles/62297/elife-62297-fig4-data6-v1.xlsx
Figure 4—figure supplement 1
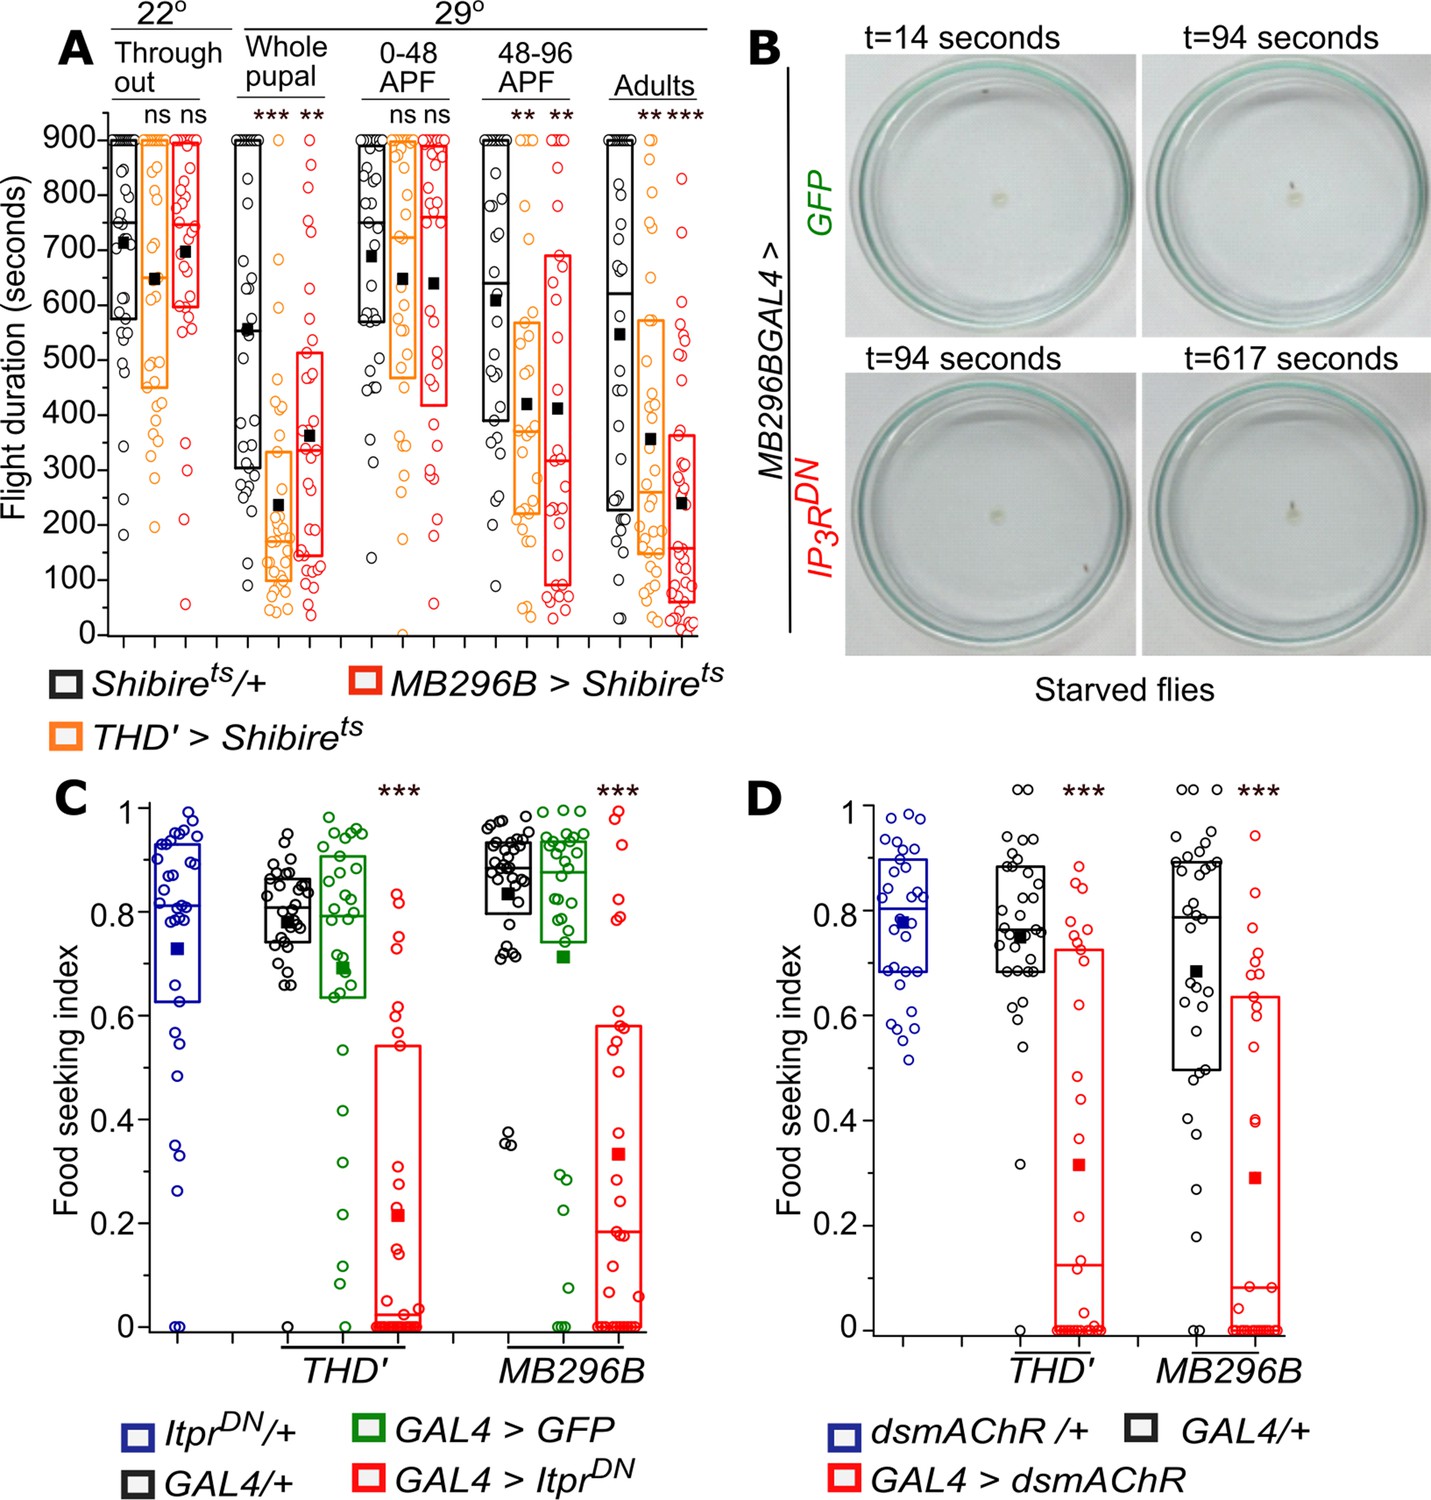
Flight is unaffected and food seeking behaviour is normal in control genotypes and conditions.
(A) Quantification of flight bouts upon expressing temperature-sensitive dynamin mutant Shibirets in THD’ and MB296B cells when flies were grown at the permissive temperature of 25°C. n≥30, n.s., not significant by Kruskal-Wallis test. (B) Food seeking behaviour is absent in fed flies including the indicated control strains and upon expression of IP3RDN in THD’ and MB296B cells (red). n≥30, n.s., not significant by Kruskal-Wallis test. (C) Food-seeking behaviour is absent in fed flies including the indicated control strains and upon knockdown of mAChR in THD’ and MB296B cells (red). n≥30, n.s., not significant by Kruskal-Wallis test.
Figure 4—video 1
Food-seeking behaviour in a control fly (MB296BGAL4/+).
Figure 4—video 2
Food-seeking behaviour upon expression of IP3RDN in MB296B cells.
Figure 5 with 1 supplement
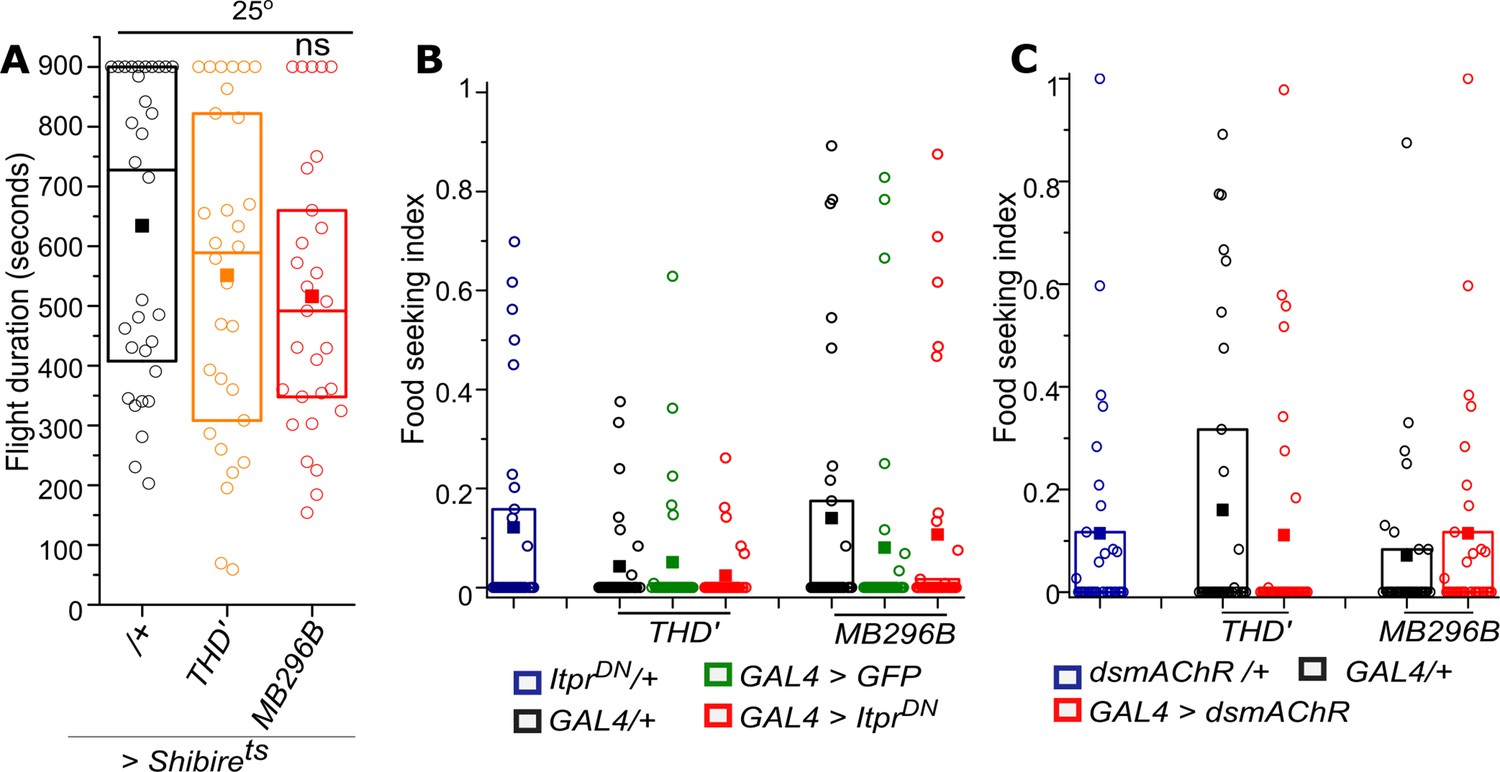
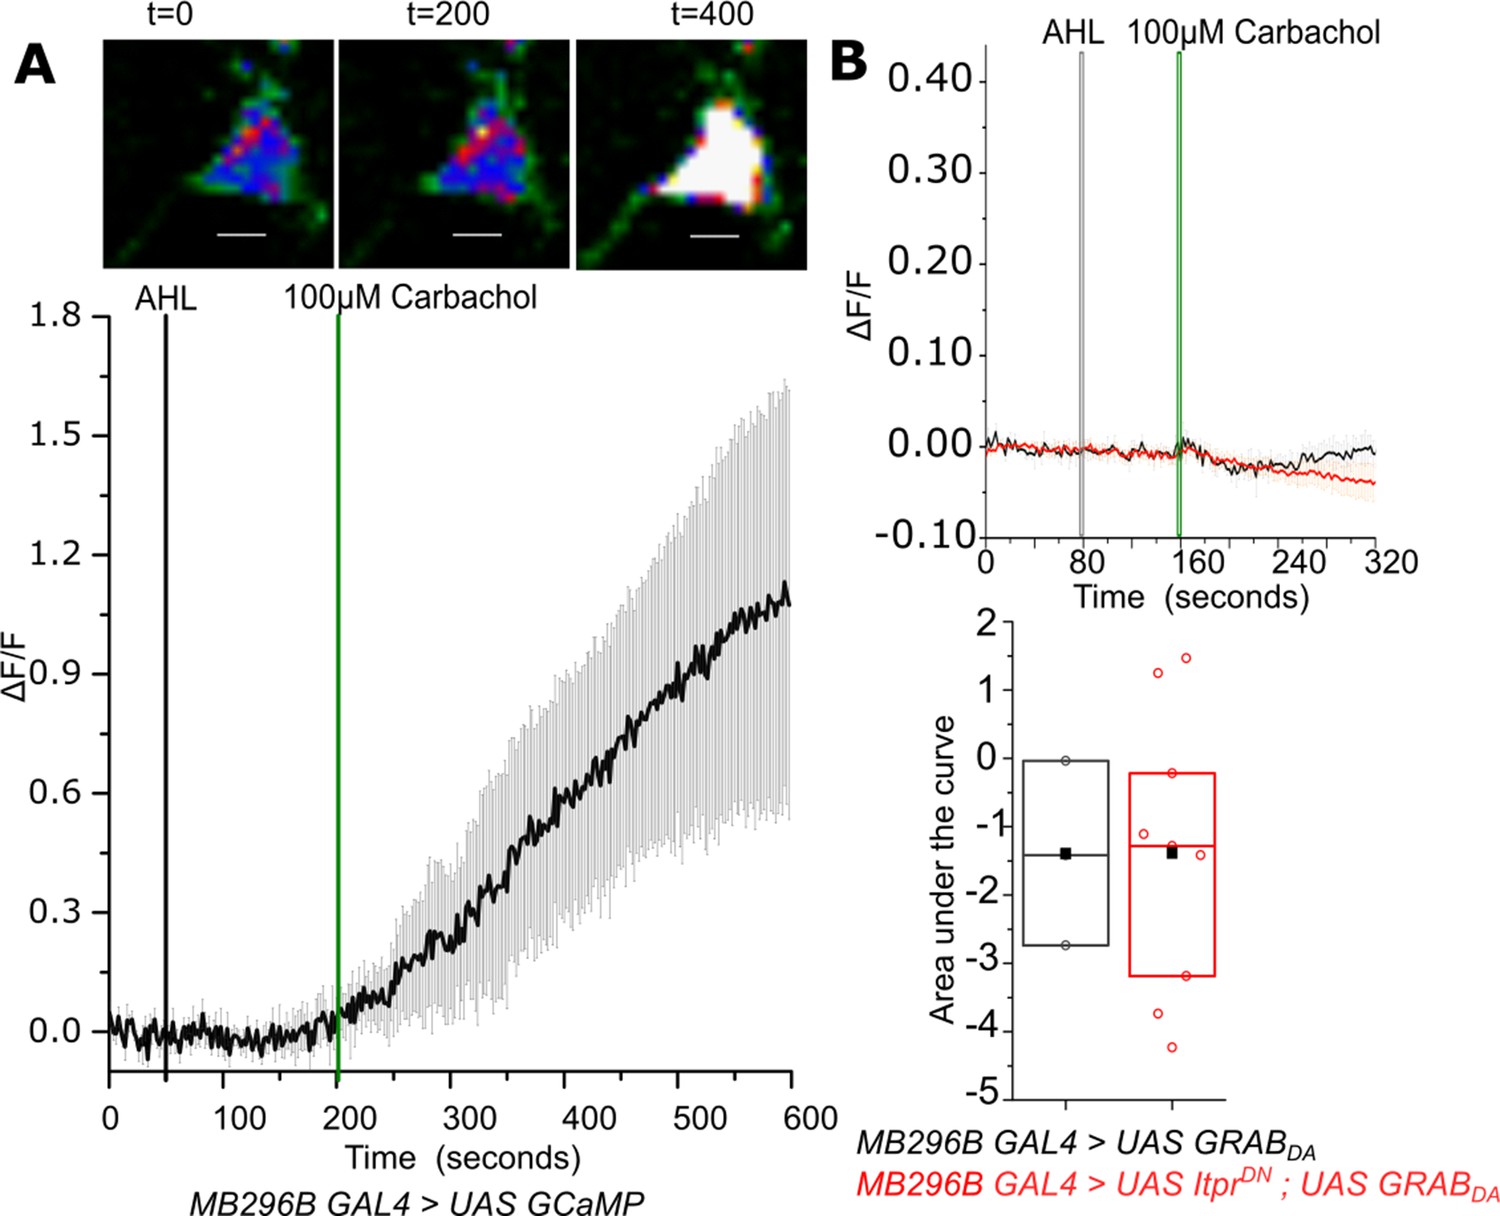
Carbachol-stimulated Dopamine release at the axonal terminals of PPL1-γ2α′1 neurons is attenuated by expression of IP3RDN.
(A) Representative images of a presynaptic marker synaptotagmin GFP (syt.eGFP) in lobes of the Mushroom body (top). Quantification of syt.eGFP fluorescence normalized to mRFP is shown below in the indicated MB regions marked by THD’GAL4. N = 6 brains, n.s. not significant at p < 0.05 by two tailed Mann-Whitney U test. Scale bars indicate 50 μm (B) Carbachol stimulated dopamine release at PPL1- γ2α′1 termini visualized by changes in GRABDA fluorescence in a representative mushroom body lobe from brains of the indicated genotypes. Images were acquired at 2s per frame. Brighter fluorescence denotes increase in Dopamine. Scale bars = 10 μm (C) Average traces (± SEM) of normalized GRABDA fluorescence responses (ΔF/F) from the right lobe of each brain upon addition of Carbachol (Green line) (panel on the left). Images were acquired at 2s per frame; Quantification of area under the curve was from the point of stimulation at 160s and up to 250 s. Box plots and symbols are as described in Figure 2A. MB296B GAL4 > UAS GRABDA N = 10 cells from 10 brains; MB296B GAL4 > UAS ItprDN; UAS GRABDA N = 8 cells from 8 brains. **p< 0.05, Mann-Whitney U test.
-
Figure 5—source data 1
GRABDA fluorescence (ΔF/F) traces from axonal termini of MB296BGAL4 marked DANs in individual brains (Black -MB296B GAL4>UAS GRABDA; Red-MB296B GAL4>UAS ItprDN; UAS GRABDA).
- https://cdn.elifesciences.org/articles/62297/elife-62297-fig5-data1-v1.pptx
Figure 5—figure supplement 1
Carbachol evoked Ca2+ responses in the soma of PPL1- γ2α′1 DANs marked by MB296BGAL4.
(A) Carbachol stimulated change in GCaMP6m fluorescence (ΔF/F) in PPL1- γ2α′1 cells. Representative images of GCaMP6m fluorescence at the indicated time points (top panel). Warmer colors denote increase in [Ca2+]. Average response (± SEM) of normalized changes in GCaMP6m fluorescence (ΔF/F) in MB296BGAL4 marked PPL1 cells upon addition of Carbachol from N=7 cells from 7 brains. Images were acquired at 2s per frame. (B) Average traces (± SEM) of normalized changes in GRABDA fluorescence (ΔF/F) from axonal termini of MB296BGAL4 marked DANs that responded below the arbitrary threshold (ΔF/F=0.05) upon addition of Carbachol (Green line). Images were acquired at 2s per frame (Top panel). Quantification of area under the curve (AUC) from the point of stimulation 160s up to 250s. Boxplots and symbols are as described in Figure 2A. MB296B GAL4 > UAS GRABDA N = 3 brains; MB296B GAL4 > UAS ItprDN; UAS GRABDA N = 9 brains, *p< 0.05, Mann-Whitney U test (lower panel).
Figure 6 with 1 supplement
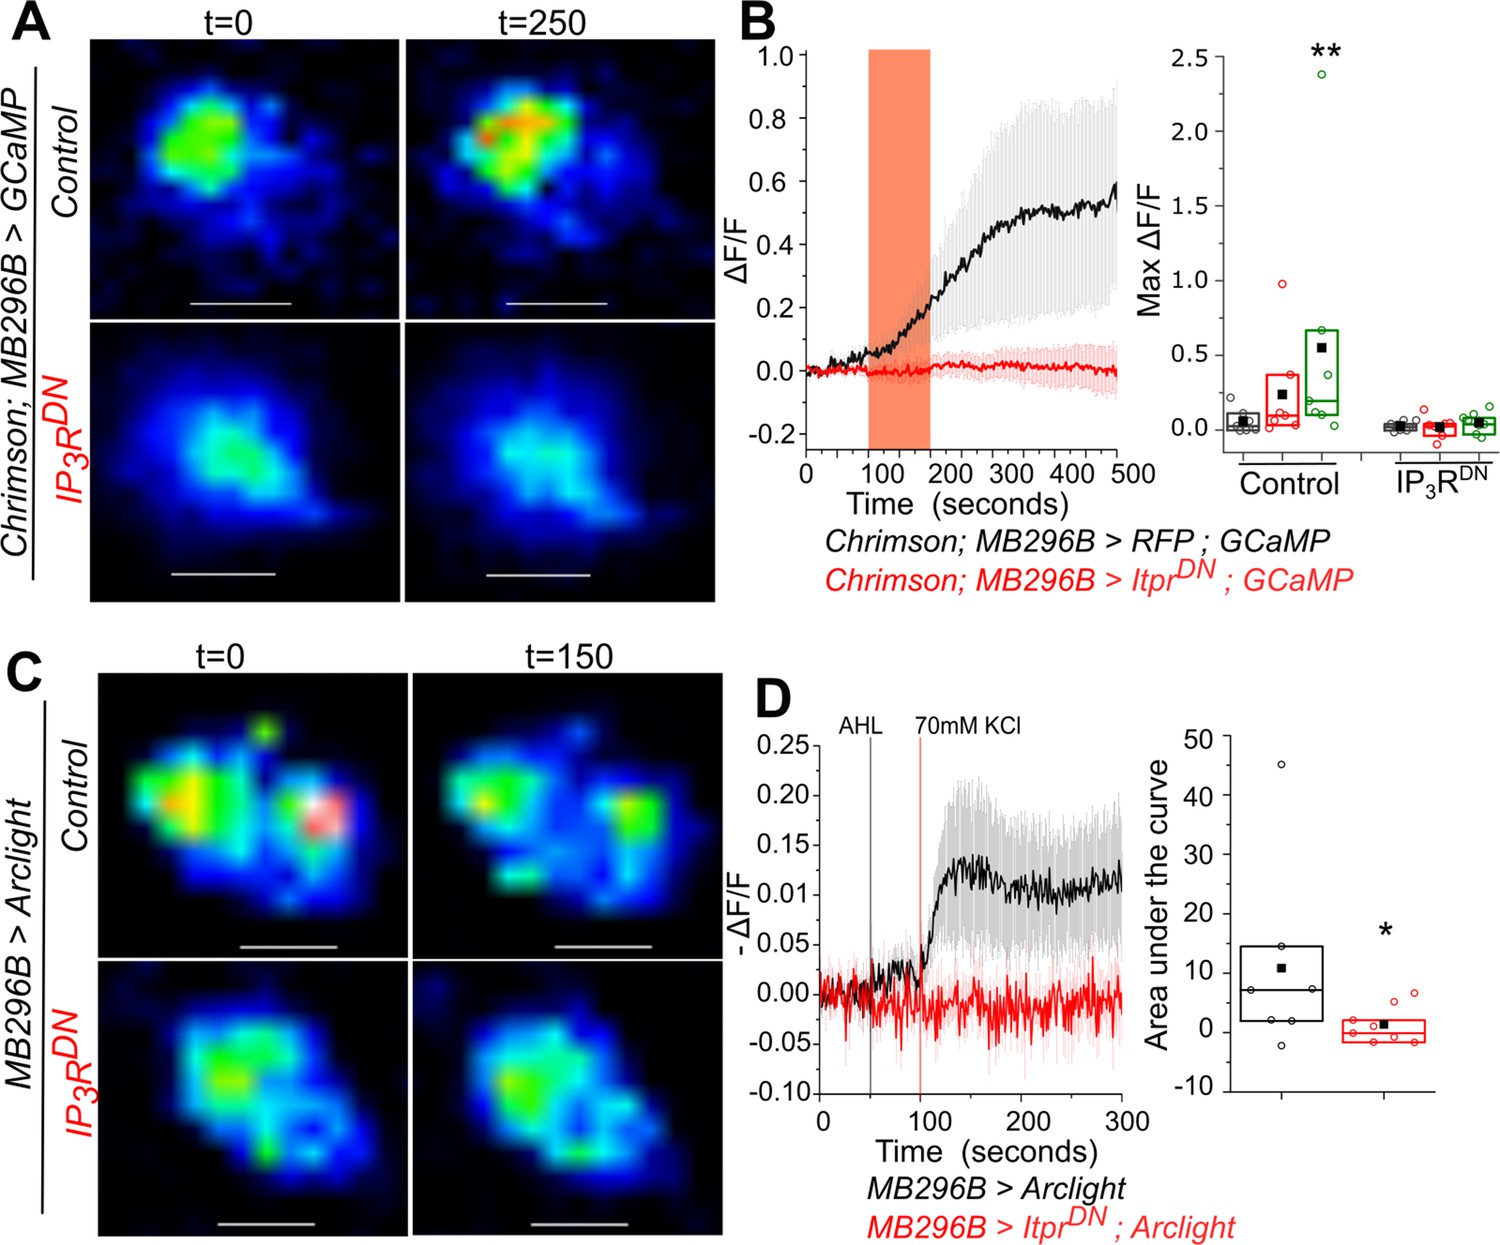
Optimal excitability of PPL1- γ2α′1 dopaminergic neurons requires the IP3R.
(A) Optogenetic activation of PPL1- γ2α′1 DANs, with the red light activated Channelrhodopsin variant Chrimson, is attenuated by expression of IP3RDN. Representative images of MB296BGAL4 marked DANs of the indicated genotypes are shown with changes in GCaMP6m fluorescence before (t=0) and after (t=250s) a 100s pulse of red light (red bar). Images were acquired at 2s per frame. Warmer colors denote increase in [Ca2+]. Scale bar = 5 μm. (B) Average traces (± SEM) of normalized changes in GCaMP6m fluorescence (ΔF/F) in MB296BGAL4 marked DANs after activation by Chrimson (left); Quantification of areas under the curve are shown for before stimulation (0-100 sec, gray), during stimulation (100-200s, red) and after stimulation (200-500s, green); (right). Box plots and symbols are as described in Figure 2A. MB296B GAL4 > UAS RFP; UAS GCaMP, N = 7 cells from 7 brains; MB296B GAL4 > UAS ItprDN; UAS GCaMP, N = 8 cells from 8 brains **p< 0.05, Mann-Whitney U test. (C) Changes in membrane potential upon addition of KCl, visualized by expression of the voltage sensor Arclight. Representative images of Arclight responses in MB296BGAL4 marked DANs are shown from the indicated genotypes and time points. Images were acquired at 1s per frame; Scale bar = 5 μm. Average traces (± SEM) of normalized changes in Arclight fluorescence (-ΔF/F) in MB296BGAL4 marked DANs after addition of KCl (left). Images were acquired at 1s per frame; Quantification of area under the curve is from the point of stimulation at 100s up to 200s (right). Box plots and symbols are as described in Figure 2A. MB296B GAL4 > UAS Arclight N = 7 cells from 7 brains; MB296B GAL4 > UAS ItprDN; UAS Arclight N = 8 cells from 8 brains *p< 0.1, Mann-Whitney U test.
-
Figure 6—source data 1
GCaMP6m fluorescence (ΔF/F) traces inMB296BGAL4 marked DANs after activation by Chrimson in individual brains (Black -MB296B GAL4>UAS RFP; UAS GCaMP; Red-MB296B GAL4>UAS ItprDN; UAS GCaMP).
- https://cdn.elifesciences.org/articles/62297/elife-62297-fig6-data1-v1.pptx
-
Figure 6—source data 2
Arclight fluorescence (ΔF/F) traces in MB296BGAL4 marked DANs after KCl induced depolarisation in individual brains (Black -MB296B GAL4>UAS Arclight; Red-MB296B GAL4>UAS ItprDN; UAS Arclight).
- https://cdn.elifesciences.org/articles/62297/elife-62297-fig6-data2-v1.pptx
-
Figure 6—source data 3
GCaMP fluorescence (ΔF/F) traces inMB296BGAL4marked DANs after KCl induced depolarisation in individual brains (Black -MB296B GAL4>UAS GCaMP; Red-MB296B GAL4>UASItprDN; UAS GCaMP).
- https://cdn.elifesciences.org/articles/62297/elife-62297-fig6-data3-v1.pptx
Figure 6—figure supplement 1
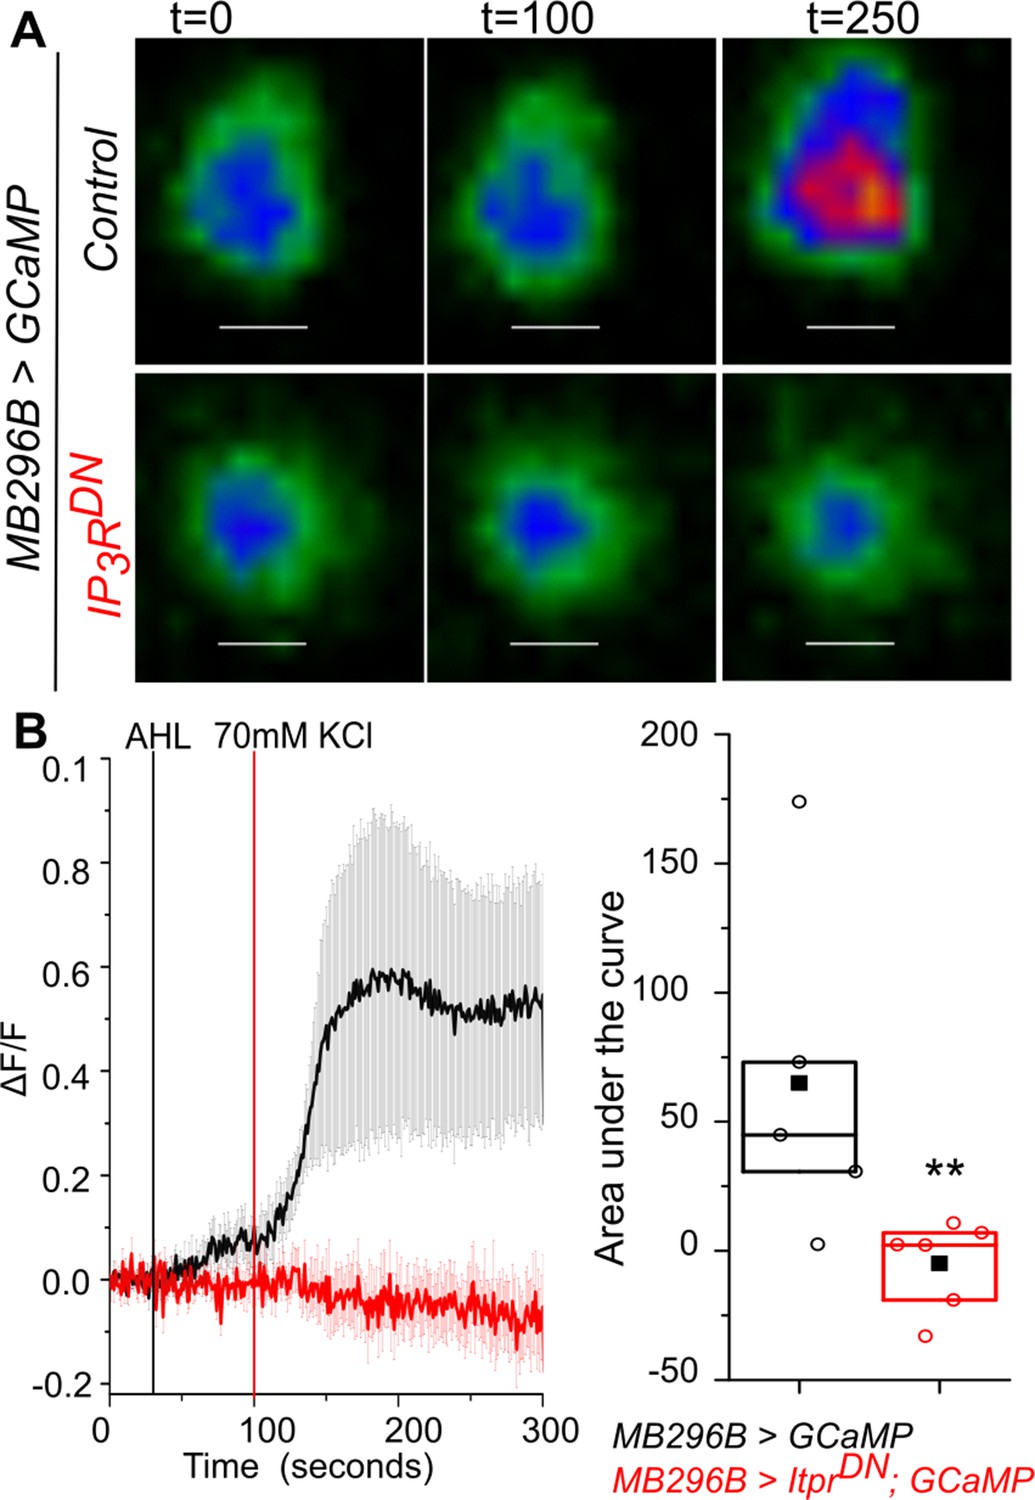
Perturbation of IP3R signaling in PPL1- γ2α′1 cells reduced KCl-evoked calcium response.
(A) KCl-evoked activation of PPL1- γ2α′1 DANs is attenuated by expression of IP3RDN. Representative images of MB296BGAL4 marked DANs of the indicated genotypes are shown with changes in GCaMP6m fluorescence before (t = 0, t = 100) and after addition of KCl at t = 250 s. Images were acquired at 1 s per frame. Warmer colors denote increase in [Ca2+]. Scale bar = 5 μm (Top). (B) Average traces (± SEM) of normalized changes in GCaMP6m fluorescence (ΔF/F) in MB296BGAL4 marked DANs after activation by KCl (left); Quantification of area under the curve from the point of stimulation at 100 s up to 200 s. Boxplots and symbols are as described in Figure 2A. MB296B GAL4 >UAS GCaMP N = 5 cells from five brains,; MB296B GAL4 >UAS ItprDN; UAS GCaMP N = 6 cells from six brains **p<0.05 Mann-Whitney U test (right).
Figure 7
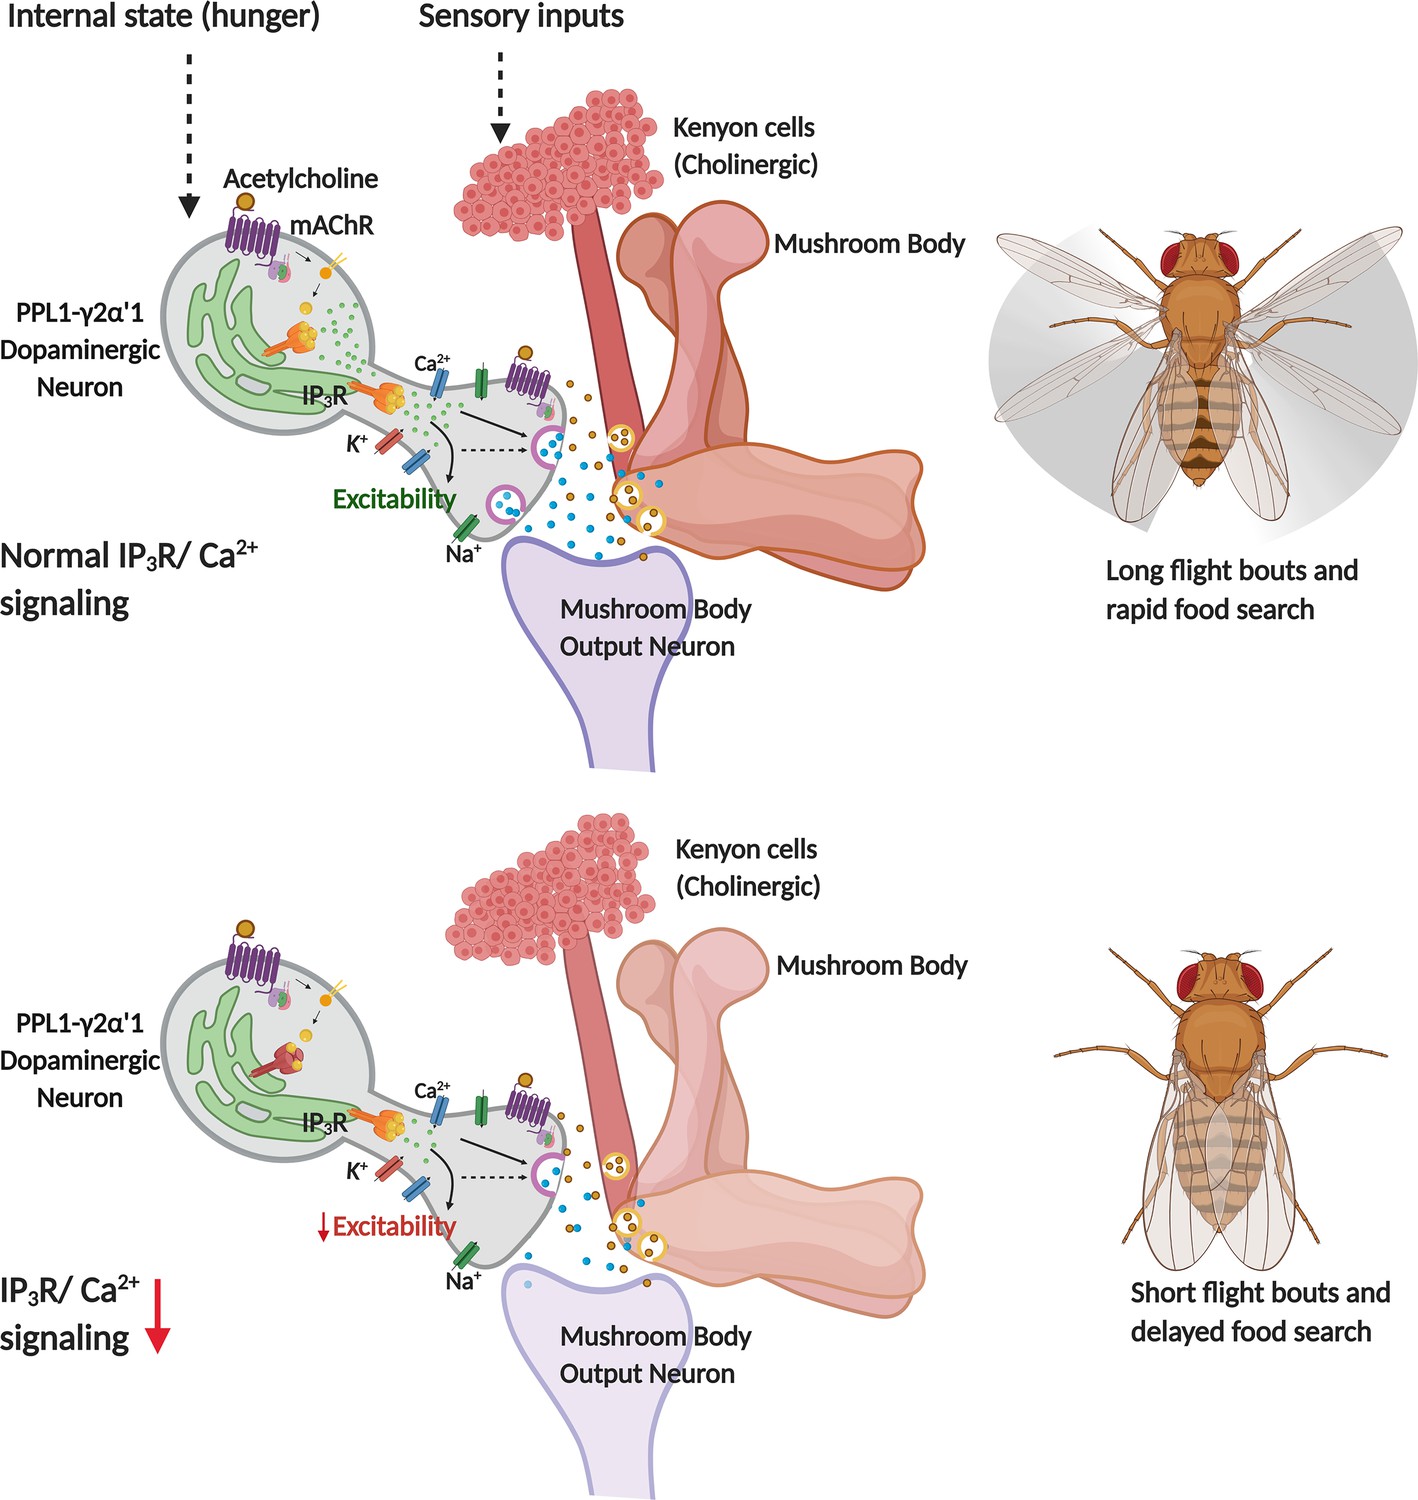
Schematic showing neuronal properties regulated by IP3/Ca2+ signals in central dopaminergic neurons for flight and food search behaviour in Drosophila melanogaster.
Tables
Key resources table
| Reagent type (species) or resource | Designation | Source or reference | Identifiers | Additional information |
|---|---|---|---|---|
| Genetic reagent (D. melanogaster) | nSybGAL4 | Bloomington Drosophila Stock Center | RRID:BDSC_51635 | |
| Genetic reagent (D. melanogaster) | UAS GCaMP6m | Bloomington Drosophila Stock Center | RRID:BDSC_42750 | |
| Genetic reagent (D. melanogaster) | UAS GCaMP6m | Bloomington Drosophila Stock Center | RRID:BDSC_42748 | |
| Genetic reagent (D. melanogaster) | UAS Arclight | Bloomington Drosophila Stock Center | RRID:BDSC_51056 | |
| Genetic reagent (D. melanogaster) | UAS mCD8GFP | Bloomington Drosophila Stock Center | RRID:BDSC_5130 | |
| Genetic reagent (D. melanogaster) | UAS Dicer | Bloomington Drosophila Stock Center | RRID:BDSC_24648 | |
| Genetic reagent (D. melanogaster) | UAS Chrimson | Bloomington Drosophila Stock Center | RRID:BDSC_55137 | |
| Genetic reagent (D. melanogaster) | UAS syt.eGFP | Bloomington Drosophila Stock Center | RRID:BDSC_6926 | |
| Genetic reagent(D. melanogaster) | UAS RFP | Bloomington Drosophila Stock Center | RRID:BDSC_32218 | |
| Genetic reagent (D. melanogaster) | MB058BGAL4 | Bloomington Drosophila Stock Center | RRID:BDSC_68278 | |
| Genetic reagent (D. melanogaster) | MB296BGAL4 | Bloomington Drosophila Stock Center | RRID:BDSC_63308 | |
| Genetic reagent (D. melanogaster) | MB304BGAL4 | Bloomington Drosophila Stock Center | RRID:BDSC_68367 | |
| Genetic reagent (D. melanogaster) | MB320CGAL4 | Bloomington Drosophila Stock Center | RRID:BDSC_68253 | |
| Genetic reagent (D. melanogaster) | MB630BGAL4 | Bloomington Drosophila Stock Center | RRID:BDSC_68334 | |
| Genetic reagent (D. melanogaster) | MB438BGAL4 | Bloomington Drosophila Stock Center | RRID:BDSC_68326 | |
| Genetic reagent (D. melanogaster) | MB504BGAL4 | Bloomington Drosophila Stock Center | RRID:BDSC_68329 | |
| Genetic reagent (D. melanogaster) | UAS mAChR RNAi (dsmAChR) | Vienna Drosophila Resource Center RRID:SCR_013805 | VDRC_101407 | |
| Genetic reagent (D. melanogaster) | UAS itprRNAi (dsitpr) | National Institute of Genetics | NIG_1063 R-2 | |
| Genetic reagent (D. melanogaster) | UAS Itpr+ | Venkatesh et al., 2001 | RRID:BBSC_30742 | |
| Genetic reagent (D. melanogaster) | THGAL4 | Friggi-Grelin et al., 2003 (DOI:10.1002/neu.10185) | Gift from Serge Birman (CNRS, ESPCI Paris Tech, France) | |
| Genetic reagent (D. melanogaster) | THD’ GAL4 | Liu et al., 2012 (DOI:10.1016/j.cub.2012.09.008) | Gift from Mark N Wu (Johns Hopkins University, Baltimore) | |
| Genetic reagent (D. melanogaster) | THD1 GAL4 | Liu et al., 2012 (DOI:10.1016/j.cub.2012.09.008) | Gift from Mark N Wu (Johns Hopkins University, Baltimore) | |
| Genetic reagent (D. melanogaster) | THC’ GAL4 | Liu et al., 2012 (DOI:10.1016/j.cub.2012.09.008) | Gift from Mark N Wu (Johns Hopkins University, Baltimore) | |
| Genetic reagent (D. melanogaster) | UAS GRABDA | Sun et al., 2018 (DOI:10.1016/j.cell.2018.06.042) | Gift from Yulong Li (Peking University School of Life Sciences, Beijing, China) | |
| Genetic reagent (D. melanogaster) | UAS Shibirets | Kitamoto, 2001 (DOI:10.1002/neu.1018) | Gift from Toshihiro Kitamoto (University of Iowa, Carver College of Medicine, Iowa) | |
| Genetic reagent (D. melanogaster) | vGlutVGN6341GAL4 | Syed et al., 2016 (DOI:10.7554/eLife.11572) | Gift from K. Vijayraghavan (NCBS, India) | |
| Genetic reagent (D. melanogaster) | UAS mitoGCaMP | Lutas et al., 2012 (DOI:10.1534/g3.111.001586) | Gift from Fumiko Kawasaki (Pennsylvania State University, Pennsylvania) | |
| Genetic reagent (D. melanogaster) | UAS TubGAL80ts | Pathak et al., 2015 (DOI:10.1523/JNEUROSCI.1680–15.2015) | Generated by Albert Chiang, NCBS, Bangalore, India | |
| Genetic reagent (D. melanogaster) | UAS ItprDN | This paper | Transgenic Drosophila with a Dominant negative Drosophila IP3R cDNA | |
| Genetic reagent (D. melanogaster) | itpr gene mutant (itprug3) | Joshi et al., 2004 (DOI:10.1534/genetics.166.1.225) | RRID:BDSC_30738 | |
| Genetic reagent (D. melanogaster) | itpr gene mutant (itprka1091) | Joshi et al., 2004 (DOI:10.1534/genetics.166.1.225) | RRID:BDSC_30739 | |
| Antibody | Rabbit anti GFP (polyclonal) | Life Technologies, Thermo Fisher | RRID:AB_221570,Cat # A-6455 | IHC: 1:10,000 |
| Antibody | Mouse anti-bruchpilot (monoclonal) | Wagh et al., 2006 (DOI:10.1016/j.neuron.2006.02.008) | Gift from Eric Buchner, University of Wuerzburg, Germany (dilution 1:150) | |
| Antibody | Anti-mouse Alexa Fluor 568 (polyclonal) | Life Technologies, ThermoFisher Scientific | Cat# A-11004, RRID:AB_2534072 | IHC: 1:400 |
| Antibody | Anti-rabbit Alexa Fluor 488 (polyclonal) | Life Technologies, ThermoFisher Scientific | Cat# A-11008, RRID:AB_143165 | IHC: 1:400 |
| Antibody | Rabbit anti-IP3R (polyclonal) | Agrawal et al., 2009 (DOI:10.1371/journal.pone.0006652) | IB-9075 | WB: 1:300; Gift from Ilya Bezprozvanny (UT South Western, USA). |
| Antibody | Mouse anti-spectrin (monoclonal) | Developmental Studies Hybridoma Bank | Cat# 3A9 (323 or M10-2), RRID:AB_528473 | WB: 1:50 |
| Antibody | Anti-mouse HRP (polyclonal) | Cell Signaling Technology | Cat# 7076, RRID:AB_330924 | WB: 1:3000 |
| Antibody | Anti-rabbit HRP (polyclonal) | ThermoFisher Scientific | Cat#32260, RRID:AB_1965959 | WB: 1:5000 |
| Chemical compound, drug | Low melt Agar | Invitrogen | Cat# 16520–050 | |
| Chemical compound, drug | Carbachol | Sigma Aldrich | Cat# C4382 | |
| Chemical compound, drug | All trans Retinal | Sigma Aldrich | Cat# R2500 | |
| Chemical compound, drug | EcoR1 | New England Biolabs | Cat# R0101S | Restriction enzyme |
| Chemical compound, drug | Xho1 | New England Biolabs | Cat# R0146S | Restriction enzyme |
| Chemical compound, drug | AatII | New England Biolabs | Cat# R0117S | Restriction enzyme |
| Chemical compound, drug | Eag1 | New England Biolabs | Cat# R0505S | Restriction enzyme |
| Strain, strain background (Escherichia coli) | Sure Competent cells | Stratagene, Agilent Technologies | Cat# 200238 | Maintained in the lab |
| Commercial assay or kit | Quick Ligation Kit | New England Biolabs | Cat# M2200S | |
| Commercial assay or kit | WesternBright ECL kit | Advansta | Cat# K-12045-D20 | |
| Commercial assay or kit | QuikChange II XL Site-Directed Mutagenesis Kit | Agilent | Cat# 200522 | |
| Software, algorithm | Origin 8 | Origin lab | RRID:SCR_014212 | |
| Software, algorithm | Fiji/ImageJ | National Institutes of Health | RRID:SCR_002285 |
Additional files
Download links
A two-part list of links to download the article, or parts of the article, in various formats.
Downloads (link to download the article as PDF)
Open citations (links to open the citations from this article in various online reference manager services)
Cite this article (links to download the citations from this article in formats compatible with various reference manager tools)
Modulation of flight and feeding behaviours requires presynaptic IP3Rs in dopaminergic neurons
eLife 9:e62297.
https://doi.org/10.7554/eLife.62297


