Translation in amino-acid-poor environments is limited by tRNAGln charging
- Cancer Biology & Genetics Program, Memorial Sloan Kettering Cancer Center, United States
- The Donald B. and Catherine C. Marron Cancer Metabolism Center, Memorial Sloan Kettering Cancer Center, United States
Figures
Figure 1 with 1 supplement
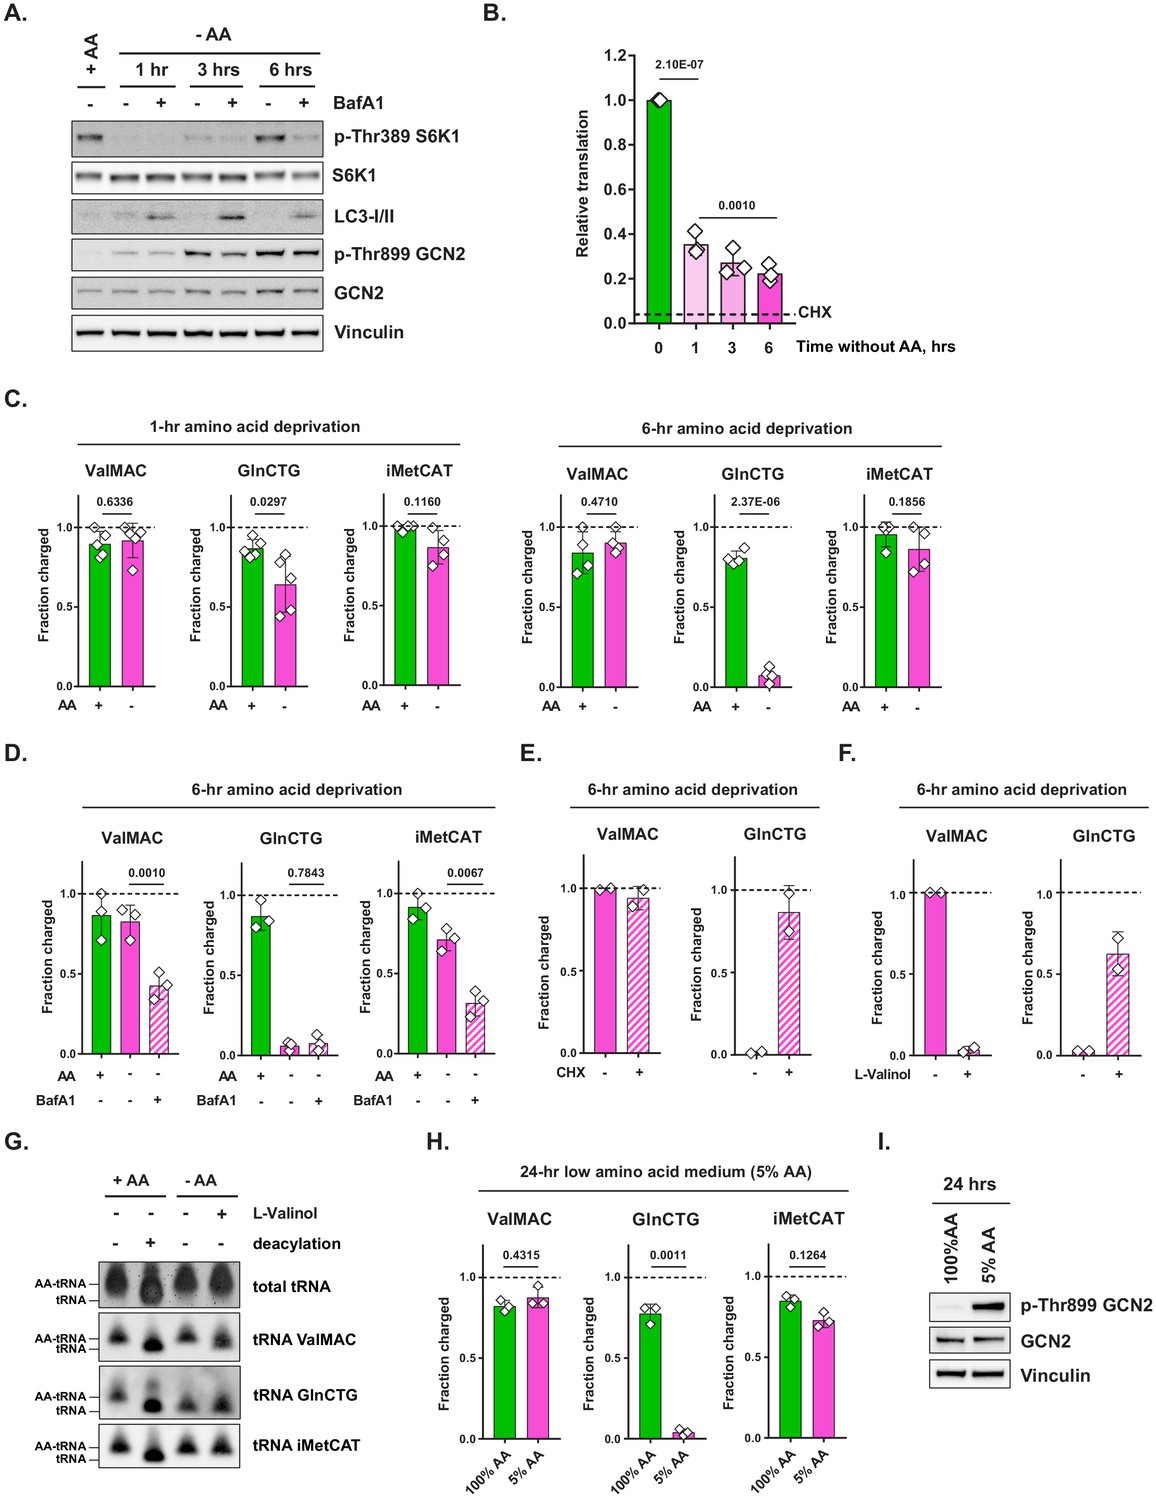
Amino acid deprivation triggers selective uncharging of tRNAGln.
(A) Mouse embryonic fibroblasts (MEFs) were treated with amino-acid-free DMEM for indicated periods of time in presence (+) or absence (-) of 100 nM bafilomycin A1 (BafA1). Cell lysates were analyzed by western blotting. A representative result (out of three independent experiments) is shown. (B) MEFs were treated with amino-acid-free DMEM for indicated periods of time. Translational activity was determined by measuring O-propargyl-puromycin (OPP) incorporation. For CHX-treated control, cells were treated with 10 μg/mL of cycloheximide (CHX) for 10 min prior to adding OPP. Quantification of OPP incorporated into nascent polypeptides was performed by labeling permeabilized cells with an azide-coupled fluorophore, followed by FACS analysis. Data are shown as mean ± SD of N = 3 biological replicates (defined as independent experiments that were carried out in distinct points in time). (C) MEFs were treated with amino-acid-free DMEM for 1 or 6 hr and tRNA charging of indicated isodecoder groups was measured. Primers specific to ValAAC/ValCAC (ValMAC), GlnCTG and initiator MetCAT were used. The last three letters denote an anticodon or a group of anticodons targeted. Data are shown as mean ± SD of N = 4–5 biological replicates (defined as samples that were plated, treated and assayed as part of experiments conducted independently in disparate points in time). (D) MEFs were treated with complete or amino-acid-free DMEM for 6 hr in presence (+) or absence (-) of 100 nM bafilomycin A1 (BafA1) and subjected to tRNA charging assay. Data are shown as mean ± SD of N = 3 biological replicates. (E, F) MEFs were treated with amino-acid-free DMEM for 6 hr; 10 μg/mL cycloheximide (E) or 2 mM L-valinol (F) was added for the last 10 min (for cycloheximide) or 30 min (for L-valinol) as shown. tRNA charging of indicated isodecoder groups was measured. Data are shown as mean ± SD of N = 2 biological replicates. (G) MEFs were treated with complete or amino-acid-free DMEM for 6 hr. Where indicated, 2 mM L-valinol was added for the last 30 min of treatment. tRNA samples were harvested and deacylated control was prepared by incubating in pH = 9 Tris buffer. tRNA samples were run on acetate-urea PAGE gel, transferred to Hybond N+ membranes and probed with biotin-conjugated oligo probes specific for indicated tRNA isoacceptors or groups of isoacceptors. A representative result (out of three independent experiments) is shown. (H) MEFs were treated with 100% AA (complete DMEM) or 5% AA (each amino acid supplied at a 5% of standard DMEM formulation) medium for 24 hr and subjected to tRNA charging assay. Data are shown as mean ± SD of N = 3 biological replicates. (I) MEF samples treated as in (H) were analyzed by western blot. A representative result (out of three independent experiments) is shown. p-Values were calculated by one-way ANOVA with Holm-Sidak post-test (B,D) or by paired Student's t test (C,H). See also Figure 1—figure supplement 1.
-
Figure 1—source data 1
Summary data and statistics for O-propargyl-puromycin assays, tRNA charging assays and mass spectrometry measurements presented in Figure 1 and Figure 1—figure supplement 1.
- https://cdn.elifesciences.org/articles/62307/elife-62307-fig1-data1-v2.xlsx
Figure 1—figure supplement 1
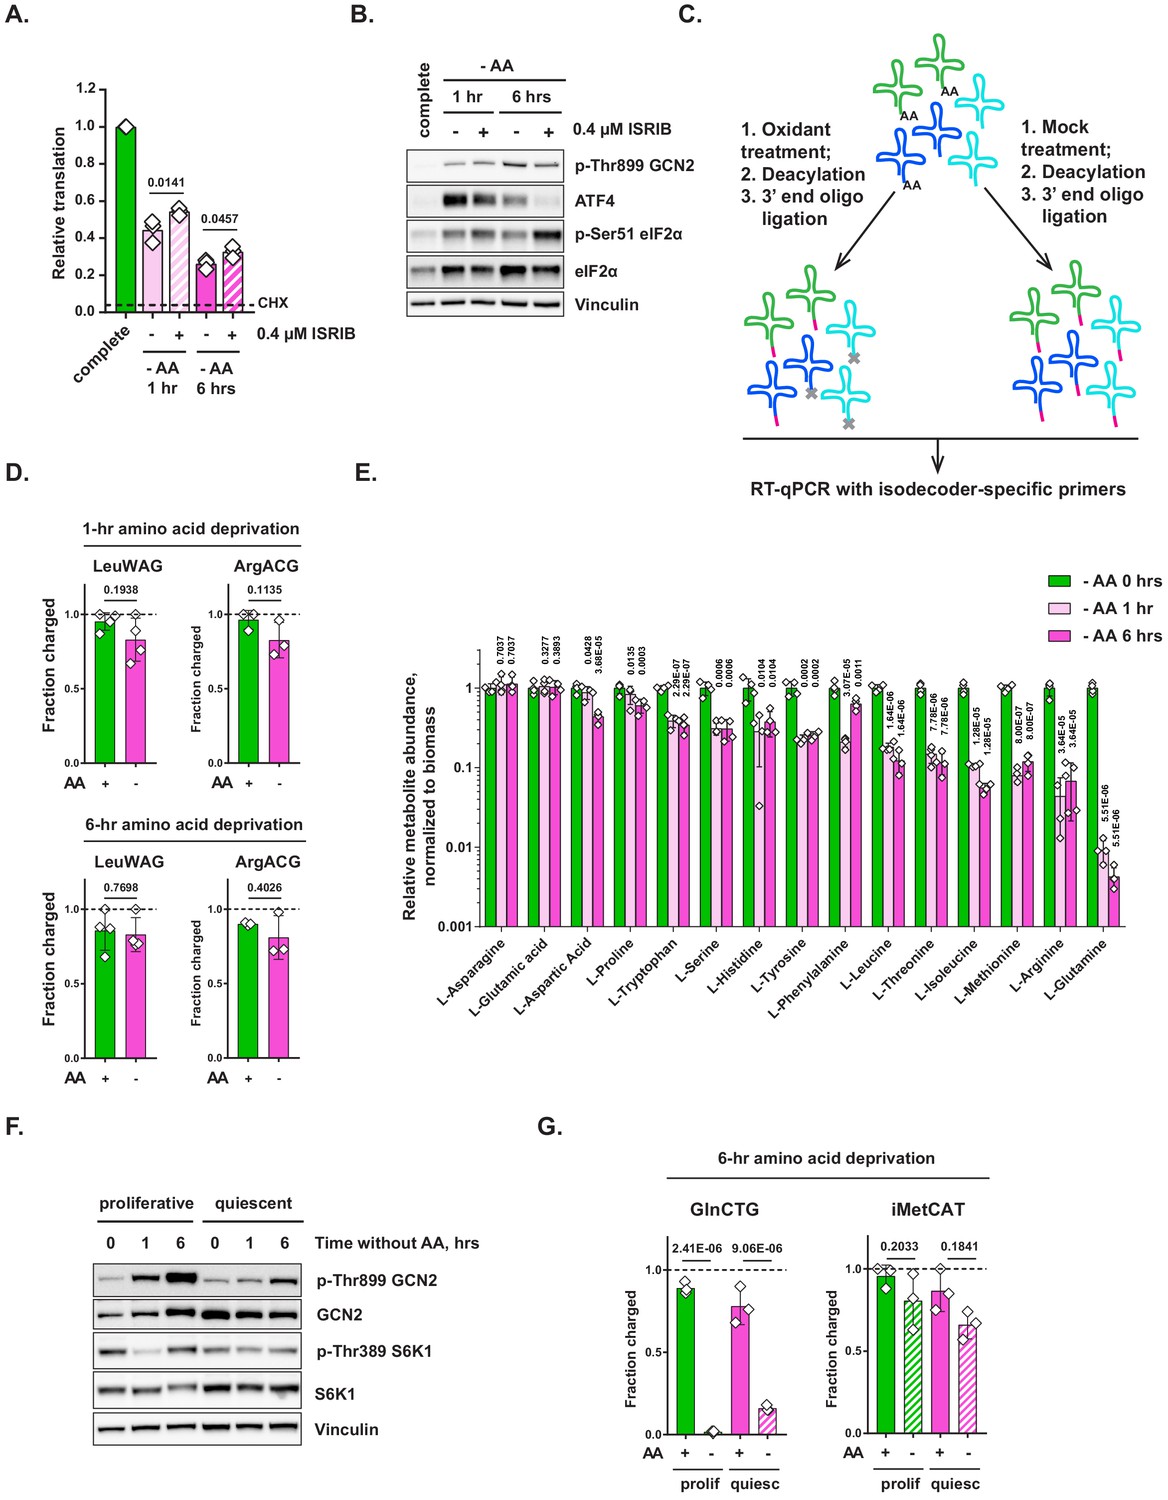
Additional data on amino acid sensing and tRNA charging in amino-acid-depleted cells.
(A, B) Mouse embryonic fibroblasts (MEFs) were treated with amino-acid-free DMEM for indicated periods of time in presence (+) or absence (-) of 0.4 μM ISRIB and analyzed by O-propargyl-puromycin (OPP) incorporation assay (A) or western blotting. Data are shown as mean ± SD of N = 3 biological replicates. (C) A method for determining the relative charging of tRNAs. (D) MEFs were treated with amino-acid-free DMEM for 1 or 6 hr and tRNA charging of indicated isodecoders was measured. Primers specific to LeuAAG/LeuTAG (LeuWAG) and ArgACG were used. Data are shown as mean ± SD of N = 3 biological replicates. (E) MEFs were treated with amino-acid-free DMEM for indicated periods of time and relative changes in free cellular amino acid levels were measured by mass spectrometry. Data are shown as mean ± SD of N = 4 biological replicates. (F) To induce quiescence, MEFs were cultured for 3 days past confluence. Culture medium was changed daily to prevent starvation-associated stress. Proliferating and quiescent MEFs were treated with amino-acid-free DMEM for indicated periods of time and analyzed by western blotting. A representative result (out of three independent experiments) is shown. (G) Proliferating and quiescent MEFs were treated with complete or amino-acid-free DMEM for 6 hr and subjected to tRNA charging assay. Data are shown as mean ± SD of N = 3 biological replicates. p-Values were calculated by paired Student's t test (D) or by one-way ANOVA with Holm-Sidak post-test (E,G).
Figure 2 with 1 supplement
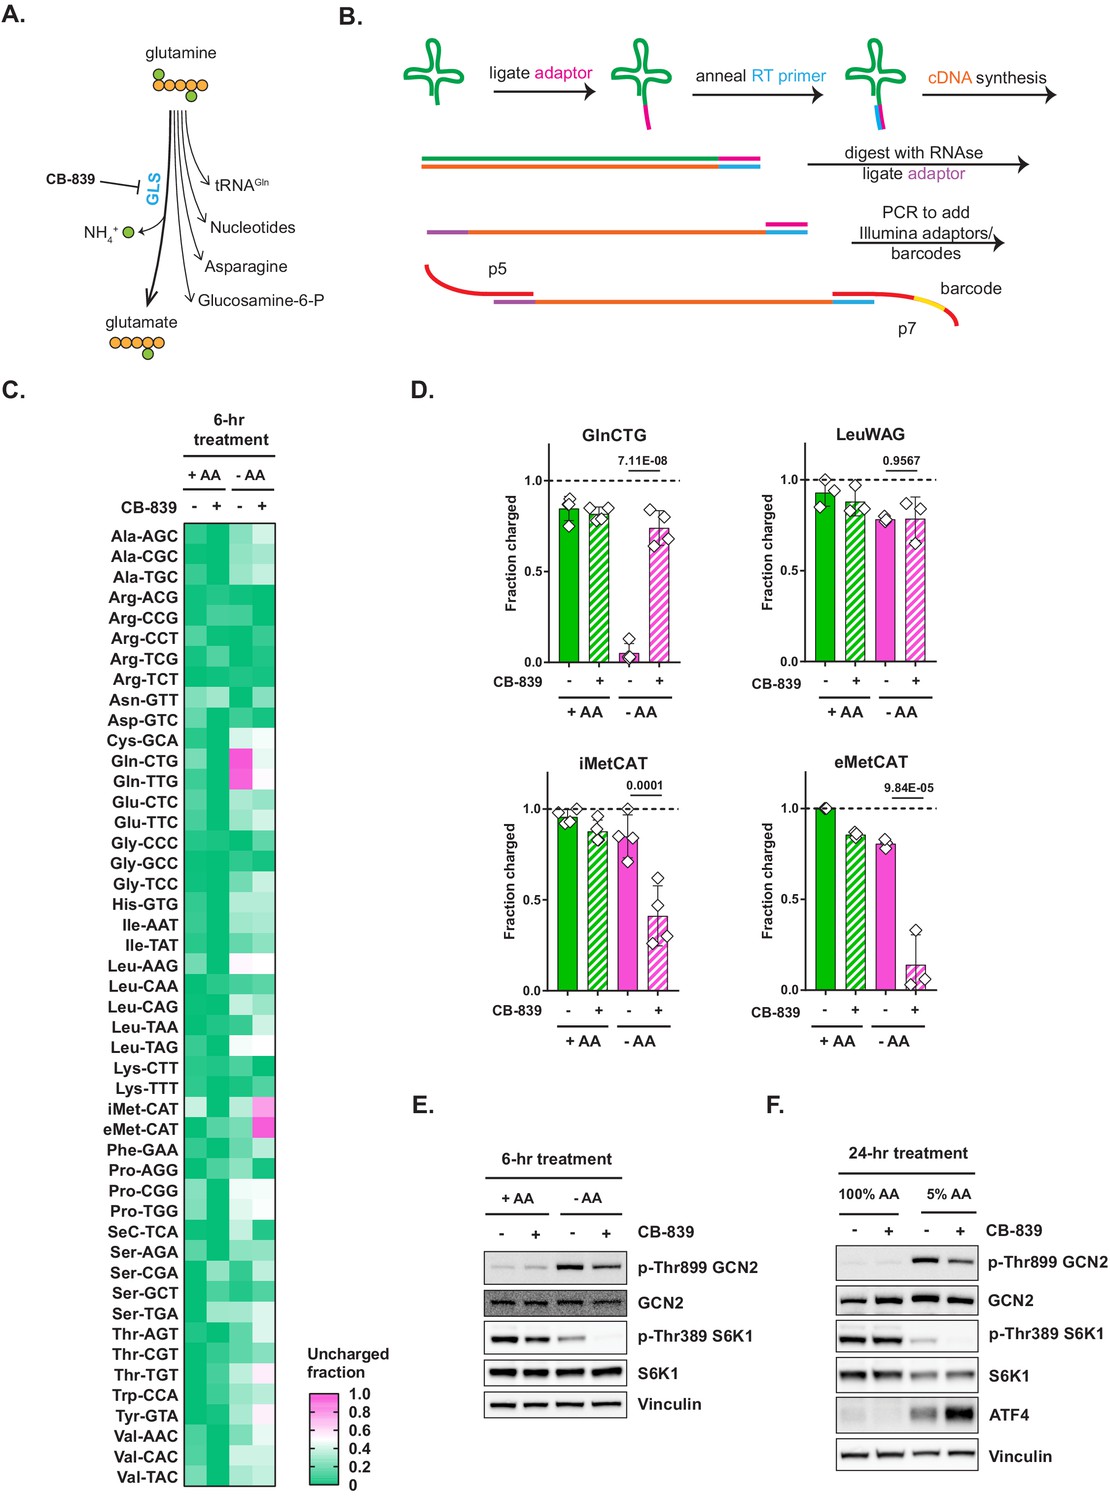
Glutaminase inhibition restores charged tRNAGln pools in amino-acid-deprived cells.
(A) Depiction of glutamine utilization pathways. (B) A method for a high-throughput profiling of tRNA charging (CHARGE-seq). (C) Mouse embryonic fibroblasts (MEFs) were treated with complete or amino-acid-free DMEM for 6 hr in presence (+) or absence (-) of 1 μM glutaminase inhibitor CB-839 and analyzed by CHARGE-seq. A representative result (out of two independent experiments) is shown. (D) MEFs were treated as in (C) and subjected to tRNA charging assay with qPCR as a readout. Data are shown as mean ± SD of N = 3 biological replicates. p-Values were calculated by one-way ANOVA with Holm-Sidak post-test. (E, F) Western blots of lysates from MEFs treated with complete or amino-acid-free DMEM for 6 hr (E), or with 100% AA (complete DMEM) or 5% AA (each amino acid supplied at a 5% of standard DMEM formulation) DMEM (F) for 24 hr, in presence (+) or absence (-) of 1 μM glutaminase inhibitor CB-839. A representative result (out of three independent experiments) is shown. See also Figure 2—figure supplement 1.
-
Figure 2—source data 1
Summary data and statistics for tRNA charging and cell proliferation assays presented in Figure 2 and Figure 2—figure supplement 1.
- https://cdn.elifesciences.org/articles/62307/elife-62307-fig2-data1-v2.xlsx
Figure 2—figure supplement 1
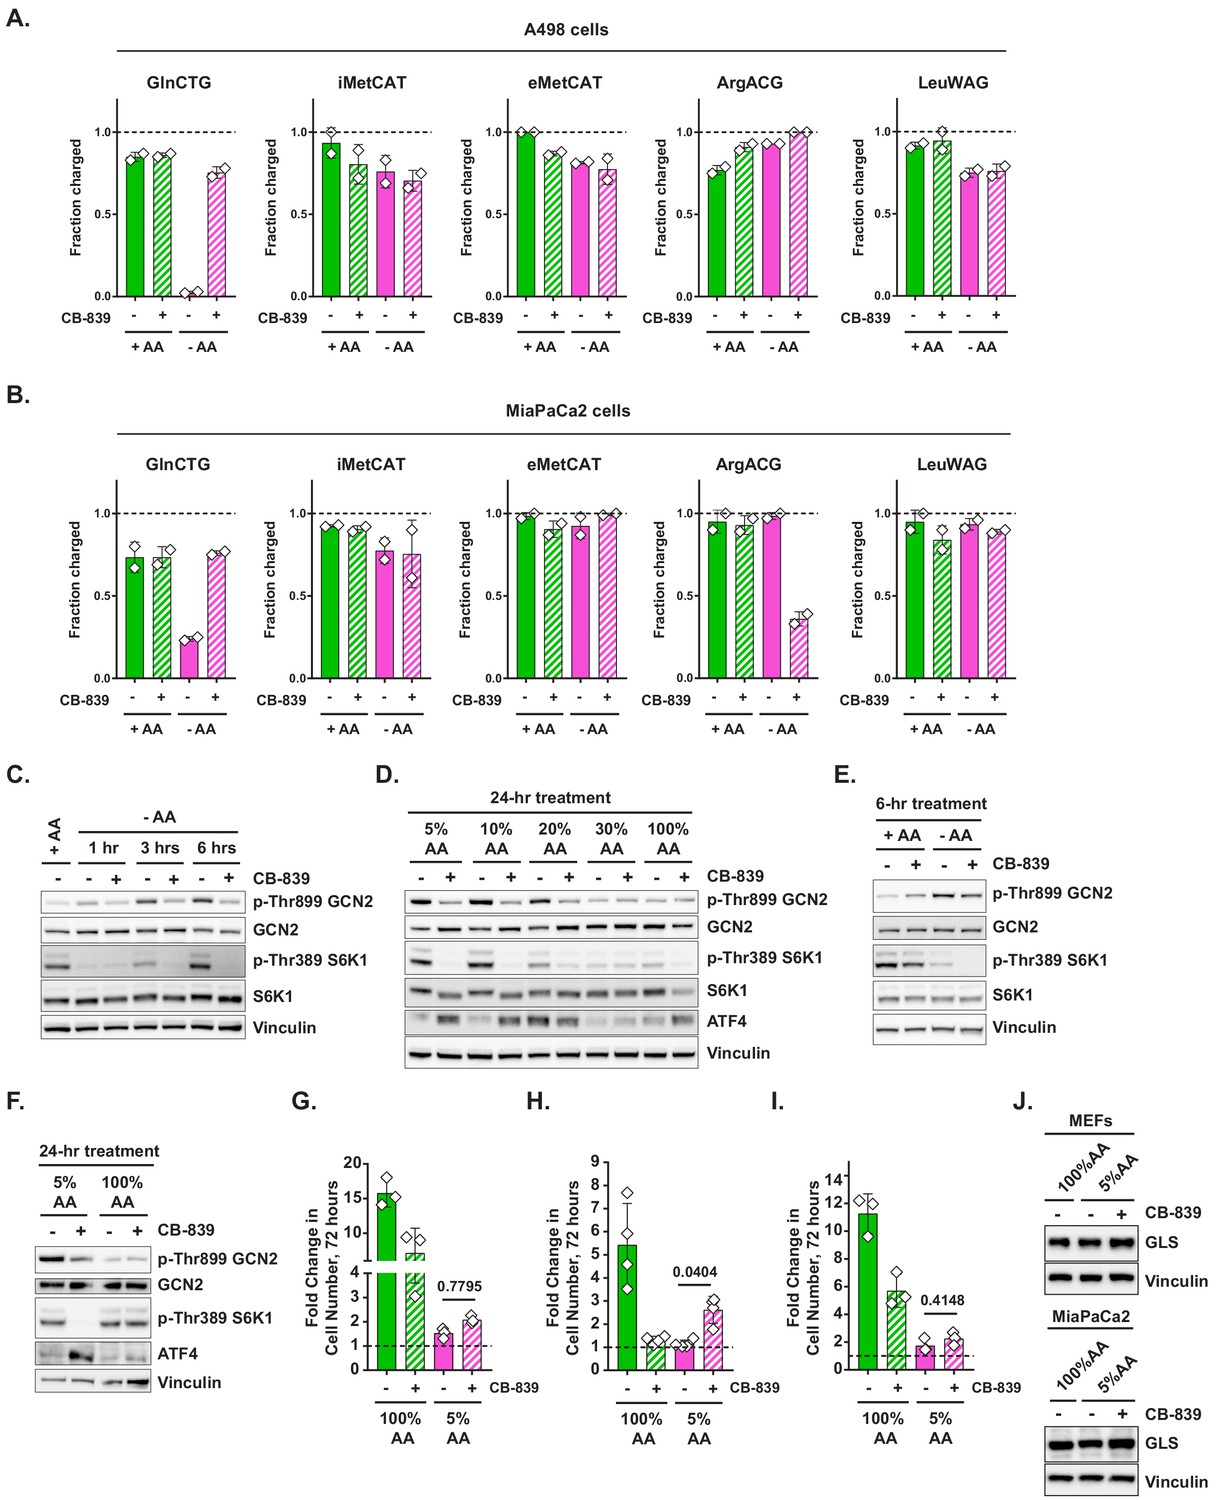
Loss of tRNAGln charging and its restoration via the inhibition of glutaminase across a variety of cellular contexts.
(A–B) A498 (A) or MiaPaCa2 (B) cells were treated with complete or amino-acid-free DMEM for 6 hr in presence (+) or absence (-) of 1 μM glutaminase inhibitor CB-839. tRNA charging of indicated isodecoders was measured. Data are shown as mean ± SD of N = 2 biological replicates. (C) A498 cells were treated with amino-acid-free DMEM for indicated periods of time in presence (+) or absence (-) of 1 μM glutaminase inhibitor CB-839. Cell lysates were analyzed by western blotting. A representative result (out of three independent experiments) is shown. (D) A498 cells were treated with amino-acid-free DMEM supplied with varied amounts of amino acids as indicated in presence (+) or absence (-) of 1 μM glutaminase inhibitor CB-839 for 24 hr. Cell lysates were analyzed by western blotting. A representative result (out of three independent experiments) is shown. (E, F) MiaPaCa2 cells were treated with complete or amino-acid-free DMEM for 6 hr (E), or with either 100% AA or 5% AA DMEM for 24 hr (F) in the presence (+) or absence (-) of 1 μM glutaminase inhibitor CB-839. Cell lysates were analyzed by western blotting. A representative result (out of three independent experiments) is shown. (G–I) Cell proliferation in 100% AA or 5% AA DMEM in presence (+) or absence (-) of 1 μM glutaminase inhibitor CB-839 was assayed in MEFs (G), A498 (H) and MiaPaCa2 cells (I). Data are shown as mean ± SD of N = 3–4 biological replicates. p-Values were calculated by one-way ANOVA with Holm-Sidak post-test (G–I). (J) MEFs and MiaPaCa2 cells were treated for 48 hr as indicated and cell lysates were analyzed by western blotting. A representative result (out of two independent experiments) is shown.
Figure 3 with 1 supplement

Glutaminase inhibition facilitates protein synthesis when amino acids are limiting.
(A) Mouse embryonic fibroblasts (MEFs) were treated with complete or amino-acid-free DMEM for 6 hr in presence (+) or absence (-) of 1 μM glutaminase inhibitor CB-839. Translational activity was determined by measuring O-propargyl-puromycin (OPP) incorporation. Dotted line indicates relative amount of OPP incorporation in cells pretreated with 10 μg/mL cycloheximide (CHX). Data are shown as mean ± SD of N = 3 biological replicates. (B) MEFs were treated with complete or amino-acid-free DMEM in presence of 10 μM BPTES, 10 μM Compound 968 or DMSO as a control. Translation was assayed as in (A). Data are shown as mean ± SD of N = 3 biological replicates. (C) MEFs were treated with complete or amino-acid-free DMEM in presence of 200 μM L-glutamine (5% of DMEM formulation) or 10 μM L-methionine (5% of DMEM formulation). Translation was assayed as in (A). Data are shown as mean ± SD of N = 3 biological replicates. (D) MEFs transduced with an inducible d2GFP construct (a GFP ORF fused to a degron of mouse ornithine decarboxylase) were treated with complete or amino-acid-free DMEM with doxycycline for 6 hr in presence of indicated treatments. GFP fluorescence was measured by FACS. Data are shown as mean ± SD of N = 4 biological replicates. (E) A20 B-cell lymphoma cells were stimulated with 4 μg/mL concanavalin A for 72 hr in complete RPMI to induce immunoglobulin synthesis. Concanavalin-A-stimulated cells were treated with 100% AA RPMI or 2.5% AA RPMI (in which each amino acid was supplied at 2.5% of standard RPMI formulation) in presence or absence of 1 μM glutaminase inhibitor CB-839 or 2 μg/mL of cycloheximide (CHX) as indicated for 24 hr. Contents of wells were harvested and centrifuged to remove cells. Supernatant volumes were corrected for differences in cellular biomass accumulation over the treatment course. Biomass-corrected supernatants were applied onto a nitrocellulose paper and blotted with an anti-mouse HRP-conjugated antibody. Data are shown as mean ± SD of N = 4 biological replicates. (F) Quantification of the dot blot from (E). p-Values were calculated by one-way ANOVA with Holm-Sidak post-test (A–D, E). See also Figure 3—figure supplement 1.
-
Figure 3—source data 1
Summary data and statistics for O-propargyl-puromycin assays, GFP reporter assays and IgG secretion assay presented in Figure 3 and Figure 3—figure supplement 1.
- https://cdn.elifesciences.org/articles/62307/elife-62307-fig3-data1-v2.xlsx
Figure 3—figure supplement 1

Additional data on translational capacity of amino-acid-deprived cells across a variety of cellular contexts.
(A, B) MiaPaCa2 (A) or A498 (B) cells were treated as indicated for 6 hr and analyzed by O-propargyl-puromycin (OPP) incorporation assay. Data are shown as mean ± SD of N = 3 biological replicates. (C) Mouse embryonic fibroblasts (MEFs) were transduced with an inducible GFP or d2GFP construct in a retroviral vector. Construct expression was induced with doxycycline for 24 hr, after which cells were switched into either complete or amino-acid-free DMEM in the presence of doxycycline for 6 hr. GFP fluorescence was measured by FACS. Data are shown as mean ± SD of N = 3 biological replicates. (D) GFP- or d2GFP-transduced MEFs were treated with complete or amino-acid-free DMEM for indicated periods of time in the presence of cycloheximide to block new protein production. GFP fluorescence at indicated time points was measured by FACS. Data are shown as mean ± SD of N = 2 biological replicates. p-Values were calculated by one-way ANOVA with Holm-Sidak post-test (A, B) or by paired Student's t test (C).
Figure 4 with 1 supplement
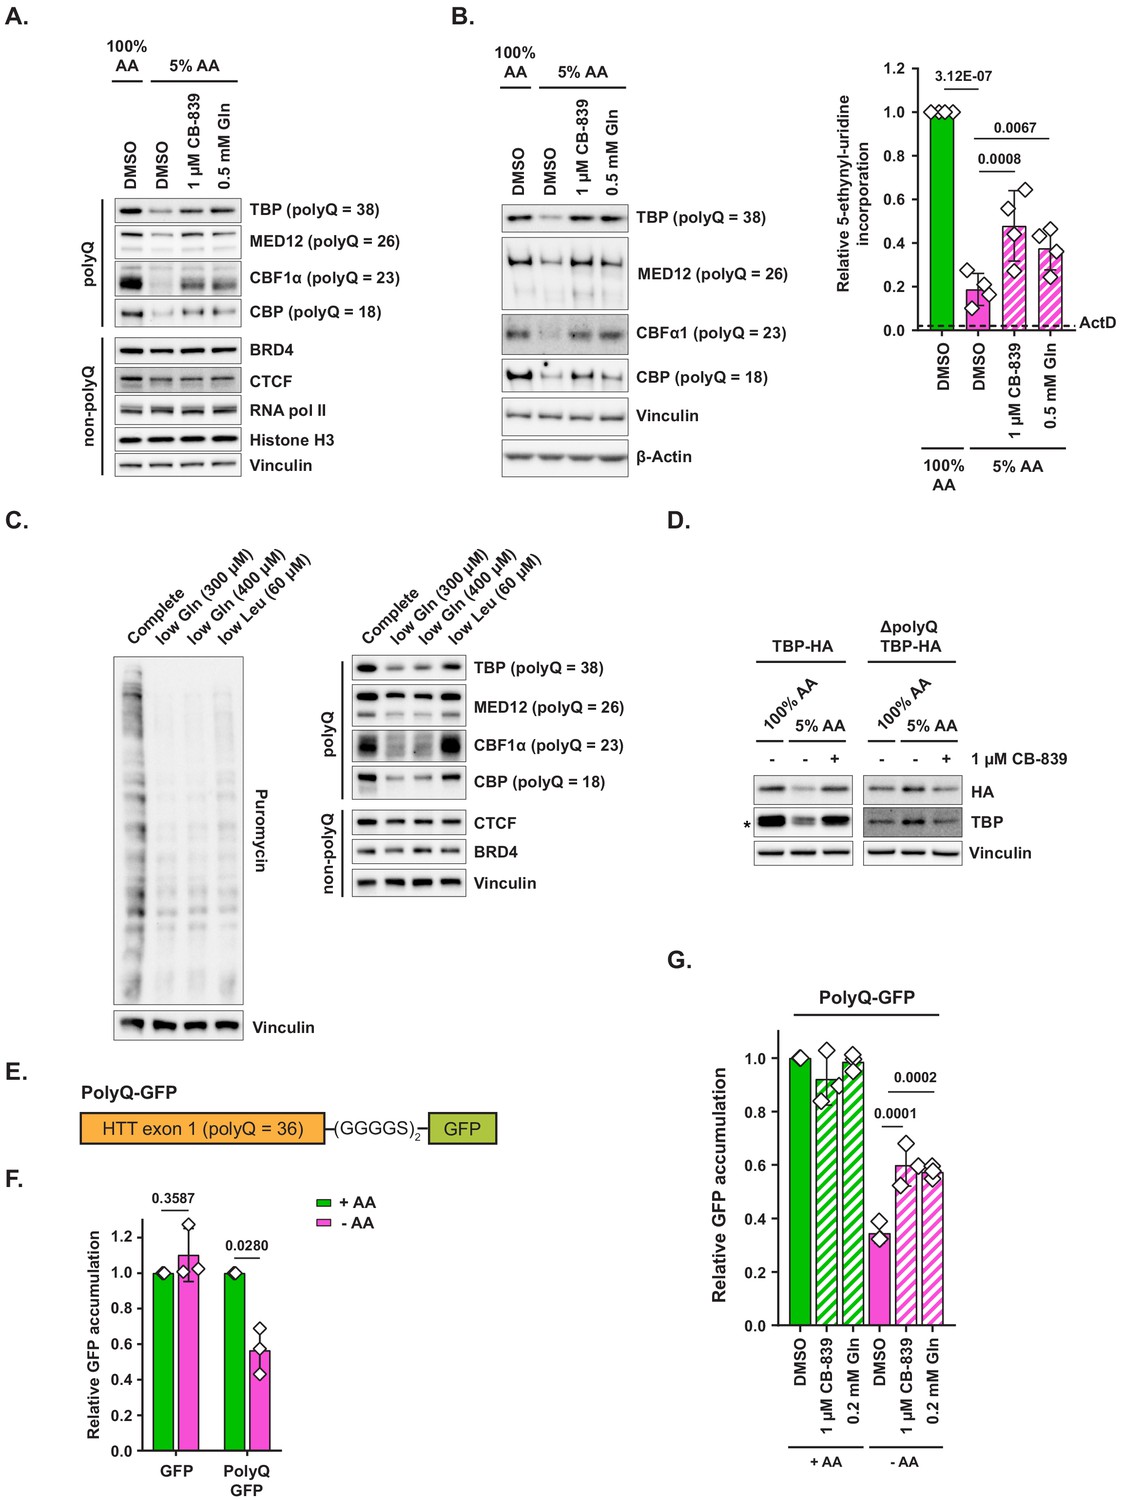
Polyglutamine-tract-containing proteins are depleted from amino-acid-deprived cells and can be recovered by glutaminase inhibition or glutamine addition.
(A) MiaPaCa2 cells were treated as shown for 48 hr. Levels of indicated proteins were examined by western blotting. A representative result (out of three independent experiments) is shown. (B) MiaPaCa2 cells were treated as indicated for 72 hr and nascent RNA synthesis was monitored by 5-ethynyl-uridine (5-EU) incorporation. Levels of indicated polyQ proteins were concurrently measured by western blot. Dotted line represents the relative value of 5-EU incorporation in cells in which transcription was arrested via actinomycin D (ActD) pretreatment for 10 min prior to adding 5-EU. Data are shown as mean ± SD of N = 4 biological replicates. (C) MiaPaCa2 cells were treated with media containing reduced quantities of glutamine or leucine or with complete medium for 48 hr, at which point new protein synthesis was assayed by puromycin incorporation. Levels of indicated polyQ and non-polyQ proteins were determined by western blotting in a parallel set of identically treated samples. A representative result (out of three independent experiments) is shown. (D) MiaPaCa2 cells were transduced with an empty retroviral vector, HA-tagged recombinant TBP (TBP-HA) or HA-tagged recombinant TBP with polyQ tract deleted (ΔpolyQ TBP-HA). Cells were treated as indicated for 48 hr, and levels of recombinant and endogenous TBP were determined by western blot. An asterisk indicates endogenous TBP. A representative result (out of three independent experiments) is shown. (E) A diagram depicting PolyQ-GFP reporter design. (F) Mouse embryonic fibroblasts (MEFs) were transduced with an inducible GFP or PolyQ-GFP construct in a retroviral vector. Cells were treated with complete or amino-acid-free DMEM in presence of doxycycline for 6 hr. GFP fluorescence was measured by FACS. Data are shown as mean ± SD of N = 3 biological replicates. (G) MEFs transduced with the PolyQ-GFP construct in a retroviral vector were treated with doxycycline-containing complete or amino-acid-free DMEM in presence of 1 μM glutaminase inhibitor CB-839, 200 μM L-glutamine + DMSO, or DMSO alone for 6 hr. GFP fluorescence was measured by FACS. Data are shown as mean ± SD of N = 3 biological replicates. p-Values were calculated by one-way ANOVA with Holm-Sidak post-test (B,G) or by paired Student’s t test (F). See also Figure 4—figure supplement 1.
-
Figure 4—source data 1
Summary data and statistics for 5-ethynyl-uridine assays and GFP reporter assays in Figure 4 and Figure 4—figure supplement 1.
- https://cdn.elifesciences.org/articles/62307/elife-62307-fig4-data1-v2.xlsx
Figure 4—figure supplement 1
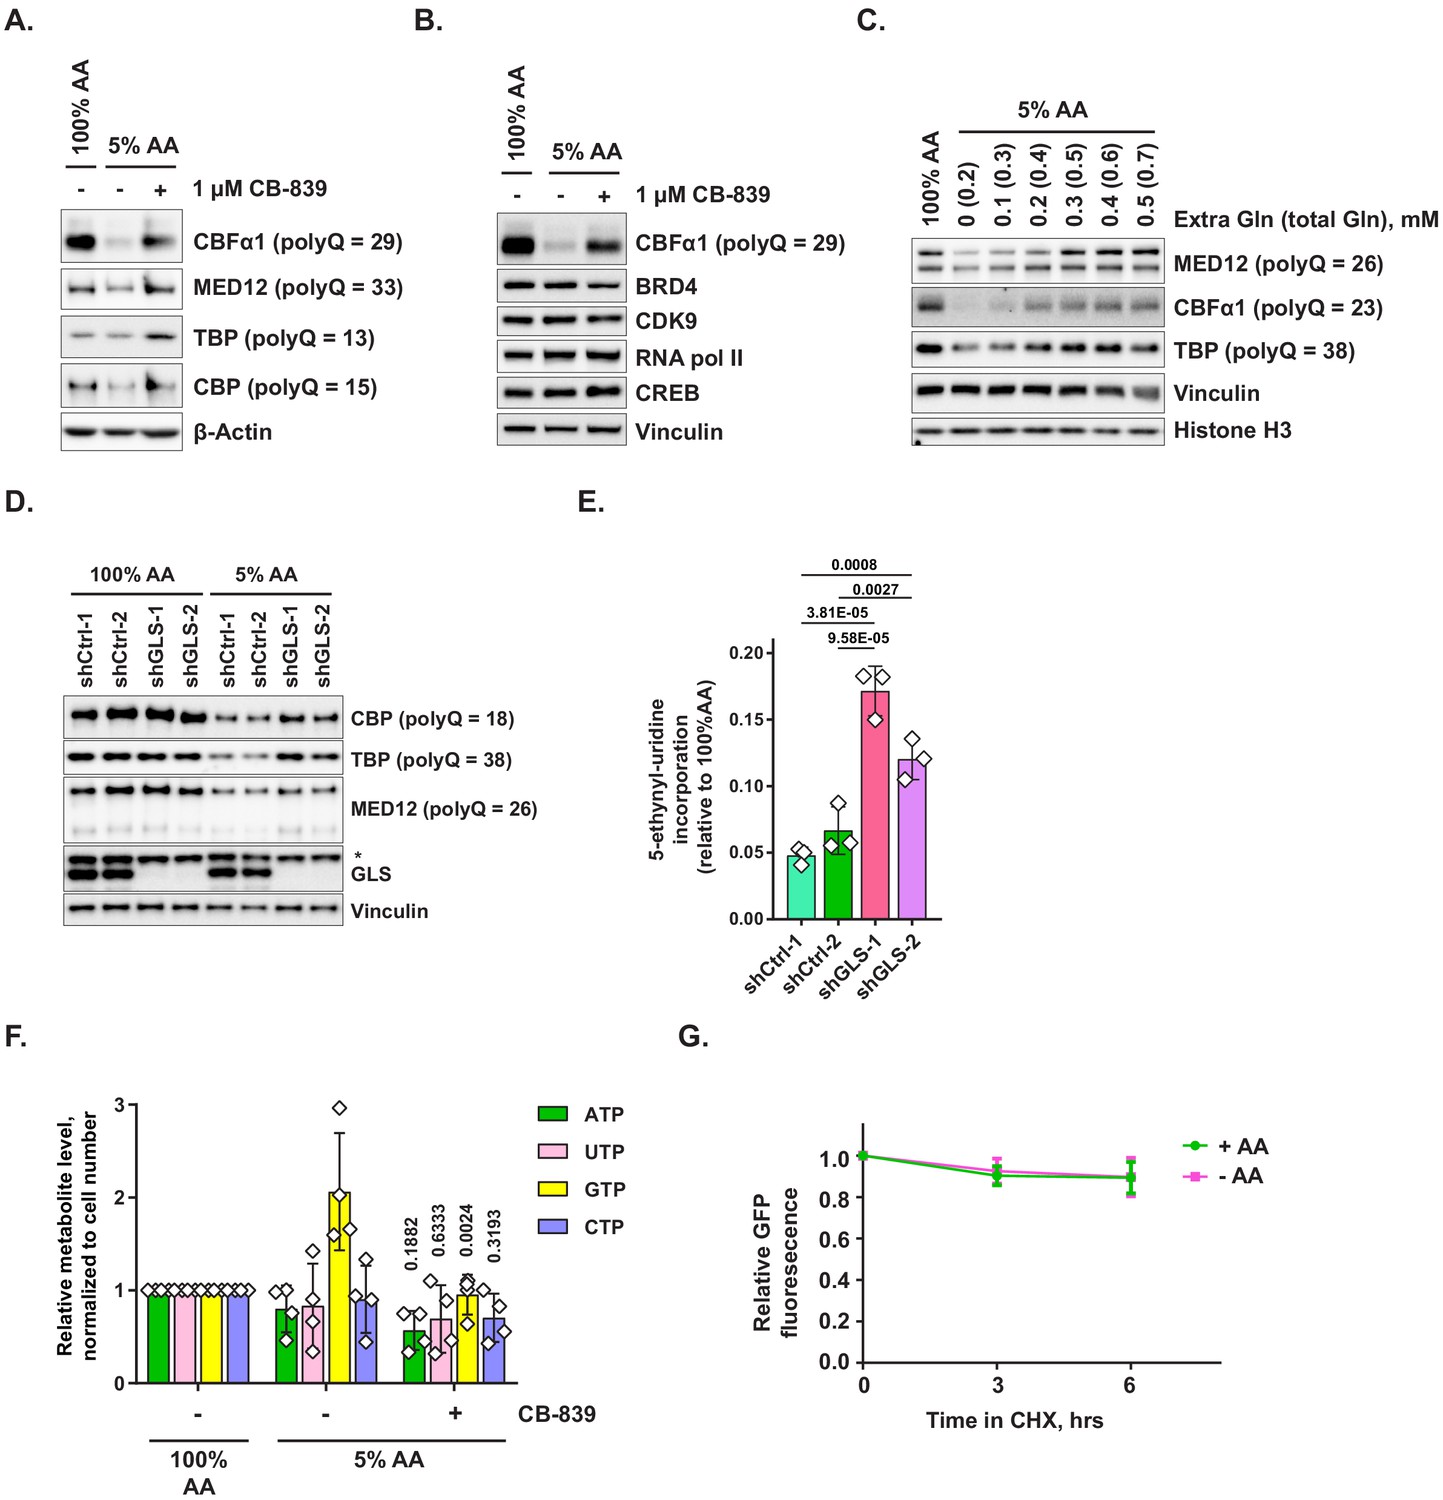
Additional data on the recovery of expression of polyglutamine-tract-containing proteins and cellular transcriptional activity via glutaminase inhibition or glutamine supplementation.
(A) MEFs were treated as shown for 48 hr and harvested for western blotting. Protein levels of indicated polyQ proteins were analyzed by western blotting. A representative result (out of N = 5 independent experiments) is shown. (B) Levels of indicated non-polyQ proteins were determined in cells treated as in (A), with CBF1α serving as a polyQ-containing control. A representative result (out of N = 3 independent experiments) is shown. (C) MiaPaCa2 cells were treated as shown for 48 hr and levels of indicated proteins were analyzed by western blotting. A representative result (out of N = 3 independent experiments) is shown. (D, E) MiaPaCa2 cells transduced with shRNAs against GLS or with control shRNAs were treated for 48 hr as shown. Levels of indicated proteins were assessed by western blotting (D), and transcriptional activity (mean ± SD of independent replicates) was measured via 5-EU incorporation assay (E). The data presented are representative of three independent experiments. An asterisk denotes a non-specific band. (F) MiaPaCa2 cells were treated as indicated for 72 hr and relative levels of ribonucleotide triphosphates were determined by mass spectrometry. Data are shown as mean ± SD of N = 4 biological replicates. p-Values (in comparison with 5% AA condition) were calculated by one-way ANOVA with Holm-Sidak post-test. (G) PolyQ-GFP-transduced MEFs were treated with complete or amino-acid-free DMEM for indicated periods of time in the presence of cycloheximide to block new protein production. GFP fluorescence at indicated time points was measured by FACS. Data are shown as mean ± SD of N = 2 biological replicates. p-Values were calculated by one-way ANOVA with Holm-Sidak post-test (E, F).
Figure 5 with 1 supplement
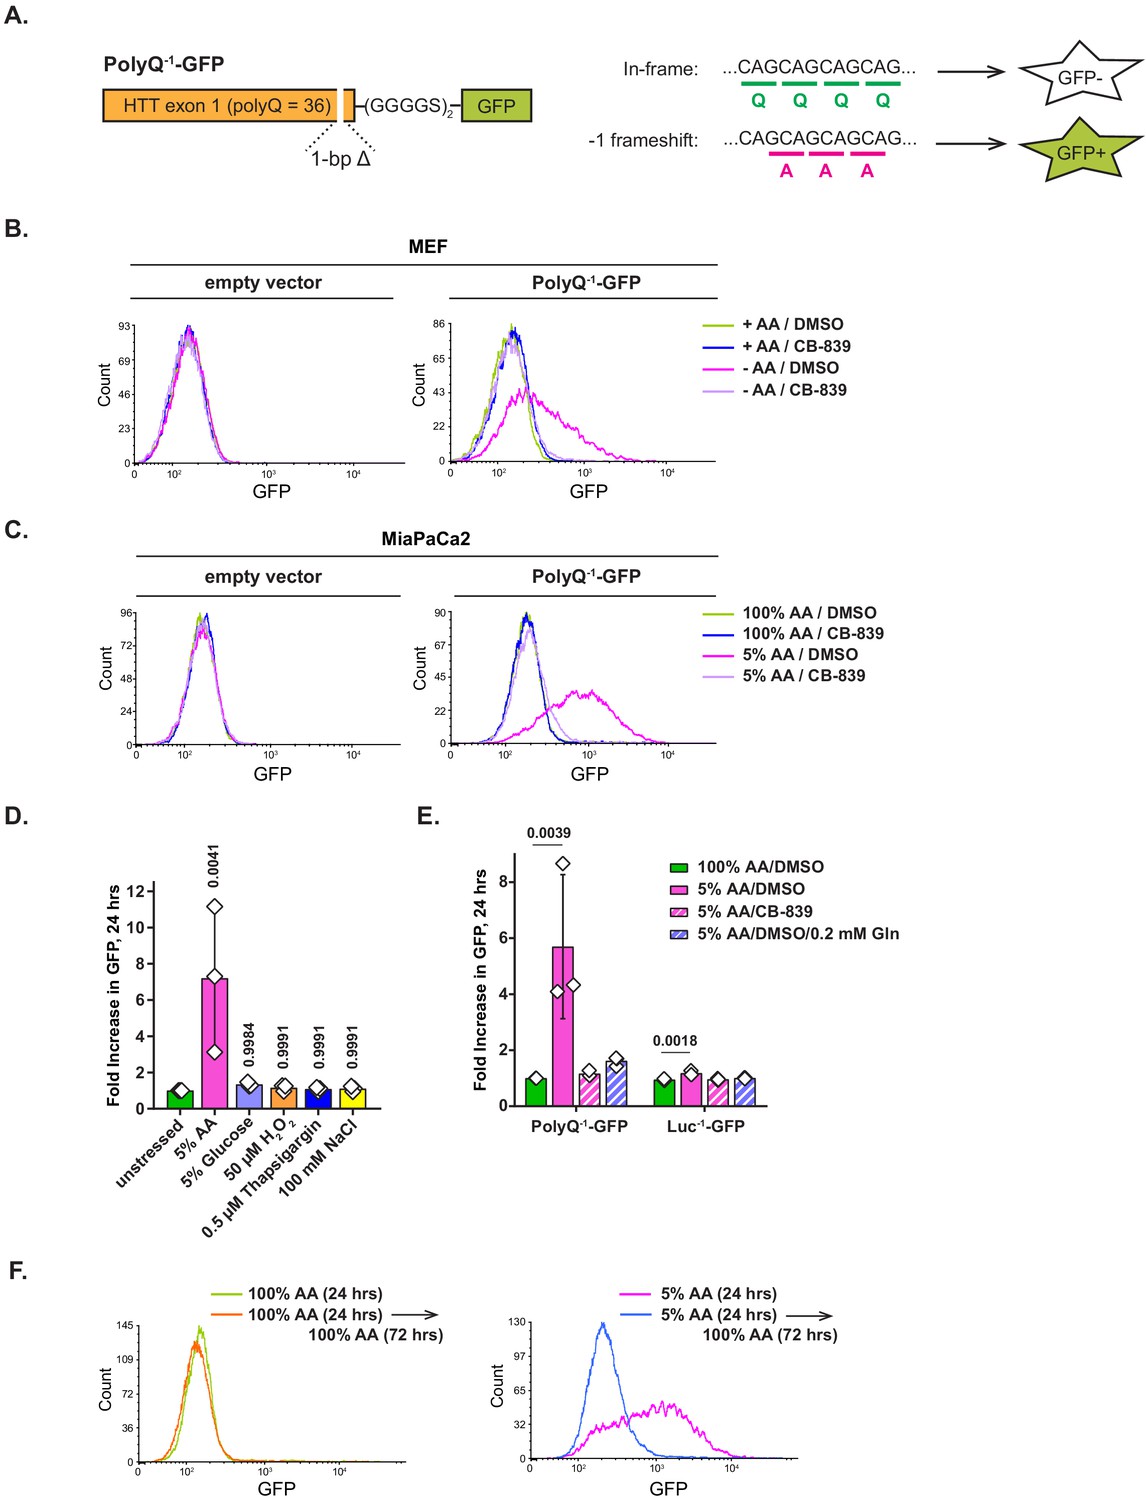
Amino acid depletion triggers frame shifting within polyglutamine-tract-containing proteins, which can be recovered by glutaminase inhibition or glutamine addition.
(A) A diagram depicting PolyQ−1-GFP reporter design and projected outcomes of an in-frame (relative to a (CAG)n stretch) or a −1 frame shifted translation. (B) Mouse embryonic fibroblasts (MEFs) transduced with PolyQ−1-GFP reporter or empty vector control were treated with complete or amino-acid-free DMEM in presence of 1 μM glutaminase inhibitor CB-839 or DMSO for 9 hr. GFP fluorescence was measured by FACS. A representative result (out of three independent experiments) is shown. (C) MiaPaCa2 cells transduced with PolyQ−1-GFP reporter or empty vector control were treated with 100% AA or 5% AA DMEM in presence or absence of 1 μM glutaminase inhibitor CB-839 for 24 hr. GFP fluorescence was measured by FACS. A representative result (out of at least three independent experiments) is shown. (D) MiaPaCa2 cells transduced with PolyQ−1-GFP reporter were exposed to indicated stressors for 24 hr. GFP fluorescence was measured by FACS. Data are shown as mean ± SD of N = 3 biological replicates. (E) MiaPaCa2 cells transduced with PolyQ−1-GFP or Luc−1-GFP reporter were treated as indicated for 24 hr. GFP accumulation was measured by FACS. Data are shown as mean ± SD of N = 3 biological replicates. (F) PolyQ−1-GFP reporter-transduced MiaPaCa2 cells were treated with 100% AA or 5% AA DMEM for 24 hr, then cultured in 100% AA medium for additional 72 hr. GFP fluorescence was measured by FACS. A representative result (out of three independent experiments) is shown. p-Values were calculated by one-way ANOVA with Holm-Sidak post-test (D, E). See also Figure 5—figure supplement 1.
-
Figure 5—source data 1
Summary data and statistics for GFP reporter assays presented in Figure 5 and Figure 5—figure supplement 1.
- https://cdn.elifesciences.org/articles/62307/elife-62307-fig5-data1-v2.xlsx
Figure 5—figure supplement 1
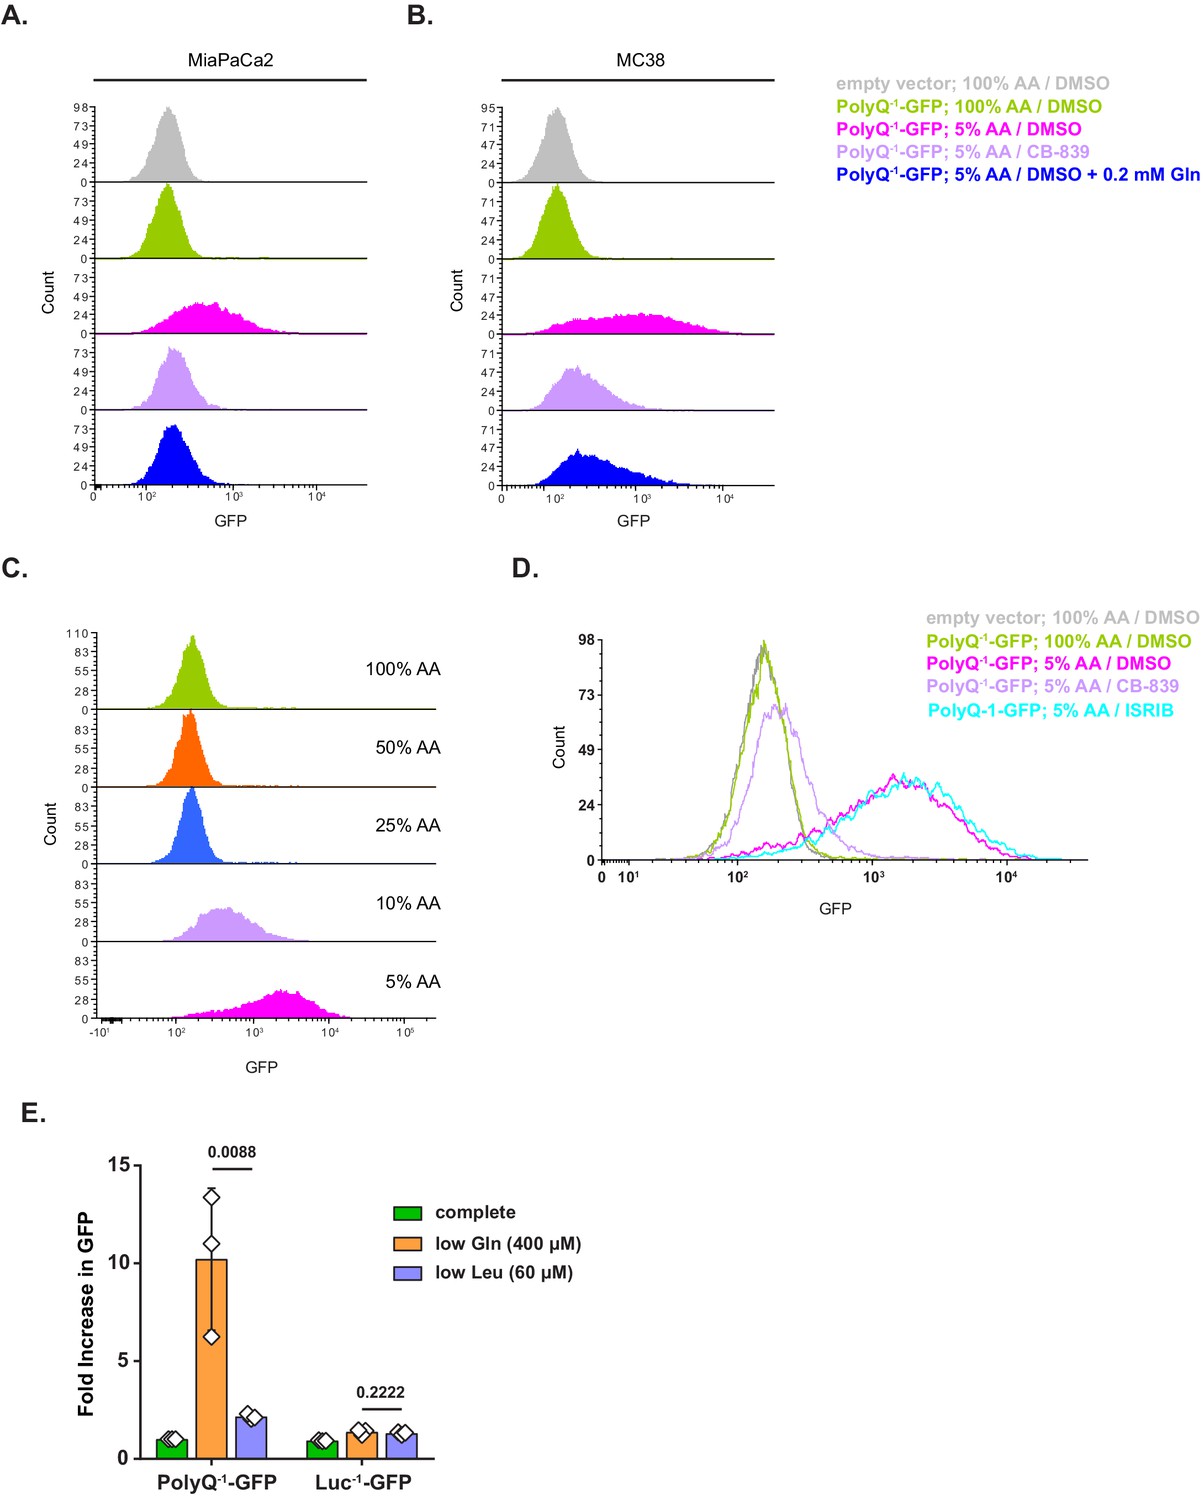
Additional data on the amino acid depletion-triggered translational fidelity loss associated with polyglutamine tracts.
(A, B) PolyQ−1-GFP-transduced MiaPaCa2 (A) or MC38 (B) cells were treated as indicated for 24 hr. GFP accumulation was measured by FACS. A representative result (out of two independent experiments) is shown. (C) PolyQ−1-GFP-transduced MiaPaCa2 cells were treated with DMEM containing indicated levels of amino acids for 24 hr. GFP accumulation was measured by FACS. A representative result (out of two independent experiments) is shown. (D) PolyQ−1-GFP-transduced MiaPaCa2 cells were treated with 100% AA or 5% AA DMEM in presence of 1 μM CB-839, 0.4 μM ISRIB or DMSO as a control for 24 hr. GFP accumulation was measured by FACS. A representative result (out of three independent experiments) is shown. (E) PolyQ−1-GFP- or Luc−1-GFP-expressing MiaPaCa2 cells were treated with indicated media for 48 hr and GFP accumulation was measured by FACS. Data are shown as mean ± SD of N = 3 biological replicates. p-Values were calculated by one-way ANOVA with Holm-Sidak post-test.
Figure 6
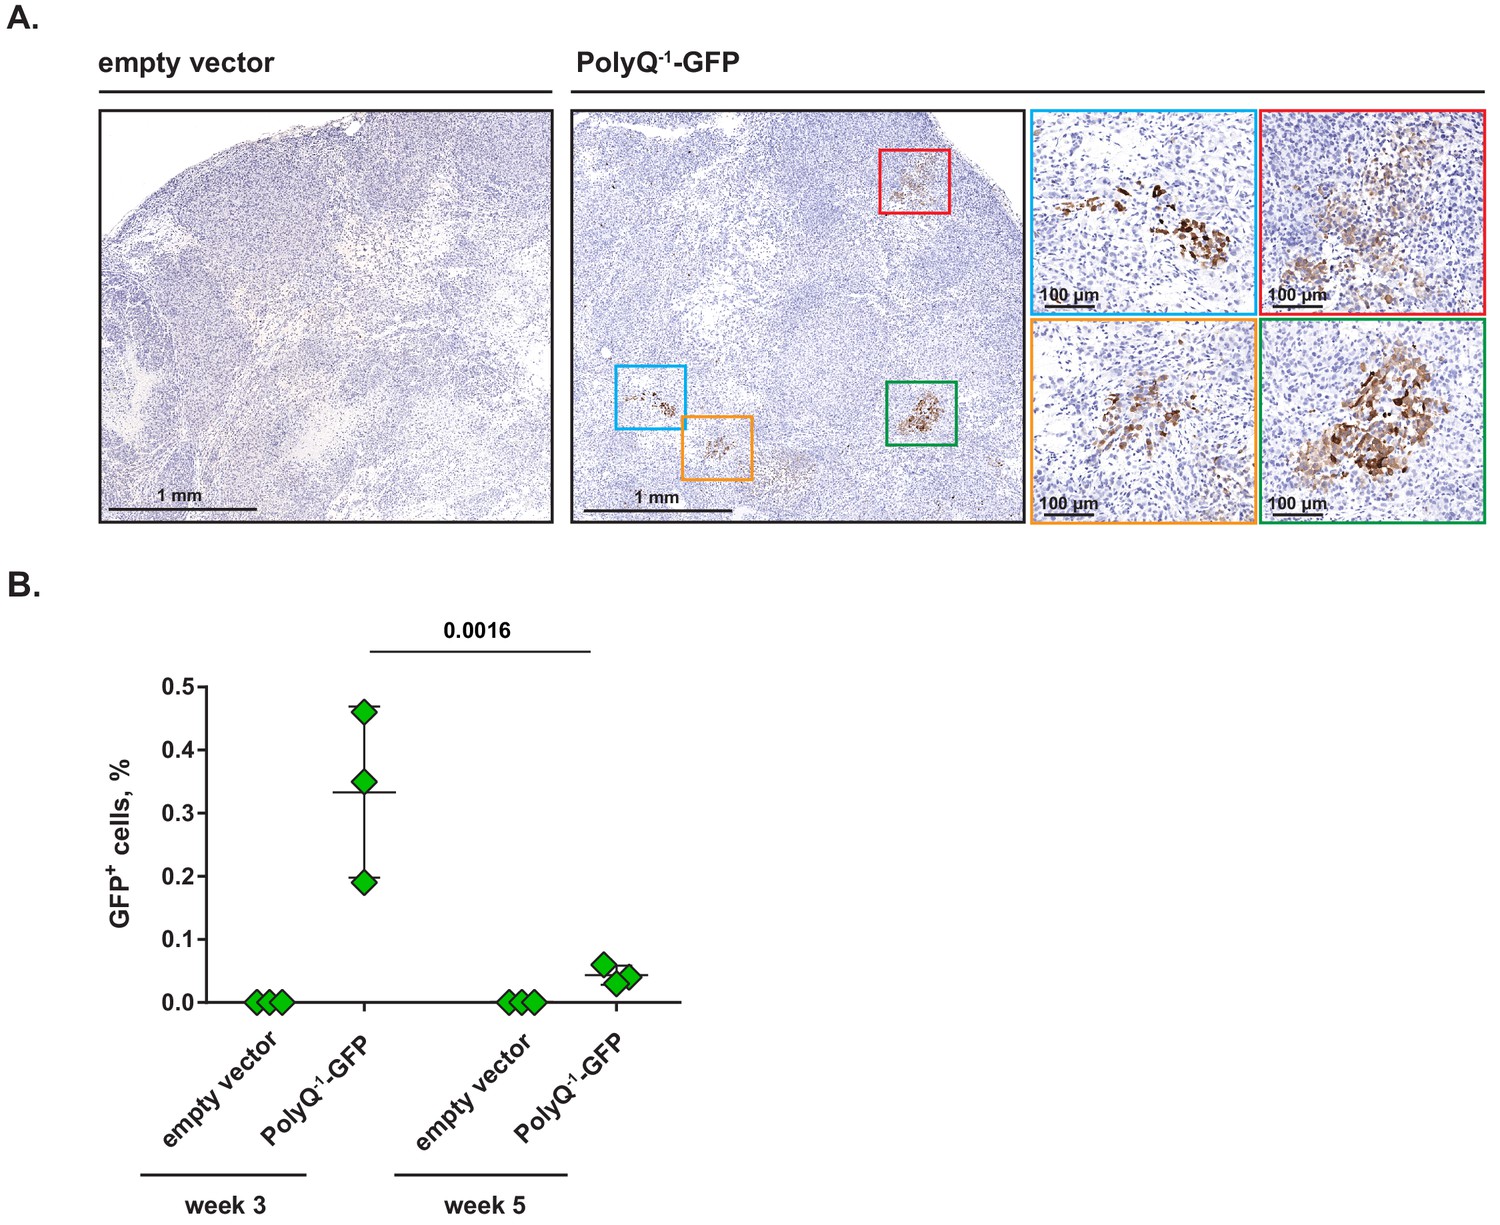
Clusters of cells undergoing frame shifting are detectable within solid tumors in vivo.
(A) MiaPaCa2 cells transduced with PolyQ−1-GFP reporter or empty vector control were injected subcutaneously into nude mice and xenografts were allowed to develop for 3 weeks. Paraffin-embedded samples were stained with anti-GFP antibody. Representative images (out of two independent experiments) are shown. (B) PolyQ−1-GFP reporter or empty vector control-transduced MiaPaCa2 xenografts were allowed to develop for indicated periods of time, harvested and enzymatically dissociated into single-cell suspensions. Relative abundance of GFP-positive cells was determined by flow cytometry. Data are shown as mean ± SD from xenografts harvested from three animals for each time point. p-Values were calculated by two-way ANOVA with Holm-Sidak post-test (B).
-
Figure 6—source data 1
Summary data and statistics for GFP+ cell accumulation assay presented in Figure 6.
- https://cdn.elifesciences.org/articles/62307/elife-62307-fig6-data1-v2.xlsx
Tables
Key resources table
| Reagent type (species) or resource | Designation | Source or reference | Identifiers | Additional information |
|---|---|---|---|---|
| Gene (Homo sapiens) | GLS | GenBank | Gene ID: 2744 | |
| Strain, strain background (Mus musculus, female) | Athymic nude mice | Envigo | Athymic Nude-Foxn1nu, RRID:IMSR_JAX:007850 | |
| Cell line (Mus musculus) | Mouse embryonic fibroblasts (MEFs) | This laboratory | SV40-immortalized; confirmed mycoplasma-free | |
| Cell line (Mus musculus, female) | A20 | ATCC | TIB-208; RRID:CVCL_1940 | confirmed mycoplasma-free |
| Cell line (Mus musculus, female) | MC-38 | Dr. James Hodge laboratory | RRID:CVCL_B288 | confirmed mycoplasma-free |
| Cell line (Homo sapiens, male) | MiaPaCa2 | ATCC | CRL-1420; RRID:CVCL_0428 | Authenticated by STR; confirmed mycoplasma-free |
| Cell line (Homo sapiens, female) | A498 | Dr. James Hsieh laboratory | RRID:CVCL_1056 | Authenticated by STR; confirmed mycoplasma-free |
| Antibody | phospho-Thr899 GCN2, rabbit monoclonal | Abcam | Cat. #ab75836, RRID:AB_1310260 | (1:1000) dilution |
| Antibody | GCN2, rabbit polyclonal | Cell Signaling | Cat. #3302, RRID:AB_2277617 | (1:1000) dilution |
| Antibody | phospho-Thr-389-S6K1, rabbit monoclonal | Cell Signaling | Cat. #9234, RRID:AB_2269803 | (1:1000) dilution |
| Antibody | S6K1, rabbit monoclonal | Cell Signaling | Cat. #2708, RRID:AB_390722 | (1:1000) dilution |
| Antibody | vinculin, mouse monoclonal | Sigma-Aldrich | Cat. #V9131, RRID:AB_477629 | (1:2000) dilution |
| Antibody | ATF4, rabbit polyclonal | Santa Cruz | Cat. #sc-200, RRID:AB_2058752 | (1:250) dilution |
| Antibody | MED12, rabbit polyclonal | Bethyl | Cat. #A300-774A, RRID:AB_669756 | (1:1000) dilution |
| Antibody | TBP, rabbit polyclonal | Bethyl | Cat. #A301-229A, RRID:AB_890661 | (1:1000) dilution |
| Antibody | CBP, rabbit polyclonal | Bethyl | Cat. #A300-362A, RRID:AB_185573 | (1:1000) dilution |
| Antibody | CBFα1, rabbit monoclonal | Cell Signaling | Cat. #12556, RRID:AB_2732805 | (1:1000) dilution |
| Antibody | BRD4, rabbit monoclonal | Abcam | Cat. #ab128874, RRID:AB_11145462 | (1:1000) dilution |
| Antibody | CTCF, rabbit monoclonal | Bethyl | Cat. #A700-041-T, RRID:AB_2883994 | (1:1000) dilution |
| Antibody | RNA pol II, mouse monoclonal | Active Motif | Cat. #39497, RRID:AB_2732926 | (1:1000) dilution |
| Antibody | Histone H3, mouse monoclonal | Cell Signaling | Cat. #3638, RRID:AB_1642229 | (1:1000) dilution |
| Antibody | α-Tubulin, mouse monoclonal | Sigma-Aldrich | Cat. #T9026, RRID:AB_477593 | (1:1000) dilution |
| Antibody | β-Actin, mouse monoclonal | Sigma-Aldrich | Cat. #A5441, RRID:AB_476744 | (1:2000) dilution |
| Antibody | HA tag, mouse monoclonal | Cell Signaling | Cat. #2367, RRID:AB_10691311 | (1:1000) dilution |
| Antibody | Puromycin, mouse monoclonal | EMD Millipore | Cat. #MABE343, RRID:AB_2566826 | (1:500) dilution |
| Antibody | GLS, rabbit monoclonal | Abcam | Cat. #ab156876, RRID:AB_2721038 | (1:1000) dilution |
| Recombinant DNA reagent | pLKO.1-shCtrl1 | Gene Editing and Screening Core, MSKCC | SHC002 | Lentivirus-encoded non-targeting control shRNA |
| Recombinant DNA reagent | pLKO.1-shCtrl2 | Gene Editing and Screening Core, MSKCC | SHC007 | Lentivirus-encoded shRNA targeting luciferase |
| Recombinant DNA reagent | pLKO.1-shGLS-1 | Gene Editing and Screening Core, MSKCC | TRCN0000051136 | Lentivirus-encoded shRNA targeting human GLS |
| Recombinant DNA reagent | pLKO.1-shGLS-2 | Gene Editing and Screening Core, MSKCC | TRCN0000051135 | Lentivirus-encoded shRNA targeting human GLS |
| Recombinant DNA reagent | pTURN-hygro-GFP | This laboratory | Retrovirus-encoded, dox-inducible vector expressing GFP | |
| Recombinant DNA reagent | pTURN-hygro-d2GFP | This laboratory | Retrovirus-encoded, dox-inducible vector expressing d2GFP (GFP fused to a degron of mouse ODC) | |
| Recombinant DNA reagent | pTURN-hygro-PolyQ-GFP | This laboratory | Retrovirus-encoded, dox-inducible vector expressing PolyQ-GFP (GFP) fused to a first exon of human HTT; design details in ‘Reporter Design and Virus Production’ under Materials and methods | |
| Recombinant DNA reagent | pCDH-puro-PolyQ−1-GFP | This laboratory | Lentivirus-encoded frameshift reporter; design details in ‘Reporter Design and Virus Production’ under Materials and methods | |
| Recombinant DNA reagent | pCDH-puro-Luc−1-GFP | This laboratory | Lentivirus-encoded frameshift reporter control; design details in ‘Reporter Design and Virus Production’ under Materials and methods | |
| Sequence-based reagent | tRNA assay 5’-adenylated DNA adaptor | IDT DNA | 5′-/5rApp/TGGAATTCTCGGGTGCCAAGG/3ddC /- 3′ | |
| Sequence-based reagent | 5’-phosphorylated DNA adaptor for CHARGE-seq | IDT DNA | 5’-/5phos/AGATCGGAAGAGCGTCGTGTAGGGA/3ddC /- 3’ | |
| Commercial assay or kit | Click-iT Plus Alexa Fluor 647 Picolyl Azide Toolkit | Thermo Scientific | C10643 | For O-propargyl-puromycin and 5-ethynyl-uridine incorporation assay |
| Chemical compound, drug | L-Valinol | Sigma-Aldrich | 186708 | Used at 2 mM |
| Chemical compound, drug | Cycloheximide | Sigma-Aldrich | C4859 | Used at 10 μg/mL |
| Chemical compound, drug | CB-839 | Selleck Chemicals | S7655 | Used at 1 μM |
| Chemical compound, drug | Bafilomycin A1 | Cayman Chemical | 88899-55-2 | Used at 100 nM |
| Chemical compound, drug | BPTES | Cayman Chemical | 19284 | Used at 10 μM |
| Chemical compound, drug | Compound 968 | Cayman Chemical | 17199 | Used at 10 μM |
| Chemical compound, drug | ISRIB | Sigma-Aldrich | SML0843 | Used at 400 nM |
| Chemical compound, drug | O-propargyl-puromycin | Thermo Scientific | C10459 | Used at 20 μM |
| Chemical compound, drug | 5-ethynyl-uridine | Abcam | ab146642 | Used at 200 μM |
| Other | GtRNA database | PMID:26673694 | RRID:SCR_006939 | Genomic tRNA Database, http://gtrnadb.ucsc.edu |
Additional files
-
Supplementary file 1
Additional oligonucleotide sequences (not listed in the key resources table).
- https://cdn.elifesciences.org/articles/62307/elife-62307-supp1-v2.docx
-
Transparent reporting form
- https://cdn.elifesciences.org/articles/62307/elife-62307-transrepform-v2.pdf
Download links
A two-part list of links to download the article, or parts of the article, in various formats.
Downloads (link to download the article as PDF)
Open citations (links to open the citations from this article in various online reference manager services)
Cite this article (links to download the citations from this article in formats compatible with various reference manager tools)
Translation in amino-acid-poor environments is limited by tRNAGln charging
eLife 9:e62307.
https://doi.org/10.7554/eLife.62307


