Multiplexed proteomics of autophagy-deficient murine macrophages reveals enhanced antimicrobial immunity via the oxidative stress response
- Department of Cancer Immunology, Genentech, United States
- Institute of Biochemistry II, Goethe University, Germany
- Department of Microchemistry, Proteomics and Lipidomics, Genentech, United States
- Khoury College of Computer Sciences, Northeastern University, United States
- Department of Pathology, Genentech, United States
- Department of Oncology Bioinformatics, Genentech, United States
- Department of Translational Immunology, Genentech, United States
- IQ Proteomics LLC, United States
- Department of Mathematical Sciences, Kent State University, United States
- Department of Microbiology and Immunology, Dalhousie University, Canada
- Department of Infectious Diseases, Genentech, United States
- Interline Therapeutics, United States
Figures
Figure 1 with 1 supplement
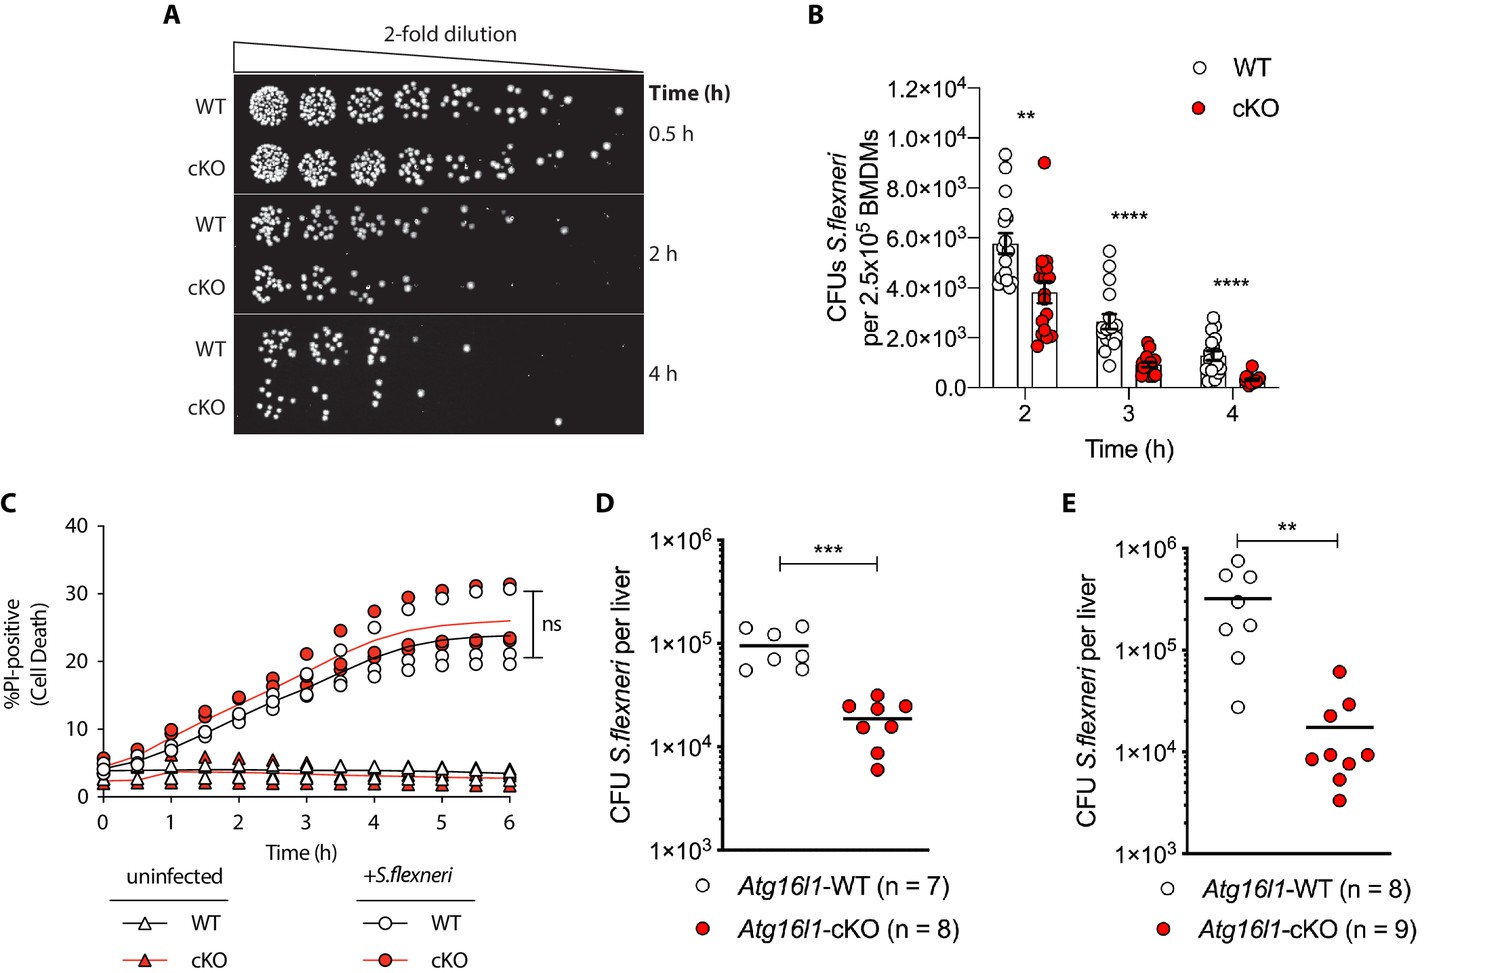
Enhanced clearance of intracellular S.flexneri by loss of Atg16l1.
(A) Representative serial dilutions from gentamycin protection assays following S.flexneri M90T infection of WT or cKO BMDMs at the indicated timepoints. (B) Comparison of colony forming units (CFUs) per well from independent infection experiments using BMDM preparations from Atg16l1-WT or Atg16l1-cKO mice. 2 hr **p=0.002, 3 hr **** p = <0.0001, 4 hr **** p = <0.0001, multiple t-test comparison. (C) Percentage of propidium iodide (PI)-positive cells during time-course infection of WT or cKO BMDMs with S.flexneri M90T. Graph represents individual values from three independent experiments using three different BMDM preparations. ns, non-significant. (D, E) Liver bacterial load 6 hr (D) or 24 hr (E) following intravenous injection of Atg16l1-WT or Atg16l1-cKO mice with S.flexneri M90T. Graphs show data from representative experiments out of two (D) or four (E) independent experiments as log10 CFU count per liver in indicated number of mice. In (D) ***p=0.0002 and in (E) outliers removed using ROUT (Q = 1%) method, **p=0.0031.
Figure 1—figure supplement 1
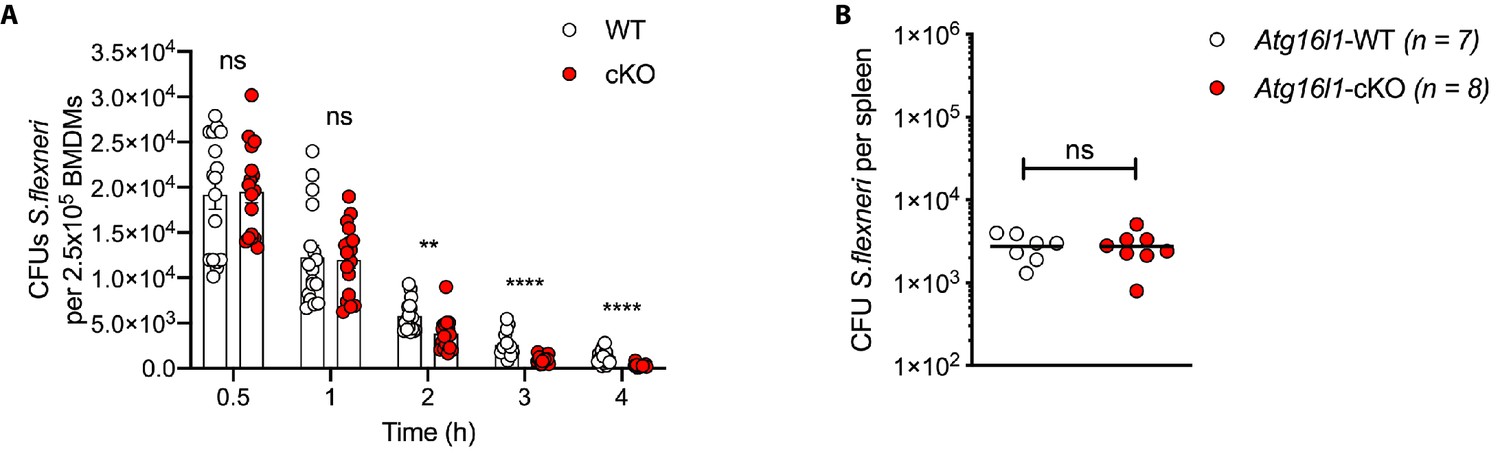
Enhanced clearance of S.flexneri by loss of Atg16l1.
(A) Comparison of CFUs per well from independent infection experiments using BMDM preparations from different Atg16l1-WT or Atg16l1-cKO mice. Data from timepoints 2–4 hr used for Figure 1B. (B) Spleen bacterial load 6 hr following intravenous injection of Atg16l1-WT or Atg16l1-cKO mice with S.flexneri M90T. Graph shows data from a representative experiment out of two different experiments as log10 CFU count per spleen in indicated number of mice. ns, non-significant p=0.99.
Figure 2 with 1 supplement
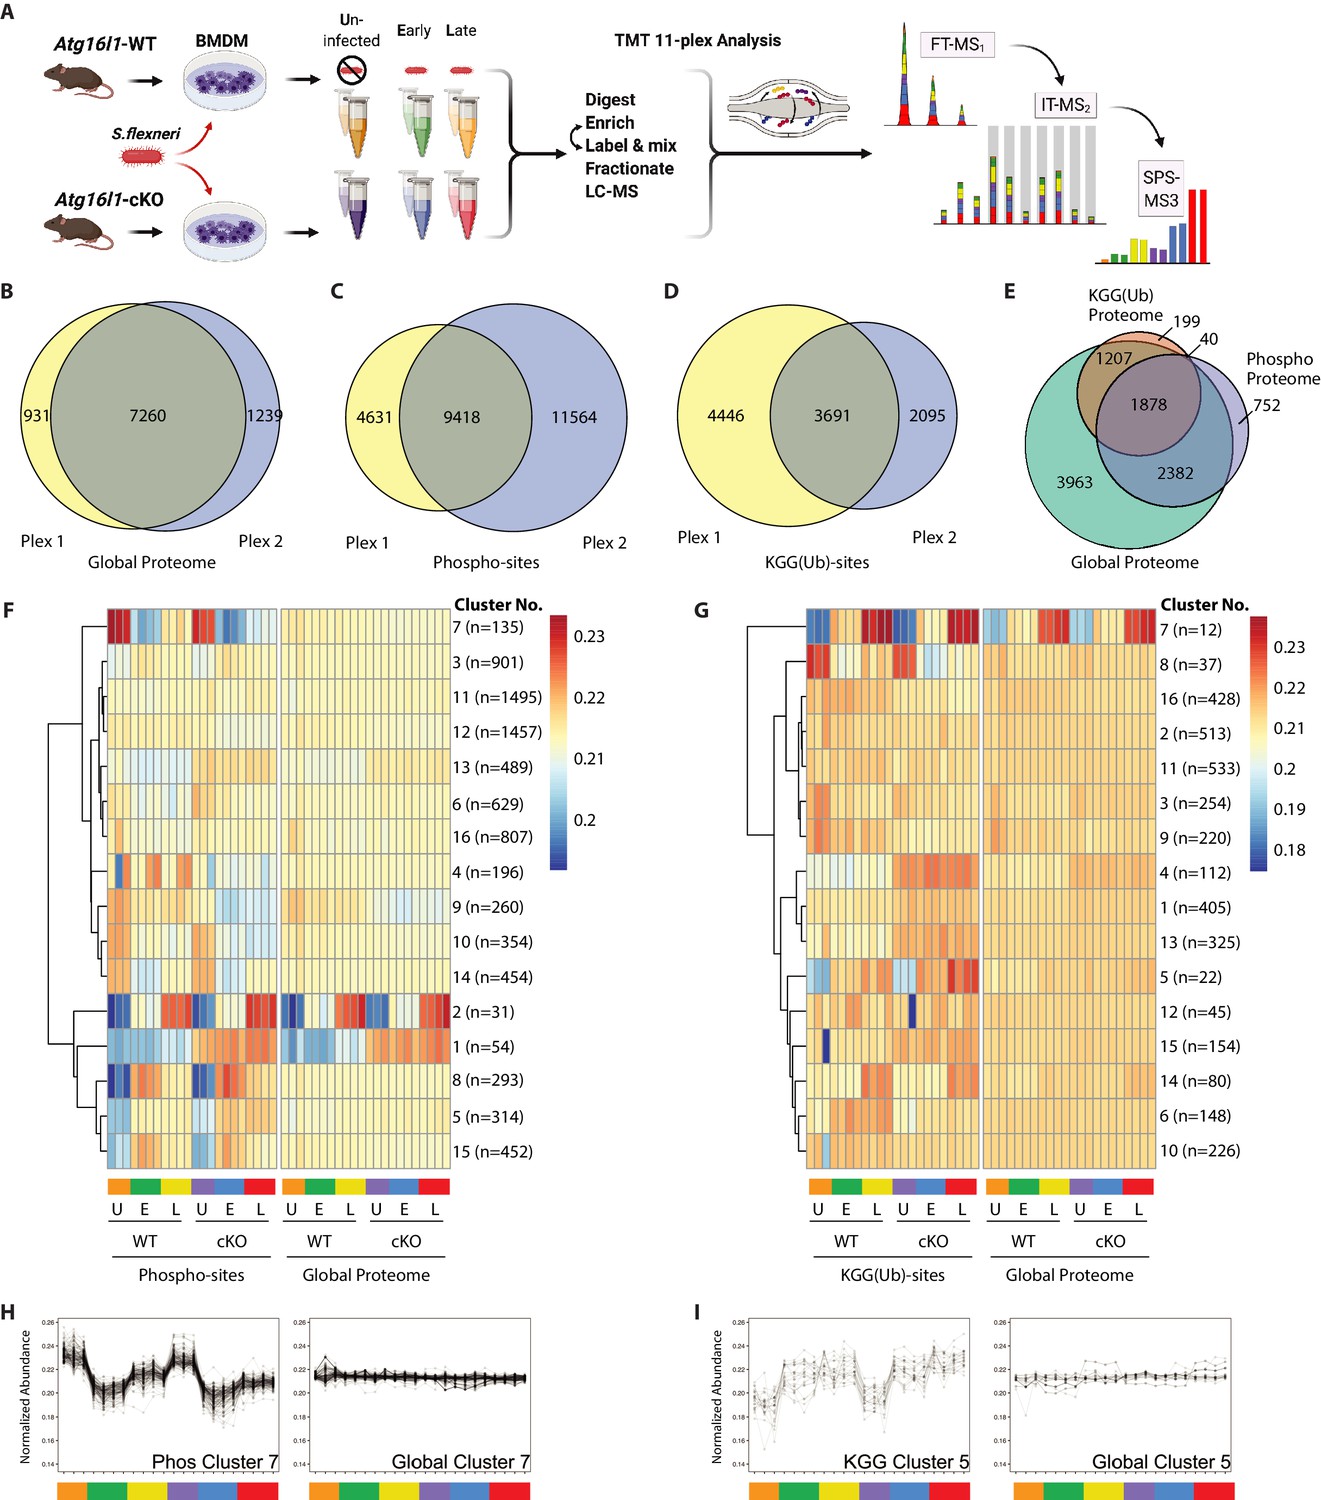
Multiplexed proteomic profiling of BMDMs following infection.
(A) Schematic representation of multiplexed proteomic profiling of macrophages during S.flexneri infection. (B–D) Venn diagrams show overlapping quantitative data collected in Plex1 and/or Plex2 for (B) global proteins, (C) phospho-, and (D) KGG(Ub)-sites. (E) Venn diagram displays an overlap of quantitative data for phospho- and KGG(Ub)-sites with respect to the global proteins quantified. (F and G) Heatmaps displaying K-means clustered quantitative data for (F) phospho- and (G) KGG(Ub)-sites relative to their corresponding global proteins. Note that the global proteins subjected to clustering differ between panels F and G based on the proteins from which PTMs were quantified. (H, I) Line plots show representative clusters from the Heatmaps above. Phospho Cluster 7 (panel H) and KGG(Ub) Cluster 5 (panel I) each show PTM profiles that diverge from their corresponding global protein measurements. Proteins and PTMs making up each cluster are presented in Supplementary file 1.
Figure 2—figure supplement 1
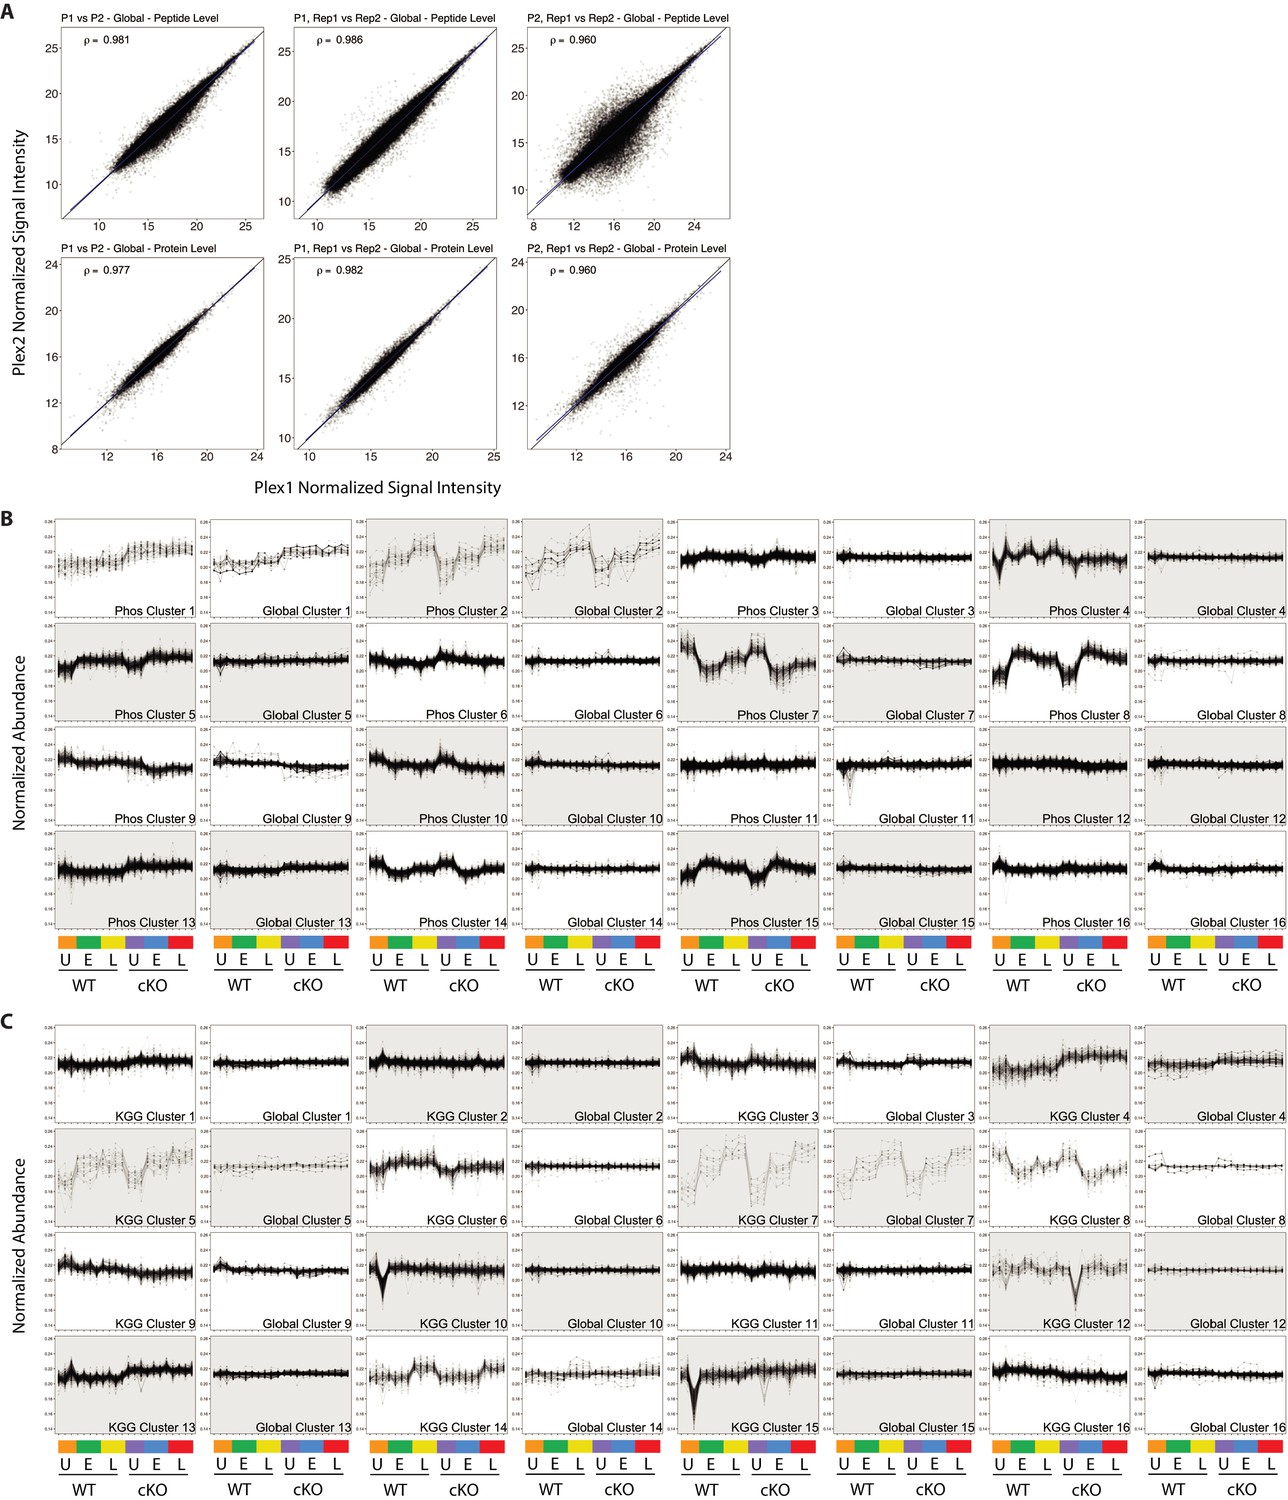
Quality control and PTM-Global comparative analysis of proteomics data.
(A) Scatterplots showing normalized signal intensity from the global proteome analysis. Peptide (upper row) and protein (lower row) level data stemming from MSstatsTMT modeling are displayed. Plots in the first column compare Plex one versus Plex 2, where data from intra-plex duplicates was aggregated during modeling. Plots in the middle and right columns compare intra-plex duplicate samples within Plex1 (middle) or Plex2 (right). Pearson correlations are shown for each contrast. (B and C) Line plots showing all 16 K-means clusters corresponding to the Phospho-Global (F) and KGG(Ub)-Global (G) heatmaps displayed in Figure 2. The background shading for each pair of line plots is toggled to highlight pairing between Phos/KGG and global protein clusters.
Figure 3 with 1 supplement
A global overview of changes identified between the genotypes and upon infection.
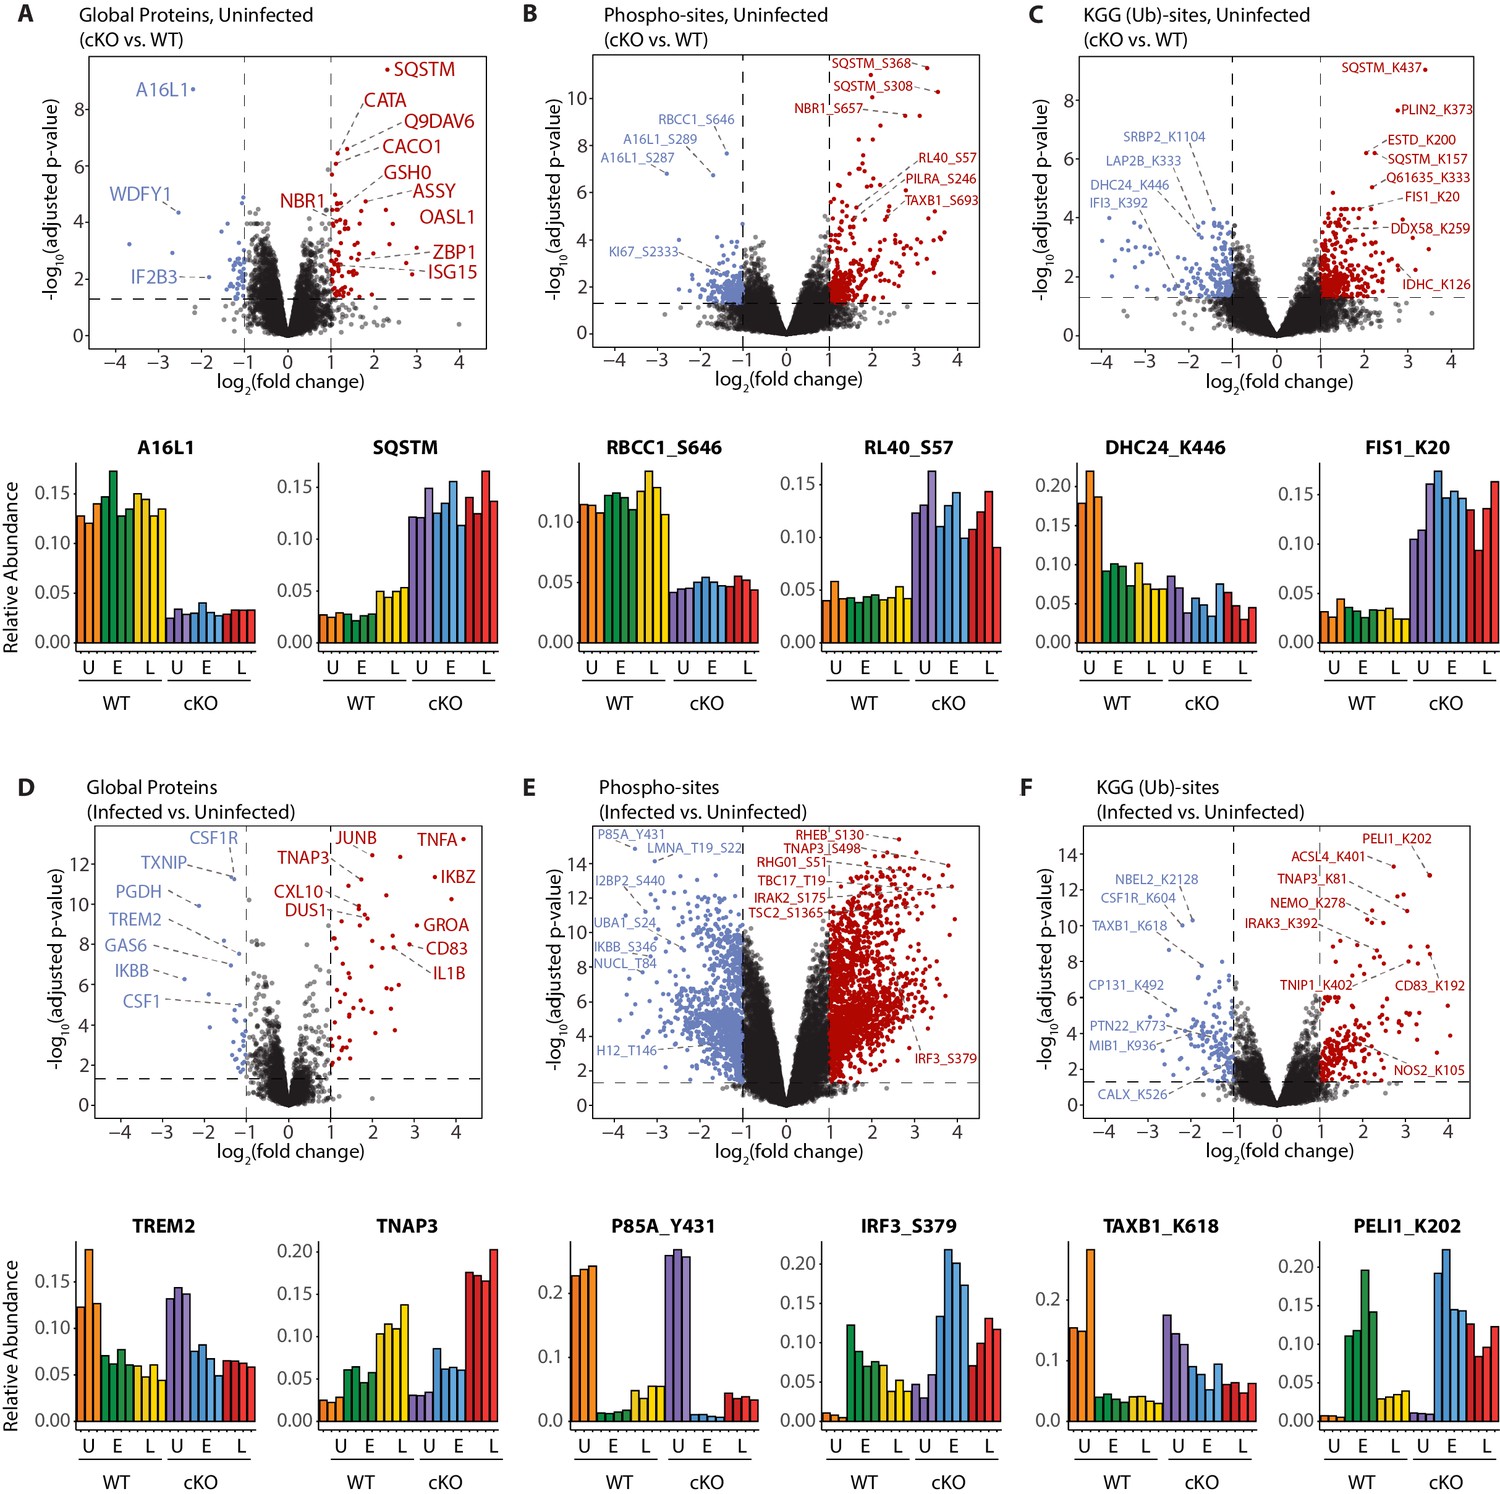
(A–C) Volcano plots showing differential expression of global proteins (A), phospho- (B) and KGG(Ub)-sites (C) between uninfected cKO vs. WT BMDMs. Volcano plots display log2 fold changes and -log10 transformed adjusted p-values for the host proteome. Bar graphs at the bottom of each panel represent top hits with positive and negative log2 fold changes. Uninfected (U) samples are shown with orange (WT) and purple (cKO), early infection (E) in green (WT) and blue (cKO) and late infection (L) in yellow (WT) and red (cKO), respectively. Protein names are shown as UniProt identifiers with modification sites indicated by the modified amino acid (S/T/Y/K) and residue number (e.g. RL40_S57). Features enriched in cKO and WT BMDMs are highlighted in red and blue, respectively. (D–F) Volcano plots displaying differentially expressed global proteins (D), phospho- (E) and KGG(Ub)-sites (F) between infected and uninfected BMDMs. Infected refers to the aggregate condition in which early and late infected samples for WT and cKO are each weighted as 0.25 relative to 0.5 each for the WT and cKO uninfected samples. Features enriched in infected and uninfected BMDMs are highlighted in red and blue, respectively. As above, bar graphs below each panel show example hits. The relative abundance of TMT reporter ions sums up to 2.0 for features quantified in both Plex1 and Plex2.
Figure 3—figure supplement 1
Dynamic macrophage response to infection.
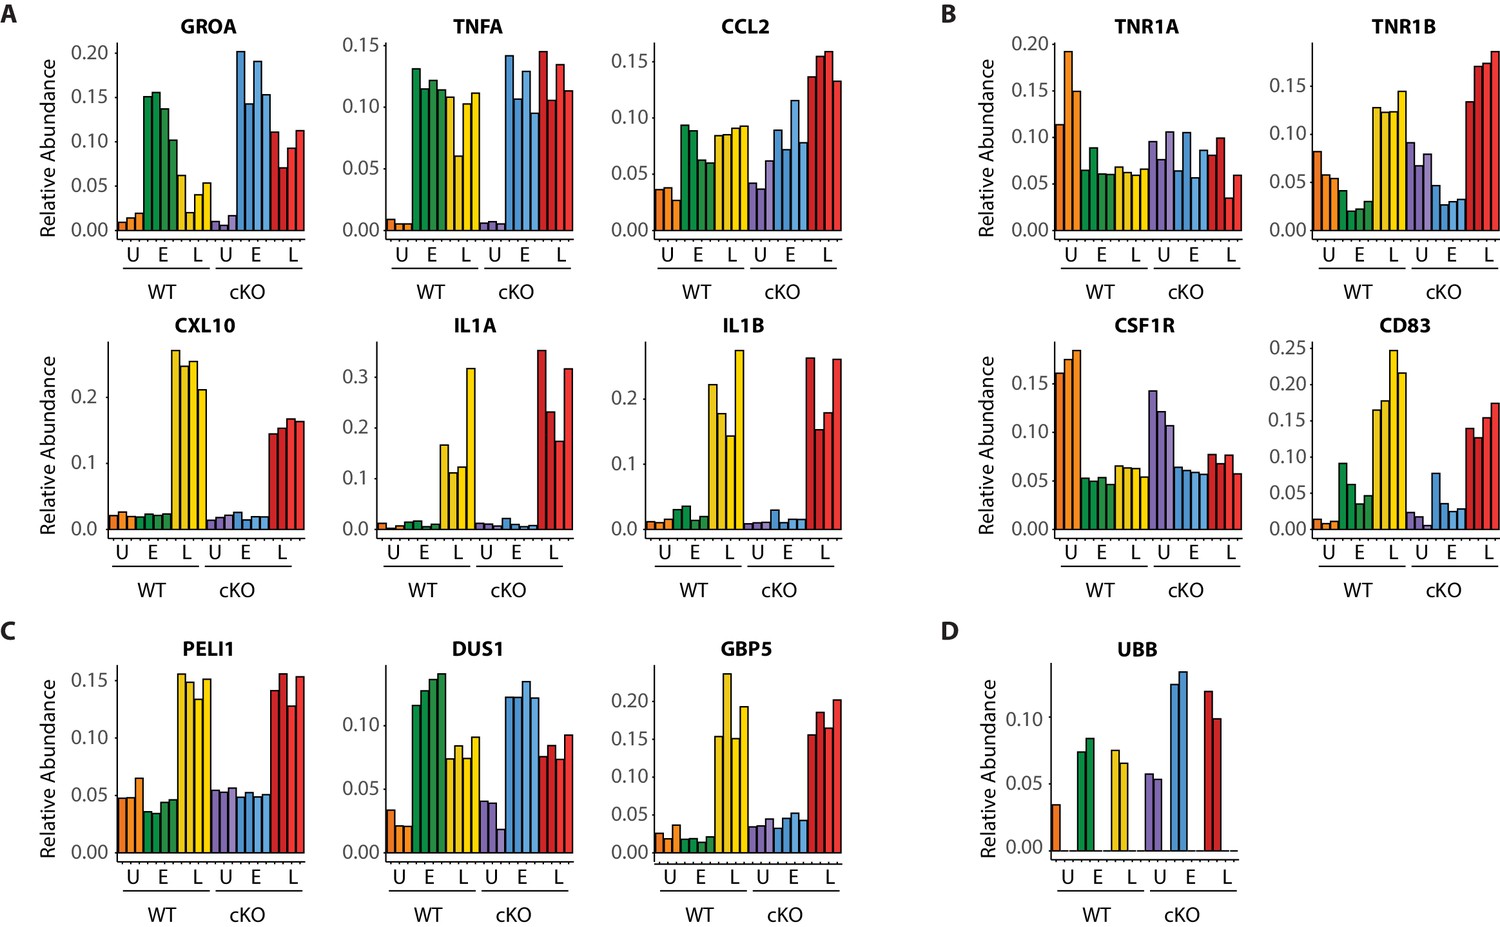
(A–D) Bar graphs showing quantitative changes for representative pro-inflammatory cytokines and chemokines (A), cell surface receptors (B), components of innate immune signaling (C) and linear ubiquitin chains as represented by UBB (D).
Figure 4 with 3 supplements
Characterization of proteomic changes in the autophagy pathway.
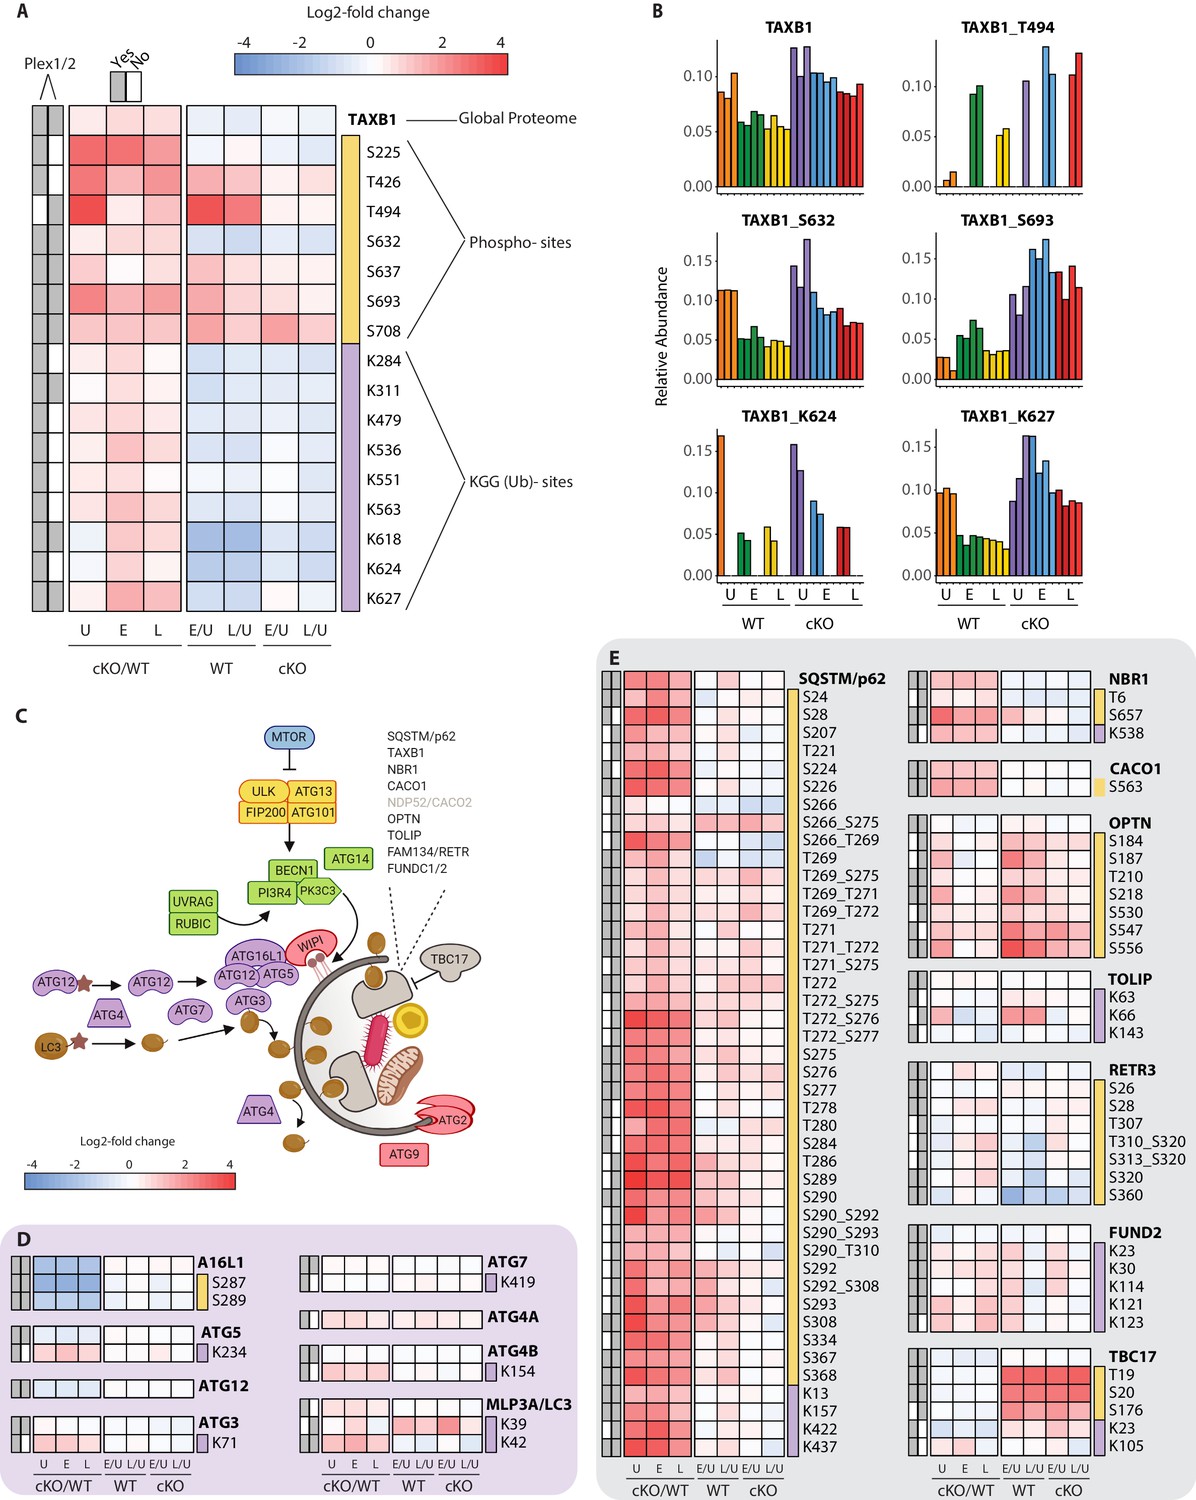
(A) Heatmap representation of log2 fold changes for global proteome (unmarked), phospho-(yellow section) or KGG(Ub)-sites (purple section) measurements made for TAXB1. Data are shown for features quantified from uninfected (U) WT and cKO BMDMs or cells infected at early (E) or late (L) time-points with S.flexneri. Log2 transformed ratios are shown for contrasting genotypes (cKO/WT) at each infection timepoint (U, E, L) on the left and between infection timepoints (E/U and L/U) within each genotype on the right. Gray boxes denote quantification of the feature in Plex1 and/or Plex2. Modification sites on TAXB1 denote the modified amino acid (S/T/Y/K) and residue number. (B) Bar graphs showing the relative abundance of TAXB1 global protein and representative phospho- and KGG(Ub)-sites in each of the six conditions. Note that TAXB1_K624 (Plex1) and TAXB1_T494 (Plex2) represent data collected only in a single Plex, with the relative abundance of TMT reporter ions summing up to 1.0. (C) Schematic representation of macro-autophagy and selective autophagy machinery. (D and E) Heatmap representations of E1/E2/E3-like pathway components responsible for conjugating LC3 (MLP3A) to regulate autophagosome membrane elongation (D) and selective autophagy receptors (E). The background shading for each panel corresponds to the functional color coding of proteins in the pathway schematic shown in (C). See Supplementary file 2 for a curated list of PTMs.
Figure 4—figure supplement 1
Extended analysis of proteomic changes in the autophagy pathway.
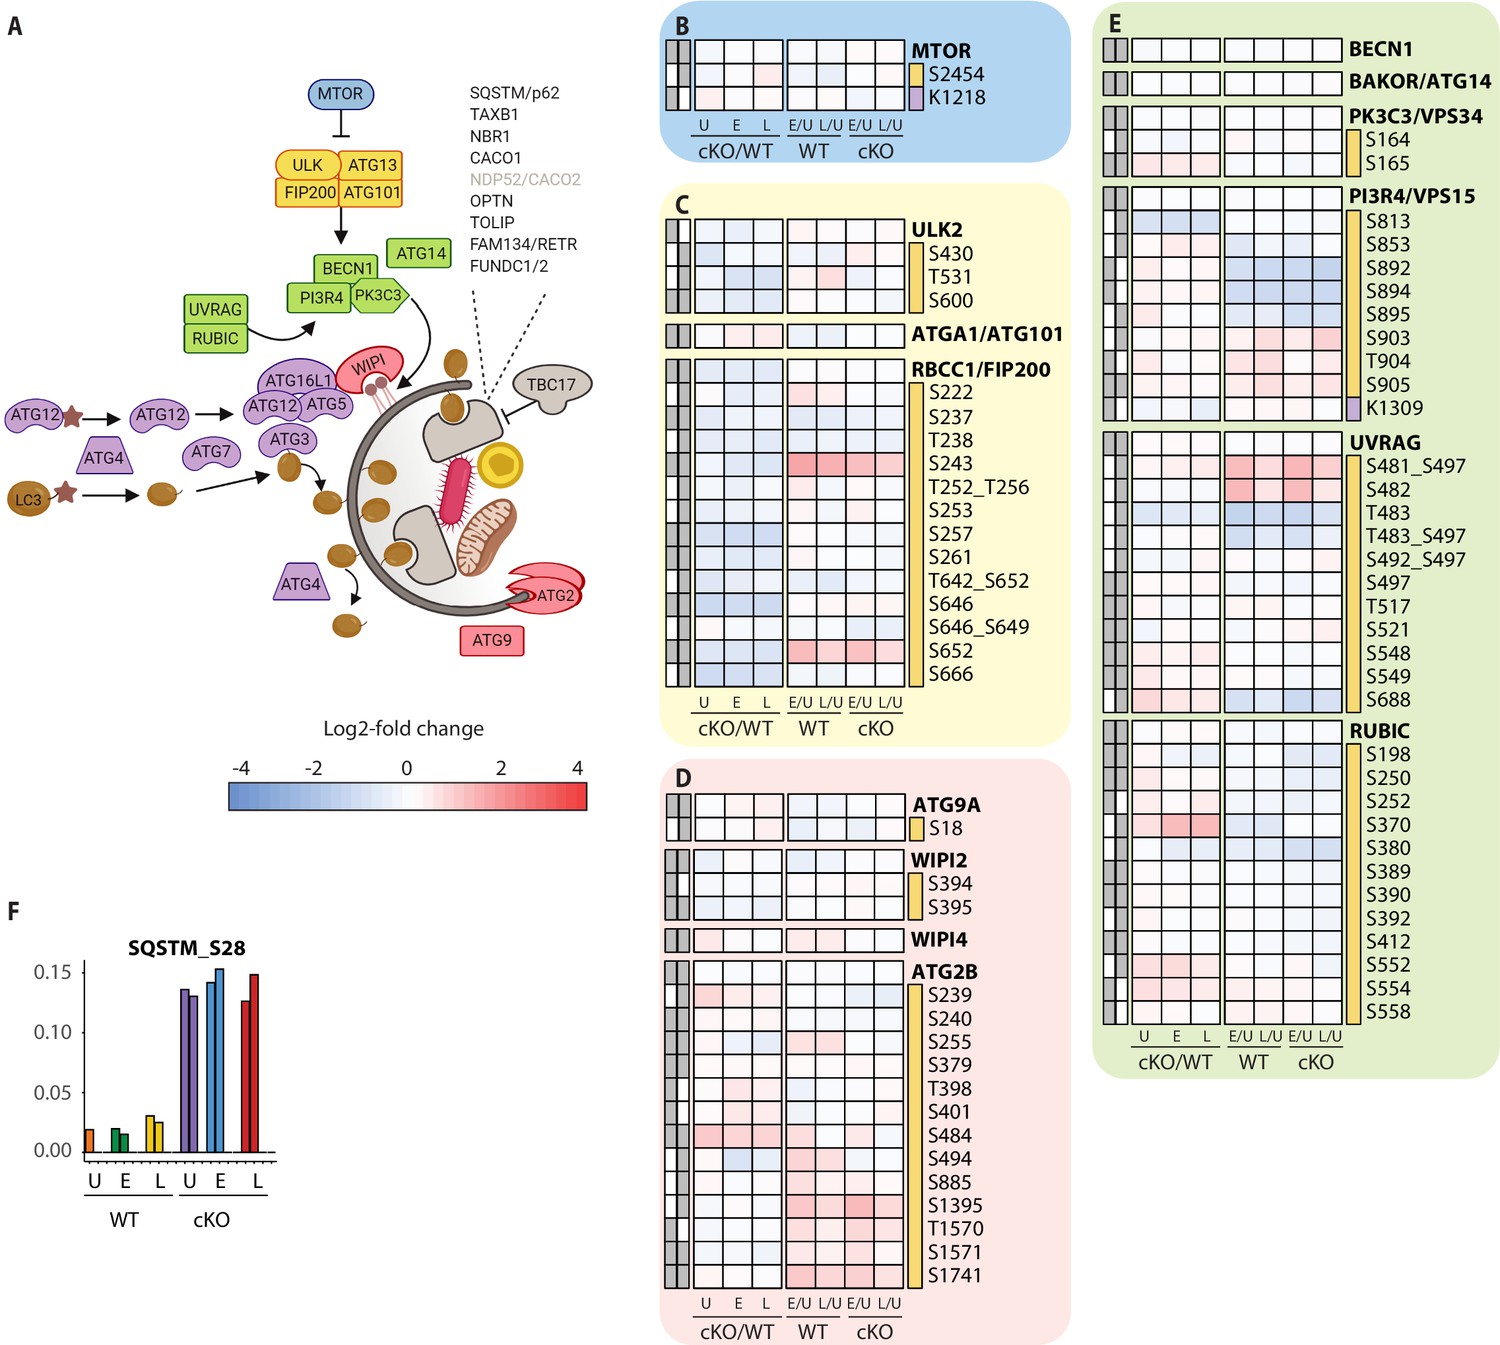
(A) Schematic representation of macro-autophagy and selective autophagy machinery as shown in Figure 4C. (B–E) Heatmap representations of mTOR (B), ULK complex (C), membrane recruitment and closure (D), and PIK3C3/Vps34 complexes (E) are shown. The background shading for each panel corresponds to the functional color coding of proteins in the pathway schematic shown in (A). (F) Bar graph showing phosphorylation on autophagy receptor p62 (SQSTM_S28). For a curated list of PTMs see Supplementary file 2.
Figure 4—figure supplement 2
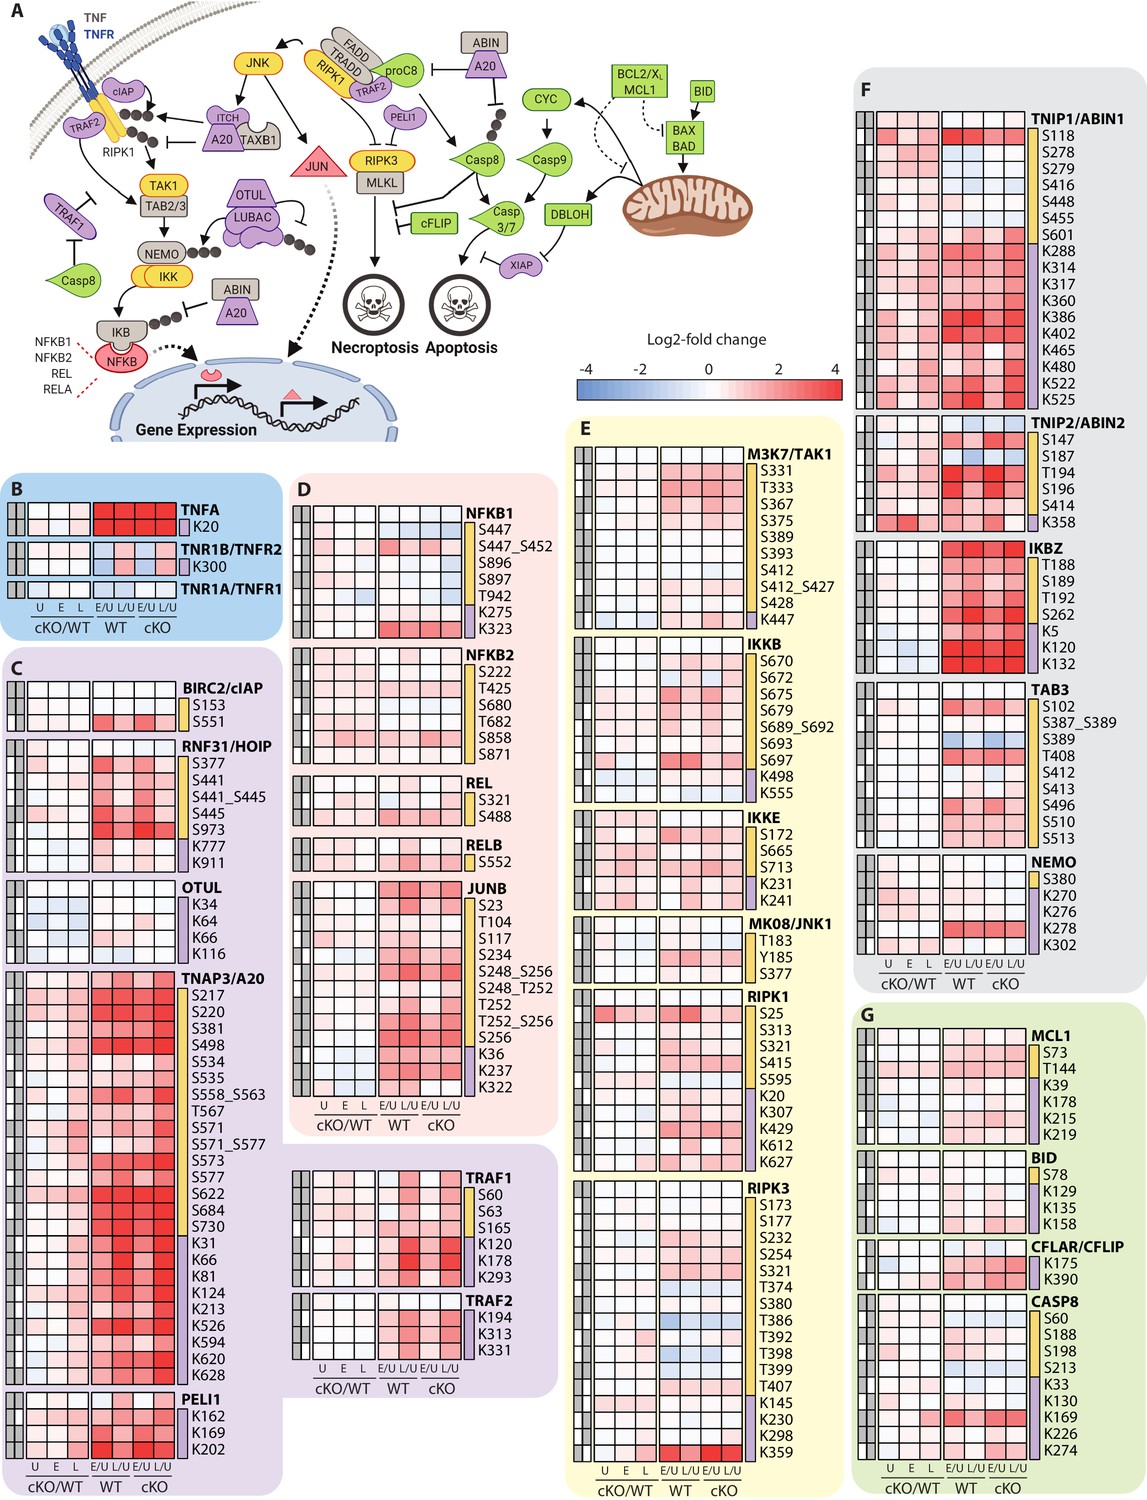
Characterization of proteomic changes in inflammatory signaling nodes.
(A) Schematic representation of key components in the inflammatory signaling and programmed cell death pathways analyzed in this study. (B–G) Heatmap representations of TNF and its receptors (B), E3 ubiquitin ligase and deubiquitinase enzymes (C) and transcription factors (D), kinases (E), signaling adaptors (F), and apoptosis regulatory proteins (G). The background shading for each panel corresponds to the functional color coding of proteins in the pathway schematic shown in (A). For a curated list of PTMs see Supplementary file 3.
Figure 4—figure supplement 3
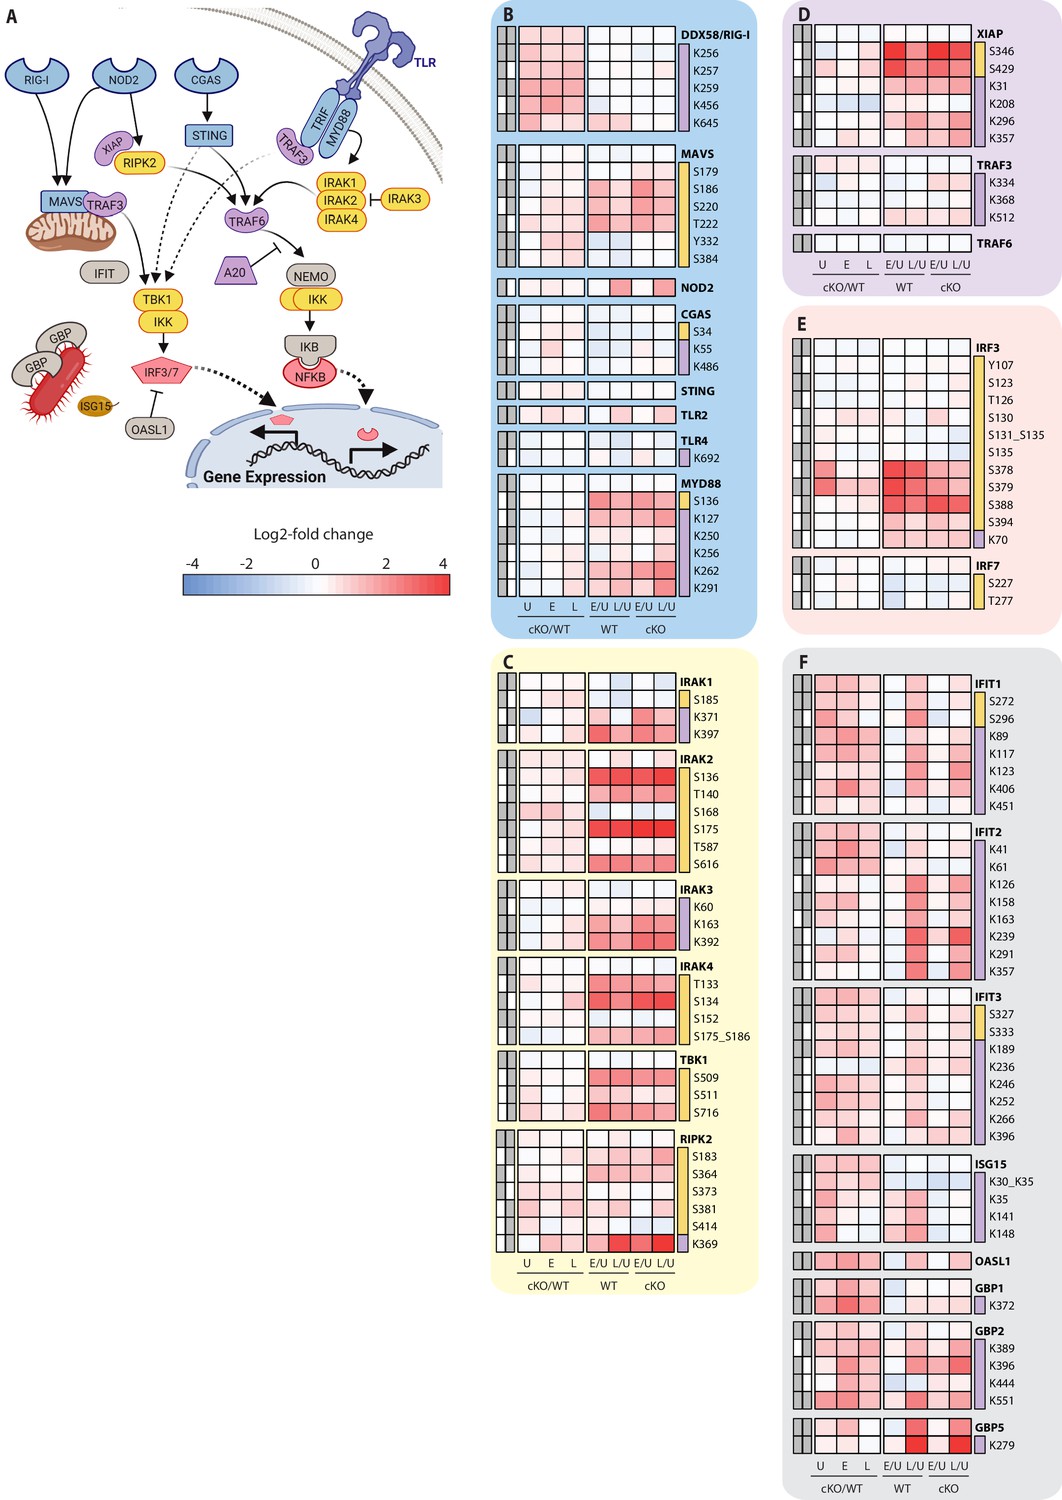
Analysis of proteomic changes in innate sensing and the interferon response.
(A) Schematic representation of innate sensors and inflammatory signaling components analyzed in this study. (B–F) Heatmap representations of microbe-associated molecular pattern receptors and adaptors (B), kinases (C), E3 ubiquitin ligases (D), transcription factors (E), and interferon response genes (F) are shown. The background shading for each panel corresponds to the functional color coding of proteins in the pathway schematic shown in (A). For a curated list of PTMs see Supplementary file 3.
Figure 5 with 3 supplements
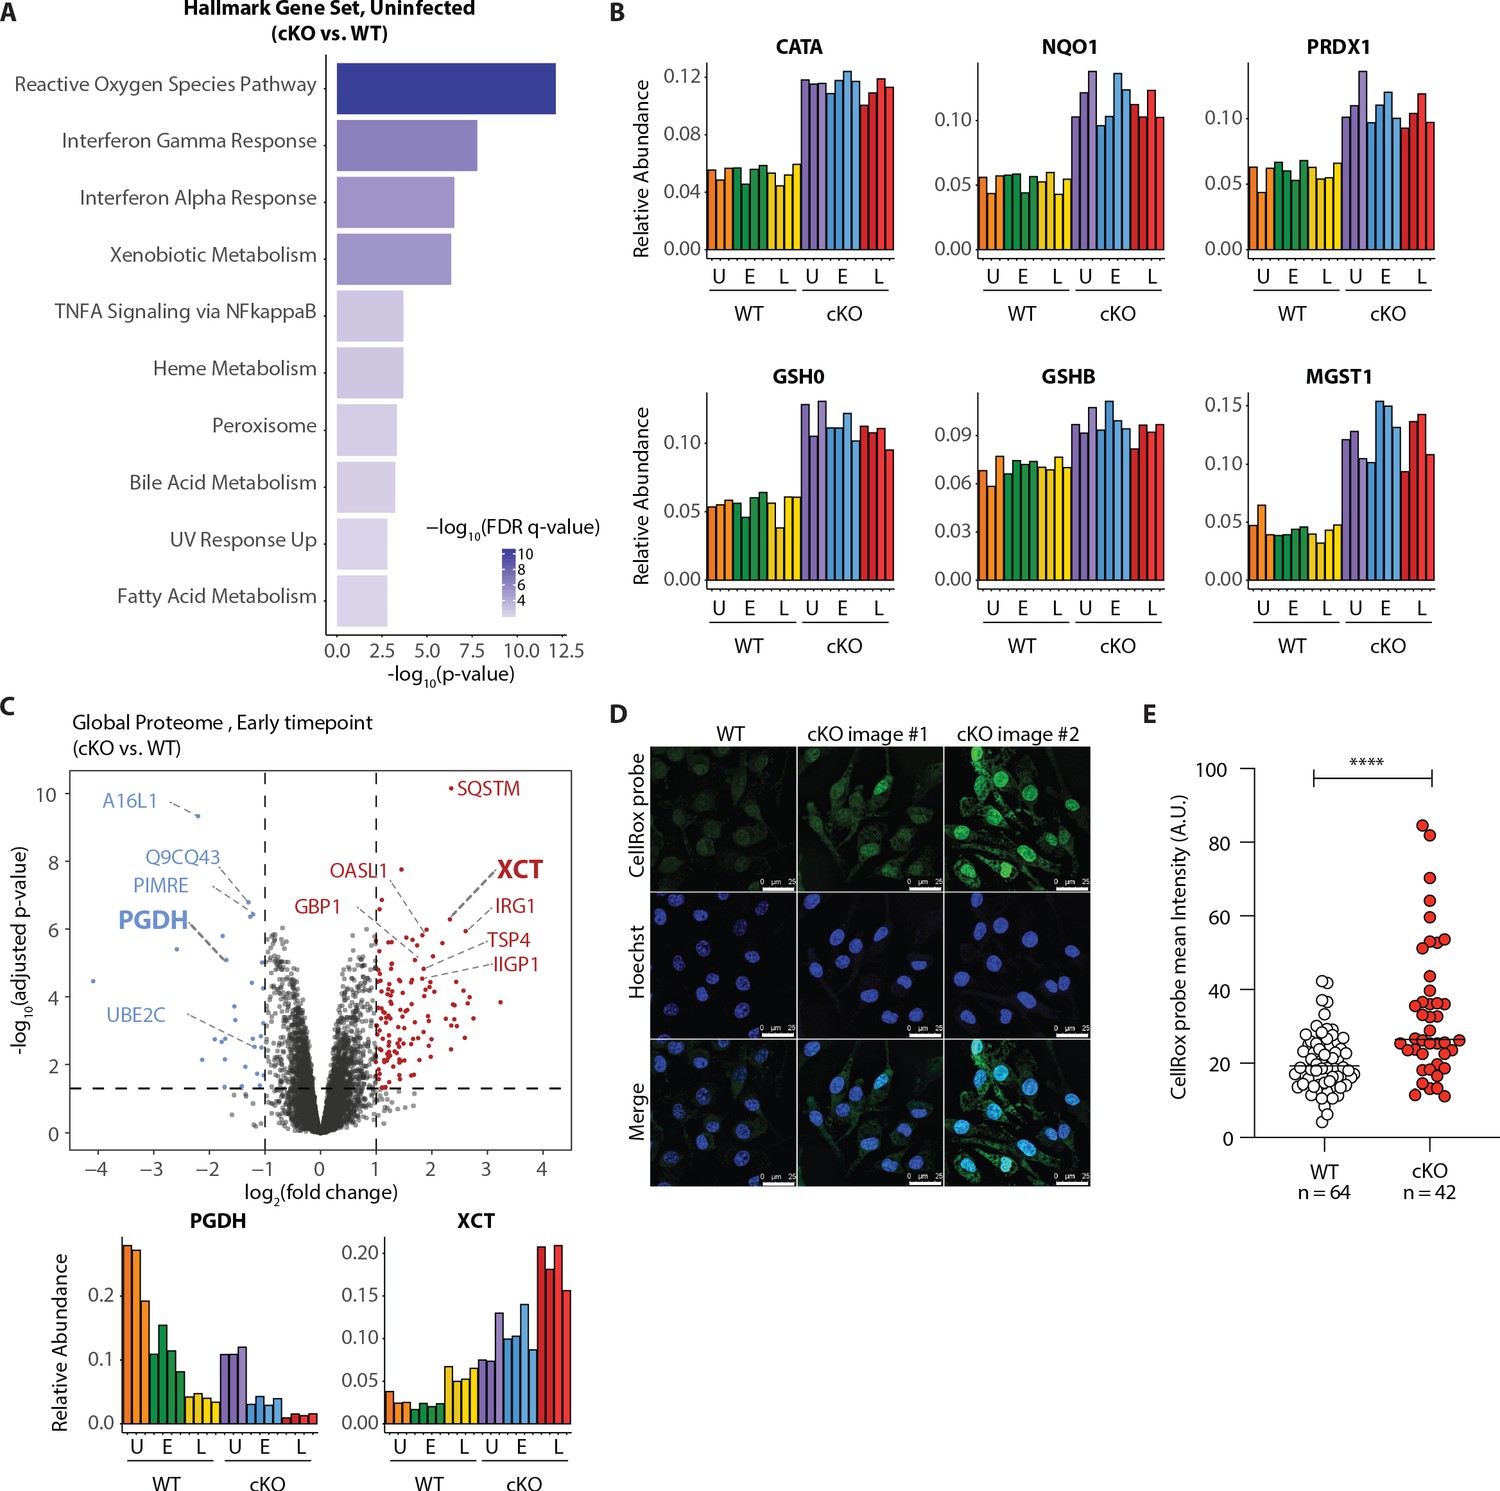
Elevated oxidative stress in ATG16L1-deficient BMDMs.
(A) Gene set enrichment analysis (GSEA) of global proteome data showing Hallmark gene sets overrepresented in uninfected cKO over WT BMDMs. (B) Bar graphs show the relative abundances for selected proteins involved in redox regulation and detoxifying reactive oxygen species. (C) Volcano plot of global protein changes at early infection timepoint between the genotypes. Proteins enriched in cKO and WT BMDMs are highlighted in red and blue, respectively. Bar graphs showing the cumulative effects of genotype and infection on PGDH and XCT protein levels are shown below. (D) Representative images from experiments shown in (E) demonstrating CellRox probe intensity, Hoechst nuclear staining and merged images (scale bar 25 μM). (E) Quantification of CellRox green mean intensity in WT and cKO BMDMs. Graph shows single cell data representative of three independent experiments. Unpaired t test ****p<0.0001.
Figure 5—figure supplement 1

GSEA analysis of global proteome, phospho-, and KGG(Ub) datasets.
(A) Gene set enrichment analysis (GSEA) of global proteome data showing Hallmark gene sets overrepresented across different comparisons examined in this experiment. The left side shows enrichment scores comparing cKO/WT for Uninfected (U), as well as Early (E) and Late (L) infection timepoints. The right side shows comparison of early (E/U) and late (L/U) infection timepoints versus uninfected separately for WT and cKO genotypes. Top 10 Hallmark gene sets, which have the highest enrichment scores across comparisons, were presented in each panel. (B, C) Similar plots and comparisons are shown for GSEA of phosphoproteome (B) and KGG(Ub) data (C).
Figure 5—figure supplement 2
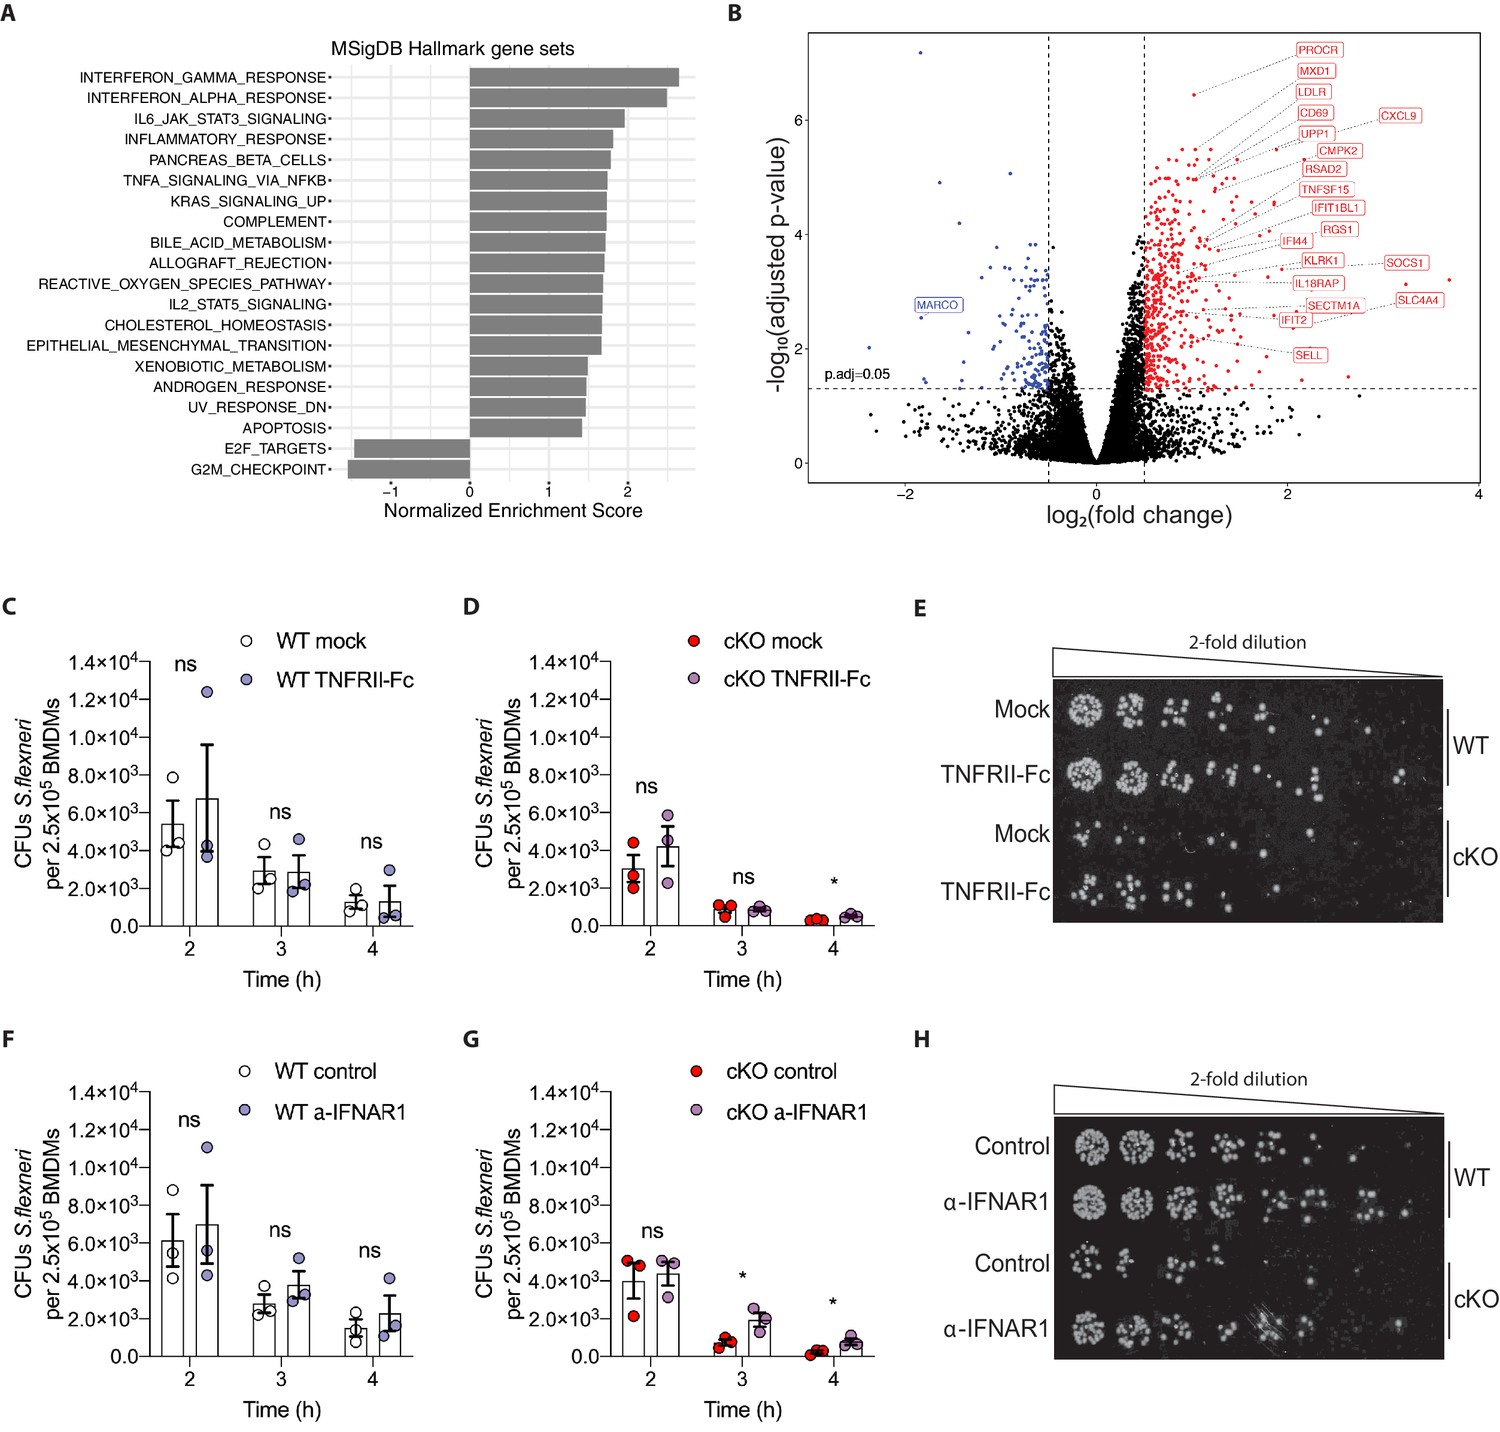
Heightened pro-inflammatory signaling in cKO BMDMs contributes to enhanced S.flexneri killing.
(A) Gene set enrichment analysis RNA-Seq results (pre-ranked fgsea comparing cKO vs. WT BMDMs infected with S.flexneri at a late time-point) showing significantly up-regulated and down-regulated MSigDB Hallmark gene sets (adjusted p ≤ 0.05) ordered by normalized enrichment score (NES). (B) Volcano plot highlighting differentially expressed genes from transcriptome (RNA-Seq) analysis (log2 fold change +/- 0.5, adjusted p ≤ 0.05) comparing cKO vs. WT BMDMs at late time-point of infection. Top 20 significant interferon and inflammatory response genes are labeled (from MSigDB Hallmark gene sets INTERFERON_GAMMA_RESPONSE, INTERFERON_ALPHA_RESPONSE and INFLAMMATORY_RESPONSE). (C, D) Comparison of CFUs per well from three independent infection experiments in the presence of 500 ng/ml TNFRII-Fc using BMDM preparations from three different Atg16l1-WT (C) or Atg16l1-cKO (D) mice. In C, 2h ns, non-significant p = 0.68, 3h ns p = 0.95, 4h ns p = 0.96, multiple t-test comparison. In (D), 2h ns p = 0.39, 3h ns p = 0.93, 4h * p = 0.03, multiple t-test comparison. (E, H) Representative serial dilutions from gentamycin protection assays following S.flexneri M90T infection of WT or cKO BMDMs in the presence of 500 ng/ml TNFRII-Fc, (E, 4h timepoint) or 5 μg/ml anti-mouse IFNAR-1 (α-IFNAR1) monoclonal antibody (H, 3h timepoint). (F, G) Comparison of CFUs per well from three independent infection experiments in the presence of 5 μg/ml α-IFNAR1 using BMDM preparations from three different Atg16l1-WT (F) or Atg16l1-cKO (G) mice. In (F), 2h ns p = 0.74, 3h ns p = 0.29, 4h ns p = 0.49, multiple t-test comparison. In (G), 2h ns p = 0.75, 3h * p = 0.03, 4h * p = 0.04, multiple t-test comparison.
Figure 5—figure supplement 3
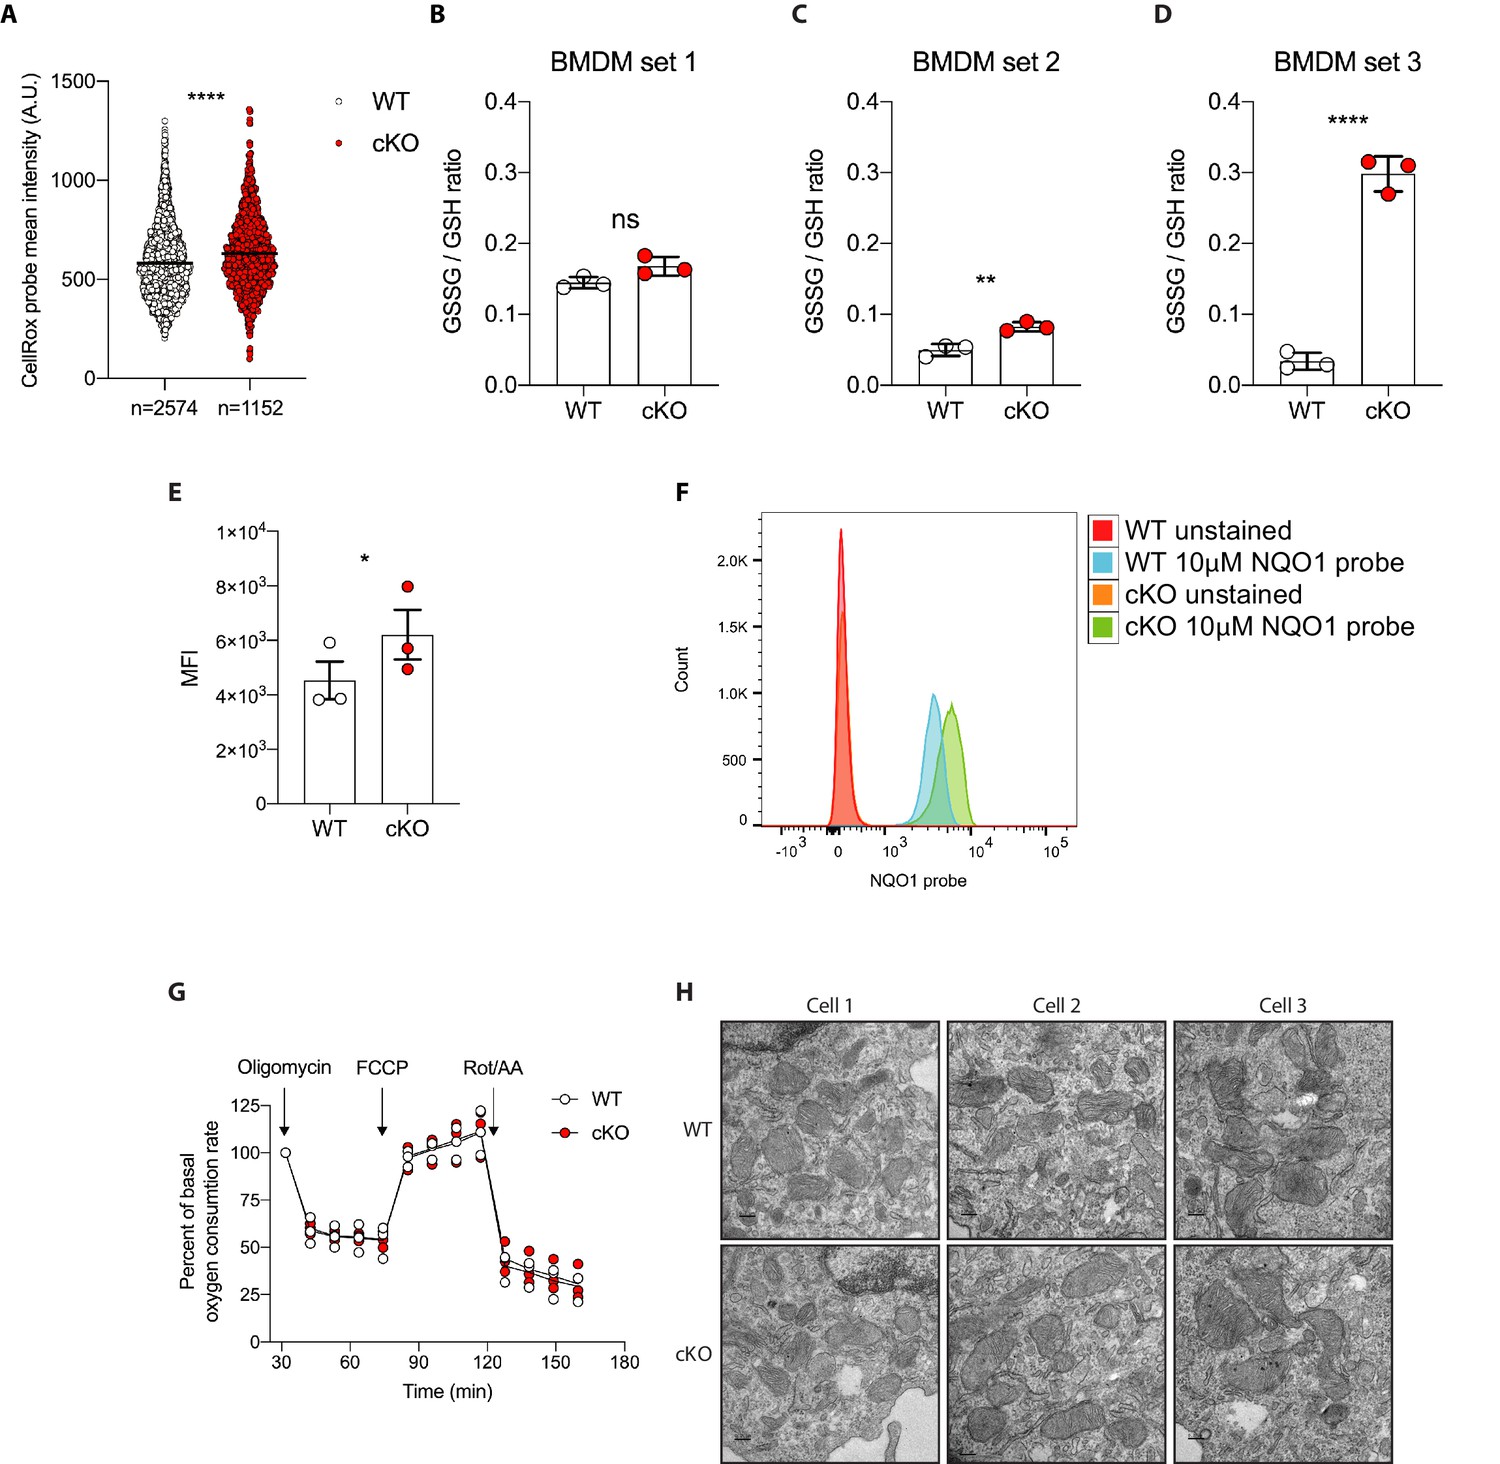
Elevated oxidative stress in ATG16L1-deficient BMDMs.
(A) Quantification of CellRox green mean intensity in WT and cKO BMDMs. Graph shows single-cell data from high content imaging (n = 1). Unpaired t test ****p<0.0001. (B–D) Graphs show three independent experiments quantifying the GSSG/GSH ratio in BMDMs prepared from three different sets of Atg16l1-WT or Atg16l1-cKO mice. In panel B, ns, non-significant p=0.059, in panel C **p=0.0057, in panel D ****p<0.0001, unpaired t test. (E) Graph shows mean fluorescence intensity (MFI) comparing NQO1 probe activation as determined by flow cytometry using either WT or cKO BMDMs prepared from three different pairs of Atg16l1-WT or Atg16l1-cKO mice, paired t test *p=0.02 (n = 3). (F) A representative histogram from experiments shown in (E). (G) Seahorse assay showing oxygen consumption rate of WT and cKO BMDMs. Graph shows the percent of basal respiration following treatment with 1.5 mM oligomycin, 1 mM FCCP, and 0.5 mM Rotenone/Antimycin A from three independent experiments using three different BMDM preparations (n = 3). (H) Representative electron microscopy (EM) micrographs of WT and cKO BMDMs at magnification ×8000 (scale bar = 0.2 μm).
Figure 6 with 1 supplement
Manipulation of ROS levels modulates S.flexneri clearance.
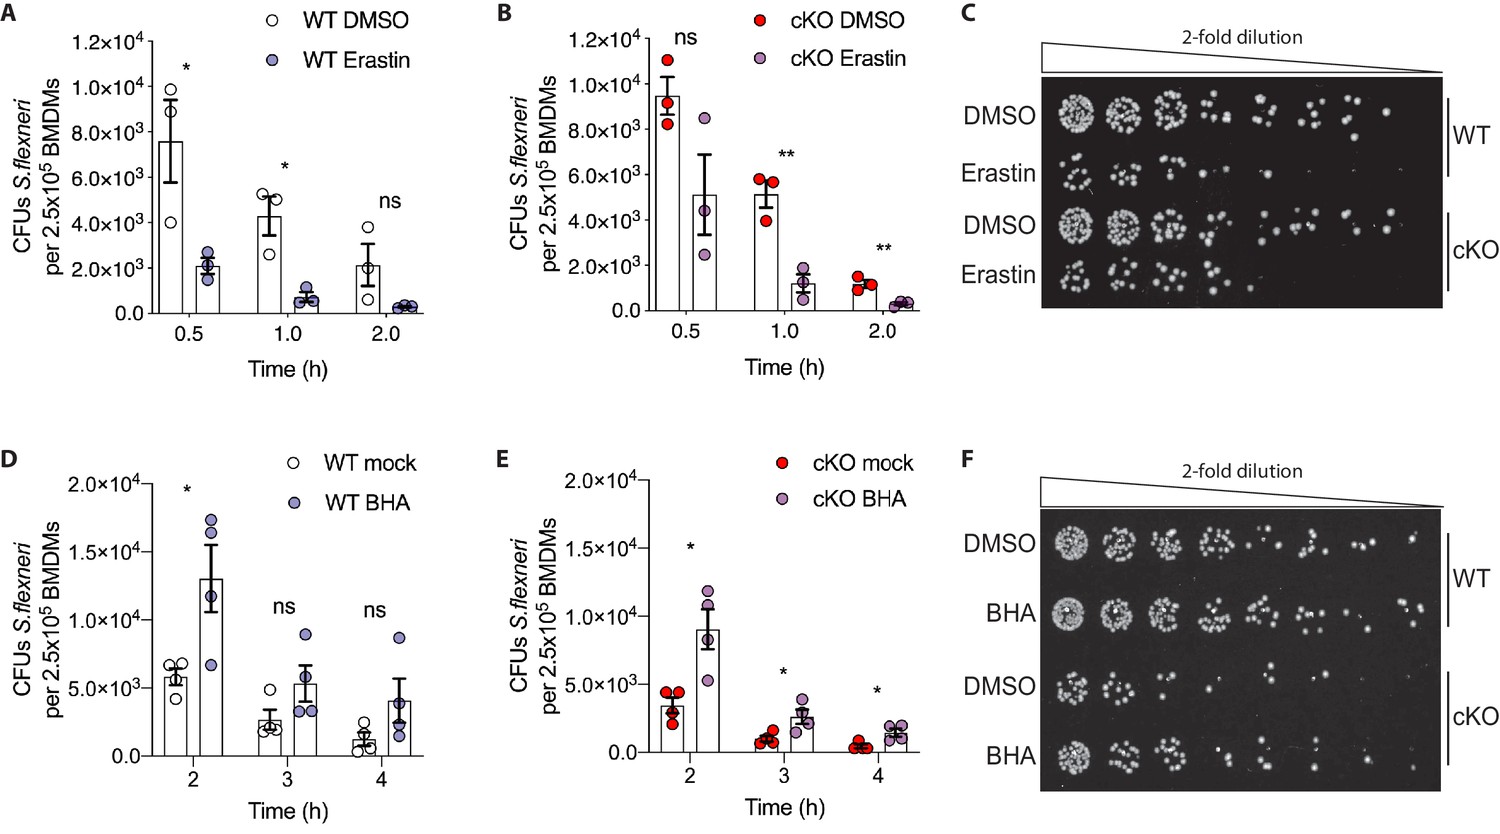
(A, B) Comparison of CFUs per well from three independent infection experiments in the presence of 4 μg/ml Erastin using BMDM preparations from three different Atg16l1-WT (A) or Atg16l1-cKO (B) mice. In A, 0.5 hr *p=0.04, 1 hr *p=0.01, 2 hr ns, non-significant p=0.11, multiple t-test comparison. In (B), 0.5 hr ns p=0.08, 1 hr **p=0.005, 2 hr **p=0.009, multiple t-test comparison. (C, F) Representative serial dilutions from gentamycin protection assays following S.flexneri M90T infection of WT or cKO BMDMs in the presence of Erastin 4 μg/ml, (C, 1 hr timepoint) or BHA 150 μM (F, 3 hr timepoint). (D, E) Comparison of CFUs per well from four independent infection experiments in the presence of 150 μM BHA using BMDM preparations from four different Atg16l1-WT (D) or Atg16l1-cKO (E) mice. In (D), 2 hr *p=0.02, 3 hr ns, non-significant p=0.13, 4 hr ns p=0.14, multiple t-test comparison. In (E), 2 hr *p=0.01, 3 hr *p=0.03, 4 hr *p=0.02, multiple t-test comparison.
Figure 6—figure supplement 1

Erastin, BHA sensitivity and cell death kinetics in infection experiments.
(A) Percentage of PI-positive WT and cKO BMDMs during time-course incubation with DMSO or 4 μg/ml Erastin. A representative graph shows individual values from three wells from one experiment (n = 3). (B) Schematic representation of infection experiments using pre-treatment of BMDMs with 4 μg/ml Erastin for 18 hr or 150 μM BHA for 2 hr. (C, D) Percentage of PI-positive WT (C) and cKO (D) BMDMs during time-course infection with S.flexneri M90T in the presence of DMSO or 4 μg/ml Erastin. Graph represents individual values from three independent experiments using three different BMDM preparations. ns, non-significant. (E, F) Percentage of PI-positive WT (E) and cKO (F) BMDMs during time-course infection with S.flexneri M90T in the presence of DMSO or 150 μM BHA. Graph represents individual values from four independent experiments using four different BMDM preparations. ns, non-significant.
Author response image 1
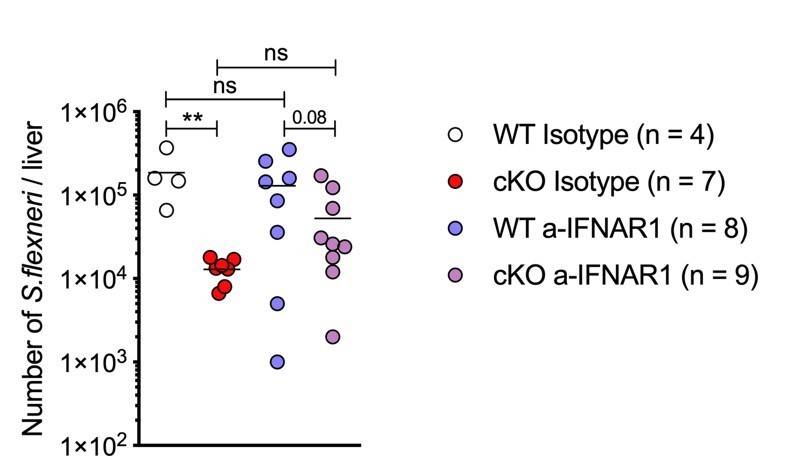
in vivo blockade of Type I Interferon signaling during S.flexneri infection.
Author response image 2
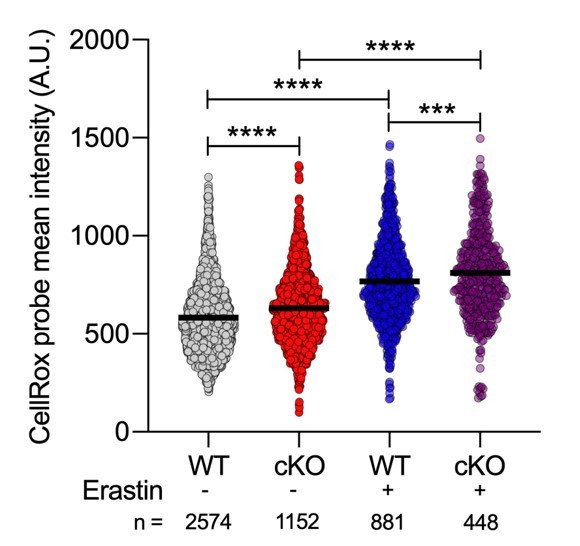
Quantification of CellRox green mean intensity in WT and cKO BMDMs.
Graph shows single cell data from high content imaging (n = 1). Unpaired t test **** P < 0.0001.
Author response image 3
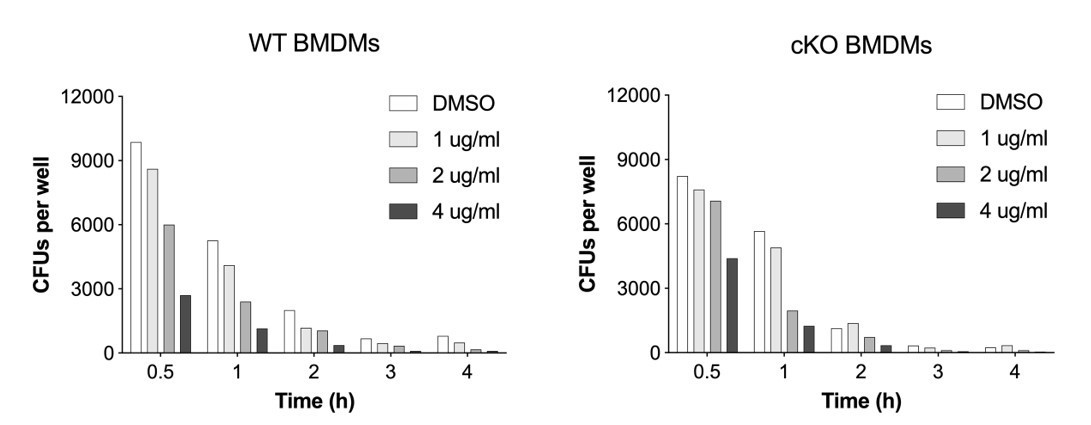
Dose-titration of Erastin and its impact on S.flexneri killing by BMDMs.
Tables
Table 1
Novel post-translational modifications in specific autophagy, innate sensing, inflammatory signaling and cell death pathways revealed by TMT-MS in WT and cKO BMDMs following S.flexneri infection.
Please refer to heatmaps in Figure 4, Figure 4—figure supplements 1, 2 and 3 for PTM abundance changes.
| Autophagy | ||
|---|---|---|
| Post-translational modification | ||
| Protein name | pSTY/Phosphorylation | KGG/Ubiquitination |
| ATG5 | K234 | |
| MLP3A/LC3 | K39 | |
| TAX1BP1 | T426, T494 | K284, K311, K536, K551, K624 |
| P62/SQSTM1 | T280. S292, S308 | |
| NBR1 | T6 | |
| FUND2 | K114, K121 | |
| TBC17 | S176 | K105 |
| RBCC1/FIP200 | T642 | |
| PI3R4/VPS15 | S903, T904 | |
| RUBIC | S252, S552, S554 | |
| ATG2B | S401 | T1570 |
| Innate sensing | ||
| Post-translational modification | ||
| Protein name | pSTY/Phosphorylation | KGG/Ubiquitination |
| DDX58/RIG-I | K256 | |
| MAVS | Y332 | |
| CGAS | K55 | |
| TLR4 | K692 | |
| MYD88 | S136 | |
| IRAK2 | S175, T587, S615 | |
| IRAK3 | K60, K163, K392 | |
| IRAK4 | T133, S134, S175_S186 | |
| TBK1 | S509 | |
| IRF3 | T126, S130 | |
| IRF7 | S227, T277 | |
| IFIT1 | S272, S296 | K89, K117, K123, K406, K451 |
| IFIT2 | K41, K61, K158, K291 | |
| IFIT3 | S327, S333 | K246, K252, K266, K396 |
| ISG15 | K30 | |
| Inflammatory signaling, cell death | ||
| Post-translational modification | ||
| Protein name | pSTY/Phosphorylation | KGG/Ubiquitination |
| TNFR1B/TNFR2 | K300 | |
| M3K7/TAK1 | S331 | |
| TAB2 | S353, T376, S584 | |
| TRAF1 | K120 | |
| TRAF2 | K194 | |
| IKBz | T188 | K5, K120, K132 |
| NFKB1 | K275 | |
| REL | S321 | |
| RNF31/HOIP | S441, S973 | K911 |
| TNAP3/A20 | S217, T567, S622, S730 | K31, K213 |
| TNIP1/ABIN1 | S601 | K288, K317, K386 |
| TNIP2/ABIN2 | T194, S196 | |
| CASP8 | S60 | K33, K274 |
| CFLAR/cFLIP | K175, K390 | |
| RIPK1 | K429 | |
| RIPK2 | S183, S381 | K369 |
| RIPK3 | S173, S177, S254, T386, T392, T398, T407 | K145, K230, K298 |
Additional files
-
Supplementary file 1
Composition PTM-site and global protein clusters displayed in Figure 2F and G and Figure 2—figure supplement 1B,C.
- https://cdn.elifesciences.org/articles/62320/elife-62320-supp1-v1.xlsx
-
Supplementary file 2
Curated list of PTMs described in Figure 4 and Figure 4—figure supplement 1 with associated references.
- https://cdn.elifesciences.org/articles/62320/elife-62320-supp2-v1.docx
-
Supplementary file 3
Curated list of PTMs described in Figure 4—figure supplement 2 and Figure 4—figure supplement 3 with associated references.
- https://cdn.elifesciences.org/articles/62320/elife-62320-supp3-v1.docx
-
Supplementary file 4
Gene Set Enrichment Analysis (GSEA) performed to identify cellular processes overrepresented in ATG16L1 deficient BMDMs in Figure 5A.
- https://cdn.elifesciences.org/articles/62320/elife-62320-supp4-v1.xlsx
-
Supplementary file 5
MSstatsTMT normalized quantification report for global proteins data.
- https://cdn.elifesciences.org/articles/62320/elife-62320-supp5-v1.xlsx
-
Supplementary file 6
MSstatsTMT statistical testing results for global proteins data.
- https://cdn.elifesciences.org/articles/62320/elife-62320-supp6-v1.xlsx
-
Supplementary file 7
MSstatsTMT normalized quantification report for phospho-sites data.
- https://cdn.elifesciences.org/articles/62320/elife-62320-supp7-v1.xlsx
-
Supplementary file 8
MSstatsTMT statistical testing results for phospho-sites data.
- https://cdn.elifesciences.org/articles/62320/elife-62320-supp8-v1.xlsx
-
Supplementary file 9
MSstatsTMT normalized quantification report for KGG(Ub)-sites data.
- https://cdn.elifesciences.org/articles/62320/elife-62320-supp9-v1.xlsx
-
Supplementary file 10
MSstatsTMT statistical testing results for KGG(Ub)-sites data.
- https://cdn.elifesciences.org/articles/62320/elife-62320-supp10-v1.xlsx
-
Transparent reporting form
- https://cdn.elifesciences.org/articles/62320/elife-62320-transrepform-v1.docx
Download links
A two-part list of links to download the article, or parts of the article, in various formats.
Downloads (link to download the article as PDF)
Open citations (links to open the citations from this article in various online reference manager services)
Cite this article (links to download the citations from this article in formats compatible with various reference manager tools)
Multiplexed proteomics of autophagy-deficient murine macrophages reveals enhanced antimicrobial immunity via the oxidative stress response
eLife 10:e62320.
https://doi.org/10.7554/eLife.62320


