Physiological and motion signatures in static and time-varying functional connectivity and their subject identifiability
- Graduate Program in Biological and Biomedical Engineering, McGill University, Canada
- Bioengineering Department, McGill University, Canada
Figures
Figure 1
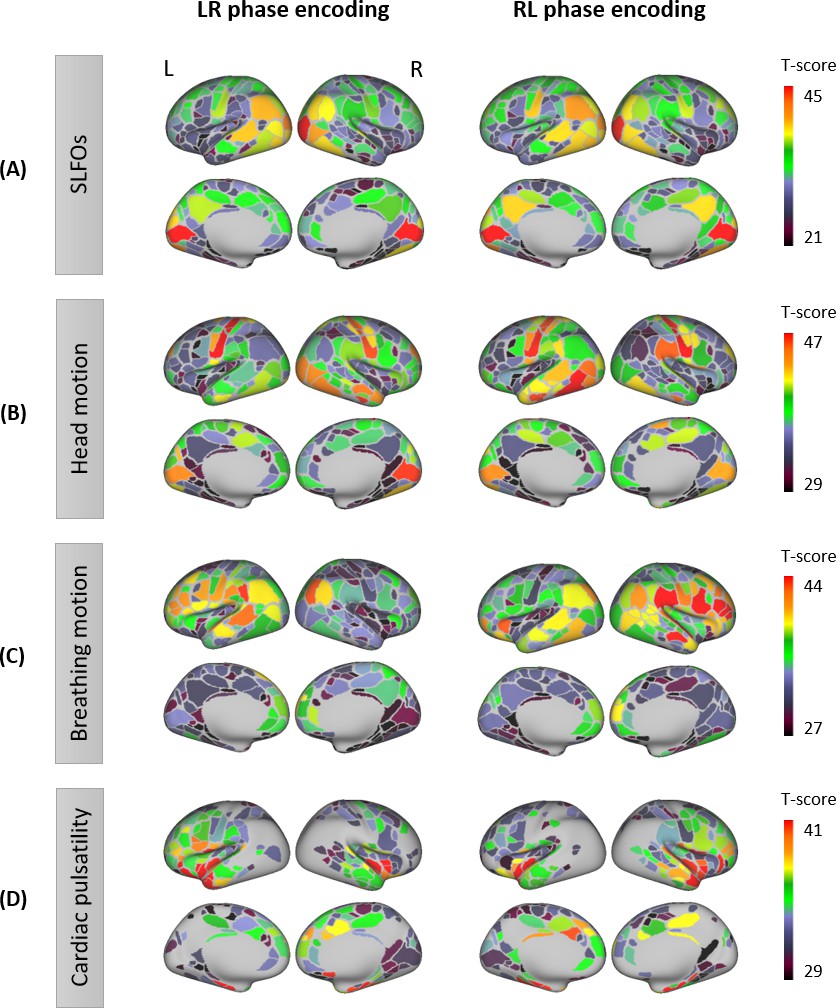
Contributions of nuisance processes to the resting-state BOLD signal.
T-score maps of the correlation between each nuisance process and BOLD fMRI fluctuations (raw data) for (A) SLFOs, (B) head motion, (C) breathing motion, and (D) cardiac pulsatility, computed within each parcel of the Gordon atlas (nonparametric permutation test, p<0.05, FDR corrected). The tests were performed for each phase encoding separately. The physiological fluctuations were obtained from simultaneous external recordings. These results illustrate the cortical regions most affected by each nuisance process.
Figure 2 with 5 supplements
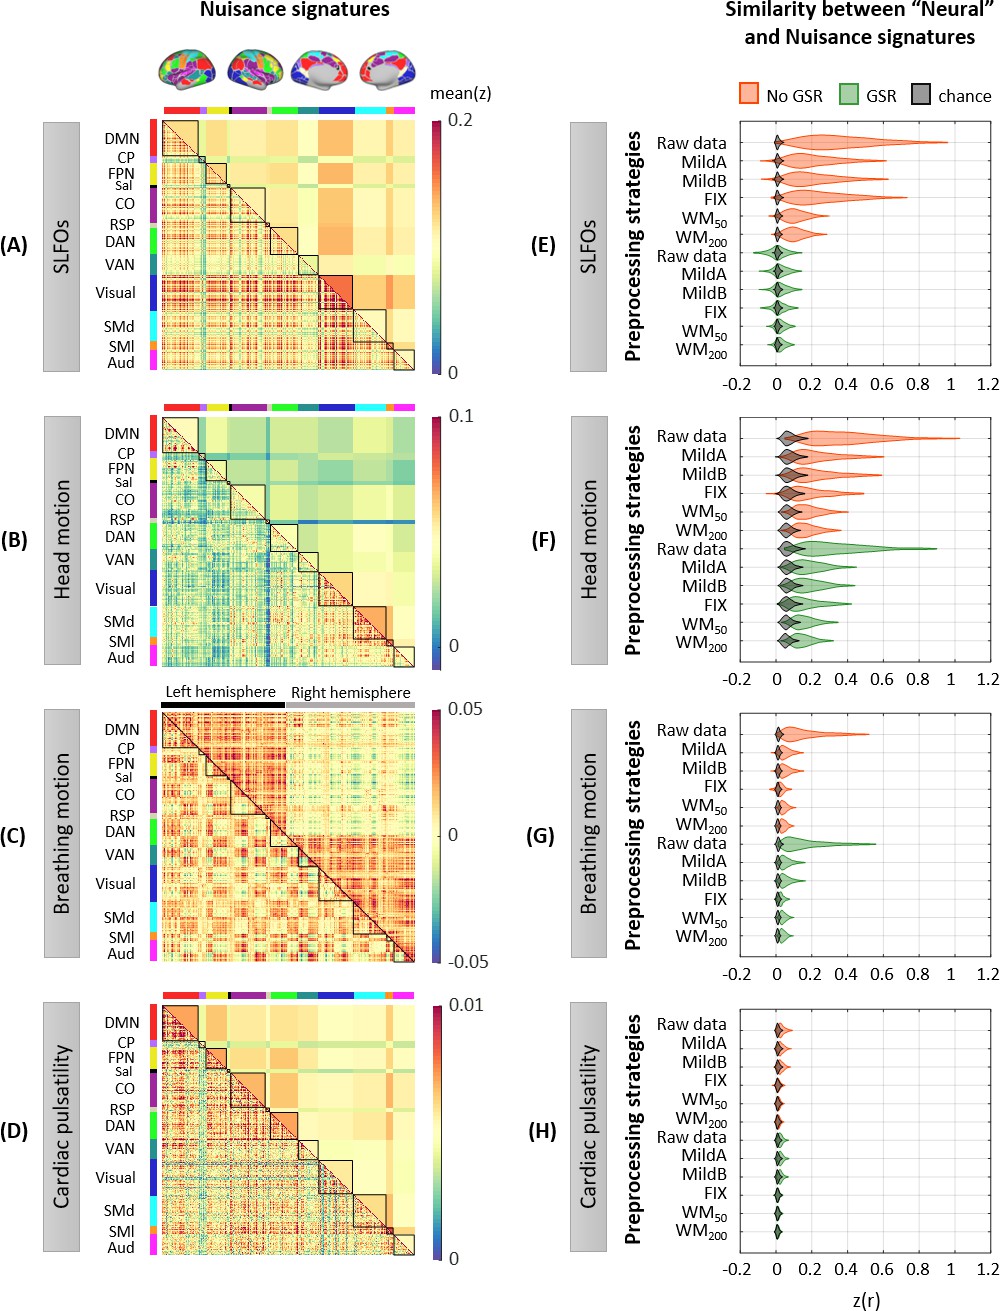
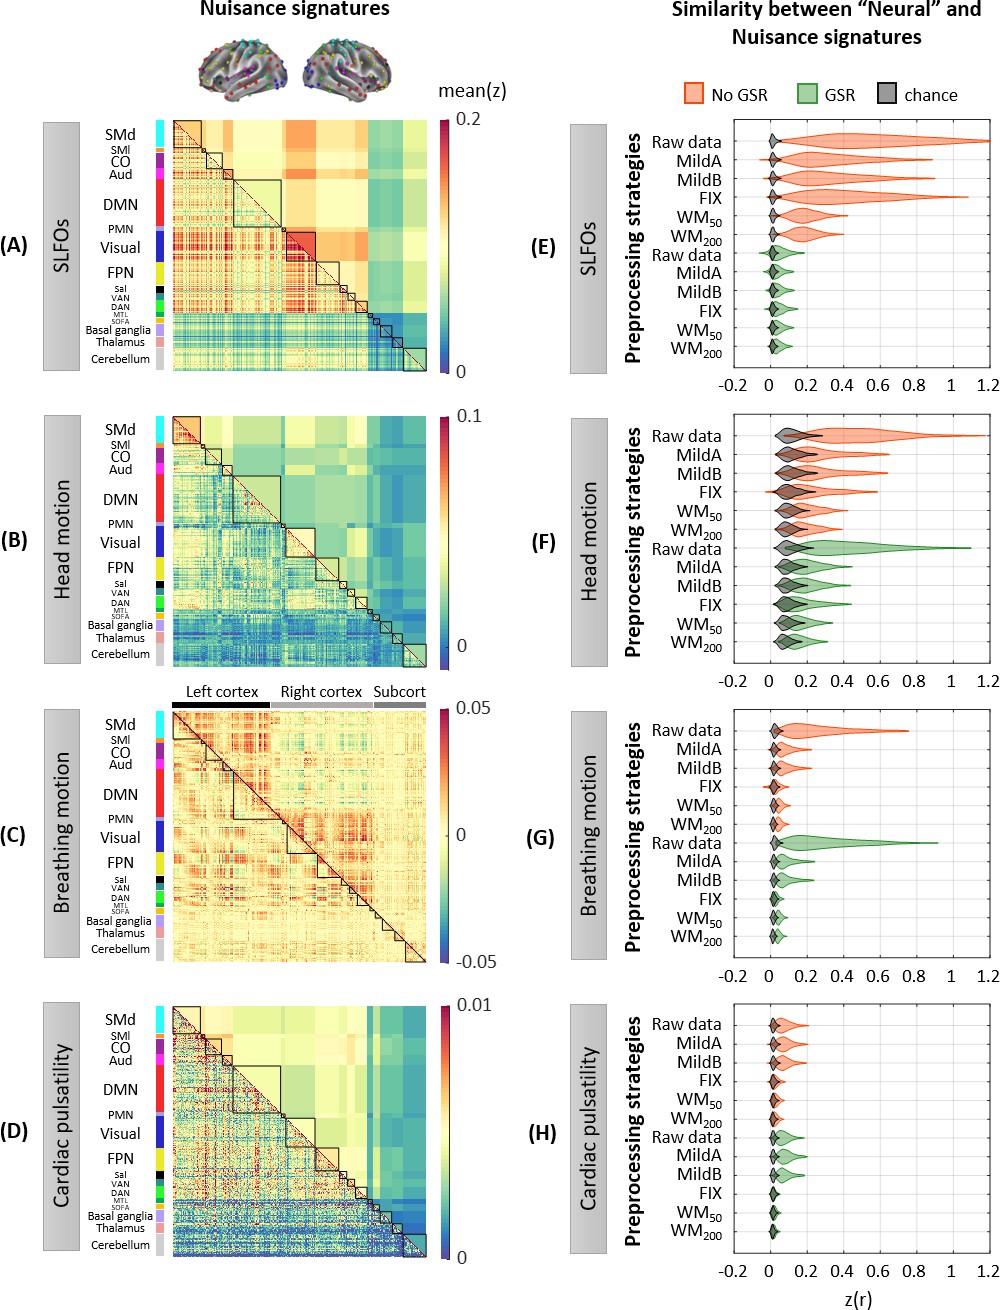
Whole-brain connectome patterns induced by nuisance processes and effect of preprocessing strategies.
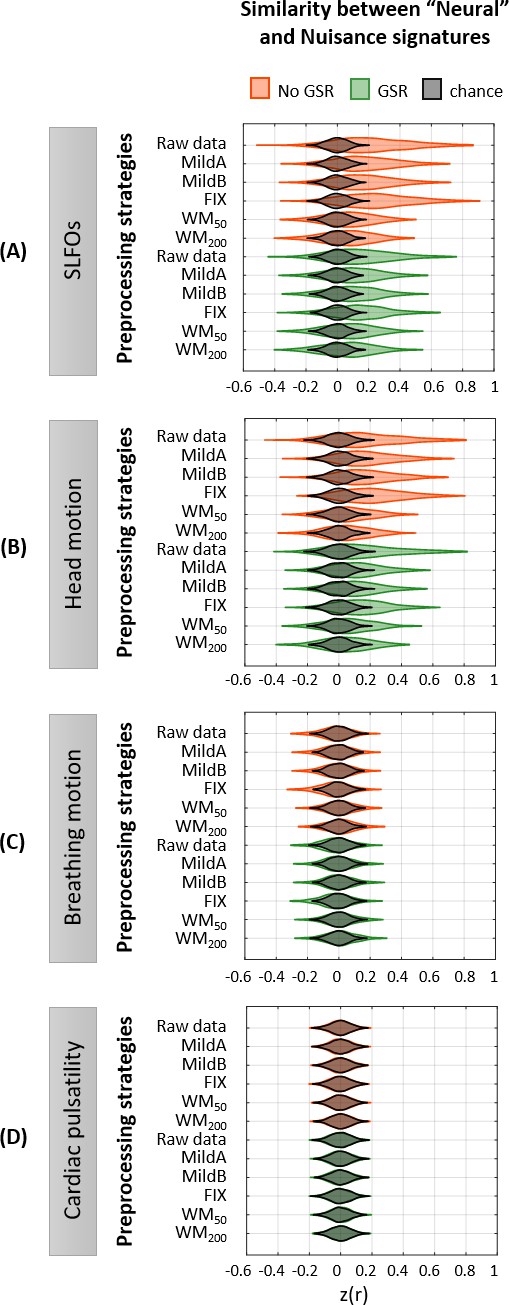
(A–D) Group averaged nuisance FC matrices across all 1568 scans for (A) SLFOs, (B) head motion, (C) breathing motion, and (D) cardiac pulsatility. The lower triangular matrices show the FC value for each network pair. The upper triangular matrices show FC values from the lower triangular averaged within network pairs (A, B, D panels), or the FC value for each network pair reordered according to left/right hemisphere (C panel). These results demonstrate that nuisance fluctuations induce heterogeneous whole-brain connectivity profiles which, if unaccounted for, can result in biased estimates functional connectivity. (E–H) Distribution of Pearson correlation coefficients across all 1568 scans between the ‘neural’ FC matrix for different preprocessing strategies and nuisance FC matrices associated to (E) SLFOs, (F) head motion, (G) breathing motion, and (H) cardiac pulsatility. Correlation values were Fisher z transformed. SLFOs, head motion and breathing motion were found to confound the FC matrices more severely (E–G). GSR effectively removed the effects of SLFOs, while more aggressive preprocessing pipelines mitigated the effects of head motion, breathing motion and cardiac pulsatility.
Figure 2—figure supplement 1
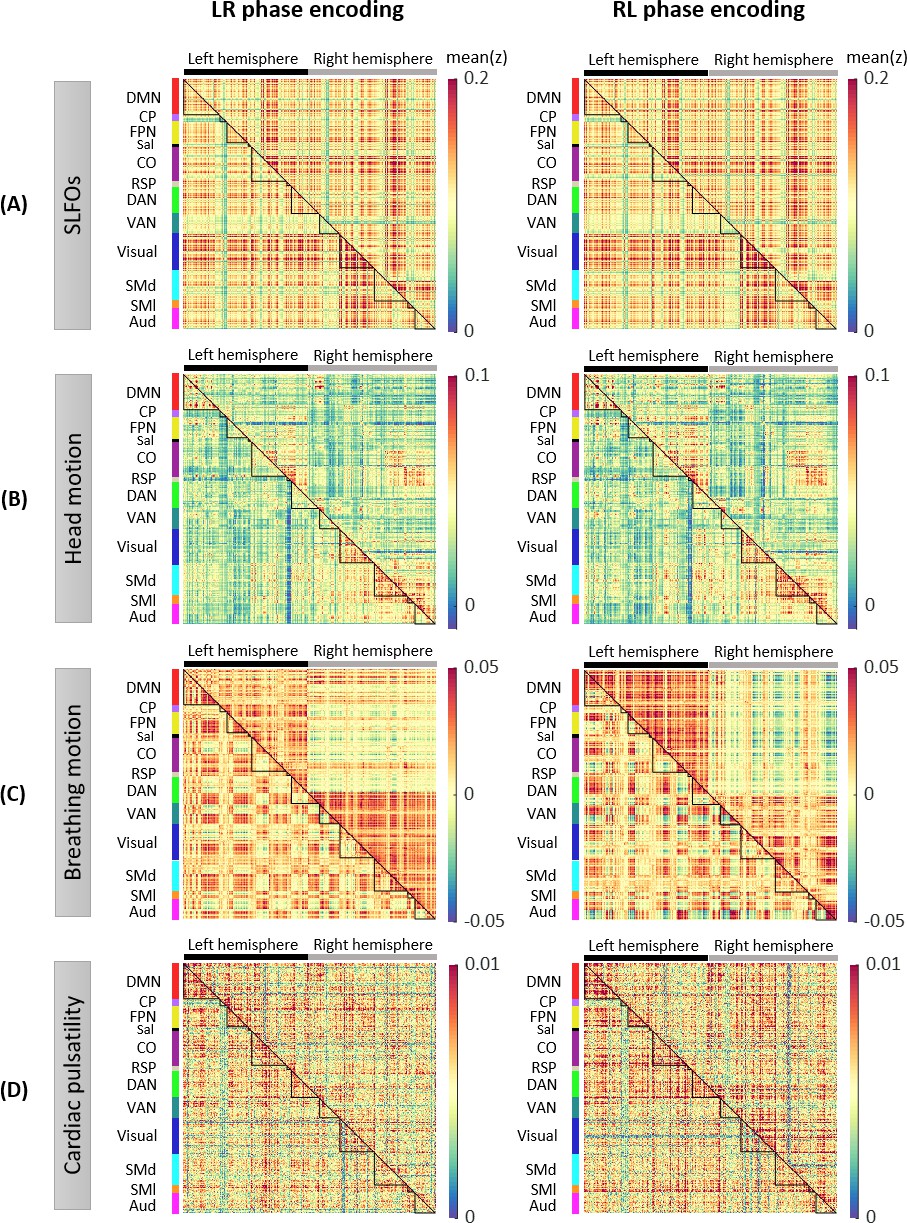
Whole-brain connectome patterns induced by nuisance processes, separately for scans with LR and RL phase encoding.
Group averaged nuisance FC matrices across 784 scans based on their LR and RL phase encoding direction for (A) SLFOs, (B) head motion, (C) breathing motion, and (D) cardiac pulsatility. The lower triangular matrices show the FC value for each network pair. The upper triangular matrices show FC values from the lower triangular averaged within network pairs (A, B, D panels), or the FC value for each network pair reordered according to left/right hemisphere (C panels).
Figure 2—figure supplement 2
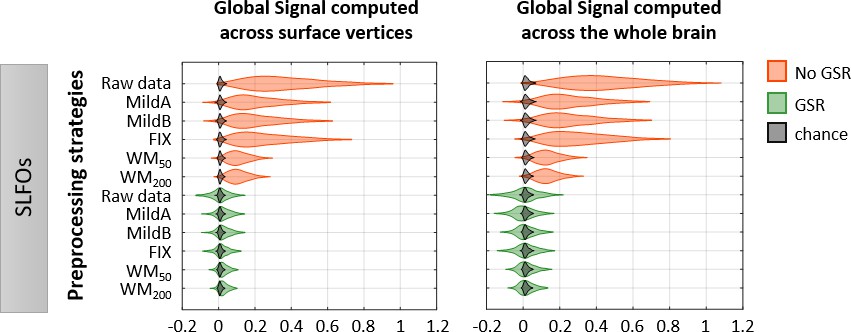
Effectiveness of preprocessing strategies in reducing the whole-brain connectivity profiles effects of SLFOs for two different global signal calculation methods.
Distribution of Pearson correlation coefficients across all 1568 scans between the ‘neural’ FC matrix after each preprocessing pipeline and nuisance FC matrices associated to SLFOs, both when the global signal was computed across vertices in surface space (left column), and when the global signal was computed across the whole brain in volumetric space (right column). Correlation values were Fisher z transformed.
Figure 2—figure supplement 3
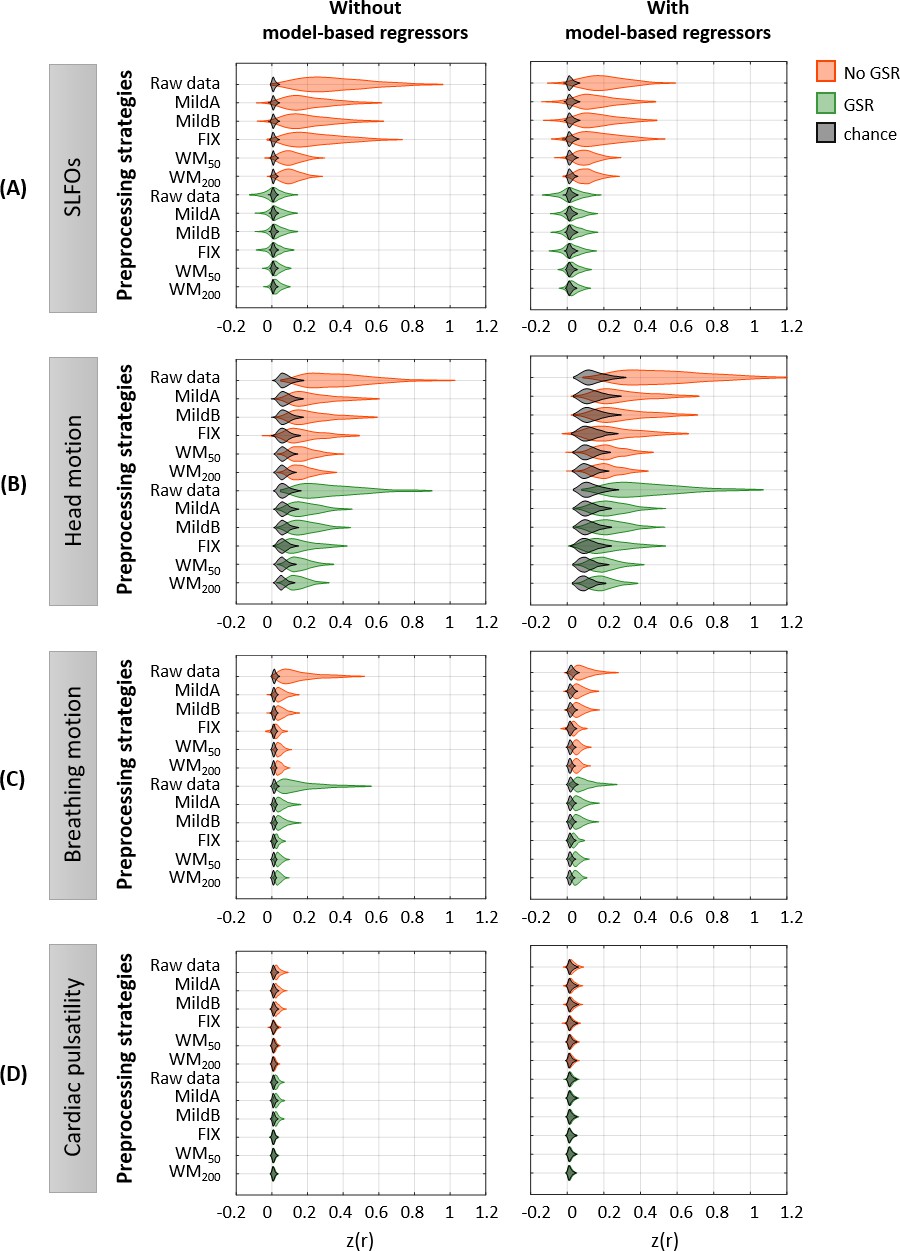
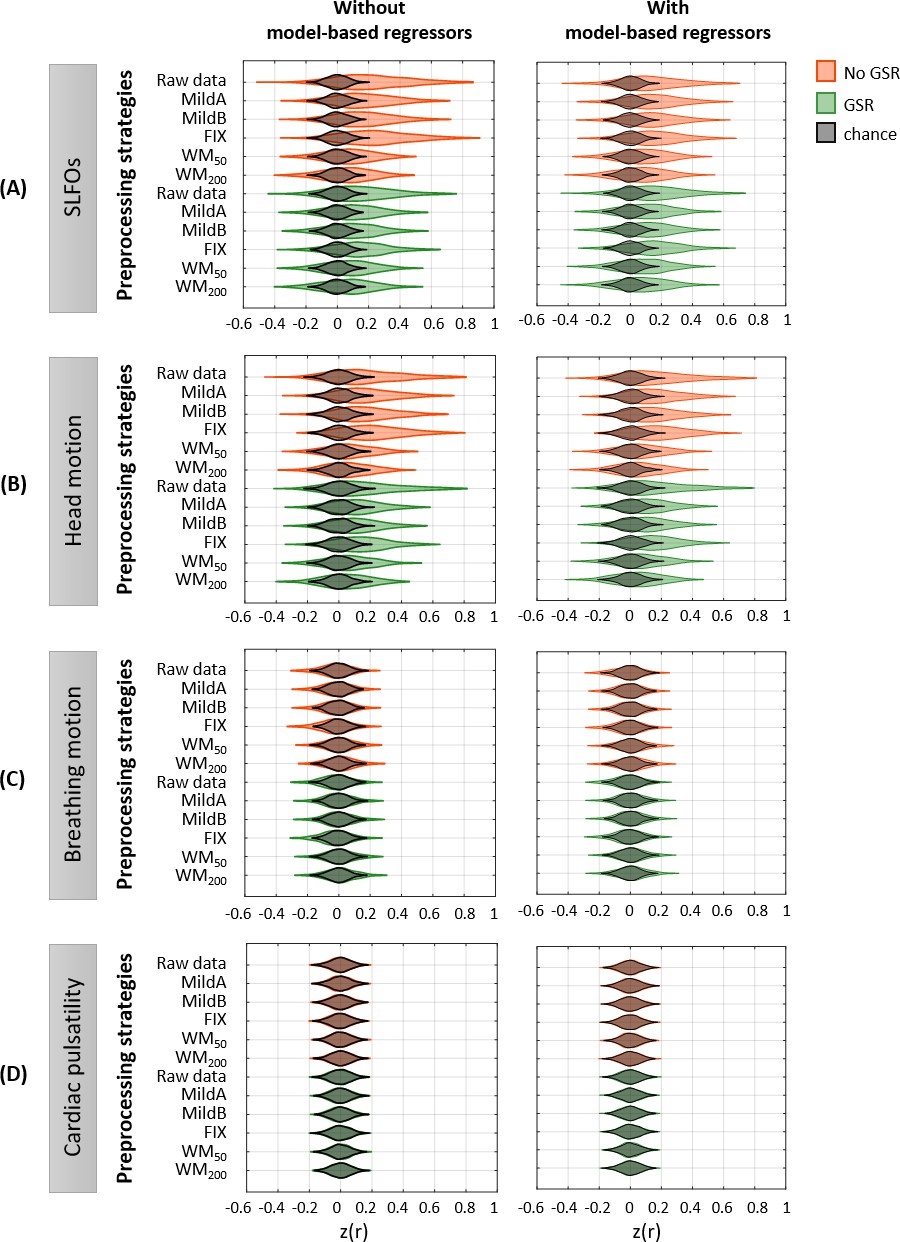
Effectiveness of preprocessing strategies in reducing the whole-brain connectivity effect of each nuisance process, with and without including model-based regressors.
Distribution of Pearson correlation coefficients across all 1568 runs between the ‘neural’ FC matrix after each preprocessing pipeline and nuisance FC matrices associated to (A) SLFOs, (B) head motion, (C) breathing motion, and (D) cardiac pulsatility, when physiological regressors obtained from model-based techniques were included (right column) or not (left column) as nuisance regressors in the preprocessing strategies. Correlation values were Fisher z transformed.
Figure 2—figure supplement 4
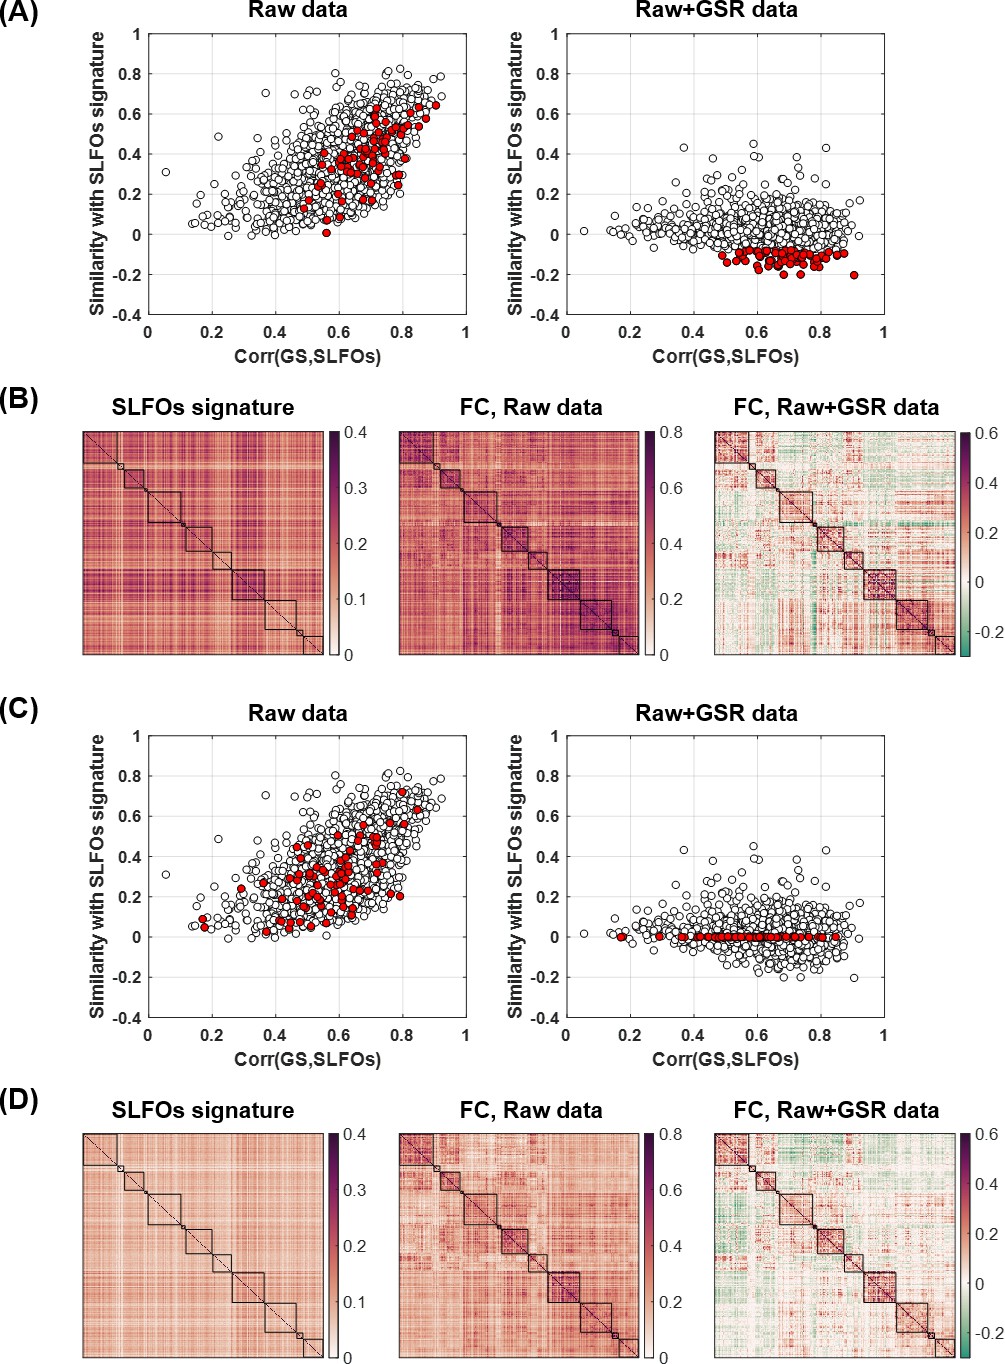
Investigating the negative correlations between the ‘neural’ and SLFOs signatures after GSR.
(A) Plot of the correlation between the global signal (GS) and SLFOs versus the similarity of the raw data with the SLFOs signature, before (left) and after (right) GSR. The red dots highlight scans that exhibit a negative correlation with the SLFO signature after GSR. (B) Averaged matrices for the scans highlighted in red in (A). (C) Same plot as in (A), but in this case the red dots illustrate scans that exhibited a zero correlation with the SLFO signature after GSR. (D) Averaged matrices for the scans highlighted in red in (C).
Figure 2—figure supplement 5
Whole-brain connectome patterns induced by nuisance processes and effect of preprocessing strategies, using the Seitzman atlas.
(A–D) Group averaged ‘physiological’ FC across all 1568 scans for (A) SLFOs, (B) head motion, (C) breathing motion, and (D) cardiac pulsatility. The lower triangular matrices show the FC value for each network pair. The upper triangular matrices show FC values from the lower triangular averaged within network pairs (A, B, D panels), or the FC value for each network pair reordered according to left/right hemisphere (C panel). (E–H) Distribution of Pearson correlation coefficients across all 1568 scans between the ‘neural’ FC matrix after each preprocessing pipeline and nuisance FC matrices associated to (E) SLFOs, (F) head motion, (G) breathing motion, and (H) cardiac pulsatility. Correlation values were Fisher z transformed.
Figure 3 with 2 supplements
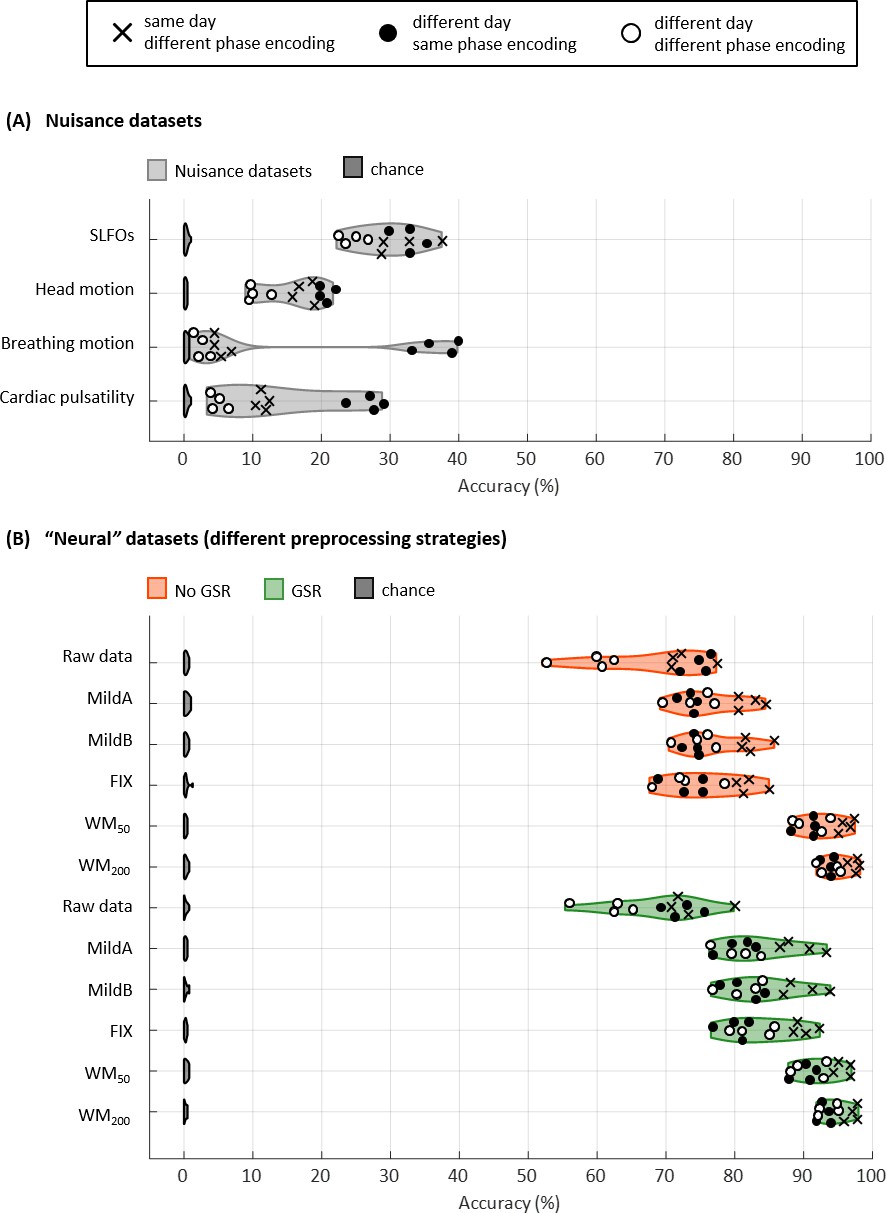
Connectome fingerprinting results.
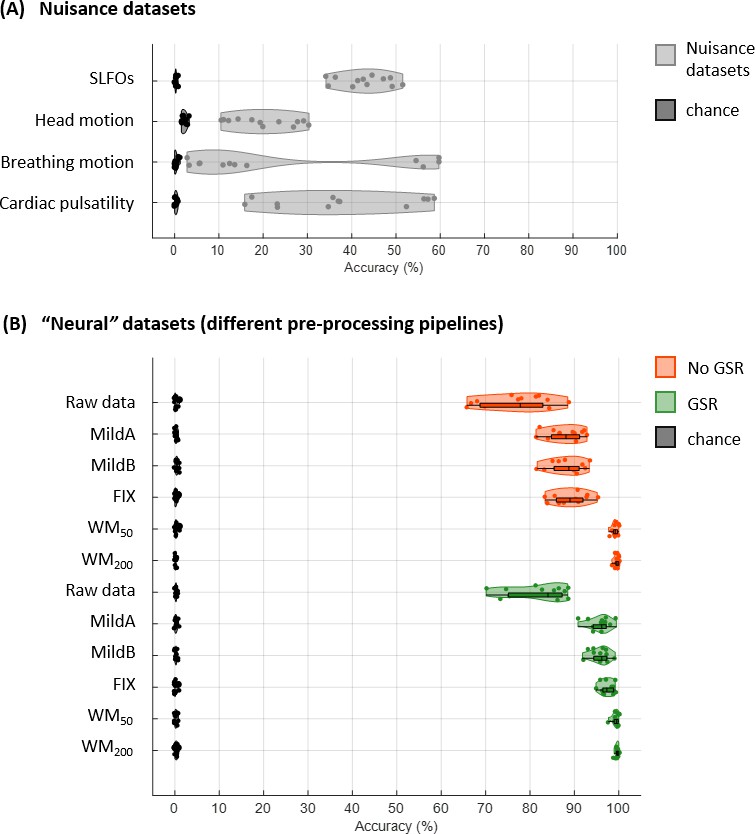
(A) Fingerprinting accuracy obtained using the static FC matrices from the generated nuisance datasets whereby non-neural fluctuations were isolated from the BOLD data. Above-chance level accuracy values were obtained for all nuisance processes, suggesting some degree of subject specificity in whole-brain connectivity profiles arises from nuisance fluctuations. (B) Fingerprinting accuracy obtained using the static FC matrices generated from each of the preprocessing strategies evaluated. The pairs of resting-state scans are indicated with different symbols, depending on whether they belong to the same or different day session, as well as whether they have the same phase encoding. Higher fingerprinting accuracy values were observed for white matter denoising approaches (WM50, WM200) compared to milder pipelines and FIX denoising. Both mild and more aggressive pipelines yielded higher subject discriminability for pairs of scans acquired on the same day. GSR increased the fingerprinting accuracy of milder strategies and FIX denoising.
Figure 3—figure supplement 1
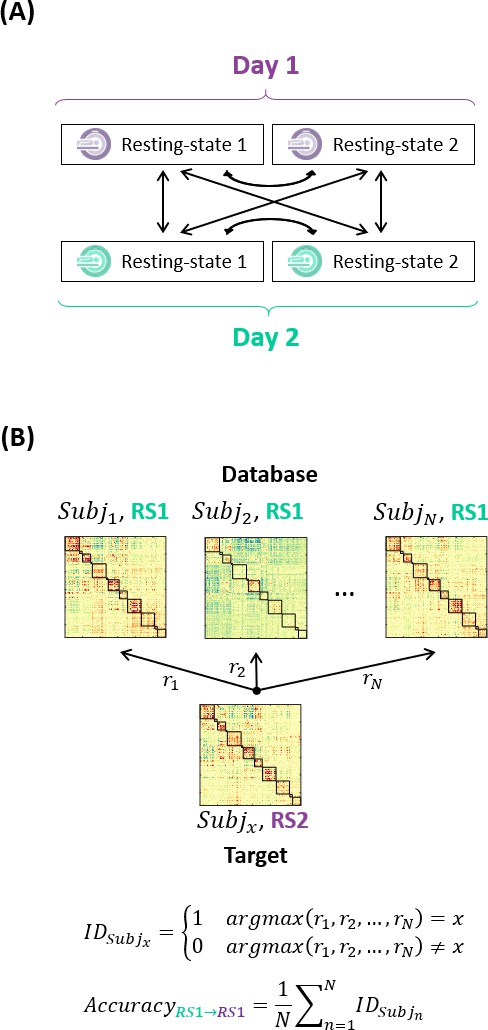
Schematic of the methodology for connectome fingerprinting.
(A) Diagram of the target-database combinations between resting-state scans. (B) Example on how to compute the identification accuracy for a target-database pair. Figure based on Finn et al., 2015.
Figure 3—figure supplement 2
Connectome fingerprinting results for the Seitzman atlas.
(A) Fingerprinting accuracy obtained using the static FC matrices from the generated nuisance datasets where non-neural fluctuations were isolated from the BOLD data. (B) Fingerprinting accuracy obtained using the static FC matrices generated from each of the preprocessing strategies evaluated.
Figure 4

Connectome fingerprinting results using edges within and between networks.
(A) Fingerprinting accuracy for SLFOs, head motion, breathing motion and cardiac pulsatility, averaged across all database-target pairs. (B) Fingerprinting accuracy for the raw data, FIX and WM200 pipelines, averaged across all database-target pairs. (C) Significant differences in fingerprinting accuracy obtained when using the FIX and WM200 pipelines as compared to the raw data (p<0.05, Bonferroni corrected, Wilcoxon rank-sum). Connectivity profiles within and between top-down control networks (FPN, CO, VAN, DAN) and DMN yielded higher identification accuracy compared to connectivity profiles within and between sensorimotor processing networks (Visual, SMd, Aud).
Figure 5 with 2 supplements
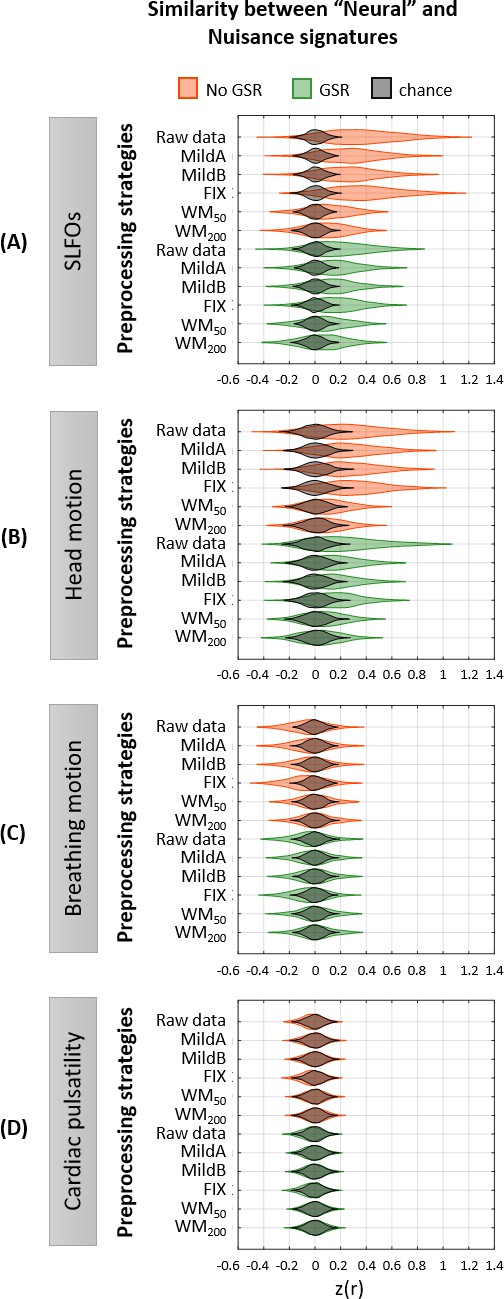
Effectiveness of preprocessing strategies in reducing functional connectivity dynamics (FCD) profiles induced by physiological and motion processes.
Distribution of Pearson correlation coefficients across all 1568 scans between the ‘neural’ functional connectivity dynamics (FCD) matrix after each preprocessing pipeline and nuisance FCD matrices associated to (A) SLFOs, (B) head motion, (C) breathing motion, and (D) cardiac pulsatility. Correlation values were Fisher z transformed. Results shown in the top row of each subpanel (raw data) suggest that SLFOs and head motion most severely confound the FC matrices, whereas breathing motion and cardiac pulsatility do not induce artifactual dynamics. None of the examined strategies completely eliminated these effects.
Figure 5—figure supplement 1
Effectiveness of preprocessing strategies in reducing functional connectivity dynamics (FCD) profiles induced by physiological and motion processes, with and without including model-based regressors.
Distribution of similarity (Pearson correlation coefficient) values across all 1568 scans between the ‘neural’ FCD matrix after applying different preprocessing pipelines and the nuisance FCD matrices associated to (A) SLFOs, (B) head motion, (C) breathing motion, and (D) cardiac pulsatility, when physiological regressors obtained from model-based techniques were not included (left column) or included (right column) as nuisance regressors in the preprocessing strategies. Correlation values were Fisher z transformed.
Figure 5—figure supplement 2
Effectiveness of preprocessing strategies in reducing functional connectivity dynamics (FCD) profiles induced by physiological and motion processes, using the Seitzman atlas.
Distribution of Pearson correlation coefficients across all 1568 scans between the ‘neural’ FCD matrix after each preprocessing pipeline and nuisance FCD matrices associated to (A) SLFOs, (B) head motion, (C) breathing motion, and (D) cardiac pulsatility. Correlation values were Fisher z transformed.
Figure 6 with 1 supplement
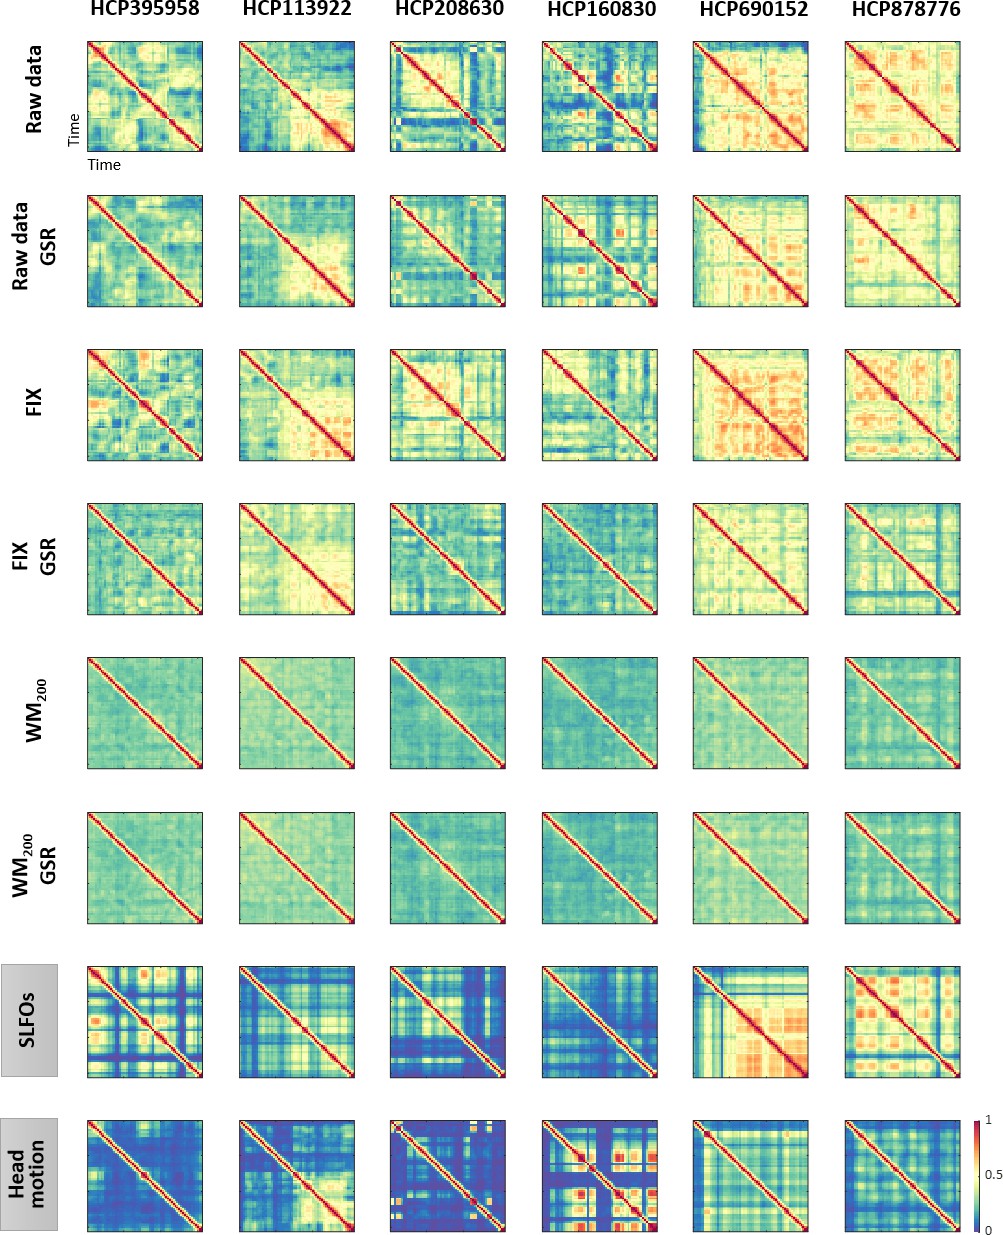
Functional connectivity dynamics (FCD) profiles associated with SLFOs and head motion resemble patterns commonly attributed to neural processes.
Illustrative examples of FCD matrices from specific HCP subjects as obtained from the fMRI data for several pre-processing pipelines (rows 1–6), as well as from SLFOs and head motion (rows 7 and 8, respectively). All the examples are from the HCP scan Rest1_LR. These examples show a clear resemblance between FCD matrices computed from the ‘neural’ datasets and the nuisance processes (SLFOs and head motion). Note that the size of FCD matrices is W×W, where W is the number of sliding windows within a scan.
Figure 6—figure supplement 1
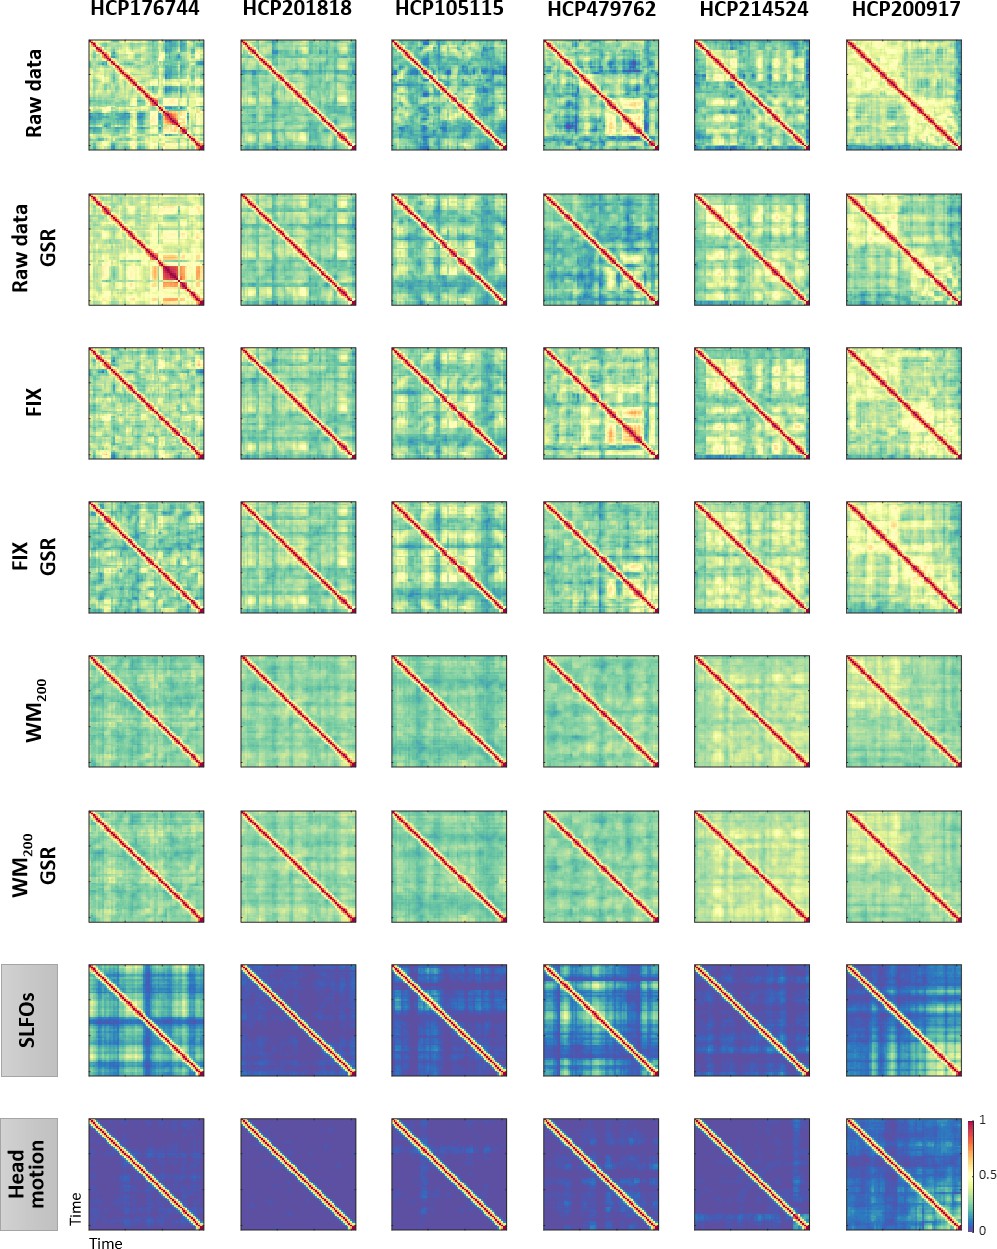
Examples of functional connectivity dynamics (FCD) profiles.
Illustrative examples of FCD matrices from specific HCP subjects for several pre-processing pipelines (rows 1–6), SLFOs and head motion (rows 7 and 8, respectively). All the examples are from the HCP scan Rest1_LR. These subjects did not exhibit a large resemblance between FCD matrices computed from the ‘neural’ datasets and FCD matrices computed from the nuisance datasets of SLFOs and head motion. Note that the WM200 preprocessing strategy substantially diminished the recurrent FC patterns. Note that the size of FCD matrices is W×W, where W is the number of sliding windows within a scan.
Figure 7 with 5 supplements
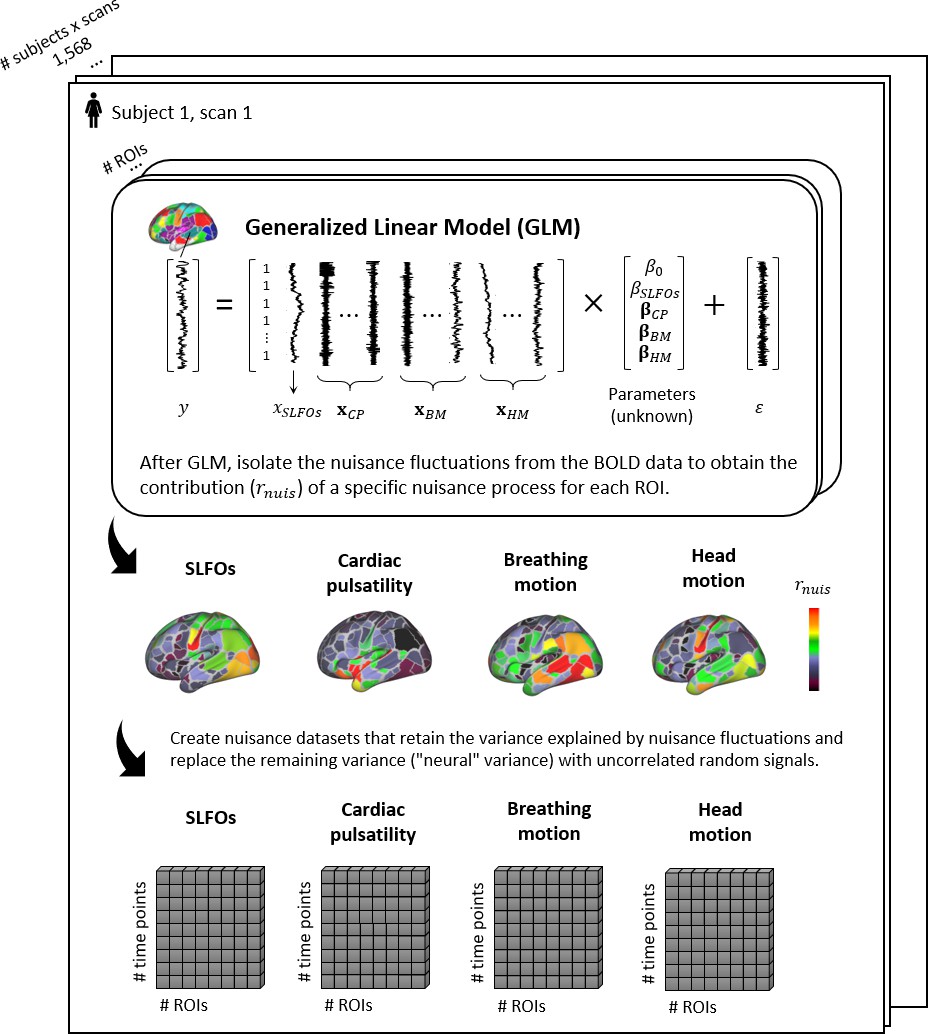
Graphical summary of the proposed framework for isolating the fluctuations for each physiological process.
For each scan, the ROI time-series are modeled using the regressors related to systemic low frequency oscillations (SLFOs), cardiac pulsatility (CP), breathing motion (BM), and head motion (HM). Subsequently, the fraction of BOLD variance explained by each nuisance process is isolated and employed to generate synthetic datasets that only contain nuisance fluctuations.
Figure 7—figure supplement 1
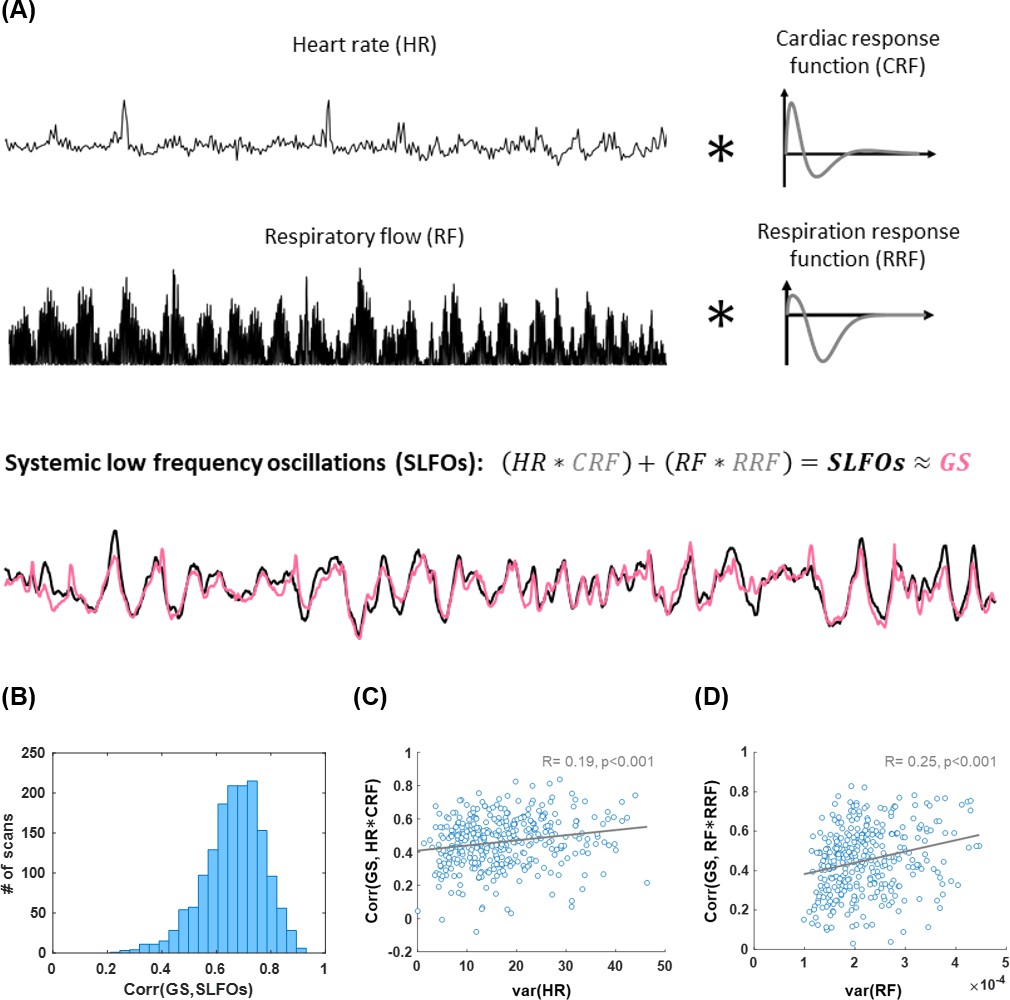
Illustration of methodology for modeling systemic low frequency oscillations (SLFOs) using the traces of heart rate and breathing activity.
The respiratory flow was defined as the square of the derivative of the breathing signal. The cardiac and respiration response functions were estimated separately for each scan, using the methodology proposed in Kassinopoulos and Mitsis, 2019. Heart rate and respiratory flow were convolved with the cardiac and respiration response functions, respectively, in order to obtain the fluctuations of SLFOs. As can be seen in the example, SLFOs were strongly correlated to the global signal (GS). (B) Histogram illustrating the correlation between SLFOs and the GS across all scans considered in the present study. The average correlation is 0.65 across all scans considered in this study. (C) The variance of the heart rate signal was positively correlated with the correlation coefficient between the cardiac regressor (HR*CRF) and GS. (D) The variance of the respiratory flow signal was strongly correlated with the correlation coefficient between the respiratory regressor (RF*RRF) and GS.
Figure 7—figure supplement 2
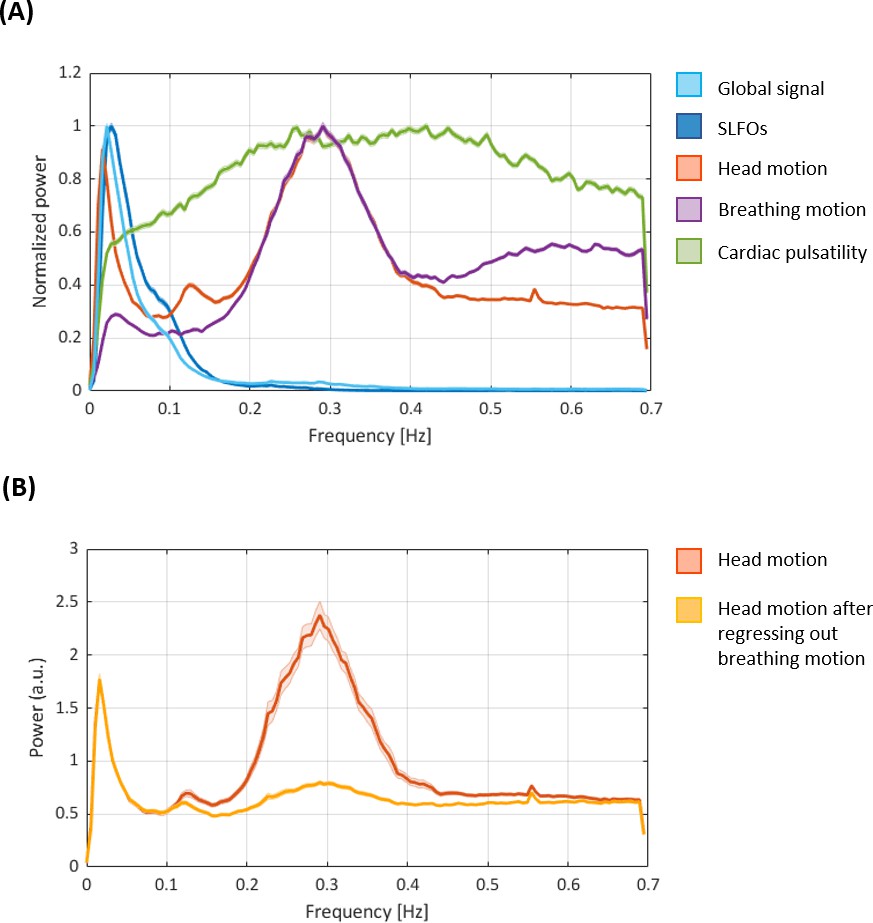
Power spectral densities of the nuisance processes evaluated in the present study.
(A) Power spectral densities of the nuisance processes evaluated in the present study (as well as the global signal for reference). SLFOs mostly exhibit low-frequency fluctuations (<0.15 Hz). Breathing motion exhibits a peak at ~0.3 Hz, consistent with the average breathing rate across subjects. Head motion exhibits the same 0.3 Hz peak, underscoring the observation that realignment parameters are contaminated by breathing. We also observe a peak in head motion at ~0.12 Hz, recently attributed to deep breaths (Power et al., 2019), and a very narrow peak at 0.55 Hz that is likely due to scanner artifacts. The fMRI data is not sampled fast enough to capture cardiac pulsatility (~1 Hz), hence the effect of cardiac activity is aliased within a range of lower frequencies. Thus, any variation in heart rate during a scan as well as across subjects is likely to spread cardiac pulsatility artifacts across different frequencies, broadening the main spectral peak. (B) Power spectral density of head motion before and after regressing out breathing motion. Note the substantial decrease in power around 0.3 Hz after removing the effect of breathing motion. Both figures show the mean and standard error across subjects for scan Rest1_LR (similar results were observed for all other scans).
Figure 7—figure supplement 3
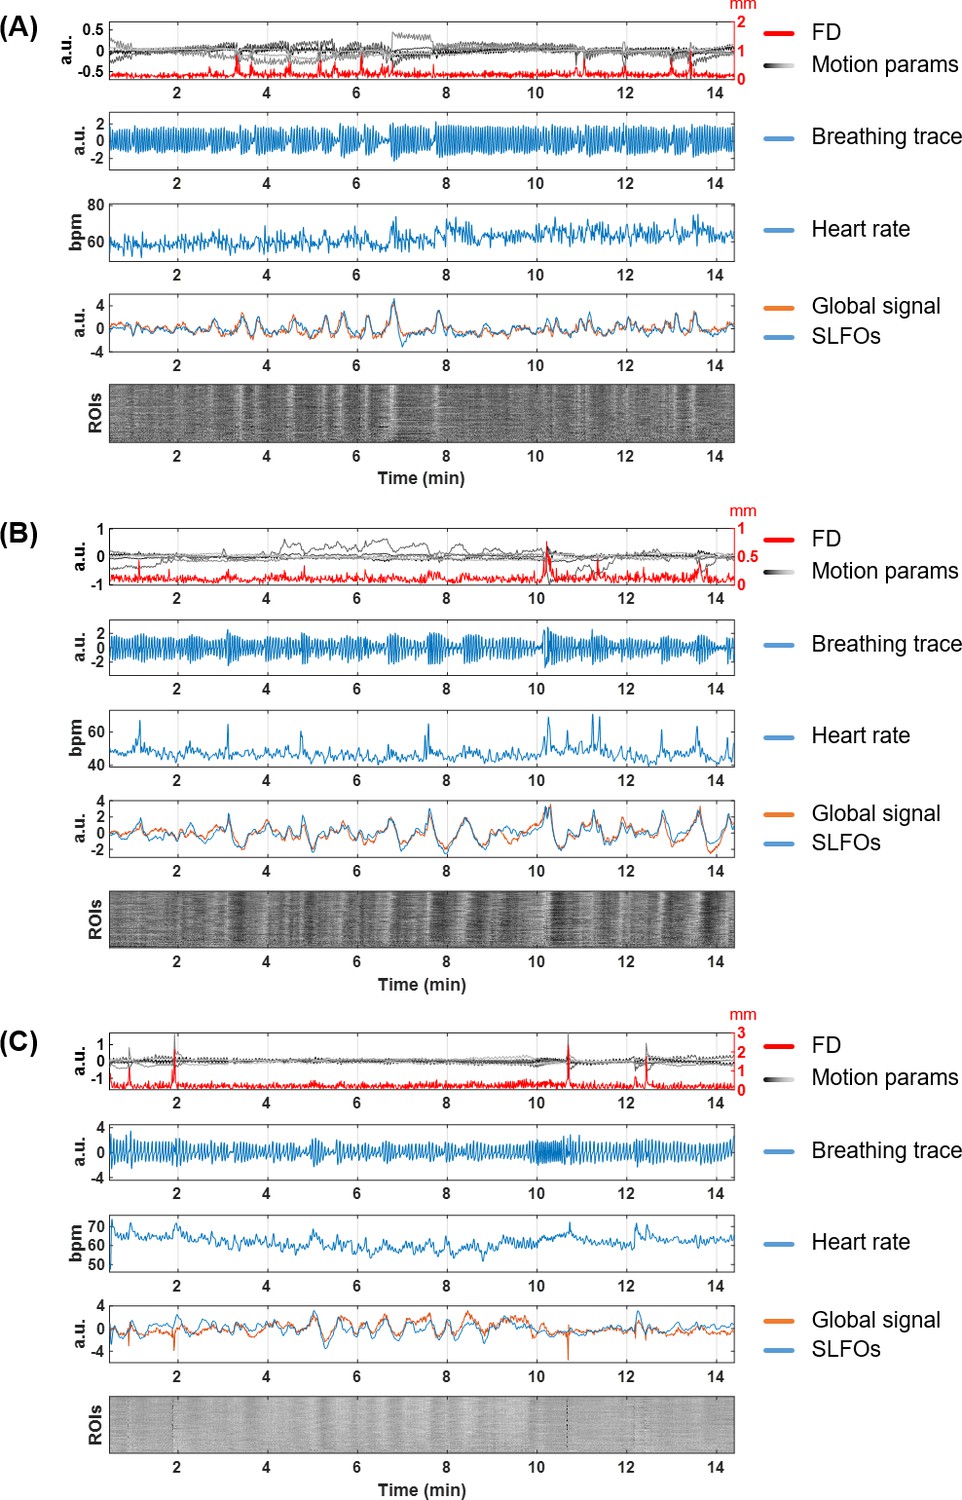
Nuisance traces from three illustrative scans.
(A) 101915, Rest1_LR, (B) 138837, Rest1_LR, (C) 208630, Rest1_LR. For each scan, the five subpanels show the motion parameters and framewise displacement (first row), the respiratory trace from the breathing belt (second row), the heart rate (third row), the global signal and SLFOs (fourth row), and the carpet plot of ROIs timeseries (fifth row). The carpet plot is arranged in descending order according to the Pearson correlation between the averaged ROI timeseries and the global signal.
Figure 7—figure supplement 4
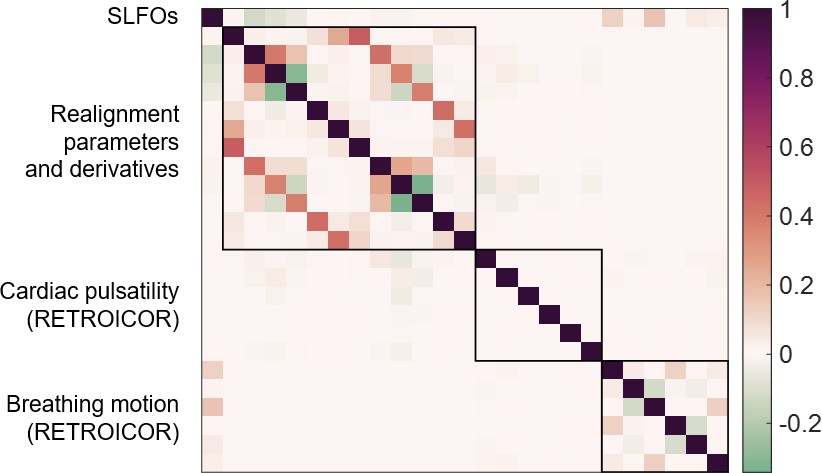
Collinearity across nuisance regressors.
Pearson correlation coefficients between the 25 nuisance regressors, averaged across all 1568 scans. Note that breathing motion had already been regressed out from the realignment parameters and its derivatives. The highest correlations were between realignment parameters and their derivatives, but even those were below 0.5.
Figure 7—figure supplement 5
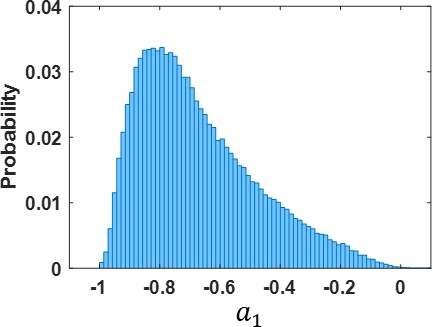
Histogram of autoregressive coefficients.
Distribution of autoregressive coefficients (across subjects and ROIs) which was used to generate the noise added to the surrogate datasets by random sampling.
Figure 8
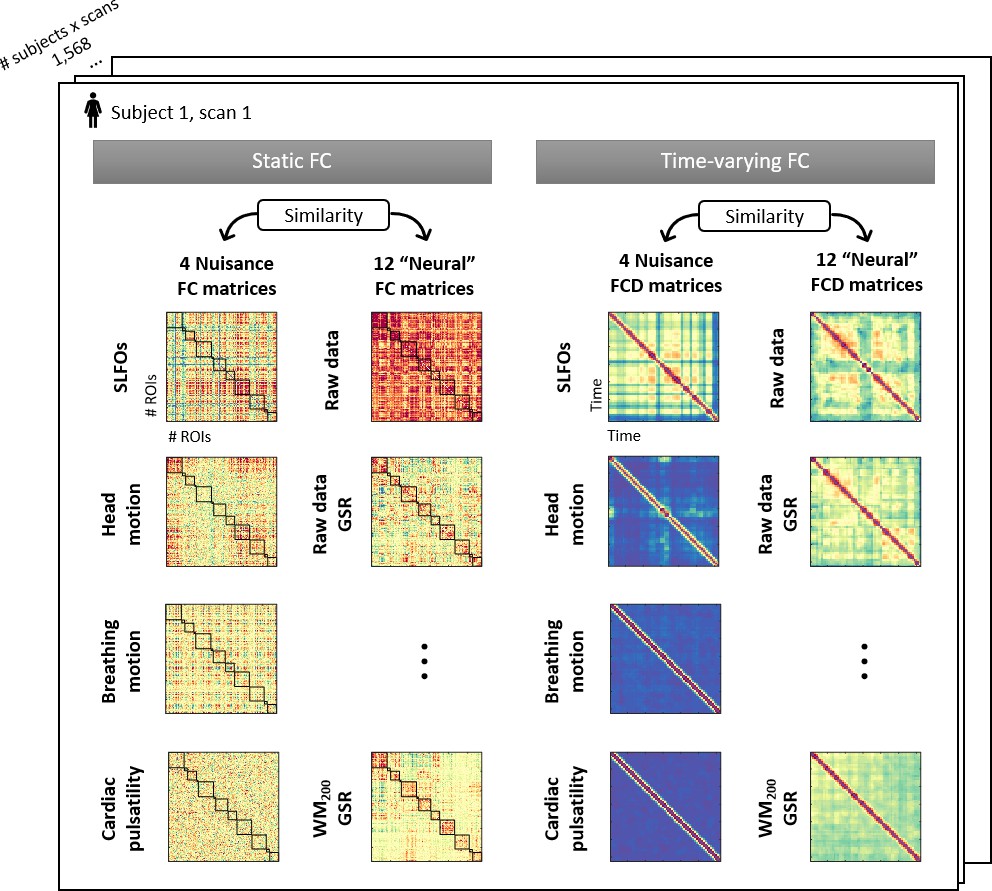
Illustration of the 32 connectivity matrices computed per scan.
For both static and time-varying FC analyses, four nuisance connectivity matrices were computed using the generated nuisance datasets, as well as 12 ‘neural’ connectivity matrices corresponding to the 12 pre-processing strategies evaluated (note that each of the six strategies listed in Table 1 was assessed with and without GSR). Static FC matrices were computed as the correlation across brain regions using the whole scan. Time-varying FC analysis constructed time-resolved connectivity matrices as the correlation between static FC matrices within sliding windows, known as functional connectivity dynamics (FCD) matrices (Hansen et al., 2015).
Author response image 1

Plot of mean framewise displacement (FD), which is an estimate of how much a subject moved inside the scanner, versus the correlation between the global signal (GS) and SLFOs, which is an estimate of how much physiological processes influenced the BOLD signal.
Each dot represents a scan.Most scans were low motion but were considerably affected by physiological processes.
Author response image 2

Effect of preprocessing strategies using(A) Gaussian noise or(B) autocorrelated noise to generate the surrogate datasets.
Author response image 3
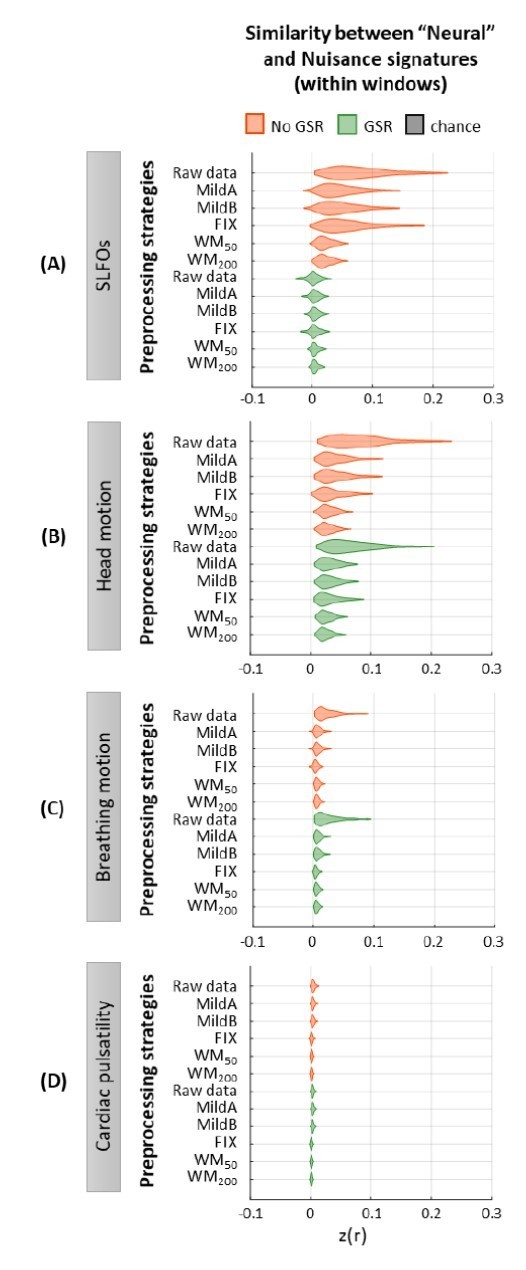
Similarity between “neural” and nuisance FC patterns within shorter windows.
Distribution of similarity (Pearson correlation coefficient) values between “neural” time-windowed FC matrices applying different preprocessing strategies and nuisance time-windowed FC matrices associated to (A)SLFOs, (B)head motion, (C)breathing motion, and (D)cardiac pulsatility. Correlation values were Fisher z transformed.
Tables
Table 1
Preprocessing strategies examined.
All strategies were evaluated with and without global signal regression (GSR).
| Preprocessing strategy | Acronym | Regressors included |
|---|---|---|
| Minimally preprocessed HCP data | Raw data | None |
| FIX-denoised HCP data | FIX | ICA-based technique combined with an automated component classifier (Salimi-Khorshidi et al., 2014) |
| Pipeline used in Finn et al., 2015, Nature Neuroscience | MildA | Mean time-series of the white matter and CSF voxels (2); realignment parameters and their first derivatives (12) |
| Pipeline used in Laumann et al., 2017, Cerebral Cortex | MildB | Mean time-series of the white matter and CSF voxels and their derivatives (4); realignment parameters and their first derivatives, quadratic terms, and squares of derivatives (24) |
| Pipeline proposed by Kassinopoulos and Mitsis, 2021a, bioRxiv | WM50 | 50 PCA components from white matter voxels |
| WM200 | 200 PCA components from white matter voxels |
Table 2
Nuisance processes examined.
| SLFOs | Cardiac pulsatility | Breathing motion | Head motion | |
|---|---|---|---|---|
| Recordings | Pulse oximeter, breathing belt, fMRI global signal | Pulse oximeter | Breathing belt | fMRI |
| Signals employed | Heart rate, respiratory flow, global signal | Cardiac cycle | Breathing cycle | Realignment parameters and derivatives |
| Model | Kassinopoulos and Mitsis, 2019, NeuroImage | 3rd order RETROICOR Glover et al., 2000, NeuroImage | 3rd order RETROICOR Glover et al., 2000, NeuroImage | - |
| Number of regressors | 1 | 6 | 6 | 12 |
Additional files
Download links
A two-part list of links to download the article, or parts of the article, in various formats.
Downloads (link to download the article as PDF)
Open citations (links to open the citations from this article in various online reference manager services)
Cite this article (links to download the citations from this article in formats compatible with various reference manager tools)
Physiological and motion signatures in static and time-varying functional connectivity and their subject identifiability
eLife 10:e62324.
https://doi.org/10.7554/eLife.62324


