Correlating STED and synchrotron XRF nano-imaging unveils cosegregation of metals and cytoskeleton proteins in dendrites
- Chemical Imaging and Speciation, CENBG, Univ. Bordeaux, France
- CNRS, IN2P3, CENBG, UMR 5797, France
- Univ. Bordeaux, CNRS, Interdisciplinary Institute for Neuroscience, IINS, UMR 5297, France
- ESRF, the European Synchrotron, France
- Univ. Bordeaux, CNRS, INSERM, Bordeaux Imaging Center, BIC, UMS, France
Figures
Figure 1 with 1 supplement

Workflow for correlative STED and synchrotron multimodal nano-imaging.
(a) Sample processing. Primary neurons are cultured on silicon nitride membranes and labeled with fluorescent probes designed for STED microscopy such as SiR-tubulin or SiR700-actin. STED microscopy is performed on living cells and orthonormal coordinates (x,y) of regions of interest are recorded. Immediately after STED microscopy cells are plunge-frozen and freeze-dried. New coordinates (x’,y’) of the regions of interest are calculated to perform XRF and PCI imaging on the synchrotron microscope. (b) Multi-modal imaging. Live-cell STED and confocal microscopy are performed within a thermalized chamber. Synchrotron XRF and PCI are carried out on freeze-dried samples. The KB optics are 185 m away from the X-ray source enabling to focus hard X-rays at 40 nm beam size. (c) Correlative imaging. Overlay images of STED, confocal, synchrotron PCI and XRF are produced on areas of few tens of µm large with a spatial resolution of 40 nm for STED, 30 nm for PCI and 40 nm for SXRF. Several elemental maps (here sulfur) can be super-imposed with protein distributions (i.e. actin or tubulin) in dendrites and spines at 40 nm spatial resolution.
Figure 1—figure supplement 1
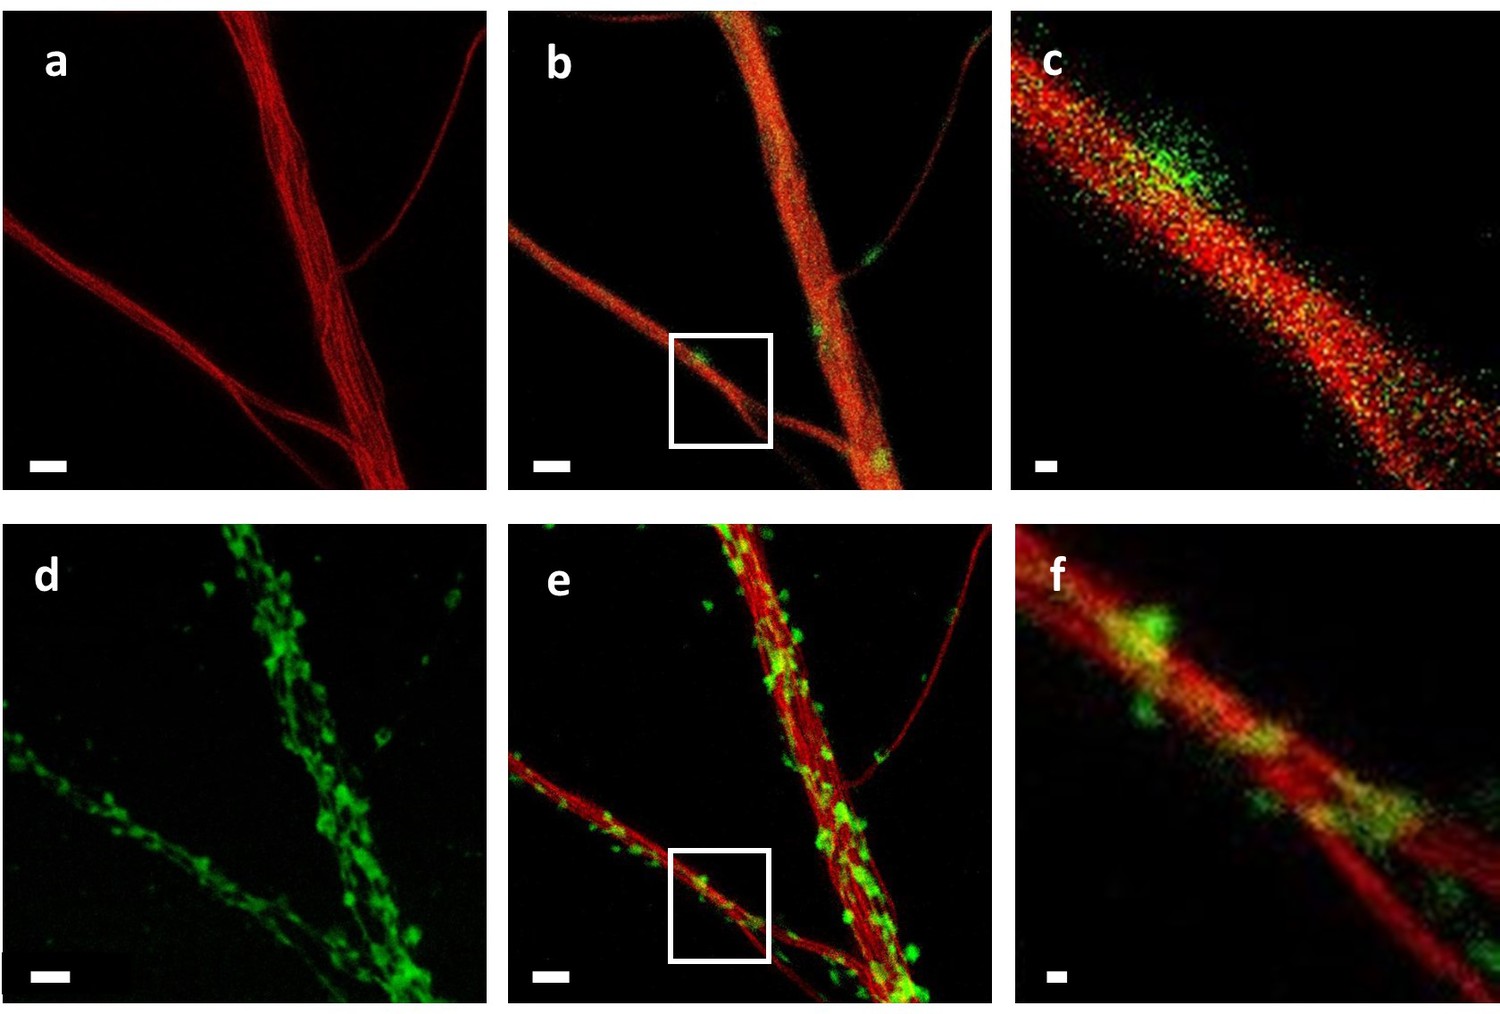
Correlation of STED imaging on live cells and of STXM microscopy after cryofixation and freeze-drying.
(a) Live STED imaging of dendrites after SiR-tubulin labeling. (b) Confocal image of the same dendrites showing tubulin in red and F-actin in green (SiR700-actin labeling). (c) Zoom on the framed region of image (b) showing a F-actin-rich protrusion (in green) on the tubulin-rich dendrite (in red). (d) STXM image of the same dendrite obtained with a spatial resolution of 25 nm after cryofixation and FD. (e) Superposition of live-cell STED (red) and FD cell STXM (green) images showing the good preservation of the cell structures after cryofixation and FD. (F) Zoom on the framed region in the image (e) showing the presence of dendritic protrusions revealed by STXM (in green). One of these protrusions is co-localized with the F-actin fluorescence visible in (c). Scale bars = 2 µm except for images c and f, scale bars = 250 nm.
Figure 2 with 1 supplement
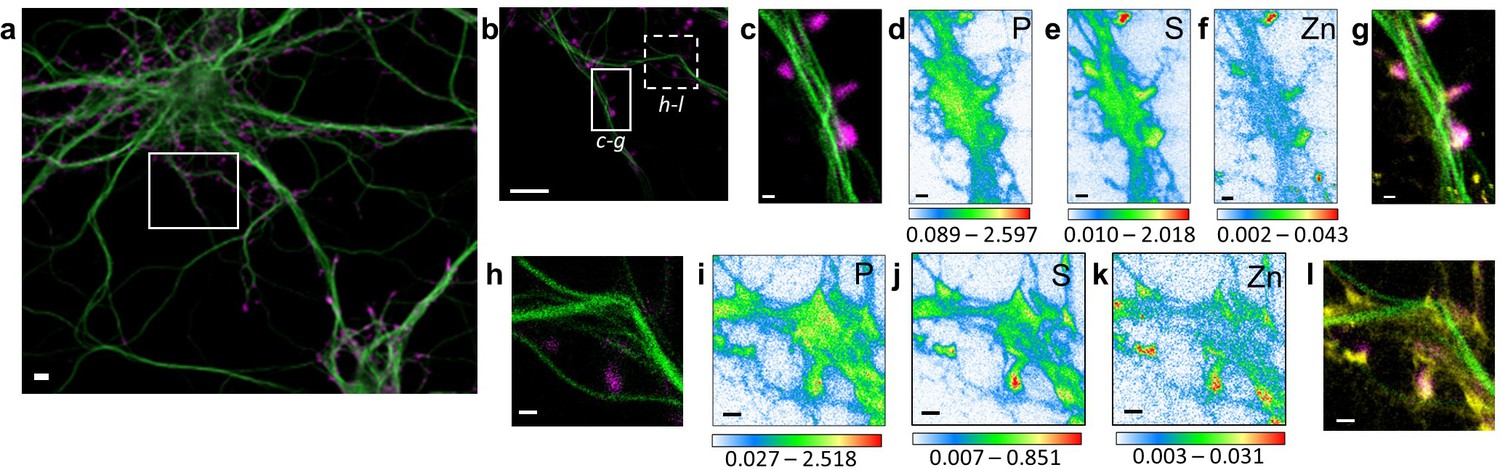
Correlative STED nano-SXRF element imaging in dendritic spines.
(a) Confocal image from a DIV15 primary rat hippocampal neuron stained with SiR-tubulin (green) and SiR700-actin (magenta). (b) STED image of SiR-tubulin (green) and confocal SiR700-actin (magenta) from the framed region shown in (a). (c) STED image of SiR-tubulin (green) and confocal SiR700-actin (magenta) for the region mapped by SXRF shown in (b) in plain line. (d) Phosphorus SXRF map. (e) Sulfur SXRF map. (f) Zinc SXRF map. (g) Merged images of zinc SXRF map (yellow), STED SiR-tubulin (green) and confocal SiR700-actin (magenta). (h) STED image of SiR-tubulin (green) and confocal SiR700-actin (magenta) image from the framed region shown in (b) in dotted line. (i) Phosphorous SXRF map. (j) Sulfur SXRF map. (k) Zinc SXRF map. (l) Merged images of zinc SXRF map (yellow), STED SiR-tubulin (green), and confocal SiR700-actin (magenta). Scale bars: 500 nm, except (a) and (b) 5 µm. Color scale bars: min-max values in ng.mm−2.
Figure 2—figure supplement 1
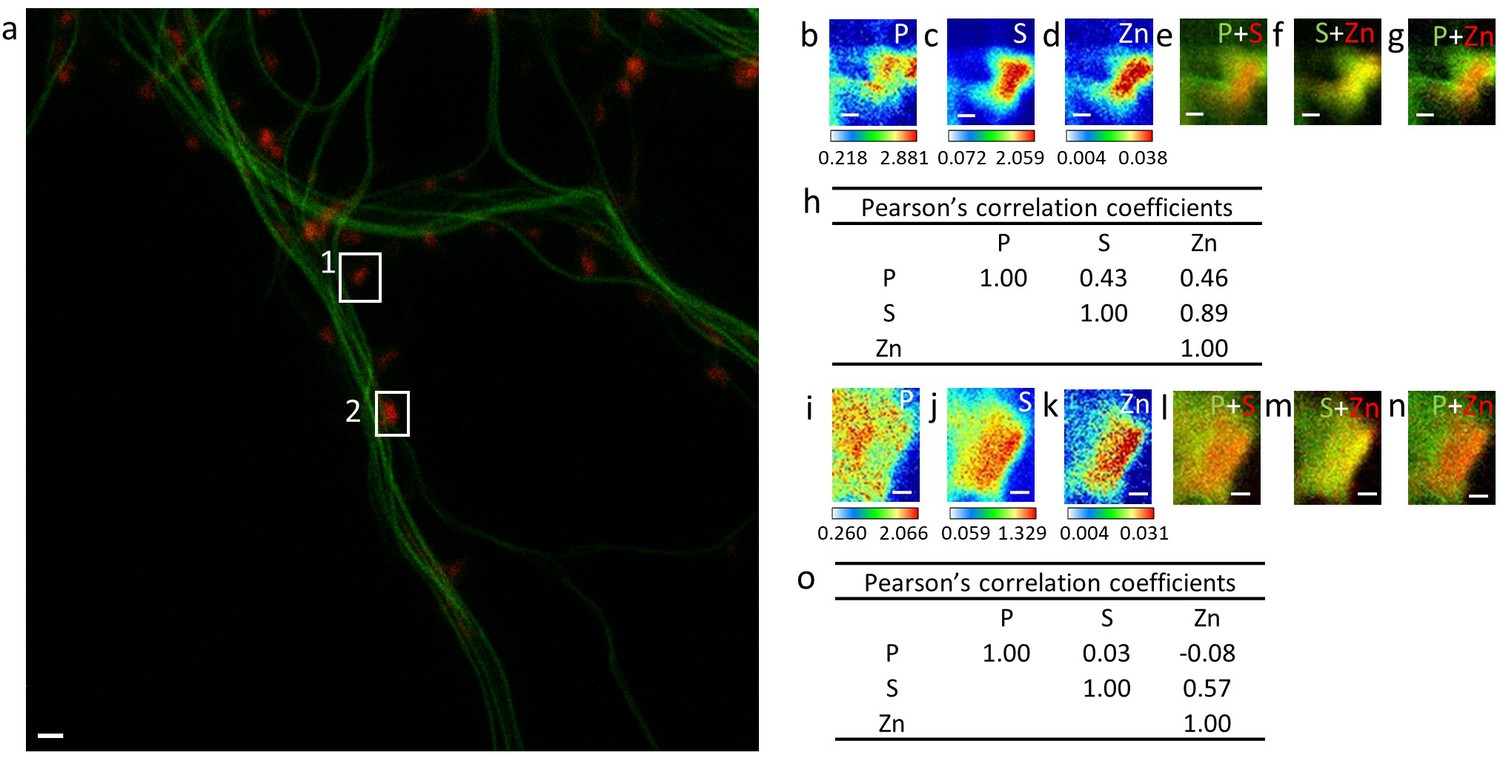
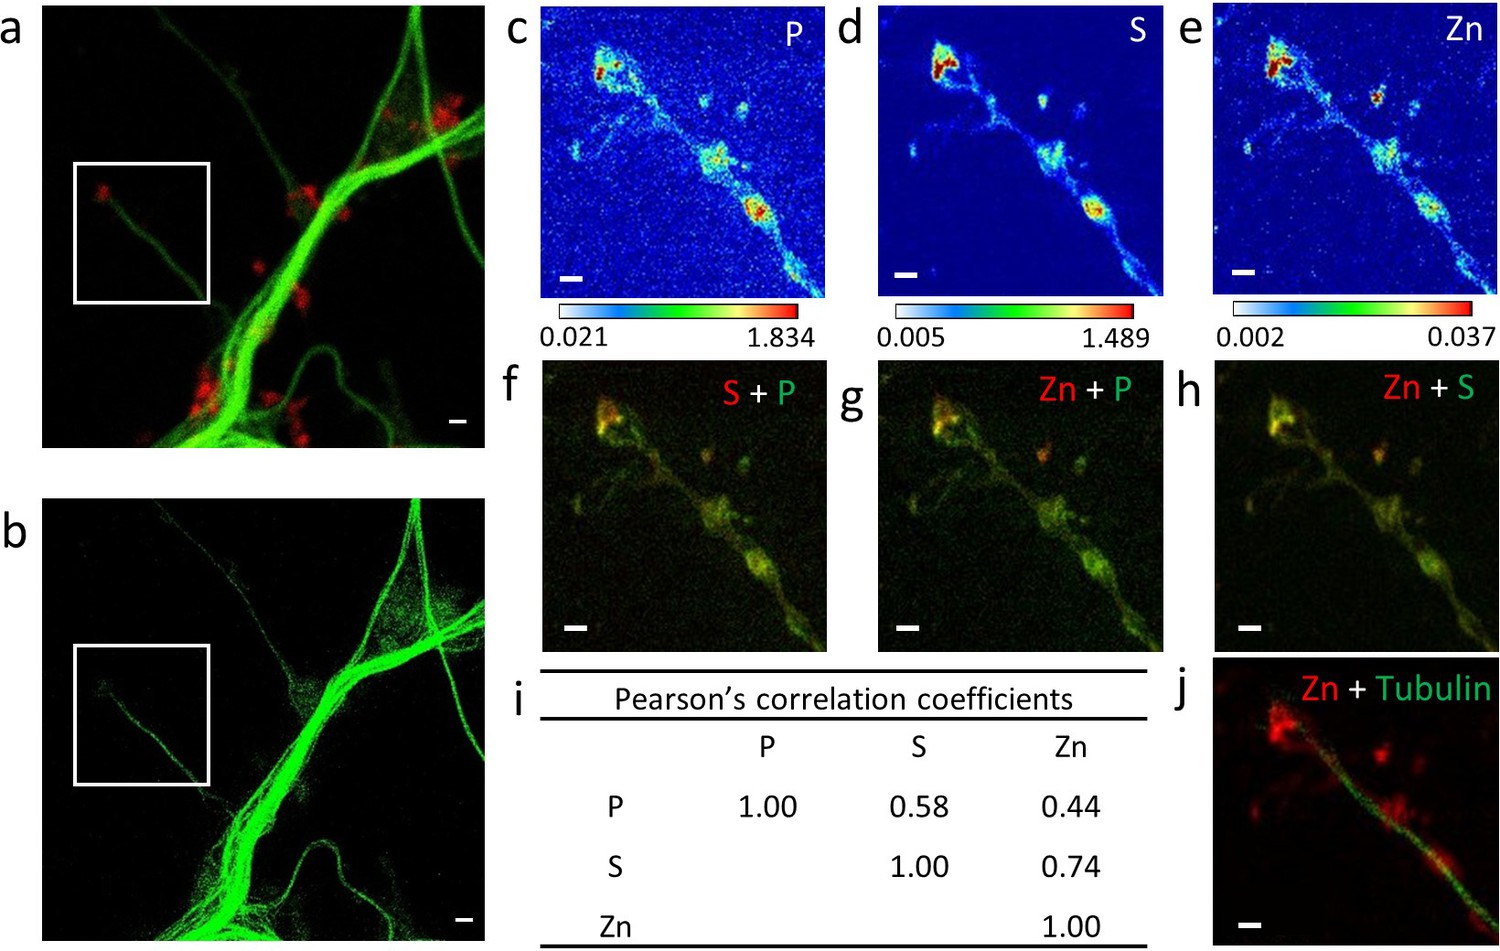
Element distributions in dendritic spines.
(a) STED image of SiR-tubulin (green) and confocal image of SiR700-actin (red). (b–d) SXRF element maps (P, S, Zn) from spine framed in (A) as region 1. (e) Overlay image of phosphorus (green) and sulfur (red). (f) Overlay image of sulfur (green) and zinc (red). (g) Overlay image of phosphorus (green) and zinc (red). (h) Pearson’s correlation coefficients for the elements in spine 1. (i–k) SXRF element maps (P, S, Zn) from spine framed in (a) as region 2. (l) Overlay image of phosphorus (green) and sulfur (red). (m) Overlay image of sulfur (green) and zinc (red). (n) Overlay image of phosphorus (green) and zinc (red). (o) Pearson’s correlation coefficients for the elements in spine 2. Scale bars 200 nm except for (a) 1 µm. Color scales: min-max values in ng.mm−2.
-
Figure 2—figure supplement 1—source data 1
Data for Pearson’s correlation coefficients of Figure 2—figure supplement 1 panel h.
- https://cdn.elifesciences.org/articles/62334/elife-62334-fig2-figsupp1-data1-v2.zip
-
Figure 2—figure supplement 1—source data 2
Data for Pearson’s correlation coefficients of Figure 2—figure supplement 1 panel o.
- https://cdn.elifesciences.org/articles/62334/elife-62334-fig2-figsupp1-data2-v2.zip
Figure 3 with 1 supplement
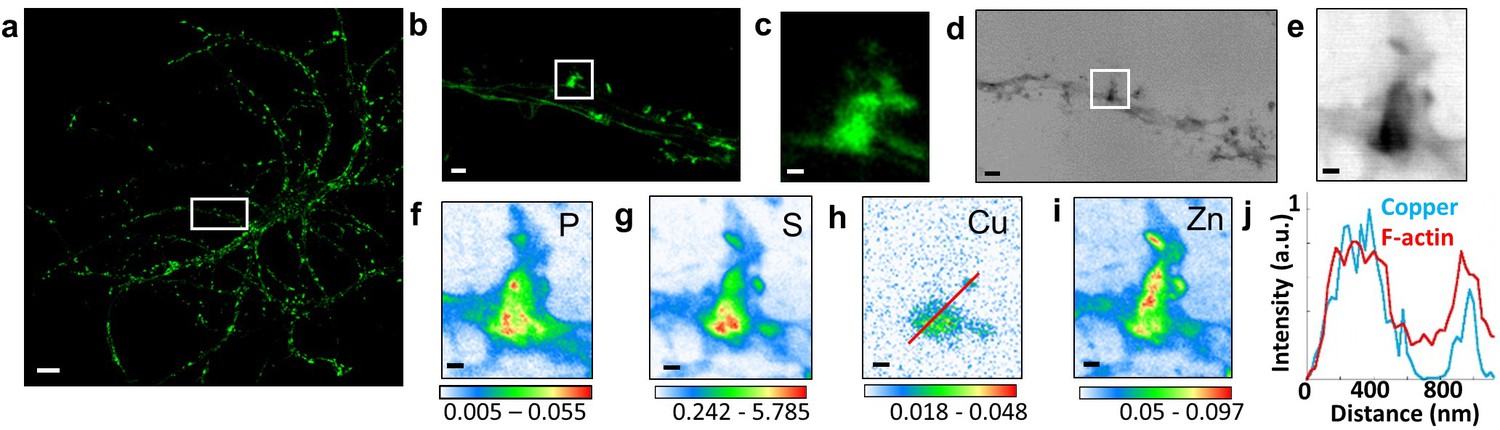
Correlative STED microscopy of SiR-actin with synchrotron PCI and XRF in spines.
(a) Confocal imaging of a primary rat hippocampal neuron labeled with SiR-actin showing F-actin-rich protrusions along dendrites. (b) STED imaging of SiR-actin of the dendrite region framed in white in a. (c) Zoom on the STED SiR-actin of a F-actin-rich protrusion framed in (b). (d) Synchrotron radiation X-ray PCI of the dendrite region framed in white in a. (e) Zoom on the PCI region of a F-actin-rich protrusion framed in (d). (f-i) SXRF element maps (P, S, Cu, Zn) from the region of interest framed in (b) and (d). (j) Line scans for F-actin (red) and copper (blue) normalized distributions along the red line plotted in (h). Scale bar: 200 nm, except for (a) 10 µm, (b) and (d) 1 µm. Color scales: min-max values in ng.mm−2.
Figure 3—figure supplement 1

Element distributions in dendrites and spines.
(A) Confocal image of SiR-tubulin (green) and SiR700-actin (red) in dendrites. (B) STED image of SiR-tubulin in the same zone as in (A). (C) Confocal large image including the region shown in (A) with SiR-tubulin (green) and SiR700-actin (red). (D–G) SXRF element maps (P, S, Cu, Zn) from the same region as (A). (H) Overlay image of STED SiR-tubulin (green) and zinc (red). (I) Overlay image of sulfur (green) and zinc (red). (J) Overlay image of phosphorus (green) and zinc (red). (K) Overlay image of copper (green) and zinc (red). Scale bar: 1 µm except for (C) 10 µm. Color scales: min-max values in ng.mm−2.
Figure 4 with 1 supplement
Correlative imaging in dendrites and spines.
(a) Confocal image of SiR-tubulin (green) and SiR700-actin (red). (b) STED image of SiR-tubulin (green) for the same zone as in (a). (c-e) SXRF element maps (P, S, Zn) from the region of interest framed in (a) and (b). (f) Overlay image of phosphorus (green) and sufur (red). (g) Overlay image of phosphorus (green) and zinc (red). (h) Overlay image of sulfur (green) and zinc (red). (i) Pearson’s correlation coefficients for the elements (P, S, Zn) in the roi. (j) Overlay image of STED SiR-tubulin (green) and zinc (red). Scale bars: 500 nm, except for (a) and (b) 1 µm. Color scales min-max values in ng.mm−2.
-
Figure 4—source data 1
Data for Pearson’s correlation coefficients.
- https://cdn.elifesciences.org/articles/62334/elife-62334-fig4-data1-v2.zip
Figure 4—figure supplement 1
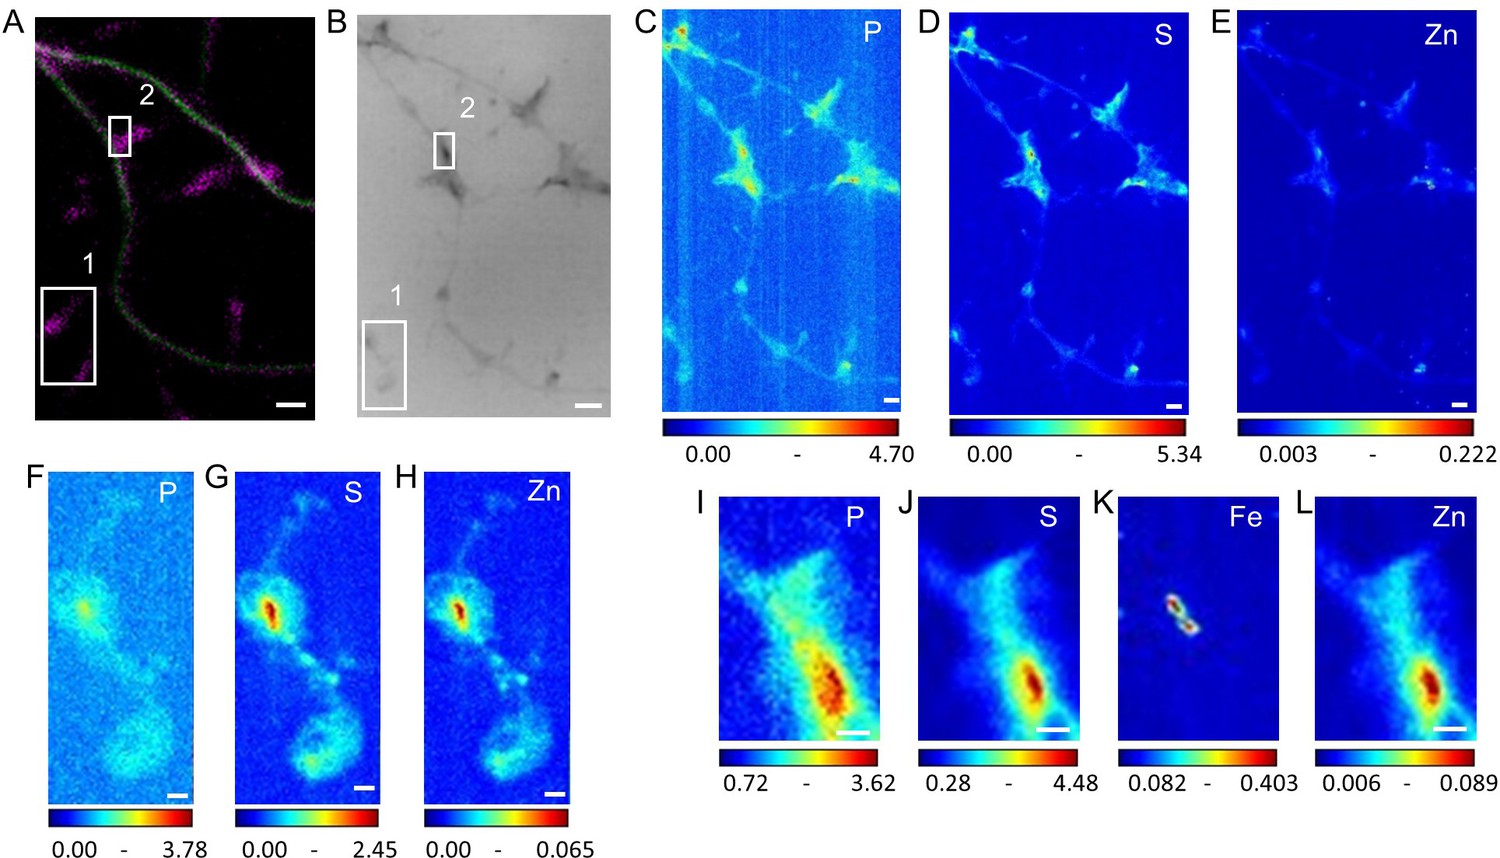
Multimodal imaging of dendrites and spines.
(A) STED SiR-tubulin (green) and confocal SiR700-actin (magenta) (B) Synchrotron radiation X-ray PCI of the same area as (A). (C–E) SXRF element maps (P, S, Zn) from the same region as (A) and (B). (F–H) SXRF element maps (P, S, Zn) from the framed region one in (B). (I–L) SXRF element maps (P, S, Fe, Zn) from the framed region two in (B). Scale bars: 200 nm, except (A) and (B) 1 µm. Color scales min-max values in ng.mm−2.
Figure 5 with 1 supplement
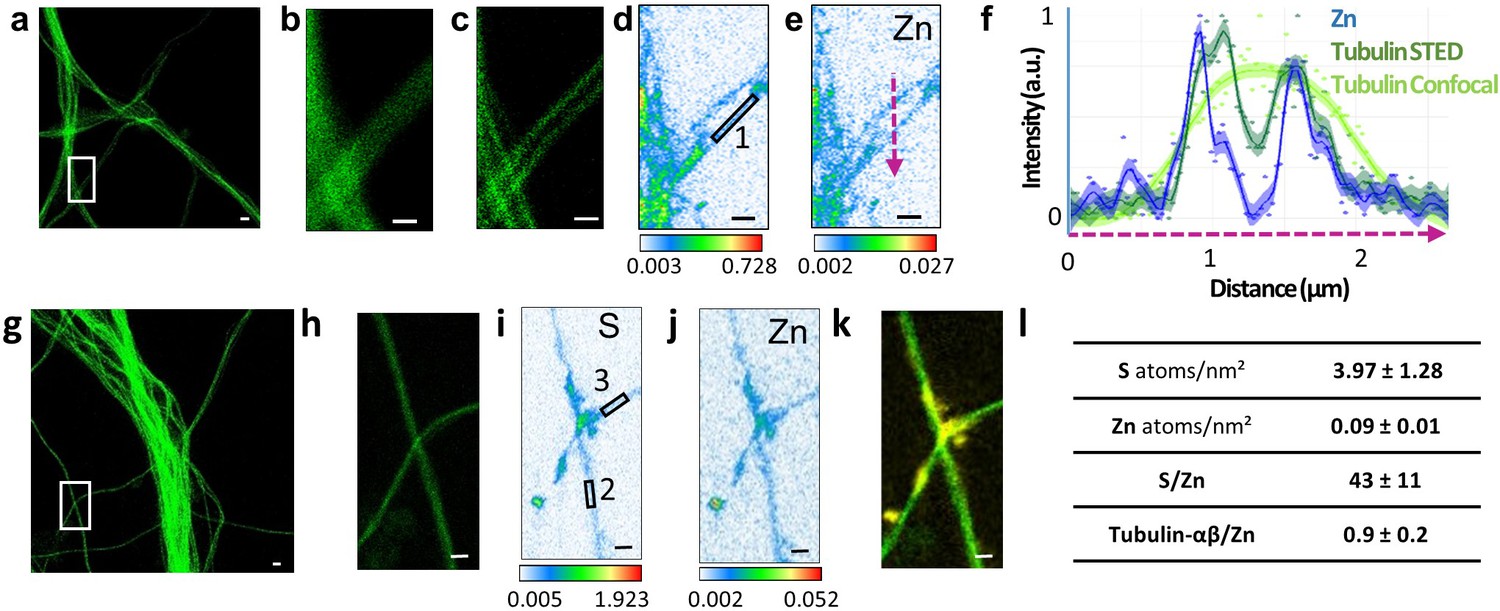
Correlative STED and nano-SXRF imaging in dendrites.
(a) STED image of SiR-tubulin (green). (b) Confocal SiR-tubulin image of the region framed in (a). (c) STED SiR-tubulin image of the region framed in (a). (d) Sulfur SXRF map. (e) Zinc SXRF map. (f) Intensity plot profiles of zinc (blue), STED SiR-tubulin (dark green), and confocal SiR-tubulin (light green) along a line scan crossing two thin dendrites (magenta dotted line in (e)). (g) STED image of SiR-tubulin (green) in dendrites. (h) STED SiR-tubulin of the region framed in (g). (i) Sulfur SXRF map. (j) Zinc SXRF map. (k) Overlay image of STED SiR-tubulin (green) and zinc distribution (yellow). (l) Quantitative data analysis of the number of sulfur and zinc atoms.nm−2 for 21 regions of interest centered on thin microtubules as illustrated for roi 1 to 3 framed in D and I (mean ± SD; n = 21; see also Supplementary file 1). Scale bars: 500 nm, except for (a) and (g) 1 µm.
Figure 5—figure supplement 1
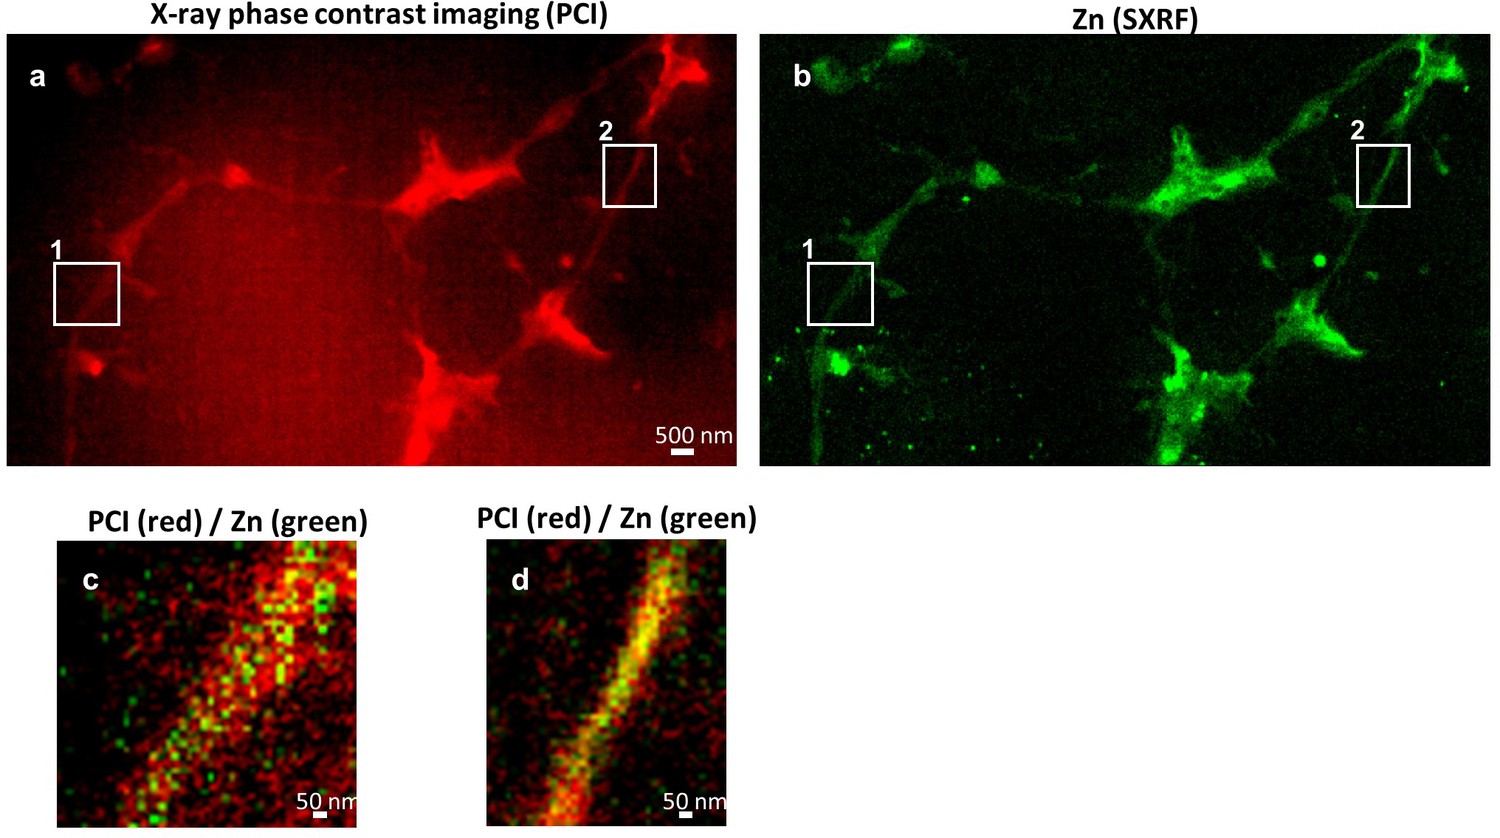
Multimodal imaging of dendrites.
(a) Synchrotron X-ray phase contrast imaging (PCI) showing the dendrites and spines morphology. (b) SXRF imaging of Zn in the same sample area. (c) Overlay image of PCI (red) and Zn (green) from a ‘thick’ dendrite (region 1) showing Zn inside the dendritic structure. (d) Overlay image of PCI (red) and Zn (green) from a ‘thin’ dendrite (region 2) showing that Zn distribution and dendrite morphology have the same dimensions.
Figure 6 with 1 supplement
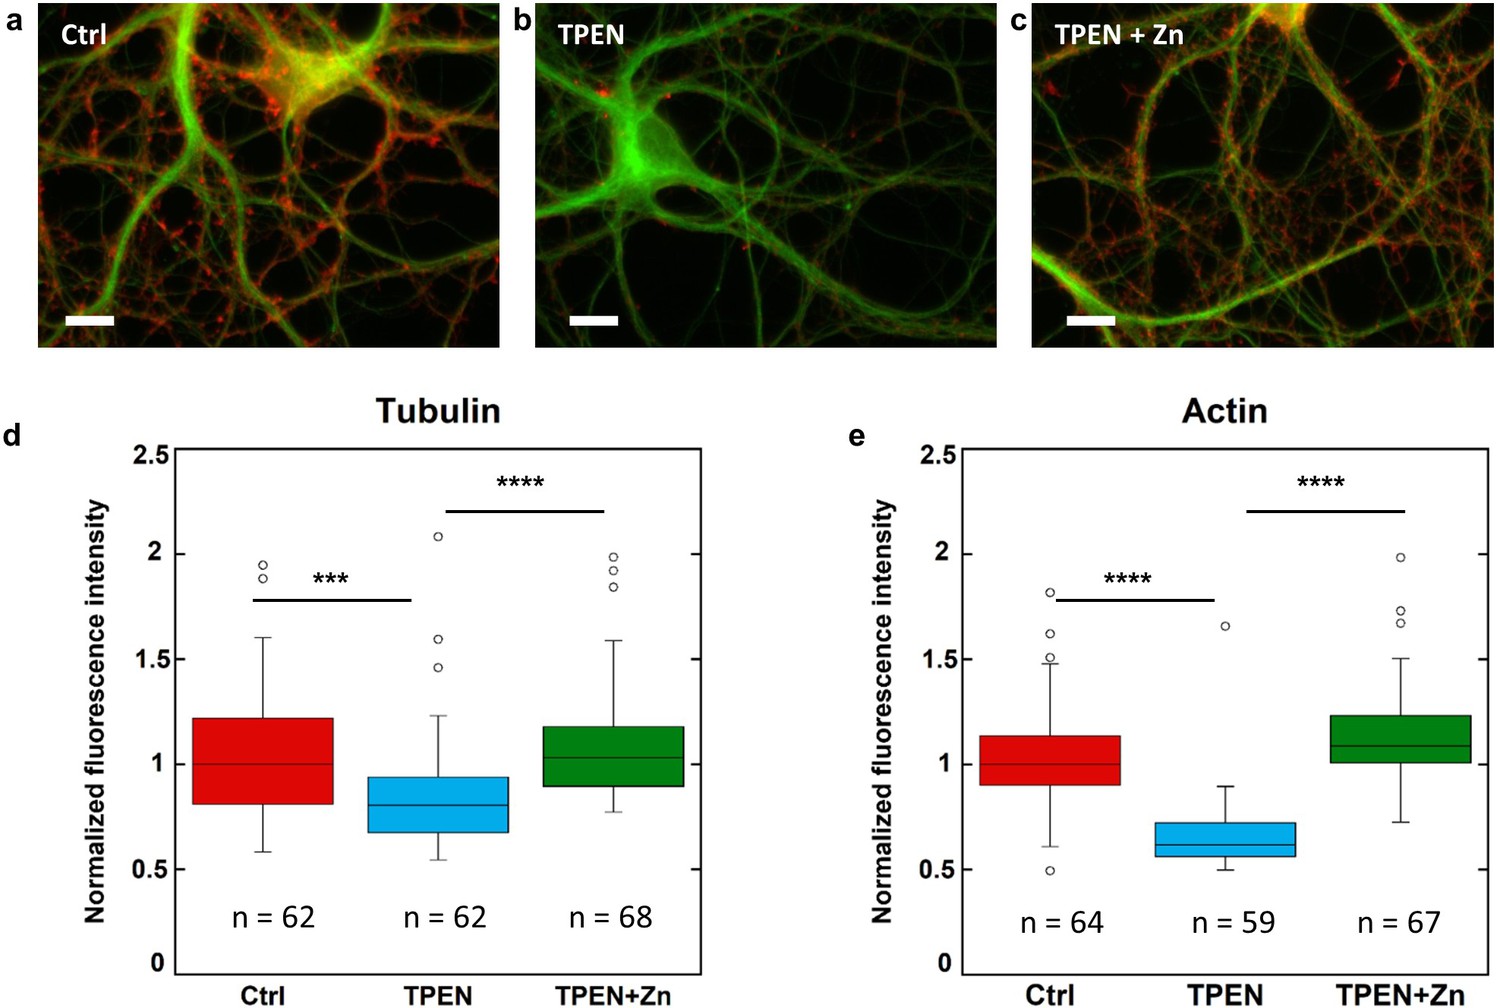
β-tubulin and F-actin fluorescence in control, TPEN, or TPEN and Zn treated neurons.
(a) Representative fluorescence microscopy images of F-actin (red) and β-tubulin (green) in dendrites from control neurons. Scale bar = 10 µm. (b) TPEN treated neurons (5 µM, 24 hr). (c) TPEN (5 µM, 24 hr) and Zn (10 µM, 24 hr) treated neurons. (d) Comparison of β-tubulin normalized fluorescence intensities. (e) Comparison of F-actin normalized fluorescence intensities. Significant Kruskal-Wallis test (p<0.01) was followed by Dunn’s test with p-values adjusted for pairwise comparisons: ***adj.p-value<0.001, ****adj.p-value<0.0001 (detailed in Supplementary file 2).
-
Figure 6—source data 1
Data for F-actin are available in file.
- https://cdn.elifesciences.org/articles/62334/elife-62334-fig6-data1-v2.xlsx
-
Figure 6—source data 2
Data for β-tubulin are available in file.
- https://cdn.elifesciences.org/articles/62334/elife-62334-fig6-data2-v2.xlsx
Figure 6—figure supplement 1
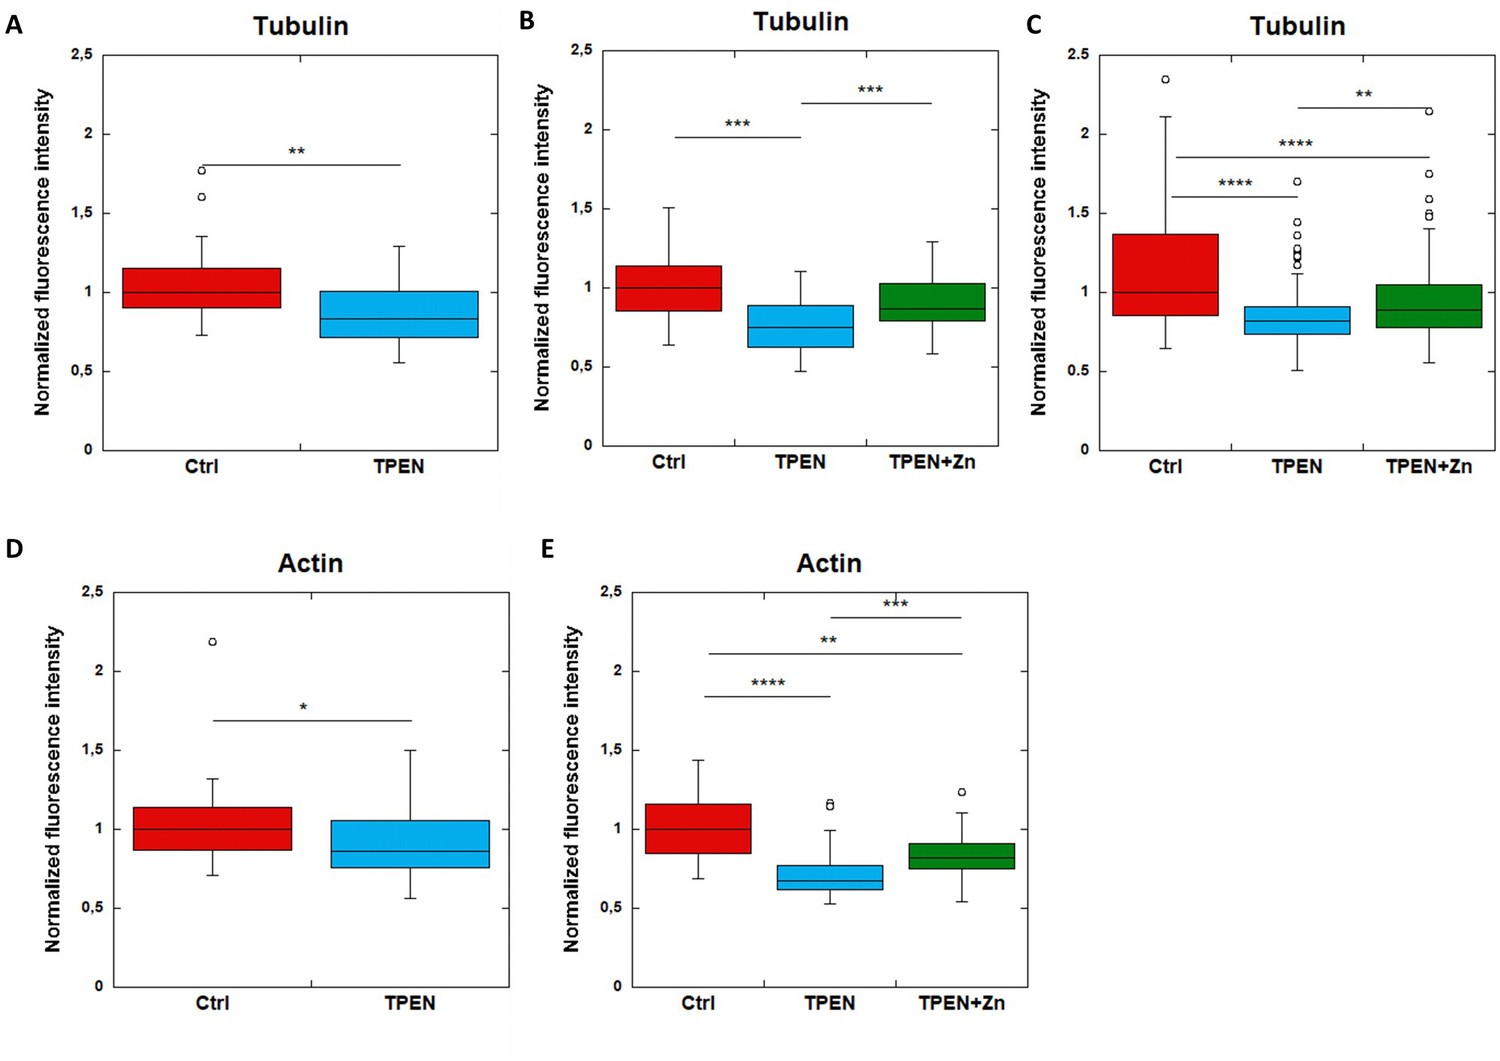
F-actin and β-tubulin fluorescence in control, TPEN, or TPEN and Zn treated neurons.
Replicates of TPEN (5 µM, 24 hr) or TPEN (5 µM, 24 hr) and Zn (10 µM, 24 hr) exposure experiments presented in Figure 6. (A–C) Comparison of β-tubulin normalized fluorescence intensities. (D–E) Comparison of F-actin normalized fluorescence intensities. *p-value<0.05, **p-value<0.001, ***p-value<0.001, ****p-value<0.0001 (see Supplementary file 2 for details on statistical analysis).
-
Figure 6—figure supplement 1—source data 1
F-actin data for Figure 6—figure supplement 1 are available in file.
- https://cdn.elifesciences.org/articles/62334/elife-62334-fig6-figsupp1-data1-v2.xlsx
-
Figure 6—figure supplement 1—source data 2
Tubulin data for Figure 6—figure supplement 1 are available in file.
- https://cdn.elifesciences.org/articles/62334/elife-62334-fig6-figsupp1-data2-v2.xlsx
Tables
Table 1
LOD calculated according to IUPAC (International Union of Pure and Applied Chemistry) guideline as derived from 12 blank measurements for phosphorus, sulfur, potassium and zinc, expressed in ng.mm−2, and expressed in g (and number of atoms) within pixels of 40 nm x 40 nm size.
| Phosphorus | Sulfur | Potassium | Zinc | |
|---|---|---|---|---|
| LOD | 0.513 ng.mm−2 | 0.138 ng.mm−2 | 0.152 ng.mm−2 | 0.009 ng.mm−2 |
| LOD in 40 nm x 40 nm pixel | 8.2 10−19 g (16,000 atoms) | 2.2 10−19 g (4200 atoms) | 2.4 10−19 g (3800 atoms) | 1.4 10−20 g (130 atoms) |
-
Table 1—source data 1
LOD calculation data.
- https://cdn.elifesciences.org/articles/62334/elife-62334-table1-data1-v2.xlsx
Key resources table
| Reagent type (species) or resource | Designation | Source or reference | Identifiers | Additional information |
|---|---|---|---|---|
| Biological sample (Rattus norvegicus) | Primary rat hippocampal neurons | Janvier labs, St Berthevin, France | Freshly isolated from E18 Sprague-Dawley rats | |
| Antibody | Mouse IgG1 anti-beta tubulin (mouse, monoclonal) | Sigma Aldrich | Sigma T4026 RRID:AB_477577 | (1:3000) |
| Antibody | Goat anti Mouse IgG1 CF568 (goat, polyclonal) | Ozyme | Ozyme BTM20248 RRID:AB_10854985 | (1:500) |
| Chemical compound, drug | Phalloidin-Alexa647 | Thermo Fisher Invitrogen | A22287 | (1:40) |
| Chemical compound, drug | SiR-actin | Spirochrome | SC001 | 1 µM |
| Chemical compound, drug | SiR-tubulin | Spirochrome | SC002 | 1 µM |
| Chemical compound, drug | SiR700-actin | Spirochrome | SC013 | 1 µM |
| Chemical compound, drug | TPEN (N,N,N,N-Tetrakis(2-pyridylmethyl)ethylenediamine) | Sigma Aldrich | P4413 | 5 µM |
| Chemical compound, drug | Zn (zinc chloride) | Sigma Aldrich | Z0152 | 10 µM |
| Chemical compound, drug | cytosine- arabinofuranoside | Sigma Aldrich | C6645 | |
| Chemical compound, drug | Paraformaldehyde | EMS | EMS 15710 | Used at 2 or 4% |
| Chemical compound, drug | BrainPhys medium | STEMCELL | 05790 | |
| Chemical compound, drug | Neurobasal medium | GIBCO | A3582901 | |
| Chemical compound, drug | Neurocult SM1 neuronal supplement | STEMCELL | 05711 | |
| Chemical compound, drug | poly-lysine | Sigma Aldrich | P2636 | |
| Chemical compound, drug | 2-methylbutane | Sigma Aldrich | M32631 | |
| Chemical compound, drug | ethanol | Sigma Aldrich | 39278 | |
| Commercial assay, kit | ReadyProbes cell viability imaging kit Blue/Green | Thermo-Fischer Scientific | R37609 | |
| Software, algorithm | R. software | R. Core Team | v 3.6.1 | https://www.R-project.org/ |
| Software, algorithm | R-studio software | R-studio | v1.2.5001 | http://www.rstudio.com/ |
| Software, algorithm | ImageJ software | ImageJ | http://imagej.nih.gov/ij/ | |
| Software, algorithm | PyMCA software | PyMCA (ESRF) | http://pymca.sourceforge.net/ | |
| Other | SN, silicon nitride membranes | Silson Ltd, Southam, UK | SiRN-5.0(o)−200–1.5-500 | Includes orientation frame |
Additional files
-
Source data 1
Data source for Supplementary file 1.
- https://cdn.elifesciences.org/articles/62334/elife-62334-data1-v2.xlsx
-
Supplementary file 1
Nano-SXRF quantitative data.
Analysis of chemical elements content for 21 regions showing zinc and tubulin co-localization, expressed in ng.mm−2 and in atoms.nm−2 (mean ± SD, n = 21).
- https://cdn.elifesciences.org/articles/62334/elife-62334-supp1-v2.docx
-
Supplementary file 2
Statistical analysis of data.
- https://cdn.elifesciences.org/articles/62334/elife-62334-supp2-v2.docx
-
Transparent reporting form
- https://cdn.elifesciences.org/articles/62334/elife-62334-transrepform-v2.pdf
Download links
A two-part list of links to download the article, or parts of the article, in various formats.
Downloads (link to download the article as PDF)
Open citations (links to open the citations from this article in various online reference manager services)
Cite this article (links to download the citations from this article in formats compatible with various reference manager tools)
Correlating STED and synchrotron XRF nano-imaging unveils cosegregation of metals and cytoskeleton proteins in dendrites
eLife 9:e62334.
https://doi.org/10.7554/eLife.62334


