A dietary sterol trade-off determines lifespan responses to dietary restriction in Drosophila melanogaster females
- Monash University, School of Biological Sciences, Australia
Figures
Figure 1
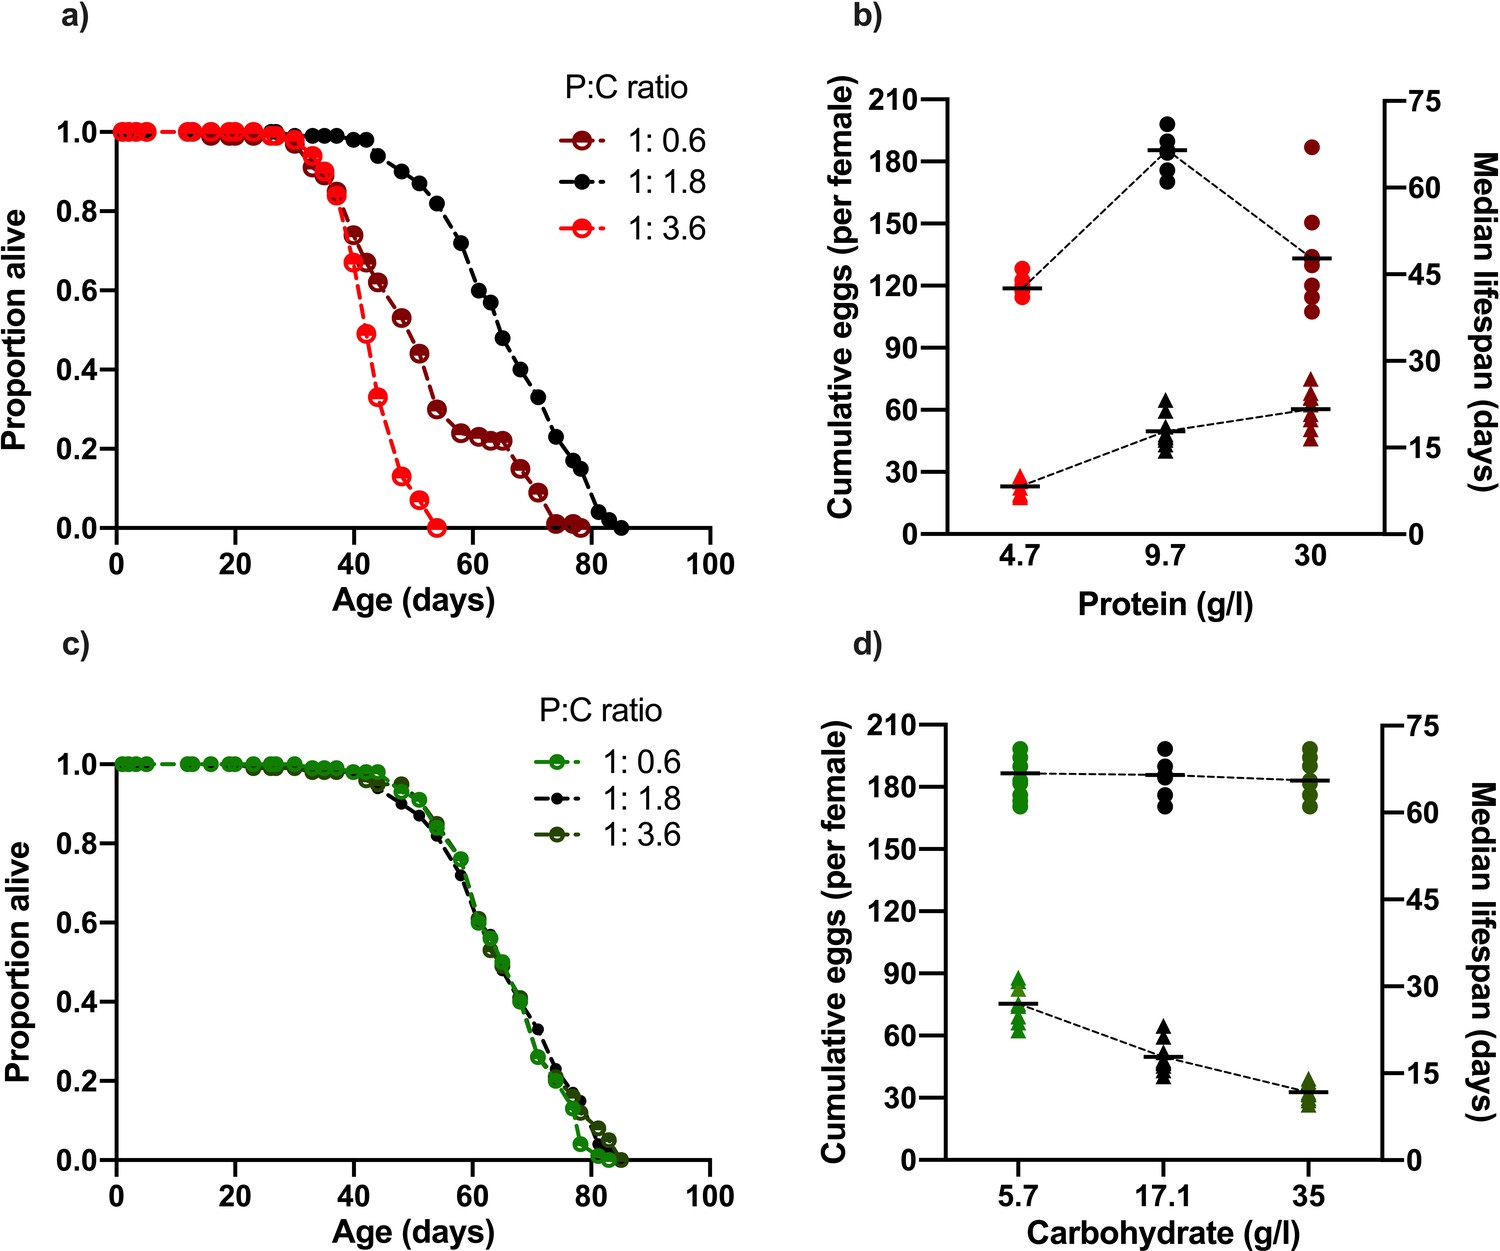
Changing dietary protein and carbohydrate concentrations modify Drosophila lifespan and fecundity.
(a, b) Lifespan was maximised at our intermediate dose of dietary protein (carbohydrate fixed at 17.1 g/l) but was unaffected by our carbohydrate (c, d) concentration range (protein fixed at 9.7 g/l). (b) Cumulative egg production had a significant positive relationship with protein levels and (d) significant negative correlation with dietary carbohydrate content. Note that the intermediate protein and carbohydrate diet (9.7 g/l protein, 17.1 g/l carbohydrate) is common to both nutrient dilution series. The median survival data in panels (b) and (d) represent data from replicates that are combined in panels (a) and (c), respectively. (b,d) Cumulative eggs laid per female are represented as triangles while median survival (days) are shown as circles. Statistical analysis reported in Supplementary files 1 and 2.
Figure 2 with 2 supplements

Dietary cholesterol content significantly modified the effect of protein and carbohydrate content on lifespan and reproduction.
Lowering cholesterol most severely compromised lifespan as protein levels increased and as carbohydrate levels decreased. In general, increasing protein and decreasing carbohydrate drove increasing levels of egg production, and this was enhanced by increasing dietary cholesterol levels. Lines show the relationship between the cumulative eggs laid per female (left Y axis) or median survival (days) (right Y axis) and dietary protein or carbohydrate levels across each cholesterol level. (0 g/l (a, b), 0.15 g/l (c, d), 0.3 g/l (e, f), 0.6 g/l (g, h)). Cumulative eggs laid per female are represented as triangles while median survival (days) are shown as circles. Statistical analysis reported in Supplementary files 5 and 6.
Figure 2—figure supplement 1
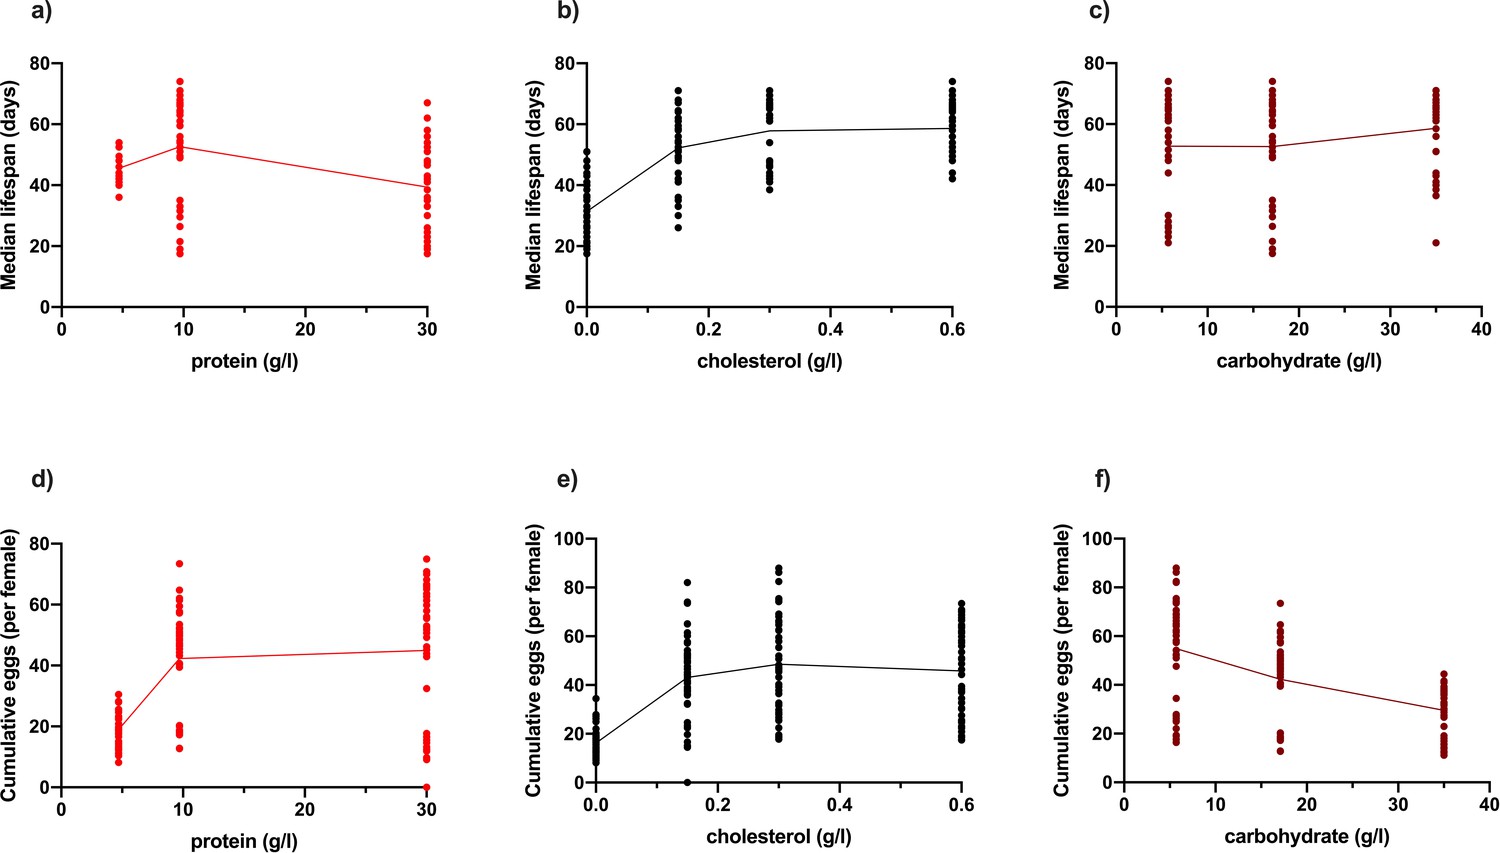
Changing dietary protein and cholesterol concentrations modify Drosophila lifespan (a–c), while changing protein, cholesterol and carbohydrate concentrations modify egg production (d–f).
Diets varying in protein and carbohydrate concentration were each made at 4 levels of cholesterol (b, e) 0 g/l, 0.15 g/l, 0.3 g/l and 0.6 g/l. (a) Lifespan is reduced at both low and high protein concentrations, (b) was improved by increasing dietary cholesterol concentration, and (c) was unchanged by changing dietary carbohydrate concentration. Egg laying was improved by increasing protein (d) and cholesterol concentrations, but decreased with carbohydrate concentration (f).
Figure 2—figure supplement 2
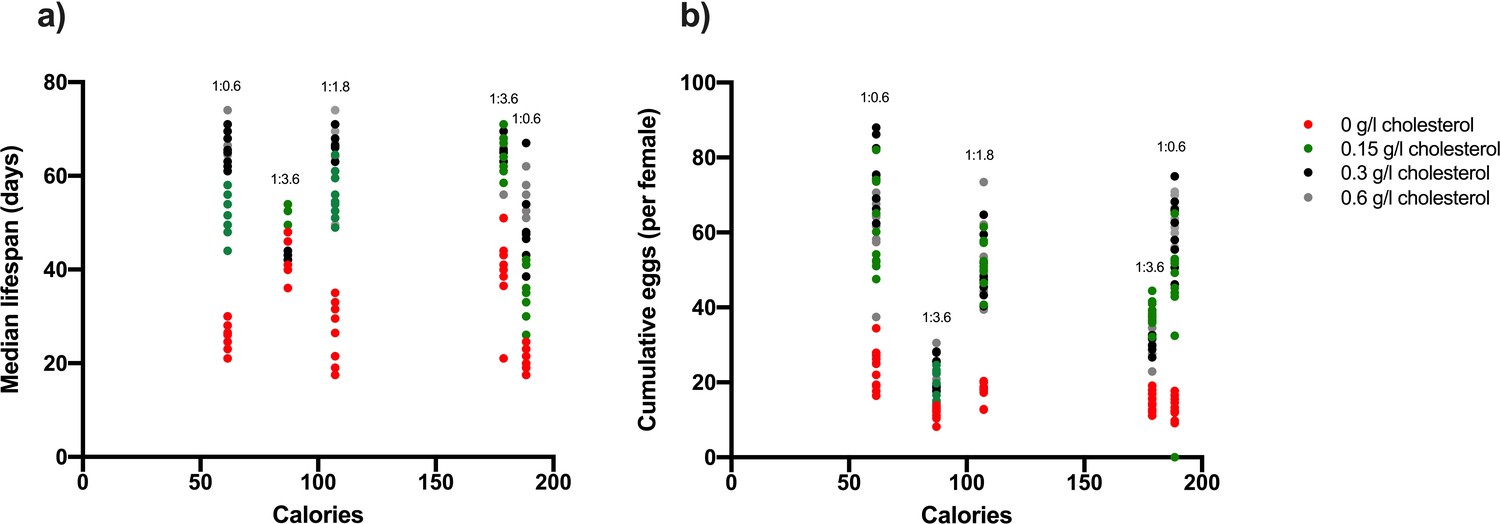
Dietary energy intake (calories) does not mediate lifespan or egg production in Drosophila (a, b), while changing P:C ratio and cholesterol do (a, b).
Diets varying in protein and carbohydrate concentration were each made at three alternate P:C ratios, four levels of cholesterol (a, b) 0 g/l, 0.15 g/l, 0.3 g/l and 0.6 g/l, and five caloric concentrations (a, b). Lifespan is reduced when the P:C ratio is high and the dietary cholesterol concentration is low, while egg laying was improved by increasing the P:C ratio and cholesterol concentration (a, b). These effects are independent of calories (a, b).
Figure 3
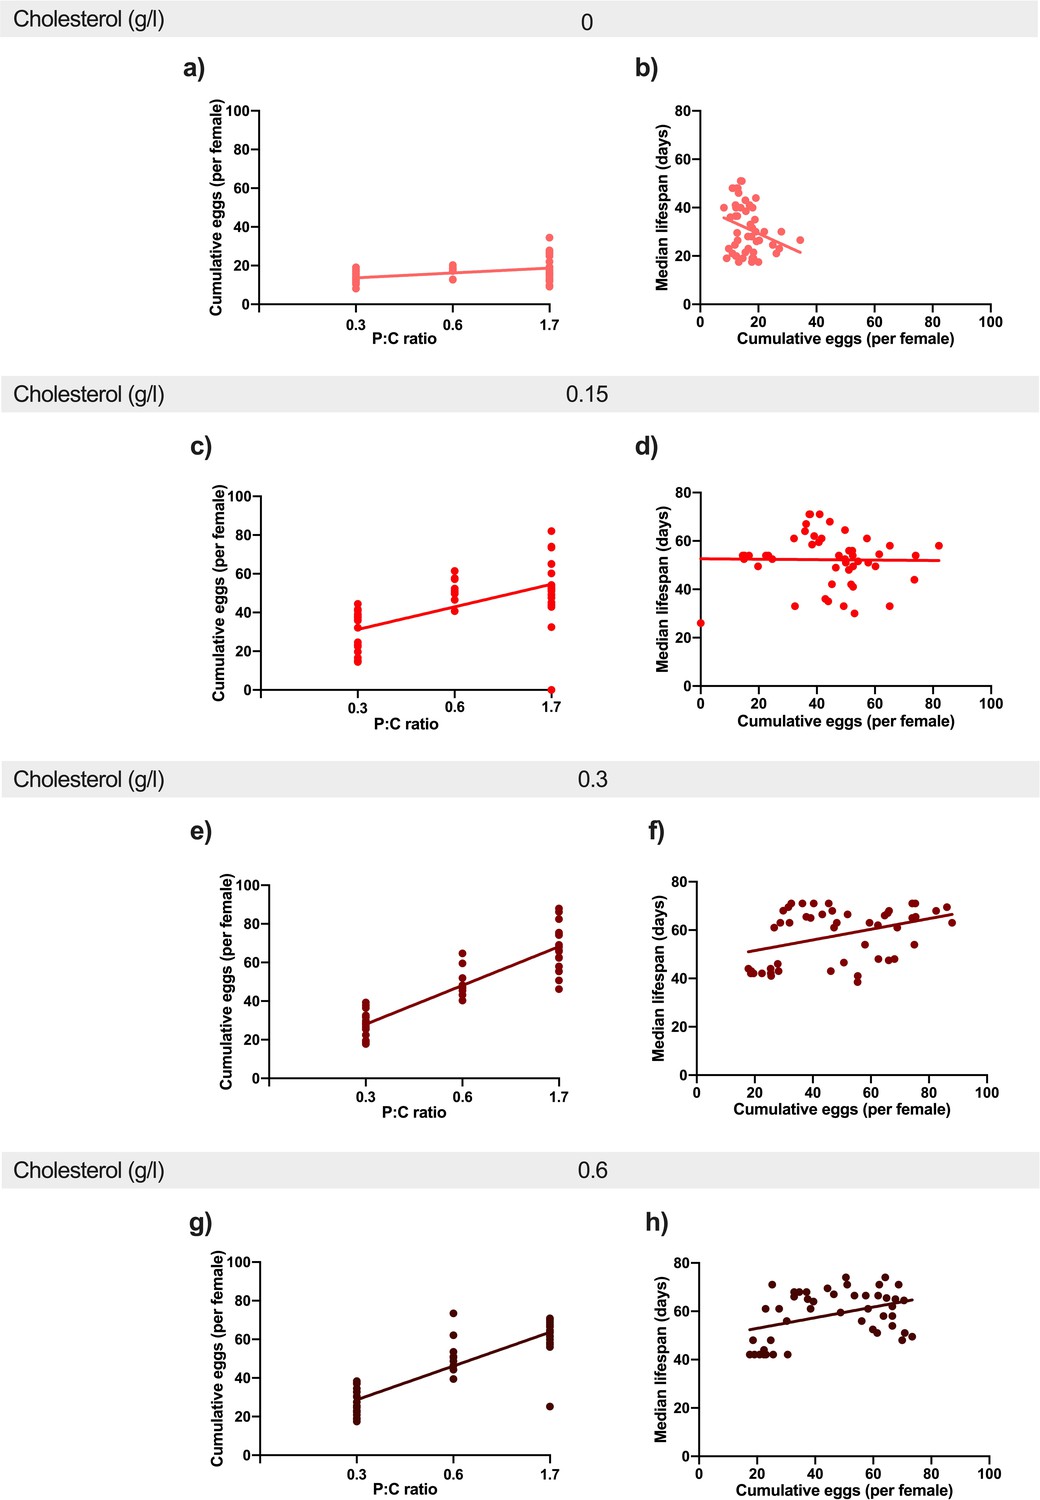
Increasing dietary protein: carbohydrate ratio resulted in increased egg production at every level of cholesterol.
This positive effect was stronger from 0 g/l cholesterol (a) to 0.15 g/l (c) and 0.3 g/l (e). There was no additional benefit of further increasing cholesterol to 0.6 g/l (g). Regression lines show the relationship between cumulative eggs laid per female and protein: carbohydrate ratio. Providing adequate cholesterol transforms the relationship between egg production and lifespan from negative to positive. When cholesterol was not available (0 g/l) (b), there was a negative relationship between egg laying and lifespan as dietary protein and carbohydrate levels were varied. When cholesterol was provided at (0.15 g/l)(d) or above (f, h), this negative relationship was eliminated and egg production varied independently of lifespan. Regression lines show the relationship between cumulative eggs laid per female and median survival (days) in response to varying levels of cholesterol availability.
Figure 4
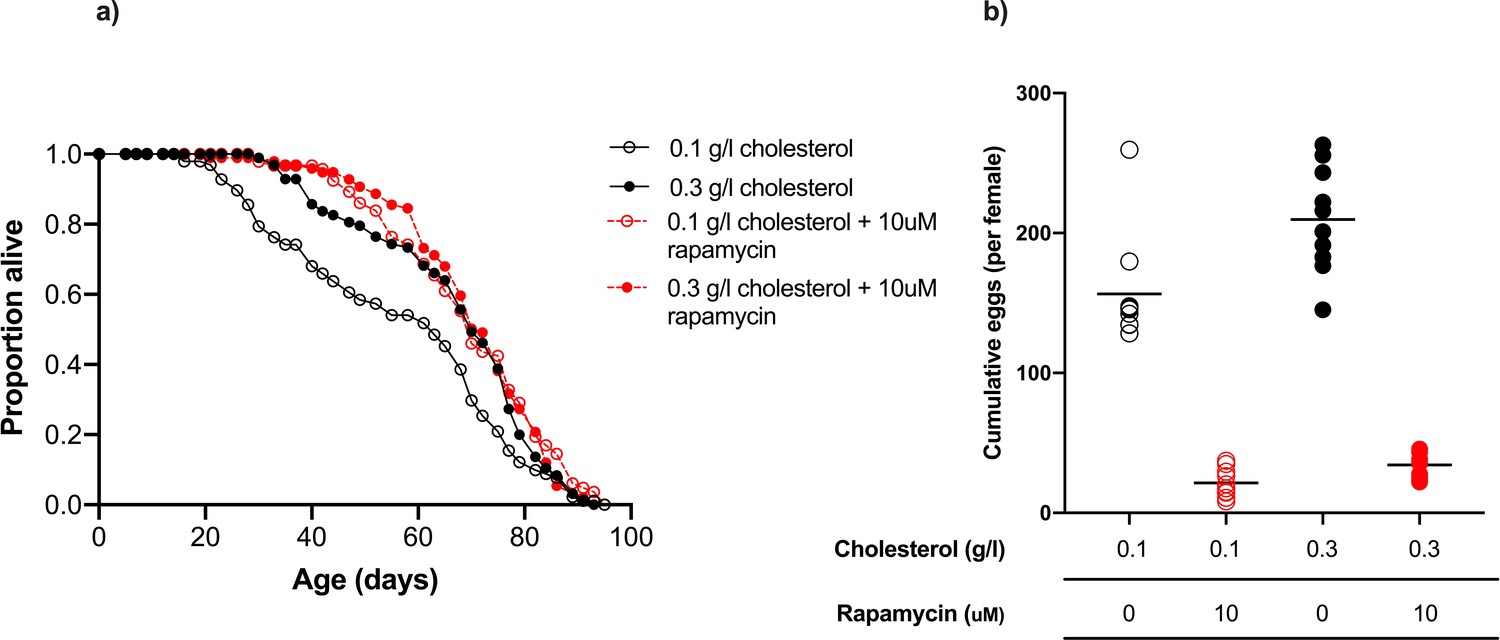
Rapamycin extends lifespan in flies consuming a low cholesterol diet (0.1 g/l) but had no effect when cholesterol level was increased to 0.3 g/l.
(a) There was no significant difference in lifespan amongst flies fed 0.3 g/l cholesterol, 0.3 g/l cholesterol + rapamycin or 0.1 g/l cholesterol + rapamycin, all of which were significantly longer lived than flies fed 0.1 g/l cholesterol (0.1 g/l v 0.3 g/l, p=0.014; 0.1 g/l v 0.1 g/l + rapamycin, p<0.001; 0.1 g/l v 0.3 g/l + rapamycin, p=0.002, log rank test). (b) Cumulative eggs laid were significantly reduced in flies treated with rapamycin (p<0.001, two-way ANOVA), and also significantly reduced when cholesterol was limited (p<0.001, two-way ANOVA).
Figure 5

Cholesterol supplementation significantly extended lifespan and promoted egg laying of flies fed yeast-based diets.
(a) Adding dietary cholesterol significantly increased the lifespan of flies on both high and low concentrations of diets made with autolysed yeast (low yeast v low yeast + cholesterol and high yeast v high yeast + cholesterol; p<0.001, log rank test). (b) Yeast and cholesterol addition to these two foods both positively affected egg production (p<0.001, two-way ANOVA). (c) Cholesterol addition significantly extended the lifespan of flies on diets made with yeast extract (low YE v low YE + cholesterol and high YE v high YE + cholesterol; p<0.001, log rank test). (d) Cumulative egg laying was also positively affected by yeast addition and cholesterol addition to each yeast level (p<0.001, two-way ANOVA).
Figure 6
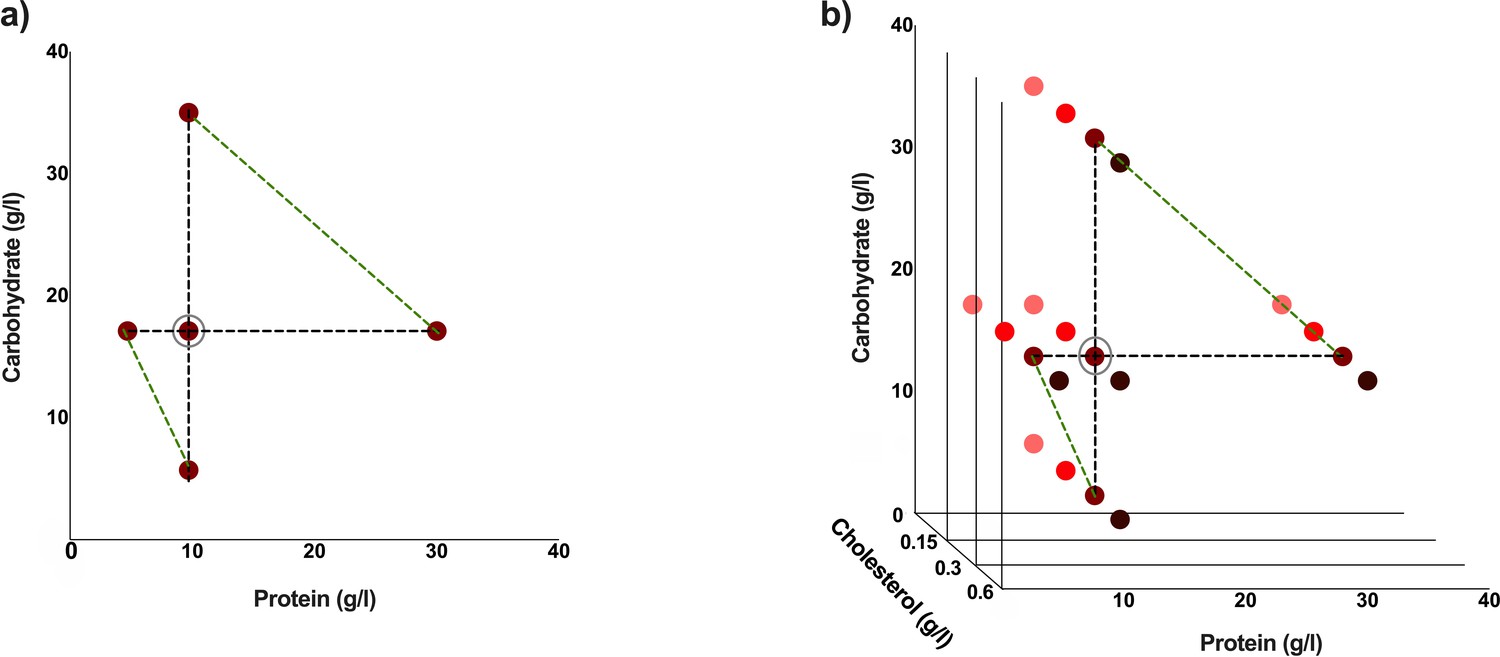
Experimental diets used are indicated by coloured dots.
These diets have varying protein: carbohydrate ratios. This makes a total of five different experimental diets (a). The standard cholesterol concentration is 0.3 g/l. Three additional cholesterol concentrations were used for each of the five protein: carbohydrate ratios to make a total of 20 different experimental diets (b). Diets which are either protein constant or carbohydrate constant are connected by black dotted lines, and diets with comparable caloric concentrations are connected by green-dotted lines (a, b). The standard diet used in our laboratory is circled in grey (a, b).
Tables
Key resources table
| Reagent type (species) or resource | Designation | Source or reference | Identifiers | Additional information |
|---|---|---|---|---|
| Chemical compound, drug | Rapamycin (Sirolimus) | Jomar Life Research | S1039 |
Table 1
Protein: carbohydrate ratio, along with the nutrient densities, cholesterol concentration and caloric content, for all synthetic experimental diets used.
In the holidic media, amino acids are used to make up protein equivalents. To convert amino acids to protein equivalents, we used the molar quantities of nitrogen and the assumption that N makes up 16% of whole proteins (Imafidon and Sosulski, 1990). Calories were calculated using the method described in Southgate and Durnin, 1970.
| Diet | Protein: carbohydrate equivalent | Sum mass of amino acids (g/l) | Equivalent protein (g/l) | Carbohydrate (g/l)† | Cholesterol (g/l) | Estimated caloric content (kcal/l) |
|---|---|---|---|---|---|---|
| 1 | 1:3.6 | 5.25 | 4.7 | 17.1 | 0 | 87.2 |
| 2 | 1:3.6 | 5.25 | 4.7 | 17.1 | 0.15 | 87.2 |
| 3 | 1:3.6 | 5.25 | 4.7 | 17.1 | 0.3 | 87.2 |
| 4 | 1:3.6 | 5.25 | 4.7 | 17.1 | 0.6 | 87.2 |
| 5 | 1:3.6 | 10.74 | 9.7 | 35 | 0 | 178.8 |
| 6 | 1:3.6 | 10.74 | 9.7 | 35 | 0.15 | 178.8 |
| 7 | 1:3.6 | 10.74 | 9.7 | 35 | 0.3 | 178.8 |
| 8 | 1:3.6 | 10.74 | 9.7 | 35 | 0.6 | 178.8 |
| 9 | 1:1.8 | 10.74 | 9.7 | 17.1 | 0 | 107.2 |
| 10 | 1:1.8 | 10.74 | 9.7 | 17.1 | 0.15 | 107.2 |
| 11* | 1:1.8 | 10.74 | 9.7 | 17.1 | 0.3 | 107.2 |
| 12 | 1:1.8 | 10.74 | 9.7 | 17.1 | 0.6 | 107.2 |
| 13 | 1:0.6 | 33.1 | 30 | 17.1 | 0 | 188.4 |
| 14 | 1:0.6 | 33.1 | 30 | 17.1 | 0.15 | 188.4 |
| 15 | 1:0.6 | 33.1 | 30 | 17.1 | 0.3 | 188.4 |
| 16 | 1:0.6 | 33.1 | 30 | 17.1 | 0.6 | 188.4 |
| 17 | 1:0.6 | 10.74 | 9.7 | 5.7 | 0 | 61.6 |
| 18 | 1:0.6 | 10.74 | 9.7 | 5.7 | 0.15 | 61.6 |
| 19 | 1:0.6 | 10.74 | 9.7 | 5.7 | 0.3 | 61.6 |
| 20 | 1:0.6 | 10.74 | 9.7 | 5.7 | 0.6 | 61.6 |
-
* Standard diet.
† Carbohydrate is added to the diet as sucrose.
Additional files
-
Supplementary file 1
Estimates from a linear mixed effects model to explain the effects of protein and carbohydrate on cumulative eggs laid per female, with replicate as a random effect.
Decreasing doses of carbohydrate and increasing doses of protein resulted in significantly increased egg production.
- https://cdn.elifesciences.org/articles/62335/elife-62335-supp1-v1.docx
-
Supplementary file 2
Estimates from a linear mixed effects model to explain the effects of protein and carbohydrate on lifespan (median lifespan (days)), with vial as a random effect.
While variations in carbohydrate had no effect on lifespan, increasing doses of protein resulted in a significant change in lifespan. Visual inspection of the data agreed with our past experience with these diets (Piper et al., 2014; Piper, 2017) that the lifespan response was best modelled by the quadratic term for protein (Protein2) since lifespan peaked at our intermediate protein dose and fell away at both higher and lower doses. The quadratic term for Carbohydrate was thus also added to maintain balance in the model (Carbohydrate2). The interaction between protein and carbohydrate is not included in any of our analyses because these terms were not co-varied in a balanced way in our experimental design.
- https://cdn.elifesciences.org/articles/62335/elife-62335-supp2-v1.docx
-
Supplementary file 3
Effects on median lifespan (days) of calories, cholesterol and diet type (a categorical variable indicating if either protein or carbohydrate was varied).
Cholesterol had a significant positive effect on median lifespan, while diet type had a significant effect on median lifespan. Calories had no significant effect on lifespan. Data were analysed using a linear model with mixed effects, with vial as a random effect.
- https://cdn.elifesciences.org/articles/62335/elife-62335-supp3-v1.docx
-
Supplementary file 4
Effects on cumulative eggs per female of calories, cholesterol and diet type (a categorical variable indicating if either protein or carbohydrate was varied).
Cholesterol had a significant positive effect on cumulative eggs per female, while diet type had a significant effect on cumulative eggs per female. Calories had no significant effect on cumulative eggs per female. Data were analysed using a linear model with mixed effects, with vial as a random effect.
- https://cdn.elifesciences.org/articles/62335/elife-62335-supp4-v1.docx
-
Supplementary file 5
Minimum adequate model describing the effects of protein, protein2 carbohydrate, carbohydrate2, cholesterol, cholesterol2 and, where appropriate, their interactive effects on median lifespan (days).
Data were analysed using a linear model with mixed effects, with vial as a random effect.
- https://cdn.elifesciences.org/articles/62335/elife-62335-supp5-v1.docx
-
Supplementary file 6
Minimum adequate model describing the effects of protein, protein2 carbohydrate, carbohydrate2, cholesterol, cholesterol2 and, where appropriate, their interactive effects on cumulative eggs per female.
Data were analysed using a linear model with mixed effects, with vial as a random effect.
- https://cdn.elifesciences.org/articles/62335/elife-62335-supp6-v1.docx
-
Supplementary file 7
Effects on cumulative eggs per female of P:C ratio, cholesterol, cholesterol2 and the interaction between P:C ratio and cholesterol.
Each of the main effects had a significant positive effect on egg production, and the amount of cholesterol significantly modified how P:C affected egg laying. Data were analysed using a linear model with mixed effects, with vial as a random effect.
- https://cdn.elifesciences.org/articles/62335/elife-62335-supp7-v1.docx
-
Supplementary file 8
Effects on median lifespan (days) of cumulative eggs per female, cholesterol, cholesterol2 and the interaction between cumulative egg production and cholesterol.
Cumulative egg production and cholesterol had a significant positive effect on median lifespan, while cholesterol2 had a significant negative effect on median lifespan. Data were analysed using a linear model with mixed effects, with vial as a random effect.
- https://cdn.elifesciences.org/articles/62335/elife-62335-supp8-v1.docx
-
Supplementary file 9
The relative proportions of each amino acid in the FLYaa amino acid mixture used in this study.
- https://cdn.elifesciences.org/articles/62335/elife-62335-supp9-v1.docx
-
Transparent reporting form
- https://cdn.elifesciences.org/articles/62335/elife-62335-transrepform-v1.pdf
Download links
A two-part list of links to download the article, or parts of the article, in various formats.
Downloads (link to download the article as PDF)
Open citations (links to open the citations from this article in various online reference manager services)
Cite this article (links to download the citations from this article in formats compatible with various reference manager tools)
A dietary sterol trade-off determines lifespan responses to dietary restriction in Drosophila melanogaster females
eLife 10:e62335.
https://doi.org/10.7554/eLife.62335


