Emergence of non-canonical parvalbumin-containing interneurons in hippocampus of a murine model of type I lissencephaly
- Program in Developmental Neurobiology, Eunice Kennedy-Shriver National Institute of Child Health and Human Development, National Institutes of Health, United States
- NIH-Brown University Graduate Partnership Program, United States
- Postdoctoral Research Associate Training Program, National Institute of General Medical Sciences, United States
Figures
Figure 1

Cell-autonomous and non-autonomous effects of Pafah1b1 heterozygous loss on radial migration.
(A) Images of DAPI-stained hippocampus of WT, GlobalLis (global mutation), NkxLis (IN-specific mutation), and EmxLis (PC-specific mutation) mice. (B) Images of PV- immunostaining in WT, GlobalLis, NkxLis, and EmxLis CA1. Bottom images show higher magnification of top images. (C) Quantified densities of PV+INTs in CA1 and each sublayer. Counting was performed on four hippocampal sections from each animal (n = 5 animals per genotype). For statistical analysis *p<0.05, **p<0.01, ***p<0.001, ****p<0.0001. (D) Percentage of PV+INTs in deep (s.o./s.p.) or superficial (s.r./s.l.m.) layers. Scale bar A = 600 μm, scale bar B (top) = 200 μm, scale bar B (bottom) = 120 μm.
-
Figure 1—source data 1
PV+INT density and % per layer.
- https://cdn.elifesciences.org/articles/62373/elife-62373-fig1-data1-v2.xlsx
Figure 2 with 1 supplement
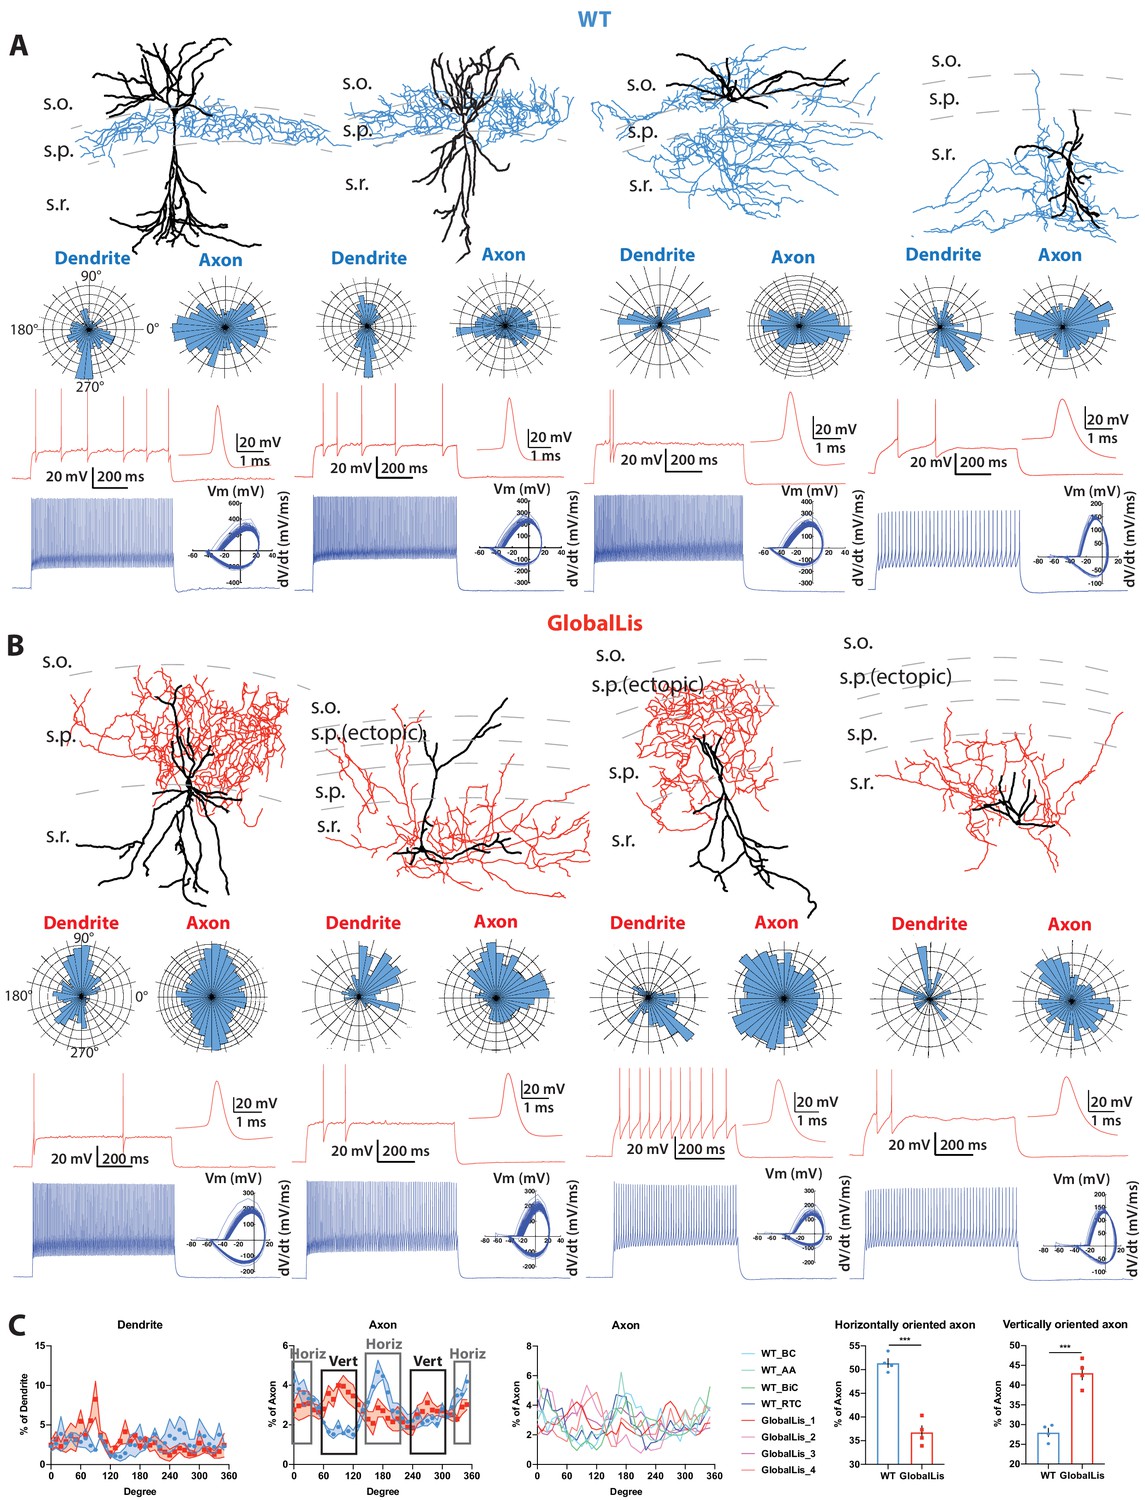
Morphological reconstructions and firing profiles of WT and GlobalLis PV+INTs.
(A) Examples of WT PV+INTs with reconstructed cells on top (dendrite in black, axon in blue), polar histograms of dendrite and axonal arbor orientation in the middle and firing traces on bottom. Firing in response to threshold current is shown in red, with the first action potential shown expanded on the right. The blue trace displays firing at 2x threshold current and shows a phase plot on the right. Cell types from left to right: basket cell, axo-axonic cell, bistratified cell, radiatum-targeting cell. (B) Examples of GlobalLis PV+INTs. Dendrite is shown in black and axon in red. Cells can no longer be neatly parsed into the four morphological PV+INT subtypes found in WT CA1. (C) Left, polarity/degree preferences for WT and GlobalLis PV+INT dendrites and axons. Right, analysis of WT and GlobalLis axonal horizontal or vertical orientation preferences.
-
Figure 2—source data 1
Axon and dendrite polar histograms.
- https://cdn.elifesciences.org/articles/62373/elife-62373-fig2-data1-v2.xlsx
Figure 2—figure supplement 1

PV-TdTomato/PV-IHC colocalization.
GlobalLis mutant hippocampus. Top image displays PV-IHC, middle displays PV-TdTomato, bottom displays superimposition, in a representative GlobalLis hippocampus. There is high level of colocalization: most TdTomato+ cells were PV-IHC+ and most PV-IHC+ cells were PV-TdTomato+. Counting was performed on two to four hippocampal sections from each animal (n = 3–6 animals per genotype). Scale bar = 250 μm.
-
Figure 2—figure supplement 1—source data 1
PV-TdTomato/PV-IHC co-localization.
- https://cdn.elifesciences.org/articles/62373/elife-62373-fig2-figsupp1-data1-v2.xlsx
Figure 3 with 1 supplement
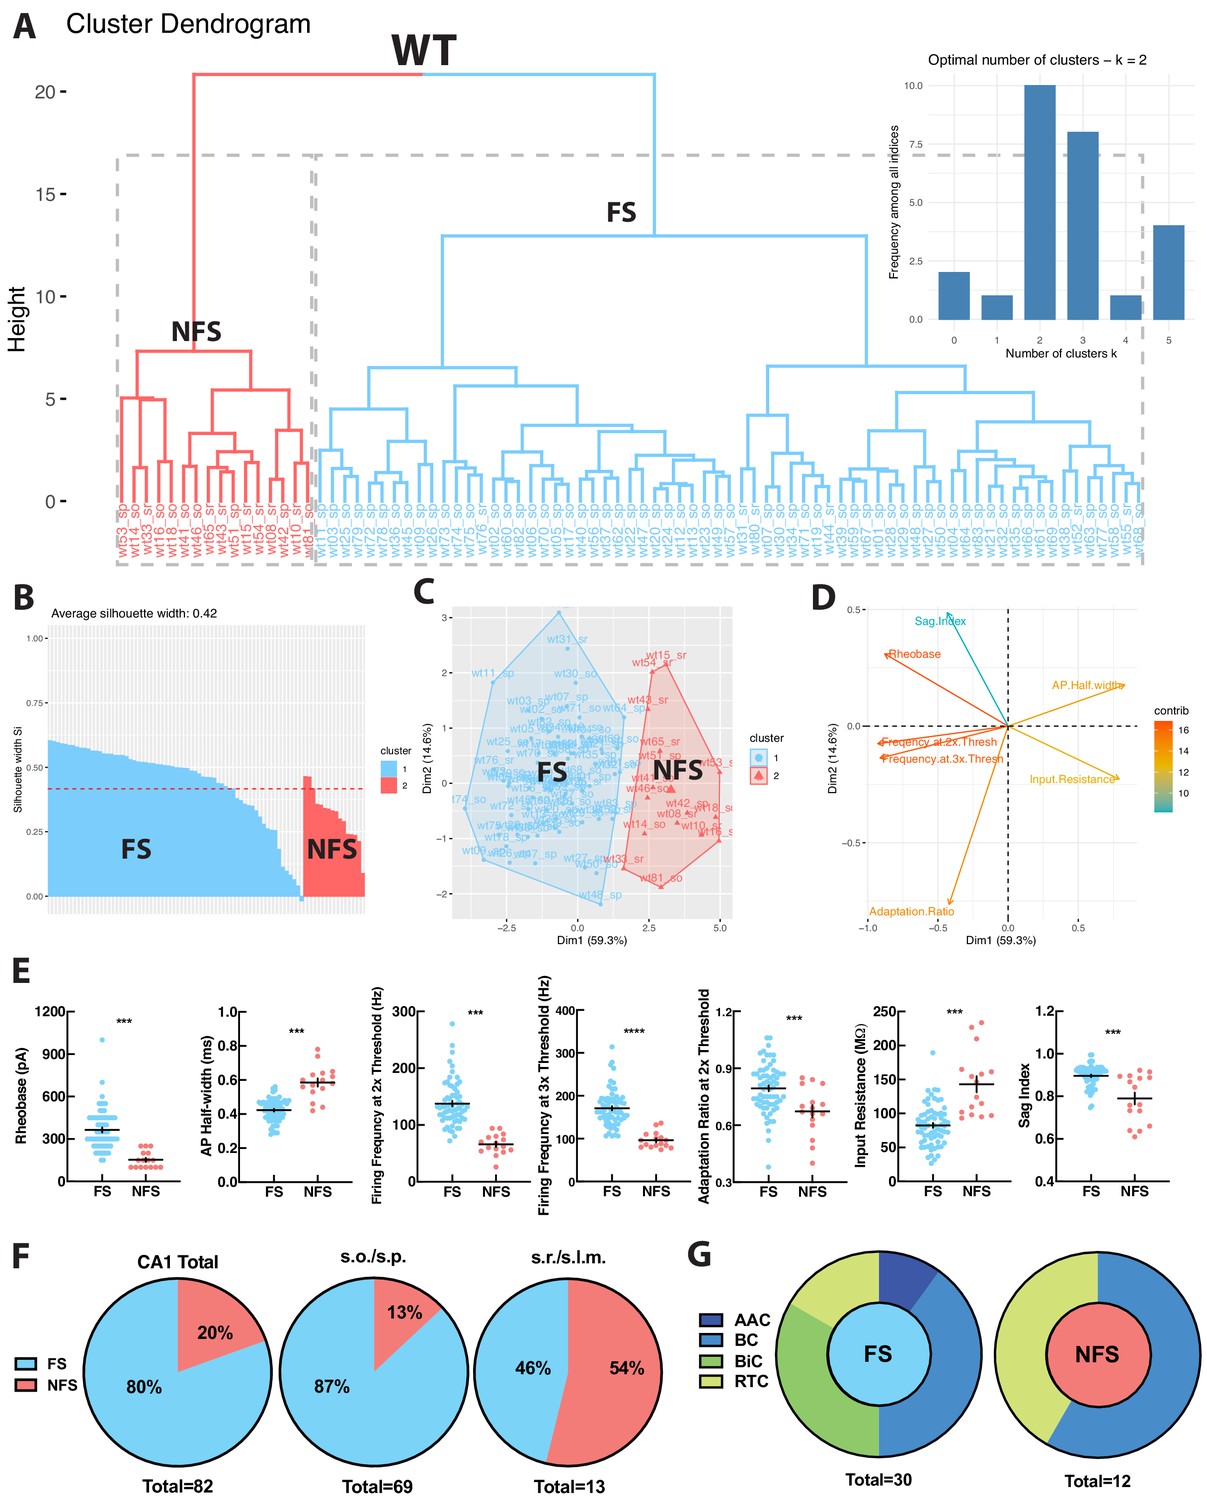
WT PV+INTs consist of two physiological subtypes: FS and NFS cells.
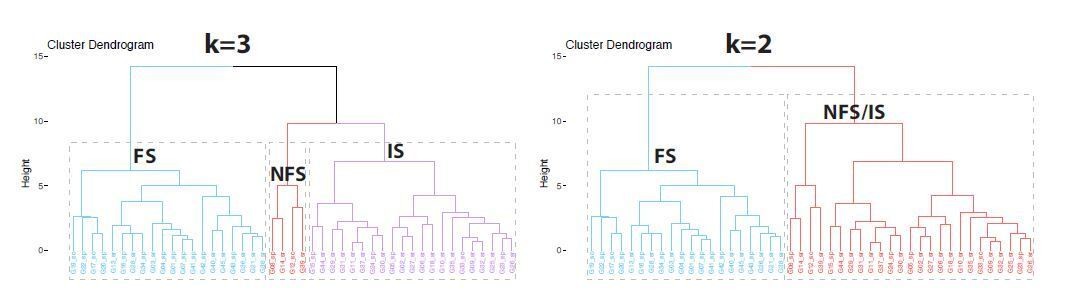
(A) Unbiased cluster analysis dendrogram displays 83 PV+INTs sorted two clusters that represent fast-spiking (FS) and non-fast-spiking (NFS) cells. Inset indicates the optimal number of clusters, determined using NbClust function in R is 2 (FS and NFS). (B) Silhouette plot of the FS/NFS clusters. (C) Cluster plot of the same 83 PV+INTs. Nonoverlap indicates clear segregation of FS/NFS clusters. (D) Contributions of each intrinsic physiological property used in the cluster analysis. (E) Plots displaying and FS/NFS cell intrinsic properties. For statistical analysis *p<0.05, **p<0.01, ***p<0.001, ****p<0.0001. (F) Percentages of FS/NFS cells in CA1 and in each sublayer. (G) Distributions of FS and NFS cell morphological subtypes. FS cells consisted of BCs, AACs, BiCs, and RTCs, whereas all recovered NFS cells were identified as BCs or RTCs.
Figure 3—figure supplement 1
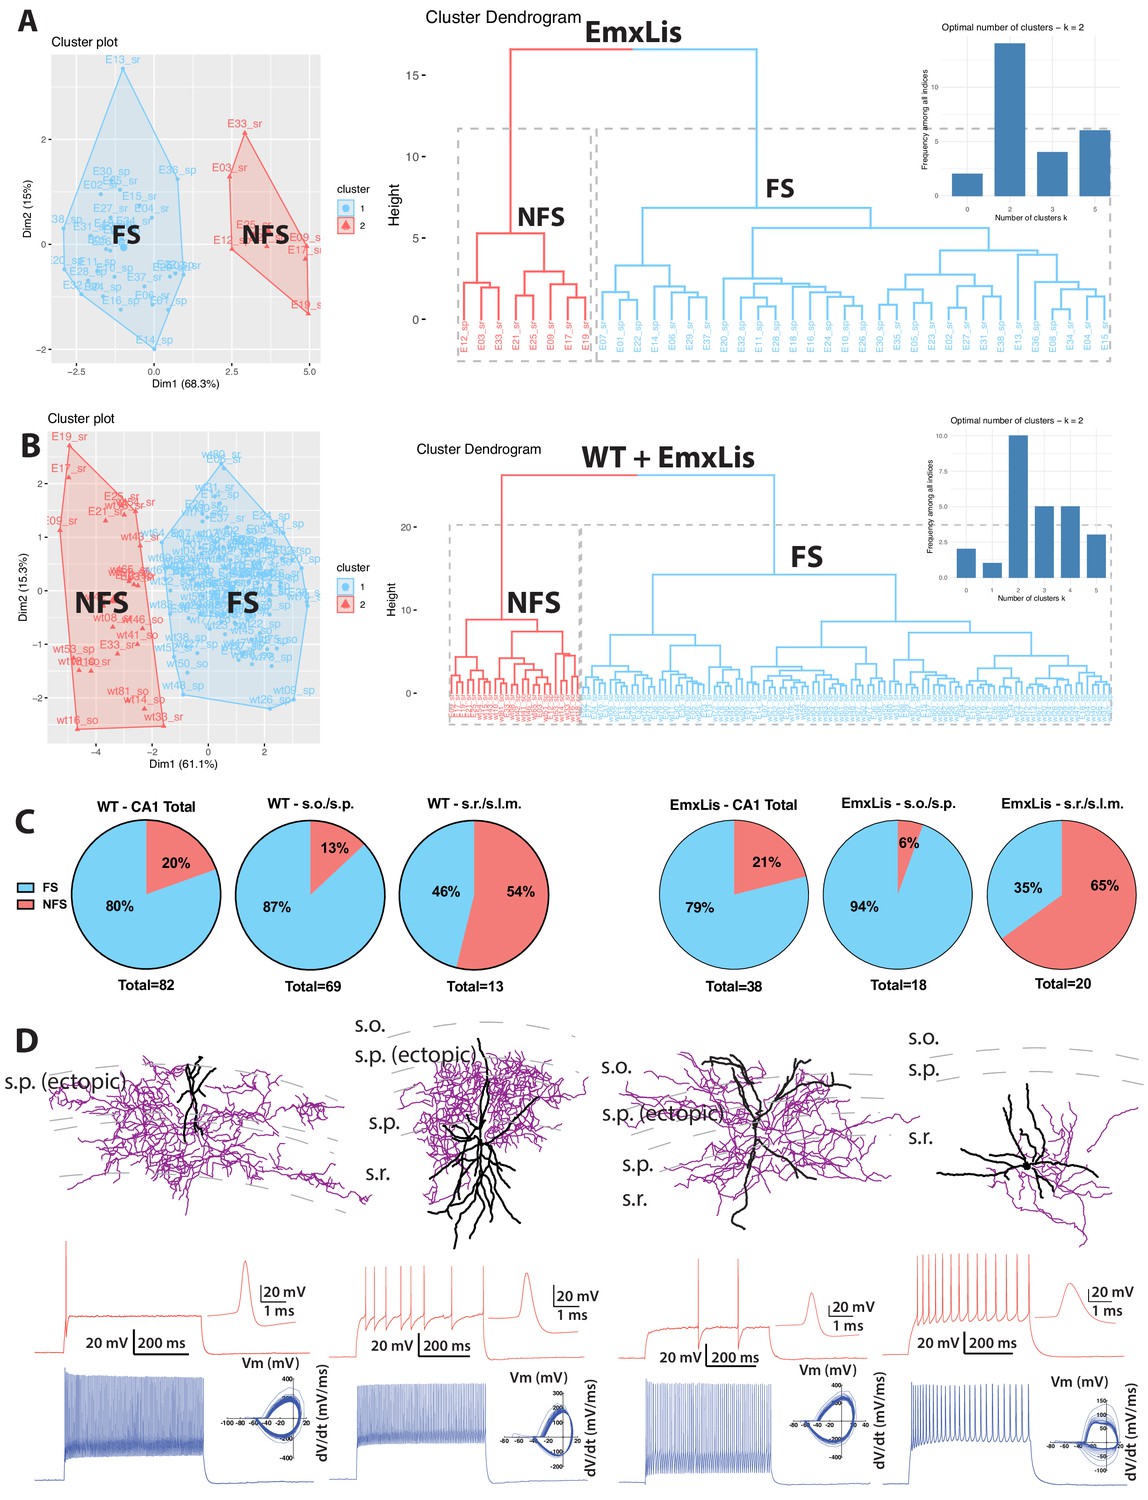
Cluster analysis and morphophysiology of EmxLis PV+INTs.
(A) Cluster plot (left) and dendrogram (right) of 38 EmxLis PV+INTs. The dendrogram inset indicates two optimal clusters which correspond to FS and NFS cells. (B) Due to similar sorting, WT and EmxLis datasets were analyzed together, which resulted in identical classification of every FS/NFS cell. (C) Percentages of FS/NFS cells in CA1 and each sublayer. For reference, the WT distributions (left) are repeated alongside the EmxLis distributions (right). (D) Examples of EmxLis PV+INTs reconstructed cells (dendrite in black, axon in purple) and firing traces on bottom (as described in Figure 2). Cell types from left to right: FS basket cell, FS basket cell, FS bistratified cell, NFS radiatum-targeting cell.
Figure 4 with 4 supplements
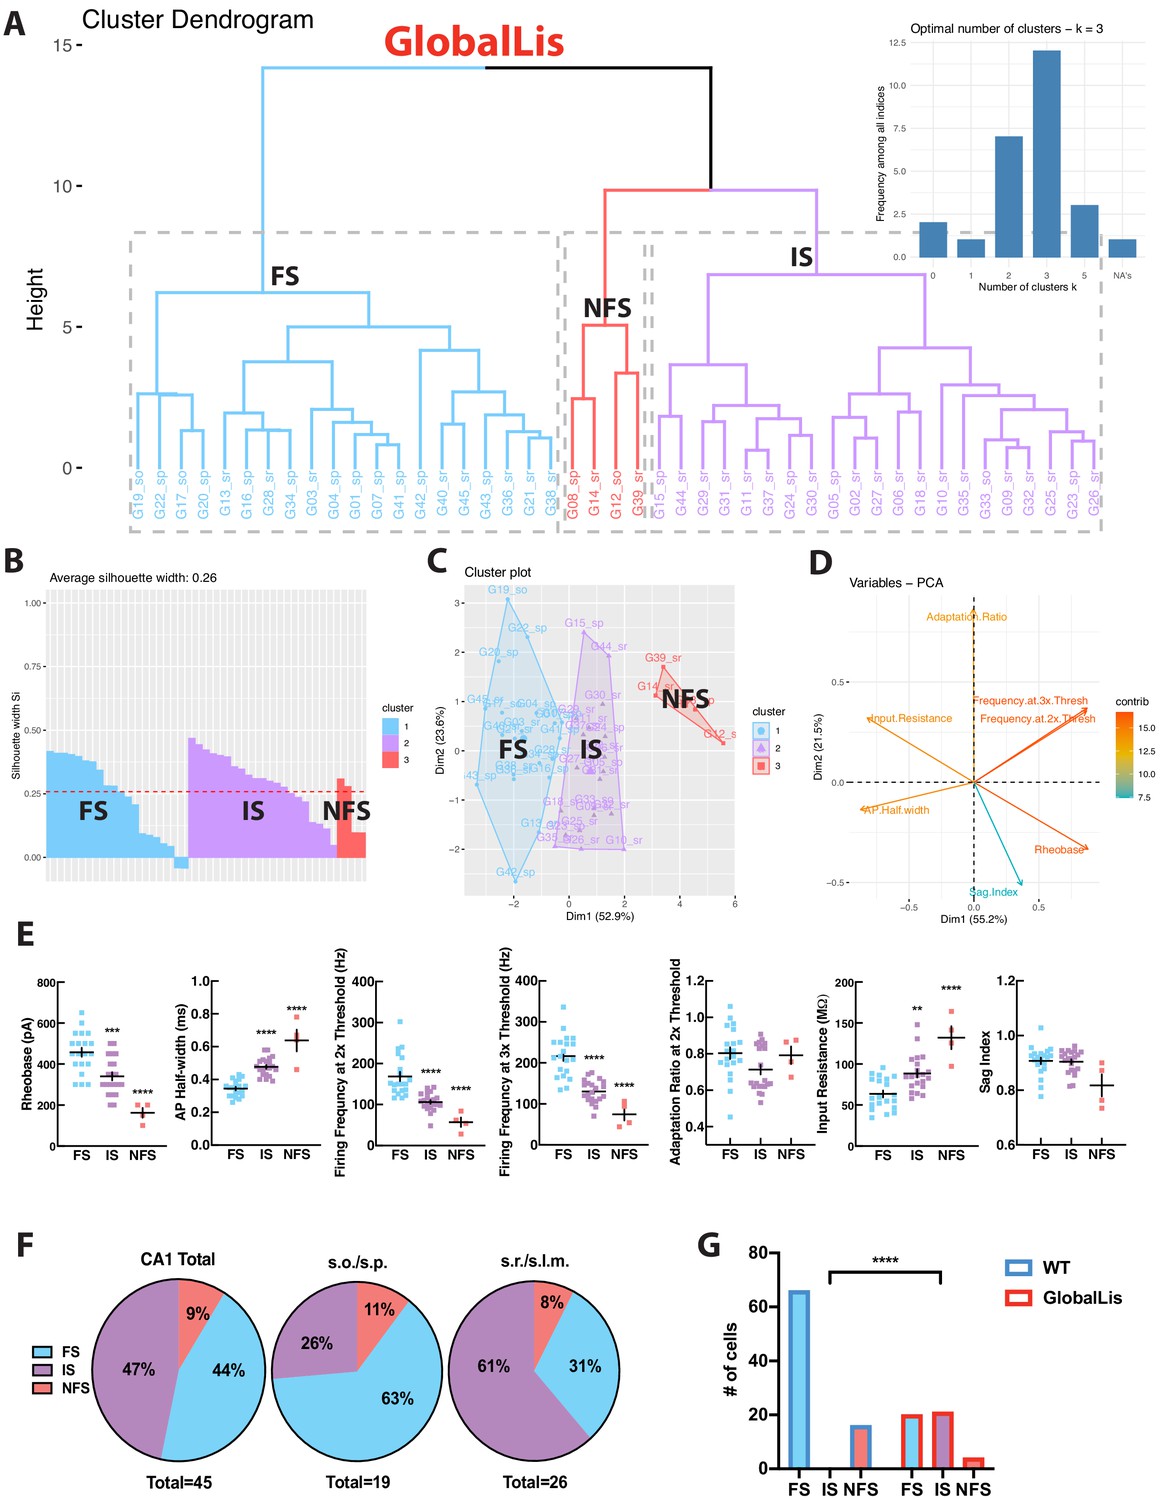
GlobalLis PV+INTs consist of three physiological subtypes: FS, IS, and NFS cells.
(A) Unbiased cluster analysis indicates emergence of an additional cluster in GlobalLis CA1, displayed in the dendrogram of 45 PV+INTs. Inset indicates optimal detection of three clusters (FS, IS, NFS). (B) Silhouette plot of the FS/IS/NFS clusters. (C) Cluster plot of the same 45 PV+INTs. (D) Contributions of each intrinsic physiological property used in the cluster analysis. (E) Plots displaying FS/IS/NFS cell intrinsic properties. For statistical analysis *p<0.05, **p<0.01, ***p<0.001, ****p<0.0001. (F) Percentage of FS/IS/NFS cells in CA1 and in each sublayer. (G) Fisher exact test confirms differences in WT and GlobalLis composition of CA1 PV+INT subtypes.
Figure 4—figure supplement 1

Cluster analysis and morphophysiology of NkxLis PV+INTs.
(A) Cluster plot (left) and dendrogram (right) of 41 NkxLis PV+INTs. The dendrogram inset indicates three optimal clusters which correspond to FS and NFS cells. (B) Due to similar sorting, as well as the obvious misclassification some cell types, NkxLis and GlobalLis datasets were analyzed together, which resulted in more reliable classification cell types. (C) Percentages of FS/IS/NFS cells in CA1 and each sublayer. For reference, the GlobalLis distributions (left) are repeated alongside the NkxLis distributions (right). (D) Examples of NkxLis PV+INTs reconstructed cells (dendrite in black, axon in green) and firing traces on bottom (as described in Figure 2). Physiological cell types from left to right: FS, FS, IS, NFS.
Figure 4—figure supplement 2
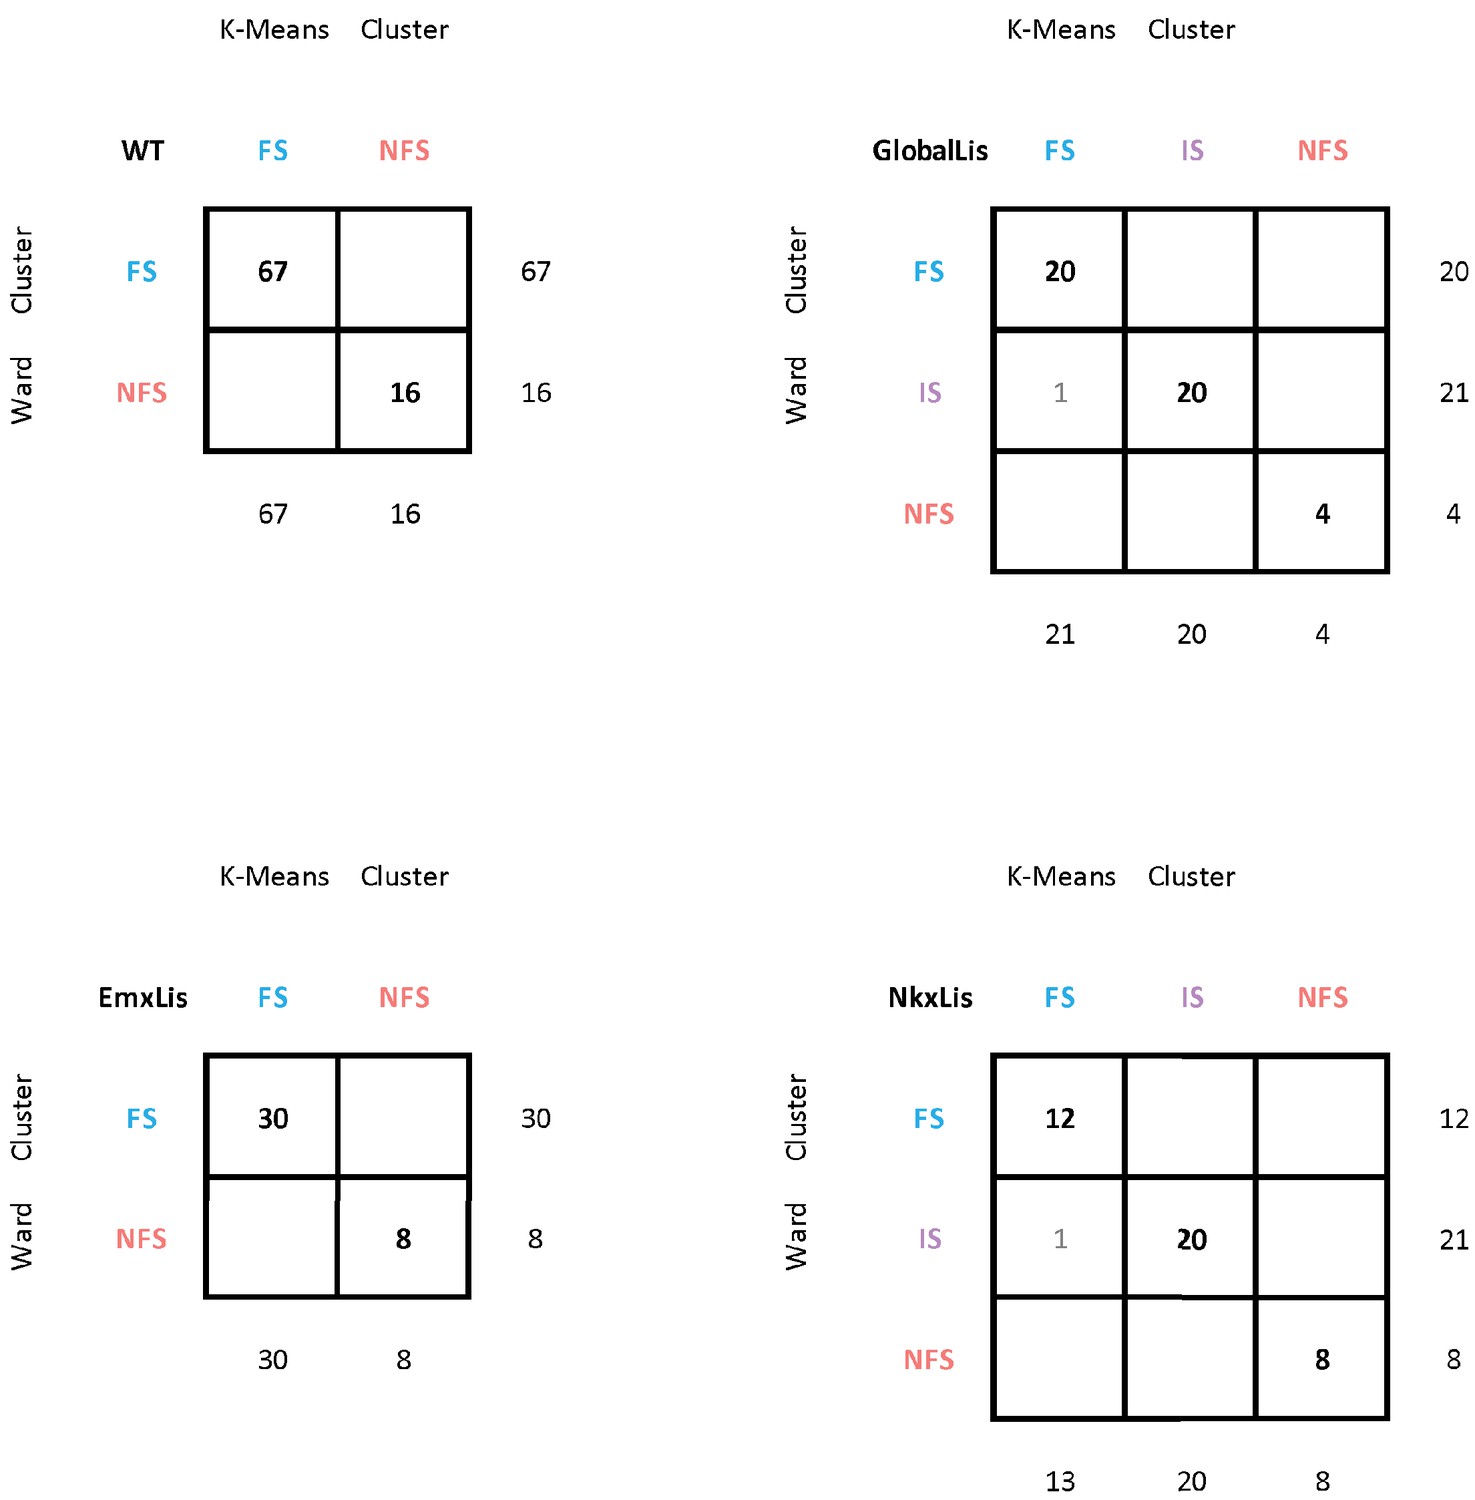
Comparison of K-means and Ward clustering.
A Ward Test was performed, and the resulting clusters were compared to results of the original K-means clustering (used in previous figures). The numbers at the bottoms of the column and ends of the row indicate respectively the number of cells in a given K-means or Ward-cluster. The numbers in the table indicate how many cells of a K-means cluster are contained within a given Ward cluster.
Figure 4—figure supplement 3
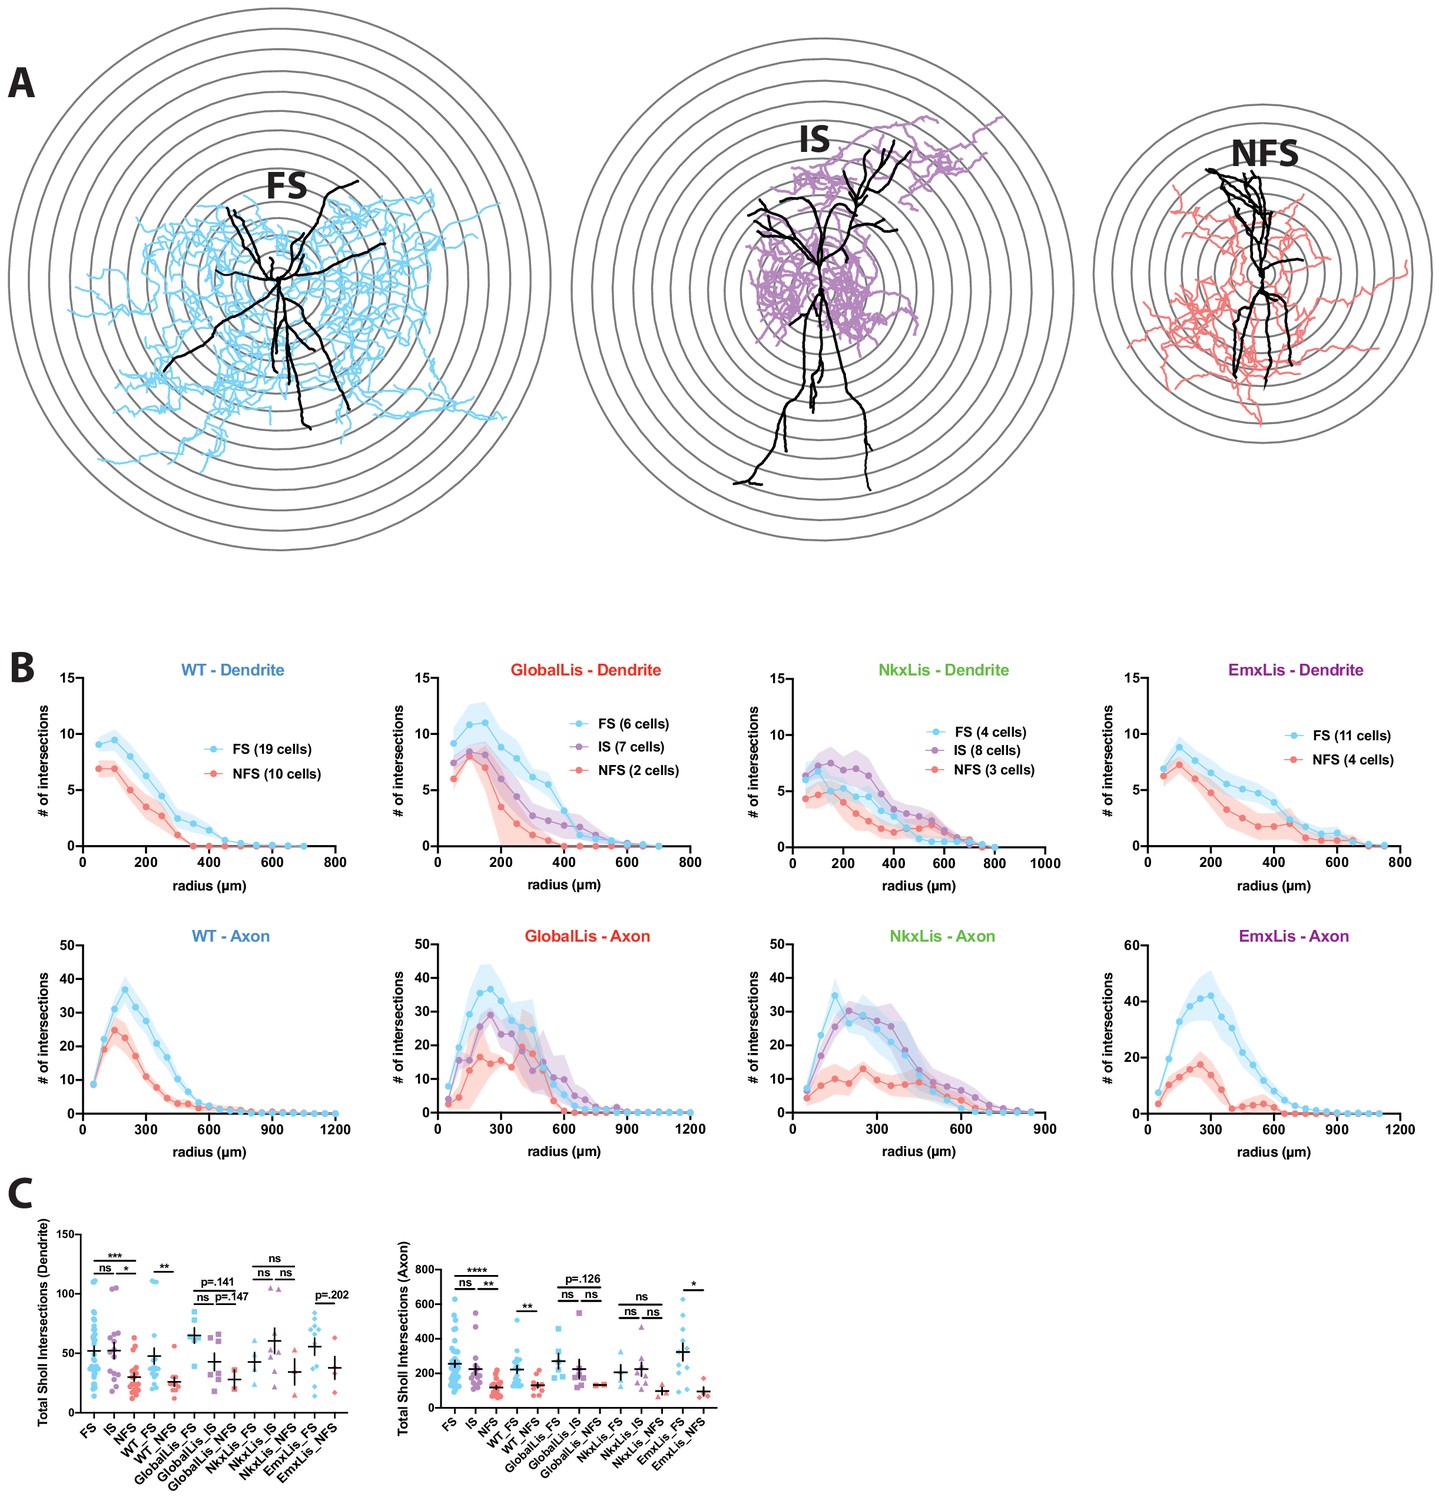
Sholl analysis of PV+INT physiological subtypes.
( A) Reconstructions of FS (left), IS (middle) and NFS (right) PV+INTs. Concentric circles (superimposed in black) with a radius interval of 50 µm were used for Sholl analysis. (B) Sholl analysis of dendrites and axons separated by genotype and grouped by physiological subtype. (C) Statistical analysis for individual genotypes and for combined physiological subtype regardless of genotype. For statistical analysis *p<0.05, **p<0.01, ***p<0.001.
-
Figure 4—figure supplement 3—source data 1
Sholl analysis of PV+INTs.
- https://cdn.elifesciences.org/articles/62373/elife-62373-fig4-figsupp3-data1-v2.xlsx
Figure 4—figure supplement 4
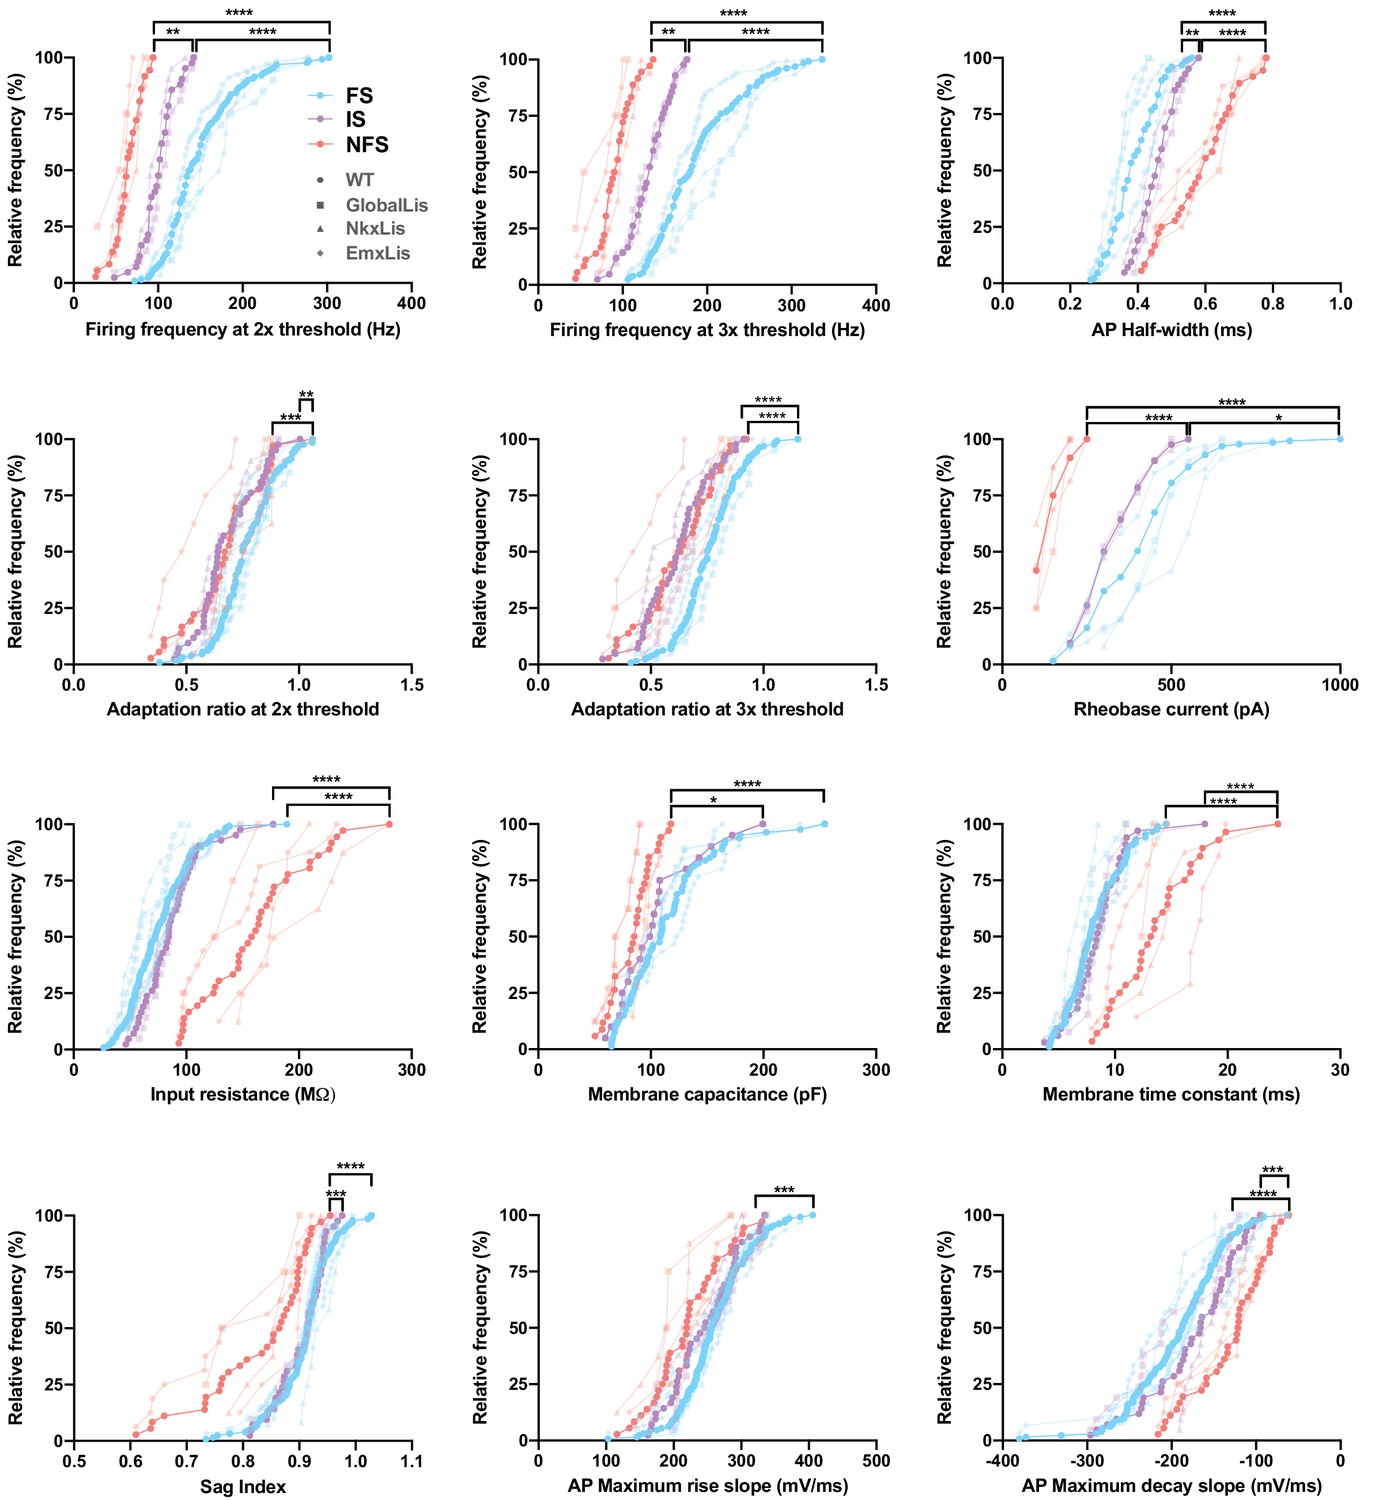
Membrane and firing properties of PV+INT physiological subtypes.
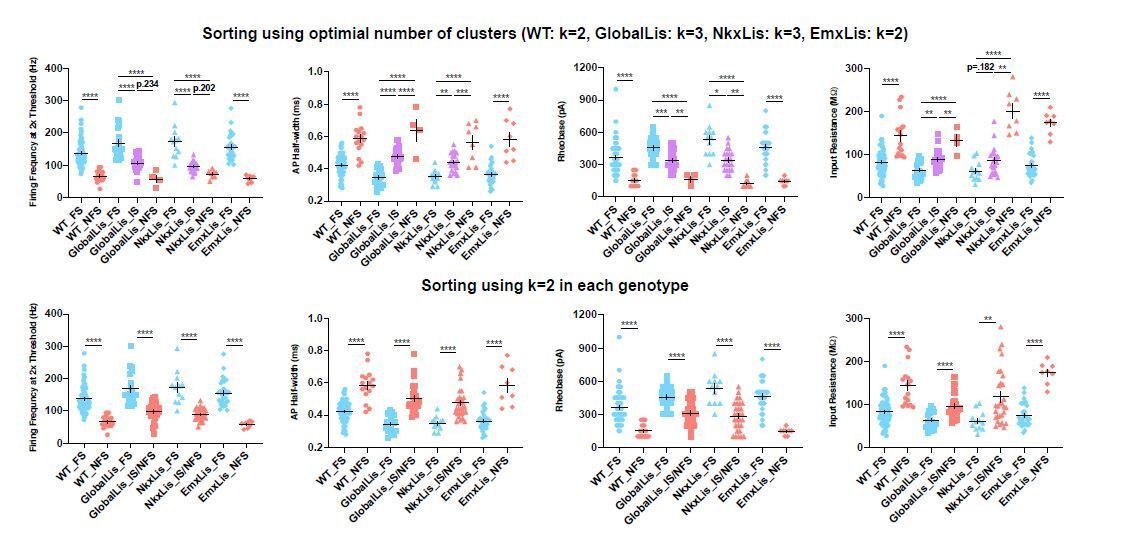
Frequency distributions of physiological and morphological properties PV+INTs. FS cells are shown in blue, IS cells in purple, NFS cells in pink. The full color circles connecting lines display the average of all genotypes for each physiological subtype. The faded shapes/lines represent distributions for WT (hexagons), GlobalLis (squares), NkxLis (triangles), and EmxLis (diamonds). Note that with the exception of AP half-width, there were no significant differences between genotypes. Almost every property shown here had significant differences between physiological subtype, independent of genotype. See also Table 1. For statistical analysis *p<0.05, **p<0.01, ***p<0.001, ****p<0.0001.
Figure 5 with 1 supplement
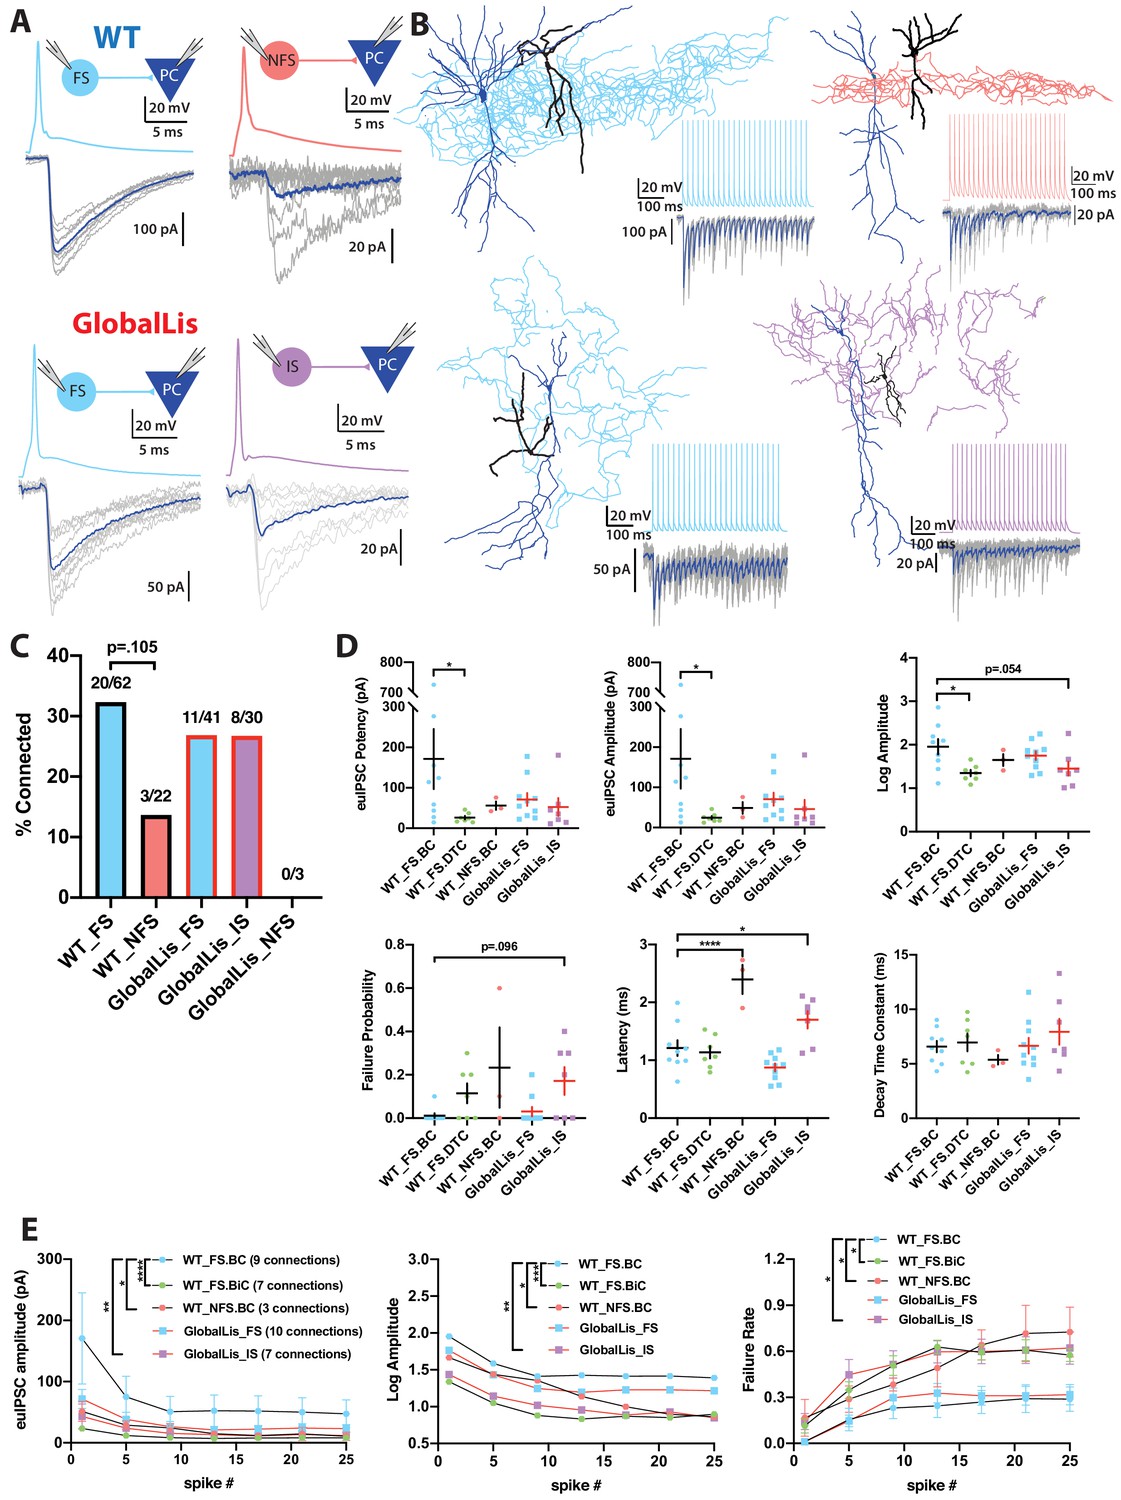
Connectivity and microcircuitry of PV+INTs.
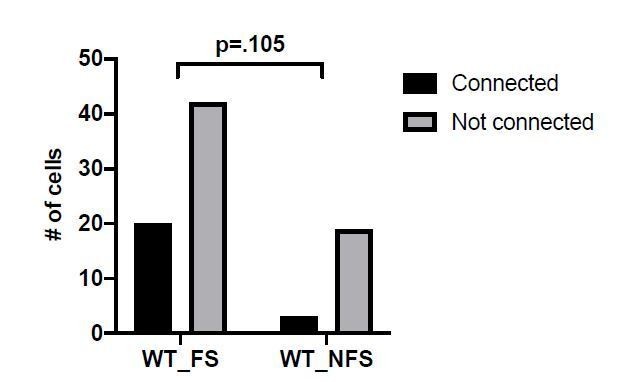
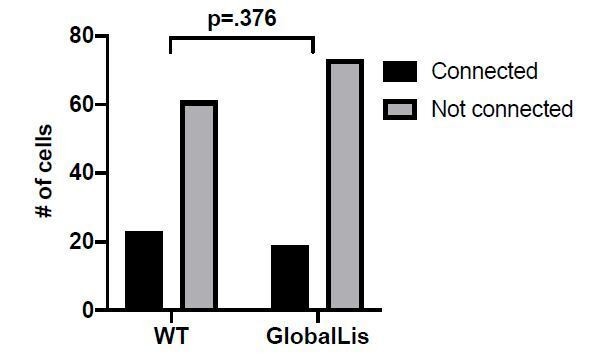
(A) (i) Examples of paired whole-cell recordings between synaptically connected presynaptic PV+INTs (top traces) and postsynaptic CA1 PCs (bottom traces). 10 individual traces (grey) and an averaged trace (navy) are show for the postsynaptic cells. Note that a high [Cl-] internal solution was used in the PCs, resulting in GABAergic inward currents when PCs were clamped at −70 mV. (B) Reconstructions of PV+INTs (dendrite/cell body in black, axon in light blue, pink or purple) and PCs (dendrite/cell body in navy) and sample traces of a 50 Hz, 25 pulse stimulation. (C) Connectivity of PV+INT to PCs. Note the lower connectivity of NFS cells. (D) Unitary transmission properties between PV+INTs and PCs. (E) Short-term plasticity of PV+INT microcircuits during a 50 Hz, 25 pulse train. For statistical analysis *p<0.05, **p<0.01, ***p<0.001, ****p<0.0001.
-
Figure 5—source data 1
PV+INT unitary transmission properties.
- https://cdn.elifesciences.org/articles/62373/elife-62373-fig5-data1-v2.xlsx
Figure 5—figure supplement 1
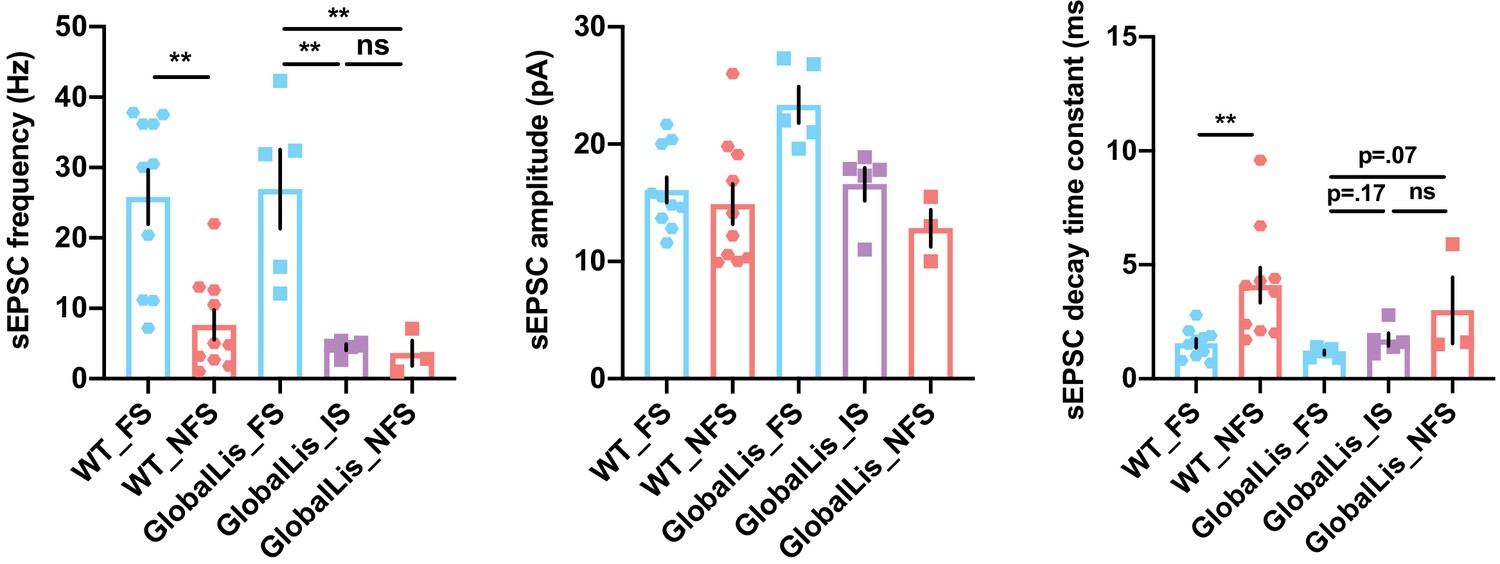
Analysis of excitatory input to PV+INTs.
Statistical analysis of properties of spontaneous excitatory post-synaptic currents (sEPSCs) on PV+INTs. For statistical analysis *p<0.05, **p<0.01.
-
Figure 5—figure supplement 1—source data 1
sEPSC properties of PV+INTs.
- https://cdn.elifesciences.org/articles/62373/elife-62373-fig5-figsupp1-data1-v2.xlsx
Figure 6
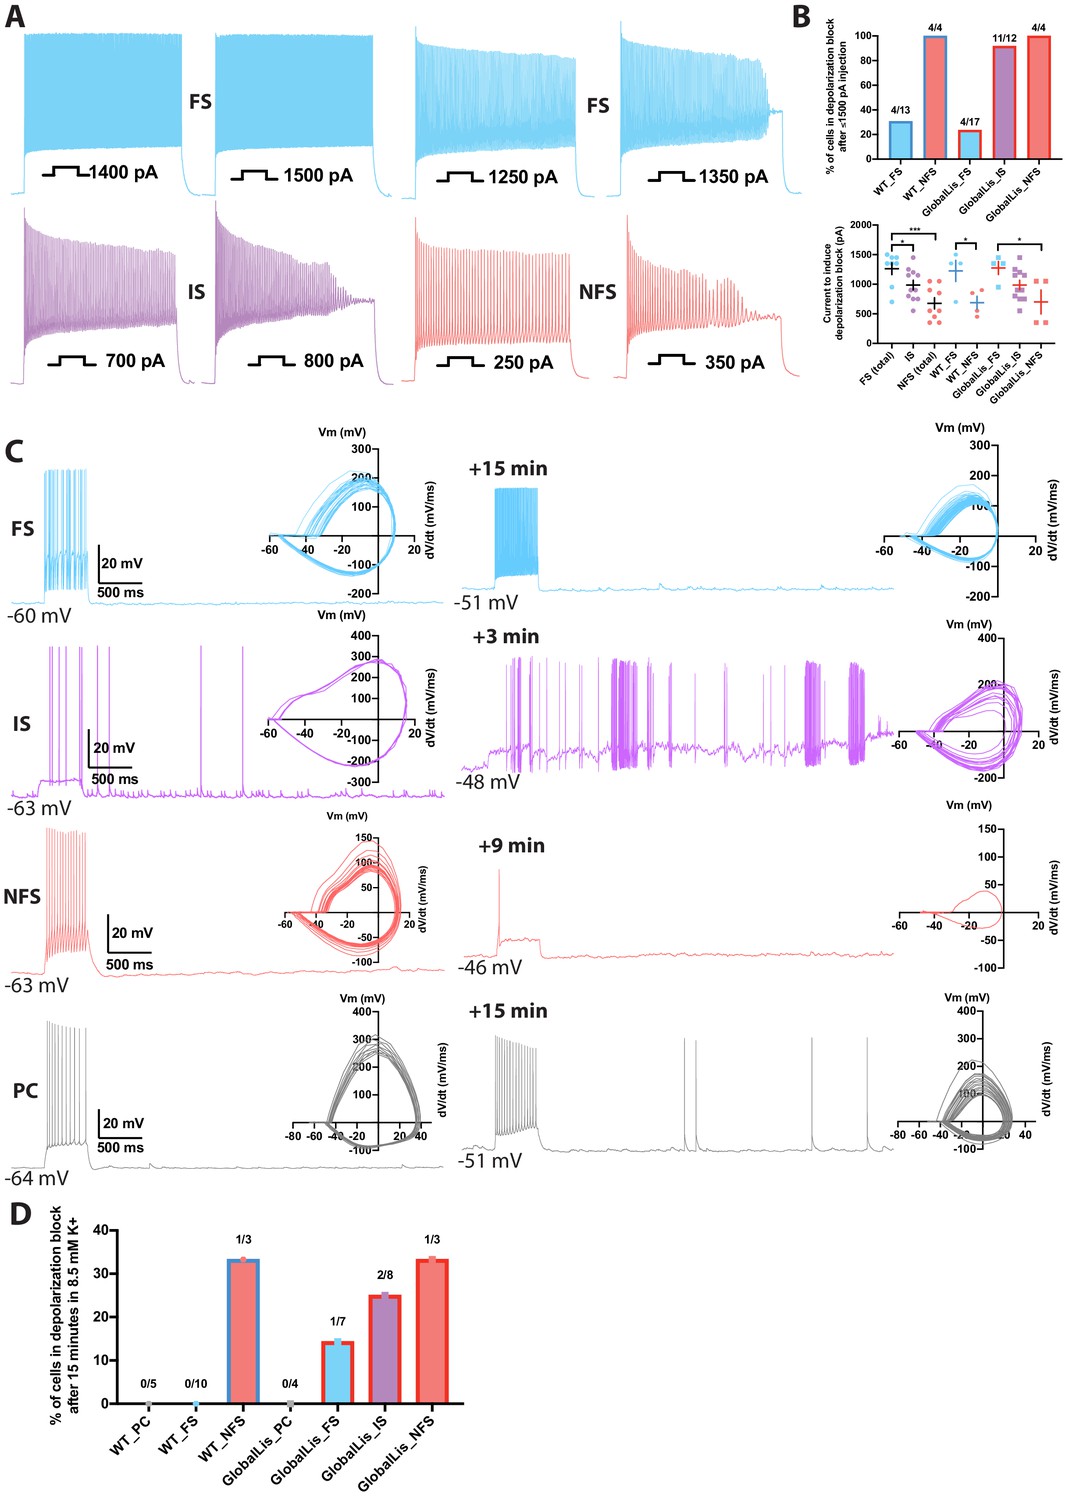
Depolarization block in PV+INTs.
(A) Maximum firing frequencies and depolarizing block in subtypes of PV+INTs. Top left shows FS cell which showed no reduction in firing frequency after current injection of 1500 pA. Top right displays FS cell, bottom left displays IS cell, and bottom right displays NFS cell, all of which blocked. (B) Percentages of PV+INT subtypes that went into depolarization block with current injection of 1500 pA or less. For statistical analysis *p<0.05, **p<0.01, ***p<0.001. (C) Traces of PV+INTs in 3.5 mM extracellular [K+] (left) and after 8.5 mM extracellular [K+] (right) with inset phase plots. The IS cell example (second from top) shows the cell transitioning into depolarizing block and losing the ability to initiate action potentials. The NFS cell example (third from top) trace in 8.5 mM K+ shows the last action potential this cell was able fire before completely entering depolarization block. (D) Left side displays percentages of PCs and PV cells in depolarization block after 15 min or less in 8.5 mM extracellular [K+]. Right side displays percentages of PV+INT physiological subtypes.
-
Figure 6—source data 1
Current inducing depolarization block.
- https://cdn.elifesciences.org/articles/62373/elife-62373-fig6-data1-v2.xlsx
Figure 7 with 2 supplements
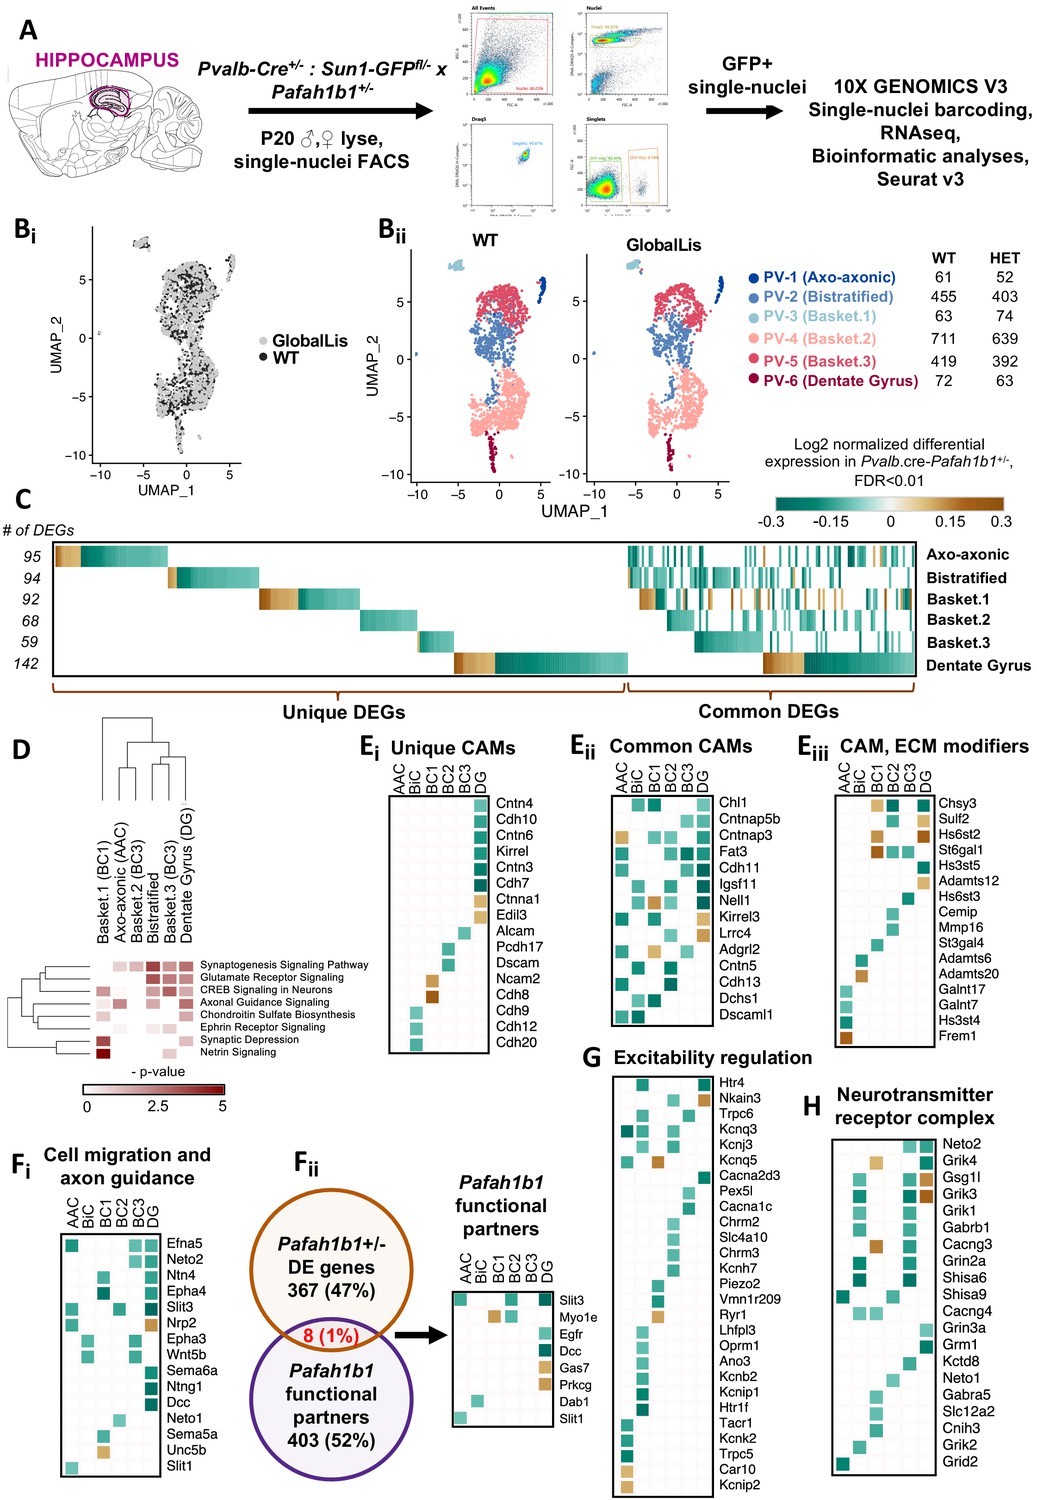
Examination of Pafah1b haploinsufficiency on PV+INTs using single-nucleus RNA-seq.
(A) Overview of the experimental workflow. (Bi) Uniform Manifold Approximation and Projection (UMAP) dimensional reduction of single-nuclei transcriptomes of hippocampal PV+INTs, highlighting similar enrichments of the clusters between genotypes. (Bii) UMAP visualization of Axo-axonic, Bistratified and Fast-spiking PV+INT subtypes, and table indicating the number of Gad1/Pvalb+ cells recovered in each PV+INT. Cell clusters were color coded and annotated post hoc based on their transcriptional profile identities (Abbreviations: FS, Fast-spiking; DG, Dentate gyrus). (C) Combined heatmap representing the 376 differentially expressed (DE) in hippocampal PV+INTs upon Pafah1b1 haploinsufficiency, at FDR < 0.01 and Fold Change (FC) >10%, as determined by MAST analysis. (D) Ingenuity Pathway Analysis of significantly overrepresented molecular pathways in each PV+INT subtype. (E–H) Heatmap of log2 FC of significant DE genes in each PV+INT subtype, showing a subset of (Ei) uniquely DE cell-adhesion molecules (CAMs), (Eii) commonly DE CAMs, Eiii, DE extracellular matrix modifying genes; (Fi), genes regulating neuronal migration and axon guidance, (Fii), genes that exist in a genetic and biochemical complex with Pafah1b1. (G) regulators of neuronal excitability, and (H) postsynaptic glutamate receptor subunits and associated auxiliary subunits.
Figure 7—figure supplement 1

Integrated analyses of single-cell/nucleus transcriptomes from PV+INTs from Pafah1b1+/+, Pafah1b1+/-and reference datasets.
(A) UMAP plots of the PV+INTs from Pafah1b1+/+ and Pafah1b1+/- cortical and hippocampal MGE-derived interneurons and pan-GABAergic Allen Institute datasets indicating robust alignments of the PV+INT clusters. UMAP plots representing the expression of (B) Gad1 and (C) Pvalb across all datasets.
Figure 7—figure supplement 2
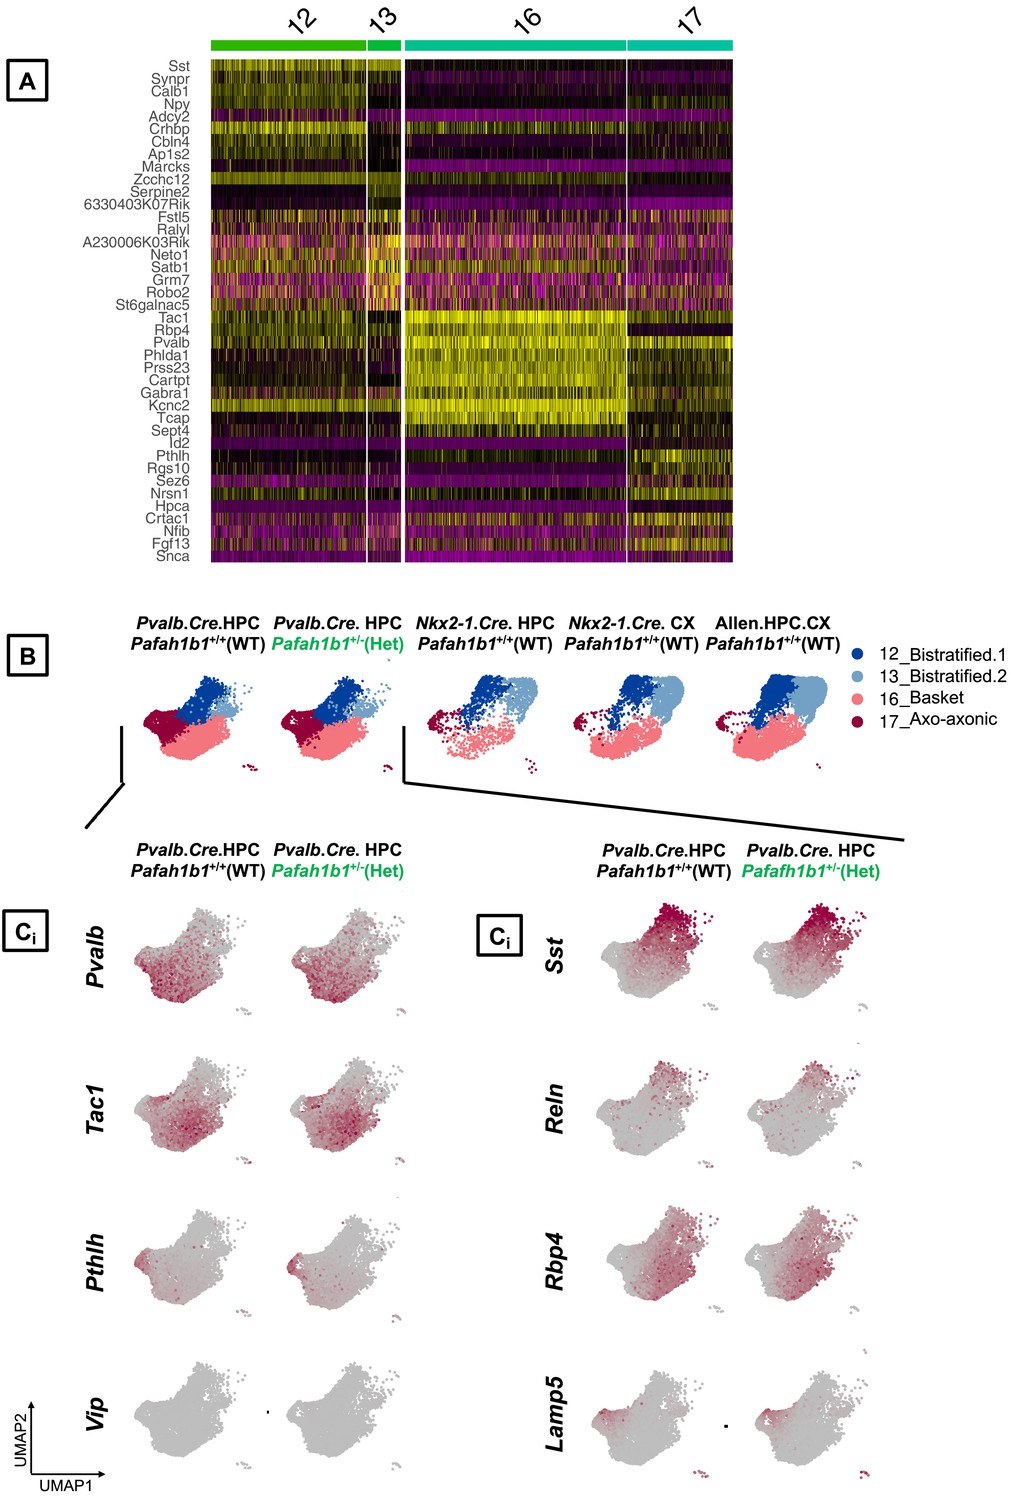
Annotation of PV+INT subtypes based on discrete marker gene expressions.
(A) Single cell heatmap showing scaled expression values for the top 10 transcriptomic markers in each of the PV+INTs clusters across Pafah1b1+/+, Pafah1b1+/- and reference datasets. (B) UMAP plots depicting the bistratified, axo-axonic and fast-spiking clusters across all datasets. (C) Merged UMAP plots representing the expression of top transcriptomic markers across the PV+INT subtypes across all datasets.
Author response image 1
Author response image 2
Author response image 3
Author response image 4
Tables
Table 1
Membrane, firing and morphological properties of PV+INTs.
| WT FS 67 cells | GlobalLis FS 20 cells | NkxLis FS 12 cells | EmxLis FS 30 cells | WT IS 0 cells | GlobalLis IS 21 cells | NkxLis IS 21 cells | EmxLis IS 0 cells | WT NFS 16 cells | GlobalLis NFS 4 cells | NkxLis NFS 8 cells | EmxLis NFS 8 cells | |
|---|---|---|---|---|---|---|---|---|---|---|---|---|
| Input resistance (MΩ) | 82.5 ± 3.6 | 63.5 ± 4.2 | 61.1 ± 6.3 | 75.0 ± 4.7 | N/a | 88.5 ± 4.9 | 85.5 ± 7.0 | N/a | 143.1 ± 11.9 | 132.0 ± 14.4 | 200.7 ± 17.0 | 173.2 ± 9.0 |
| Rheobase (pA) | 364.2 ± 17.3 | 457.5 ± 22.2 | 533.3 ± 42.3 | 463.3 ± 24.8 | n/a | 340.5 ± 20.0 | 342.9 ± 21.1 | n/a | 153.1 ± 14.8 | 162.5 ± 20.0 | 125.0 ± 13.4 | 143.8 ± 11.3 |
| Firing Freq 2x Threshold (Hz) | 137.6 ± 4.7 | 168.5 ± 11.2 | 173.2 ± 14.8 | 155.4 ± 7.4 | n/a | 106.2 ± 4.8 | 95.6 ± 3.5 | n/a | 66.0 ± 4.5 | 57.0 ± 11.6 | 72.3 ± 4.4 | 58.0 ± 3.5 |
| Adaptation Ratio 2x Threshold | 0.79 ± 0.02 | 0.80 ± 0.03 | 0.72 ± 0.04 | 0.71 ± 0.02 | n/a | 0.71 ± 0.03 | 0.65 ± 0.03 | n/a | 0.67 ± 0.03 | 0.79 ± 0.05 | 0.79 ± 0.06 | 0.52 ± 0.05 |
| Firing Freq 3x Threshold (Hz) | 170.9 ± 5.1 | 216.5 ± 11.5 | 213.0 ± 15.3 | 195.7 ± 10.3 | n/a | 130.2 ± 6.0 | 131.1 ± 5.1 | n/a | 96.1 ± 4.6 | 74.5 ± 15.1 | 100.8 ± 5.7 | 77.8 ± 6.9 |
| Adaptation Ratio 3x Threshold | 0.78 ± 0.01 | 0.82 ± 0.03 | 0.71 ± 0.05 | 0.71 ± 0.02 | n/a | 0.67 ± 0.02 | 0.57 ± 0.03 | n/a | 0.65 ± 0.03 | 0.64 ± 0.10 | 0.73 ± 0.05 | 0.47 ± 0.05 |
| AP Threshold (mV) | −39.9 ± 0.7 | −41.2 ± 1.2 | −39.9 ± 1.3 | −37.8 ± 1.1 | n/a | −40.4 ± 1.1 | −35.9 ± 1.2 | n/a | −40.6 ± 1.2 | −38.6 ± 2.8 | −36.8 ± 1.2 | −36.8 ± 1.3 |
| AP Half-width (ms) | 0.42 ± 0.01 | 0.34 ± 0.01 | 0.35 ± 0.01 | 0.36 ± 0.01 | n/a | 0.48 ± 0.01 | 0.44 ± 0.01 | n/a | 0.59 ± 0.02 | 0.64 ± 0.07 | 0.56 ± 0.04 | 0.58 ± 0.04 |
| AP Amplitude (mV) | 61.1 ± 1.0 | 61.2 ± 2.7 | 55.8 ± 3.0 | 57.5 ± 2.0 | n/a | 62.1 ± 2.3 | 53.6 ± 2.0 | n/a | 65.4 ± 3.2 | 64.8 ± 7.0 | 55.1 ± 5.7 | 64.9 ± 4.8 |
| AP Max Rise Slope (mV/ms) | 259.9 ± 5.2 | 248.3 ± 13.5 | 268.6 ± 11.7 | 217.0 ± 12.1 | n/a | 261.4 ± 10.7 | 231.0 ± 10.3 | n/a | 228.6 ± 11.5 | 210.3 ± 25.0 | 197.9 ± 18.3 | 241.0 ± 26.0 |
| AP Max Decay Slope (mV/ms) | −188.7 ± 5.5 | −176.0 ± 14.3 | −201.6 ± 9.1 | −211.4 ± 12.6 | n/a | −198.1 ± 12.6 | −149.2 ± 7.1 | n/a | −136.5 ± 11.5 | −131.3 ± 20.6 | −119.2 ± 14.7 | −125.4 ± 16.8 |
| AHP Amplitude (mV) | −16.8 ± 0.6 | −17.5 ± 0.9 | −15.3 ± 0.9 | −16.7 ± 0.7 | n/a | −16.3 ± 0.8 | −16.0 ± 1.0 | n/a | −15.7 ± 1.2 | −16.9 ± 1.1 | −17.0 ± 1.2 | −11.3 ± 1.7 |
| Membrane Time Constant (ms) | 8.5 ± 0.5 | 7.5 ± 0.4 | 6.7 ± 0.4 | 8.6 ± 0.4 | n/a | 8.7 ± 0.4 | 8.5 ± 0.7 | n/a | 10.9 ± 0.6 | 12.9 ± 0.6 | 14.8 ± 1.6 | 17.1 ± 1.0 |
| Membrane Capacitance (pF) | 104.4 ± 5.0 | 117.7 ± 6.6 | 116.8 ± 18.6 | 123.9 ± 7.7 | n/a | 103.7 ± 8.6 | 105.7 ± 8.3 | n/a | 91.3 ± 6.4 | 88.6 ± 6.4 | 73.8 ± 4.8 | 97.0 ± 4.3 |
| Sag Index | 0.90 ± 0.01 | 0.91 ± 0.01 | 0.95 ± 0.01 | 0.92 ± 0.01 | n/a | 0.90 ± 0.01 | 0.91 ± 0.01 | n/a | 0.8 ± 0.03 | 0.82 ± 0.04 | 0.86 ± 0.02 | 0.85 ± 0.02 |
| Total Sholl Intersections (Dendrite) | 48 ± 7 (19 cells) | 65 ± 6 (6 cells) | 43 ± 8 (8 cells) | 56 ± 7 (11 cells) | n/a | 43 ± 7 (7 cells) | 61 ± 11 (8 cells) | n/a | 26 ± 4 (10 cells) | 28 ± 8 (2 cells) | 34 ± 11 (3 cells) | 38 ± 10 (4 cells) |
| Total Sholl Intersections (Axon) | 222 ± 22 | 271 ± 44 | 206 ± 44 | 324 ± 51 | n/a | 224 ± 56 | 224 ± 41 | n/a | 131 ± 15 | 133 ± 3 | 97 ± 21 | 95 ± 26 |
| Postnatal age at time of recording (days) | 29 ± 1 | 26 ± 1 | 29 ± 1 | 29 ± 2 | n/a | 26 ± 1 | 27 ± 1 | n/a | 28 ± 1 | 25 ± 3 | 27 ± 1 | 28 ± 3 |
-
Table 1—source data 1
Morphophysiological properties of PV+INTs.
- https://cdn.elifesciences.org/articles/62373/elife-62373-table1-data1-v2.xlsx
Table 2
Unitary transmission properties by PV+INT subtype.
| WT FS.BC 9 connections | WT FS.DTC 7 connections | WT NFS.BC 3 connections | GlobalLis FS connections | GlobalLis IS connections | |
|---|---|---|---|---|---|
| euIPSC potency (pA) | 171 ± 74 | 26 ± 5 | 56 ± 10 | 71 ± 16 | 56 ± 20 |
| euIPSC Amplitude (pA) | 171 ± 74 | 24 ± 4 | 49 ± 15 | 66 ± 15 | 48 ± 20 |
| Failure probability | 0.01 ± 0.01 | 0.11 ± 0.05 | 0.23 ± 0.19 | 0.03 ± 0.02 | 0.17 ± 0.06 |
| Latency (ms) | 1.2 ± 0.1 | 1.1 ± 0.1 | 2.4 ± 0.3 | 0.9 ± 0.1 | 1.6 ± 0.1 |
| Decay time constant (ms) | 6.6 ± 0.5 | 7.0 ± 0.8 | 5.4 ± 0.4 | 6.5 ± 0.7 | 7.7 ± 1.1 |
| Postnatal age at time of recording (days) | 35 ± 3 | 30 ± 4 | 27 ± 1 | 30 ± 1 | 27 ± 2 |
-
Table 2—source data 1
PV+INT euIPSC properties.
- https://cdn.elifesciences.org/articles/62373/elife-62373-table2-data1-v2.xlsx
Additional files
-
Supplementary file 1
Transcriptional impairments triggered by Pafah1b1 haploinsufficiency in PV+INT subtypes.
- https://cdn.elifesciences.org/articles/62373/elife-62373-supp1-v2.xlsx
-
Supplementary file 2
Ingenuity Pathway Analysis (IPA) analysis of differentially expressed genes.
- https://cdn.elifesciences.org/articles/62373/elife-62373-supp2-v2.xlsx
-
Supplementary file 3
Genetic and biochemical interactions with Pafah1b1.
- https://cdn.elifesciences.org/articles/62373/elife-62373-supp3-v2.xlsx
-
Transparent reporting form
- https://cdn.elifesciences.org/articles/62373/elife-62373-transrepform-v2.pdf
Download links
A two-part list of links to download the article, or parts of the article, in various formats.
Downloads (link to download the article as PDF)
Open citations (links to open the citations from this article in various online reference manager services)
Cite this article (links to download the citations from this article in formats compatible with various reference manager tools)
Emergence of non-canonical parvalbumin-containing interneurons in hippocampus of a murine model of type I lissencephaly
eLife 9:e62373.
https://doi.org/10.7554/eLife.62373


