Time-resolved serial femtosecond crystallography reveals early structural changes in channelrhodopsin
- Department of Biological Sciences, Graduate School of Science, The University of Tokyo, Japan
- Graduate School of Life Science, University of Hyogo, Japan
- Graduate School of Engineering, Nagoya Institute of Technology, Japan
- Institute of Biology, Experimental Biophysics, Humboldt-Universität zu Berlin, Germany
- RIKEN SPring-8 Center, Japan
- Precursory Research for Embryonic Science and Technology (PRESTO), Japan Science and Technology Agency, Japan
- Department of Bioengineering Sciences, Graduate School of Bioagricultural Sciences, Nagoya University, Japan
- Department of Cell Biology, Graduate School of Medicine, Kyoto University, Japan
- Department of Chemistry, Graduate School of Science, Kobe University, Japan
- Japan Synchrotron Radiation Research Institute, Japan
- Department of Chemistry, Graduate School of Science, Kyoto University, Japan
Figures
Figure 1 with 1 supplement
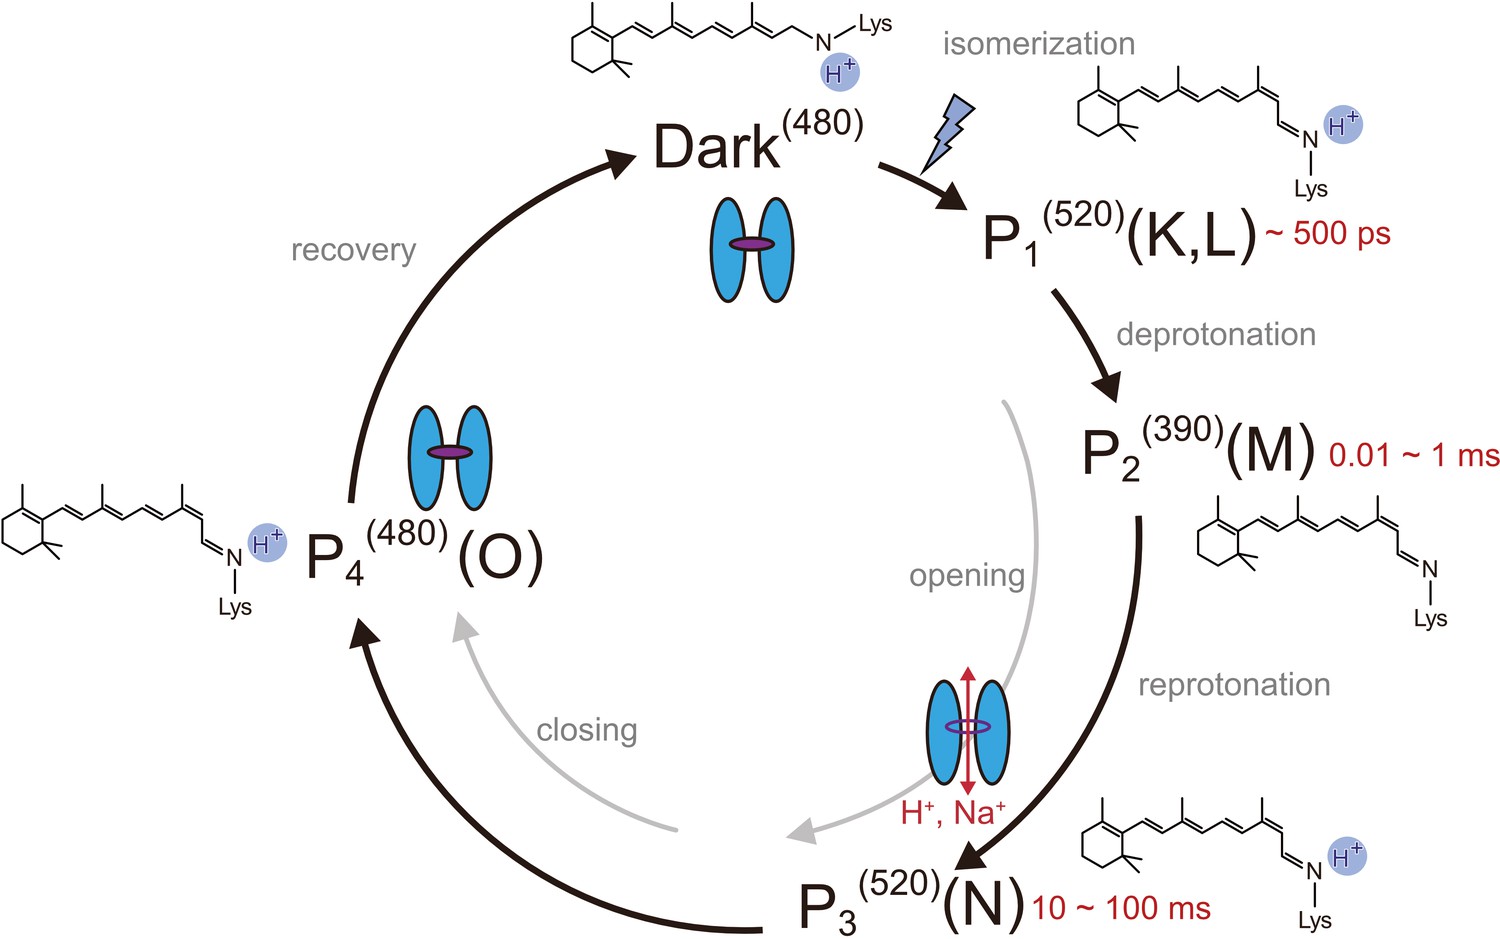
Photocycle model of channelrhodopsin.
Schematic model of the C1C2 photocycle. Superscript of each reaction intermediate (P1(520), P2(390), P3(520), P4(480)) indicates the wavelength of maximum absorption. Open/close states of the channel pore and the proposed model of the retinal and protonation of Schiff base are indicated. The time range in which the P1–P3 intermediates were observed in the spectroscopic studies in solution is shown.
Figure 1—figure supplement 1
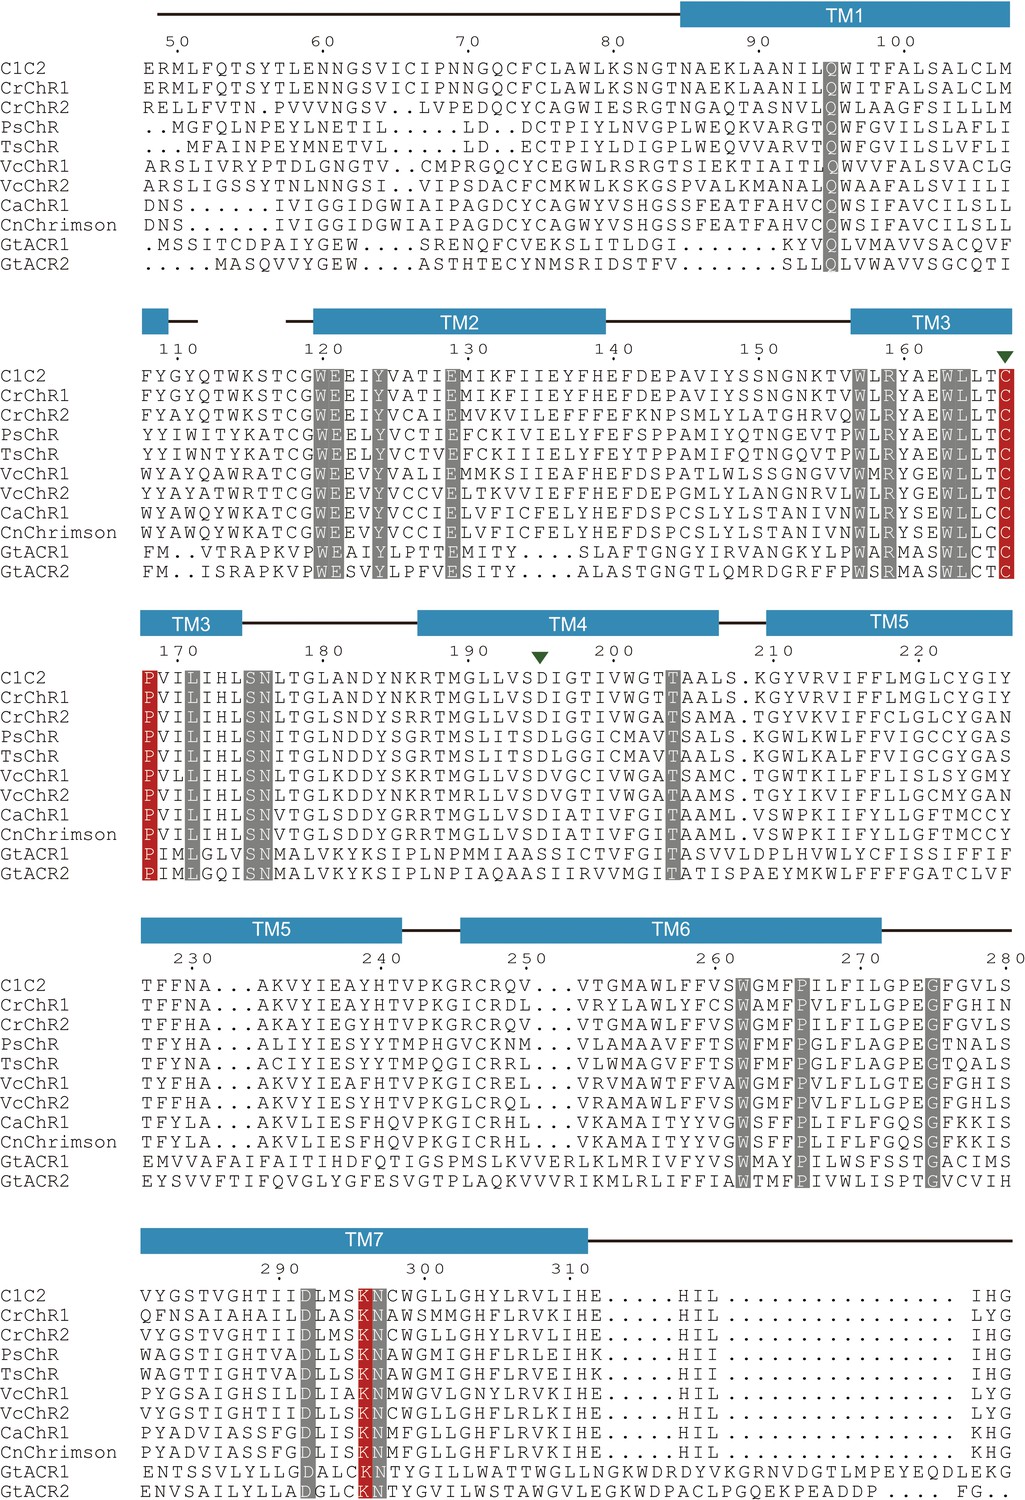
Sequence alignment of channelrhodopsin (ChR) variants.
Amino acid sequences of major variants of ChRs are shown. Conserved residues are highlighted in gray and red. The residues in red indicate important residues for the initial trigger revealed by the current study. The D–C pair is indicated by green arrow heads.
Figure 2 with 3 supplements
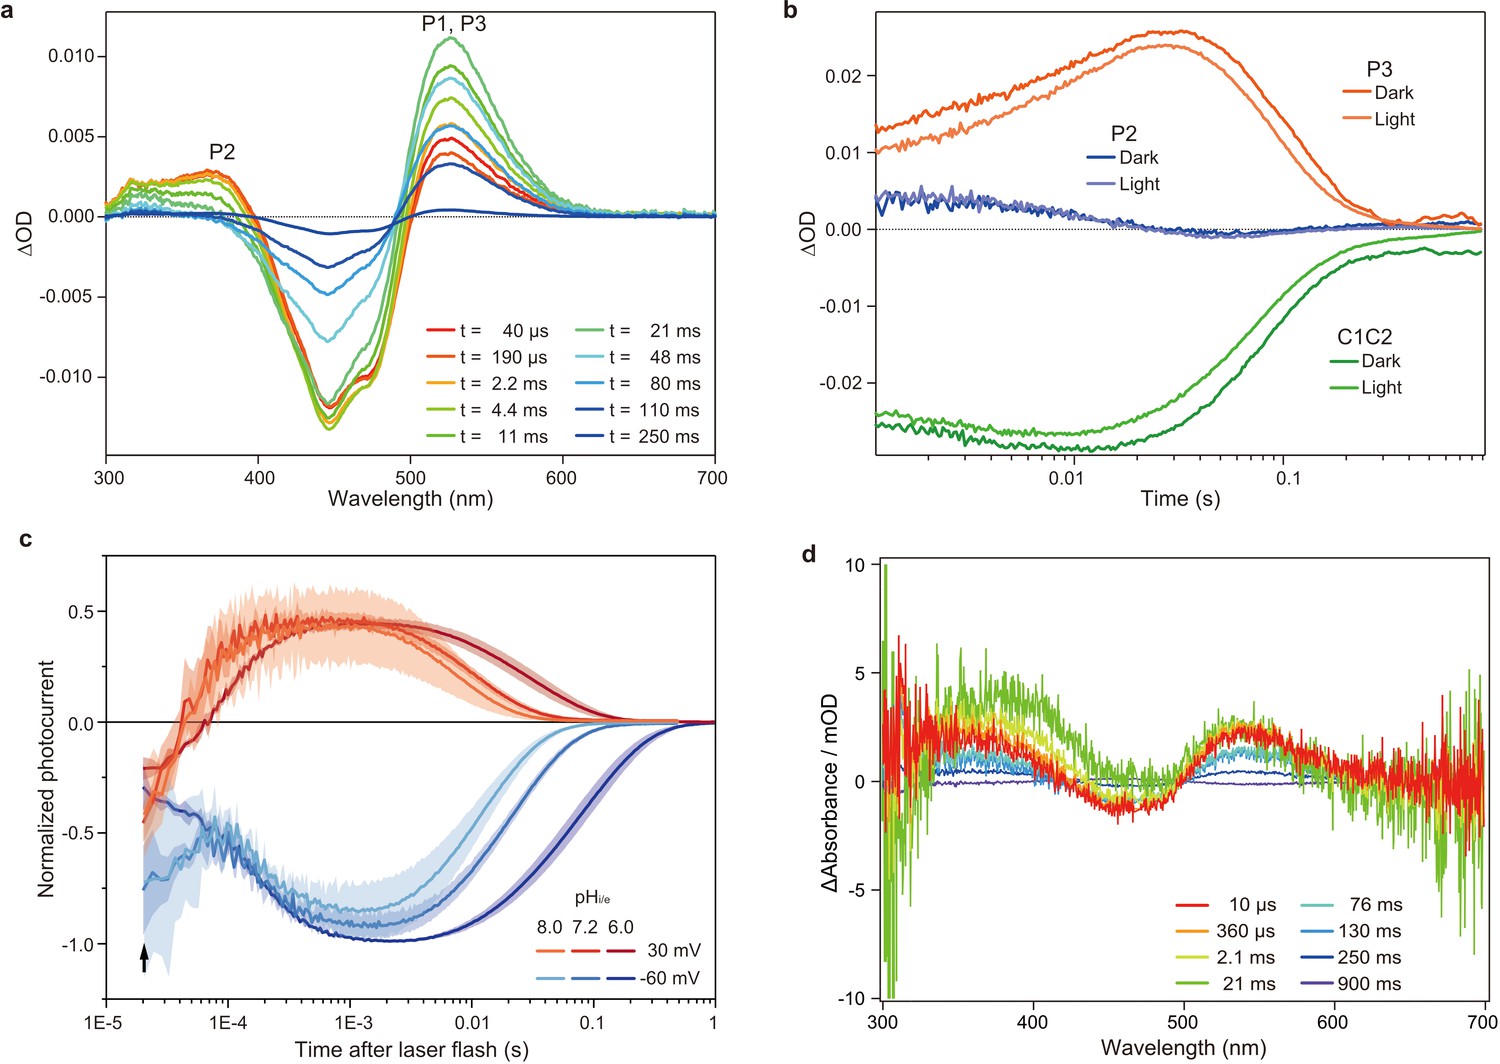
Flash photolysis and flash photo activation measurement of C1C2.
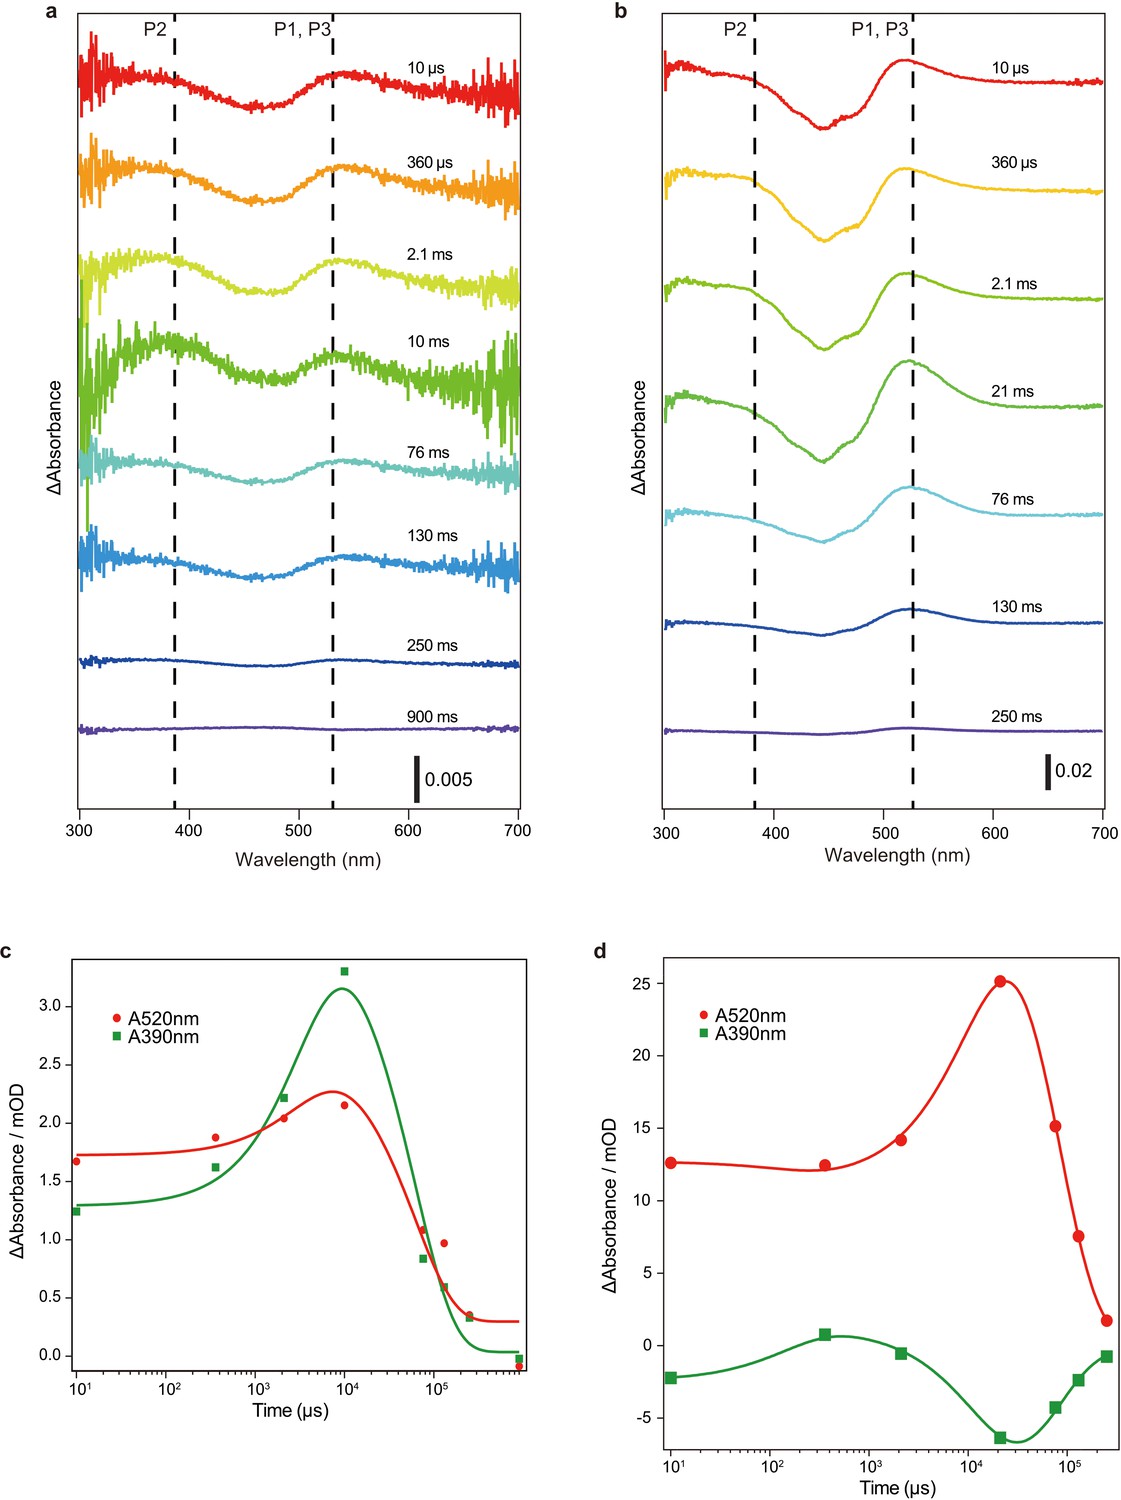
(a) Transient absorption spectra of C1C2 reconstituted in POPE/POPG (protein/lipid molar ratio = 1/50), 150 mM NaCl, 50 mM Tris-HCl (pH 8.0), 5% glycerol, and 0.01% cholesteryl hemisuccinate (CHS). (b) Time trace of absorption changes of C1C2 reconstituted in POPE/POPG, at 445 (green), 375 (blue), and 520 (red) nm probe wavelengths, which roughly estimate C1C2 (ground state), P2, and P3 formation, respectively. (c) Normalized, log-binned and averaged photocurrents of the C1C2 protein (mean ± SEM, n = 3 - 5). The black arrow indicates the inward directed current caused by retinal Schiff base deprotonation. (d) Transient difference absorption spectra recorded from the multiple C1C2 crystals. Each time-resolved spectrum was averaged over 21 crystal data sets. The time evolution is indicated from red to purple.
Figure 2—figure supplement 1
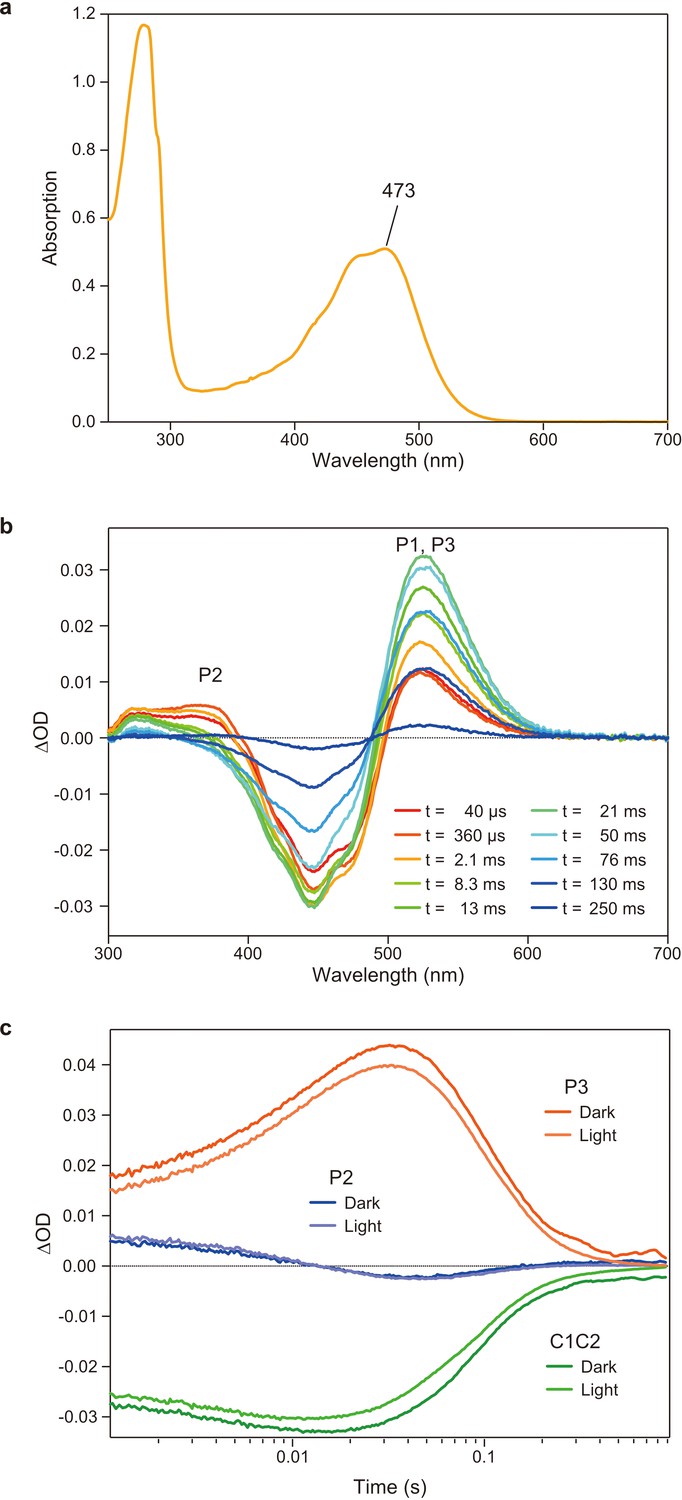
Flash photolysis measurements of C1C2 solution in n-dodecyl-β-D-maltoside (DDM).
(a) Absorption spectrum of purified C1C2 solubilized in DDM detergent. (b) Transient absorption spectra of C1C2 in DDM. (c) Time traces of absorption changes of C1C2 in DDM at 445 (green), 375 (blue), and 520 nm (red) probe wavelengths.
Figure 2—figure supplement 2
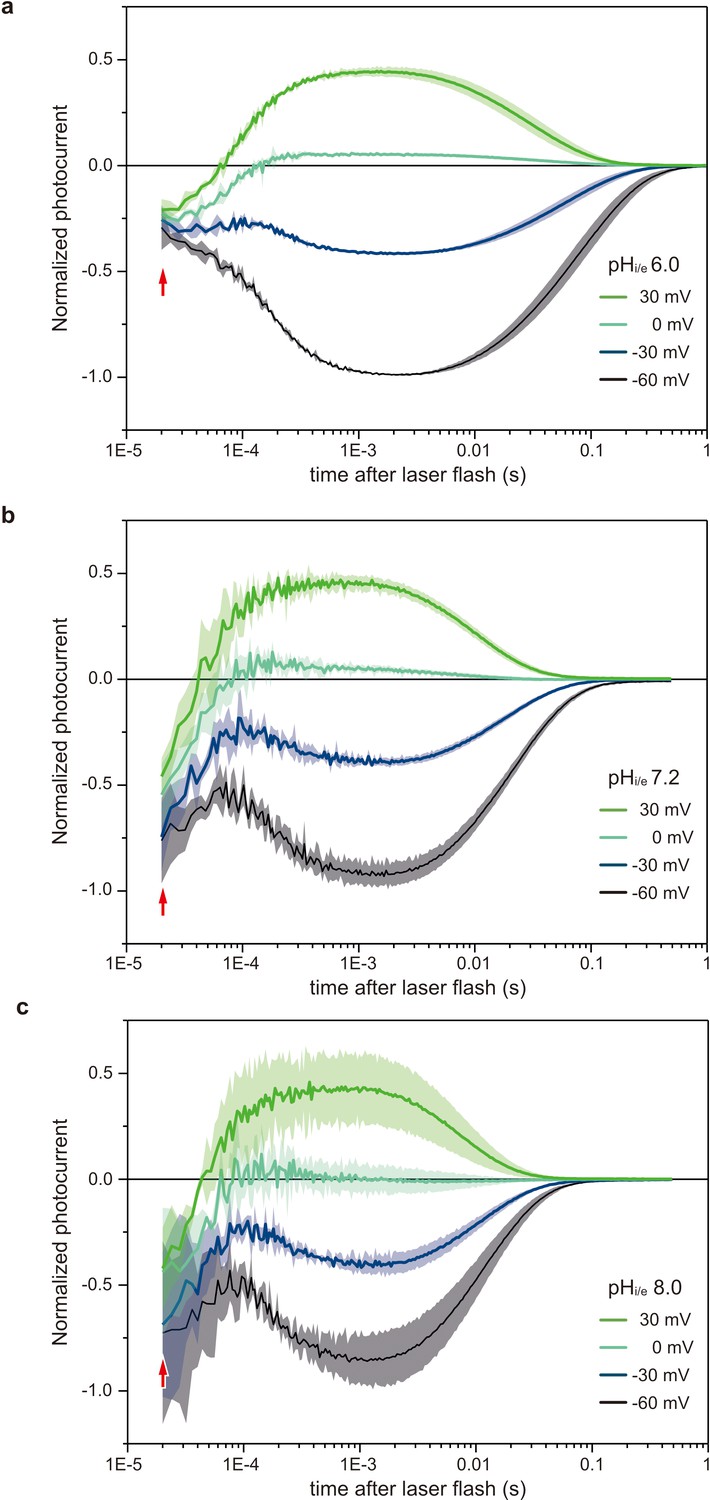
Voltage-clamp recordings in HEK293 cells of photocurrents from C1C2.
Normalized, log-binned and averaged photocurrents of the C1C2 protein (mean ± SEM, n = 3 - 5) with pHi/e 6.0 (a), 7.2 (b), and 8.0 (c). Red arrows indicate the inward directed current caused by retinal Schiff base deprotonation.
Figure 2—figure supplement 3
Flash photolysis measurements of C1C2 crystals and C1C2 solution in n-dodecyl-β-D-maltoside (DDM).
(a and b) Transient difference absorption spectra recorded from the C1C2 crystals (a) and C1C2 solution in DDM (b). The time evolution is indicated from red to blue. Dashed lines indicate the wavelengths of maximum absorption of the reaction intermediates (c and d).
Figure 3 with 3 supplements
Microcrystals for serial femtosecond crystallography (SFX) experiment and C1C2 SFX structure.
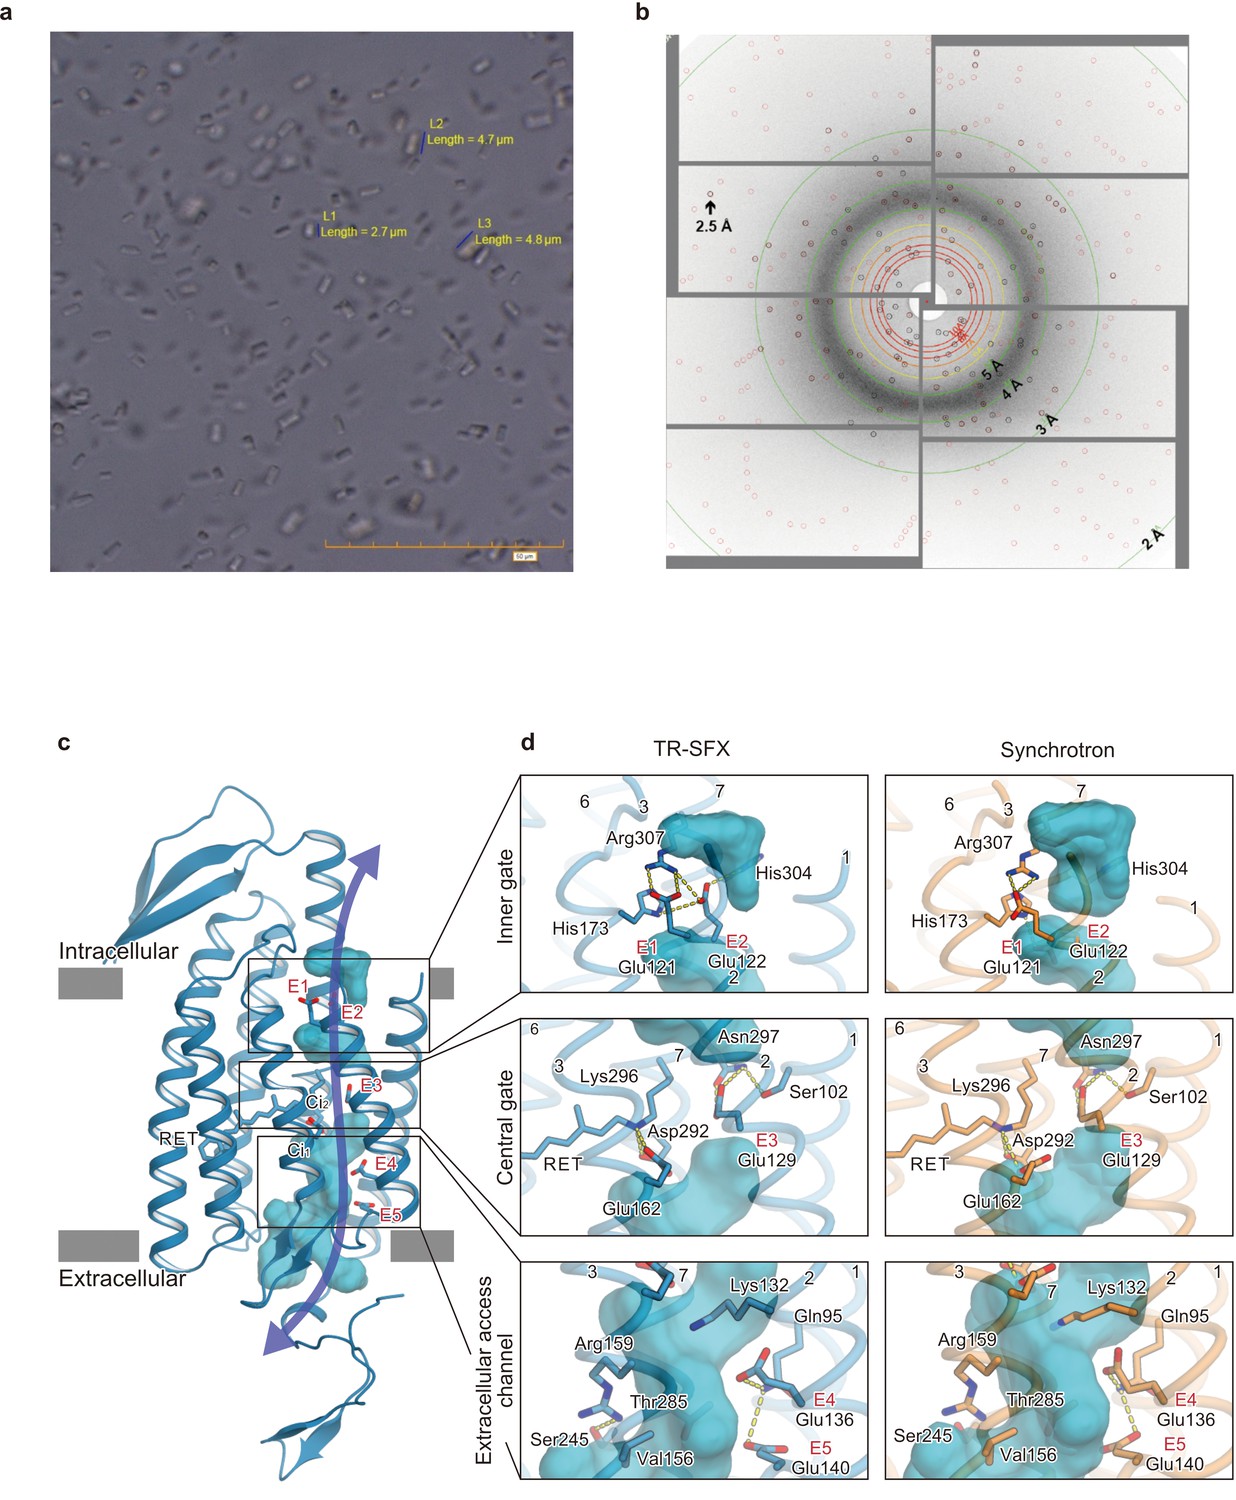
(a) Lipidic cubic phase (LCP) crystals of C1C2 optimized for the time-resolved SFX (TR-SFX) experiments. The orange scale bar on the lower right indicates 50 μm, with 5 μm sub-scaling lines. The size of the crystals ranged from 2 to 5 μm. (b) A diffraction image from a C1C2 crystal, obtained with a single SACLA-XFEL pulse. (c) The structure of dark state C1C2 determined by serial femtosecond crystallography. A water accessible cavity is illustrated, with the putative ion pathway indicated by an arrow. The five glutamic acid residues lining the ion pore (E1–5) and the two counterion residues (Ci1 and Ci2) are indicated by sticks, and the three constriction sites, the inner, central, and outer gates, are enclosed in boxes. (d) Comparisons of the constriction sites of the TR-SFX structure (left panels) and the synchrotron structure (right panels; PDB code 3UG9) of C1C2, for the inner (upper panels), central (middle panels), and outer (lower panels) gates. The constituent residues are shown as sticks, and the TM helix number is indicated on each helix.
Figure 3—figure supplement 1
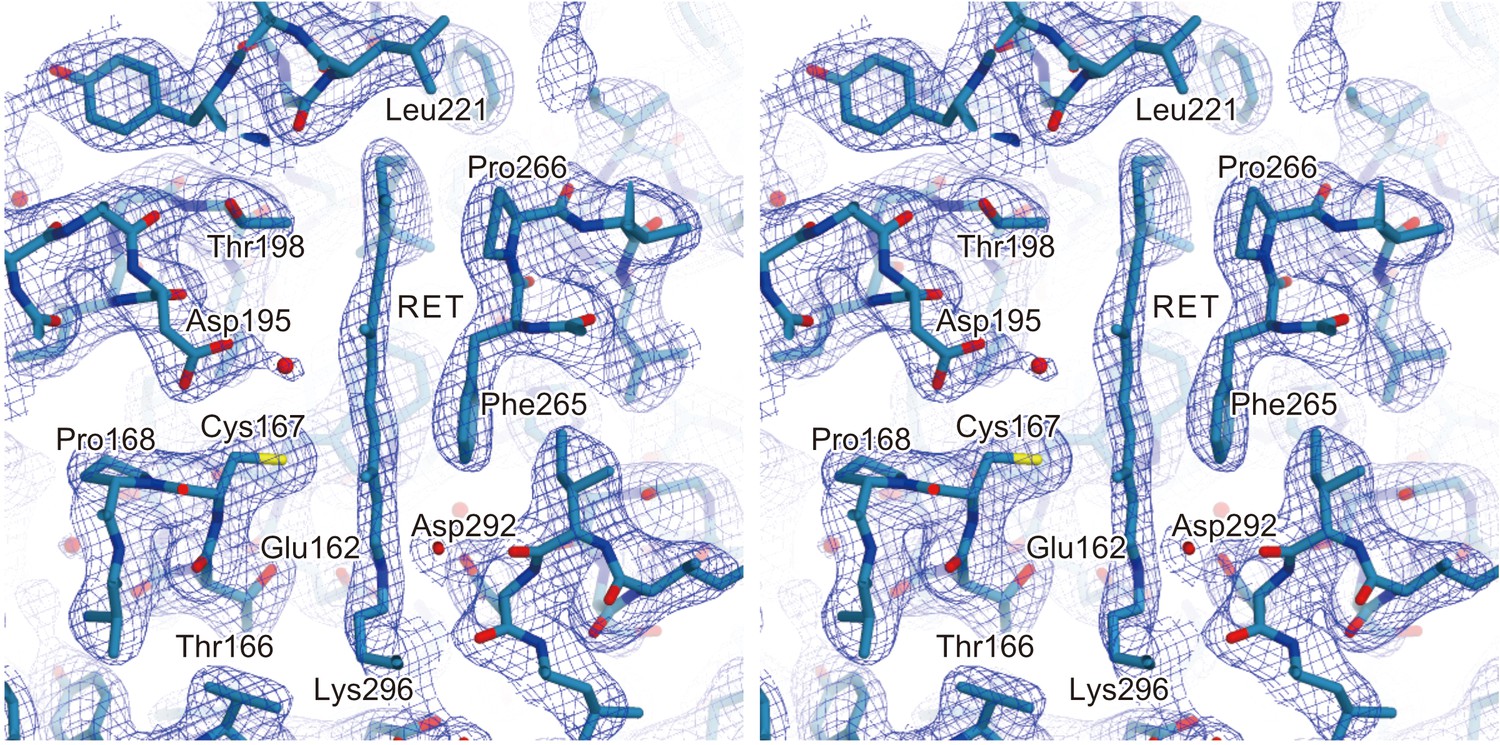
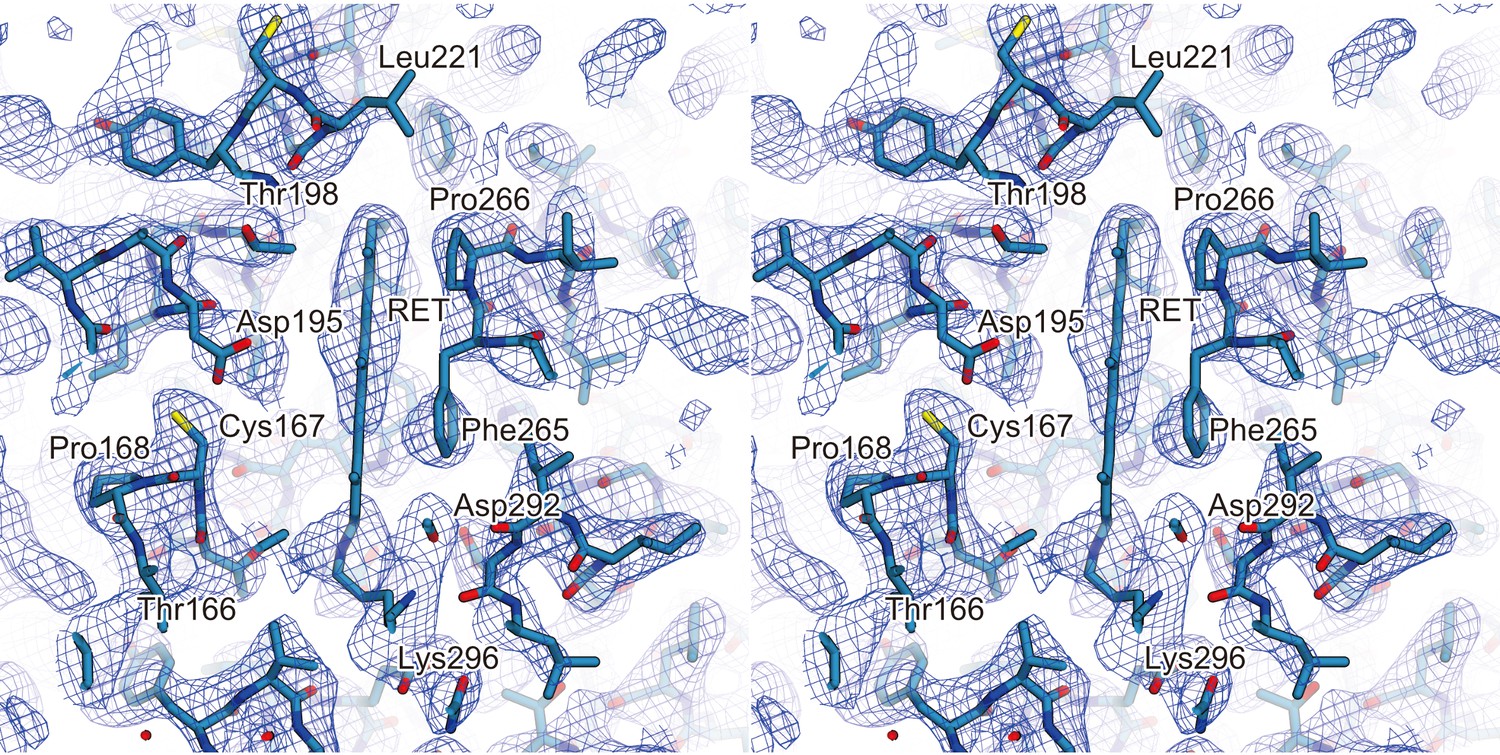
Electron density of retinal.
A stereo view of the 2Fo–Fc electron density map for the retinal binding pocket, shown as a mesh representation contoured at 0.9σ. The all-trans retinal and the surrounding residues are indicated by sticks. The red spheres indicate water molecules.
Figure 3—figure supplement 2
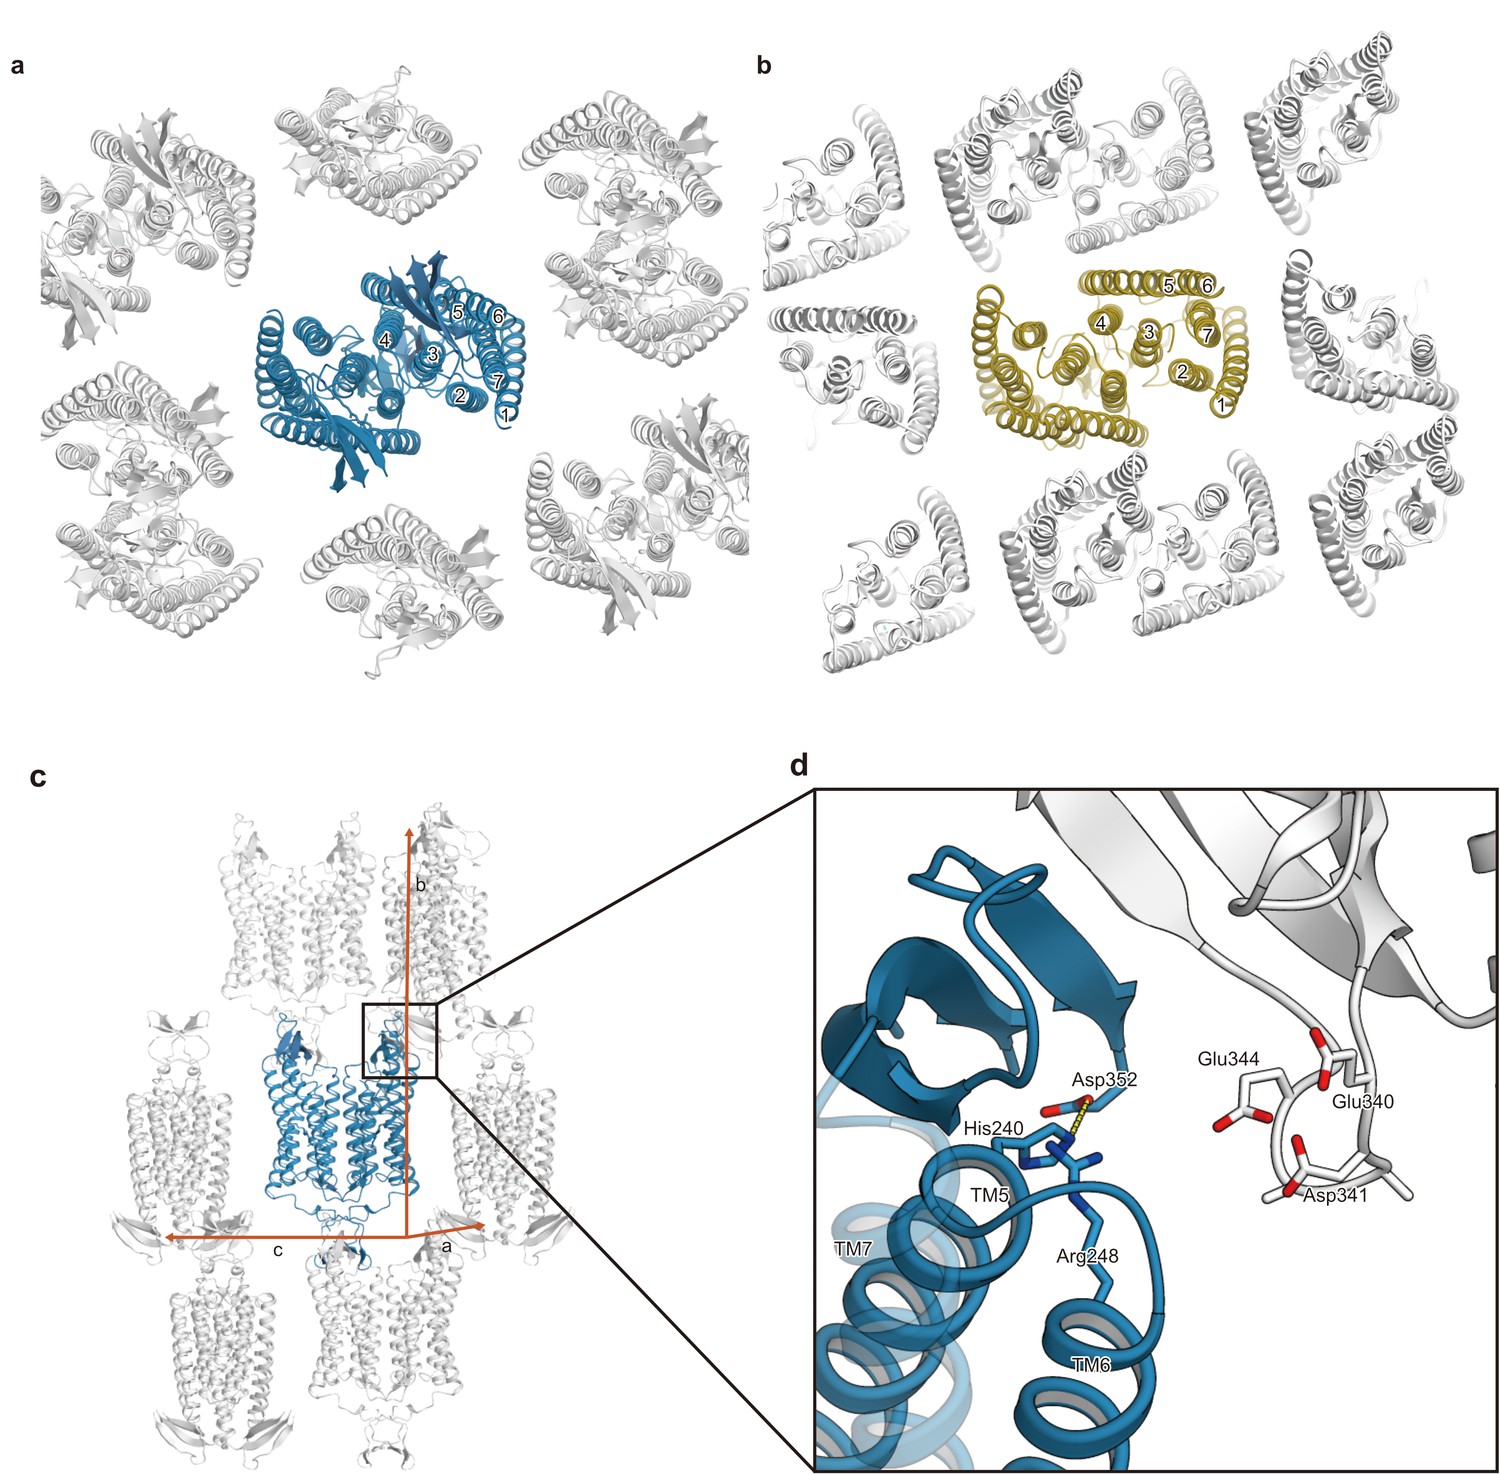
Comparison of the crystal packing between C1C2 and CrChR2.
(a and b) Comparison of the crystal packing between C1C2 (PDB: 3UG9) (a) and CrChR2 (PDB: 6EID) (b). The crystal packing of C1C2 shows minimal packing interactions, as compared to the CrChR2 crystal packing. (c) The C1C2 molecules in the crystals are shown in ribbons, viewed from within the lipidic cubic phase (LCP) crystal layer. (d) The residues involved in the crystal packing interactions are shown in sticks.
Figure 3—figure supplement 3
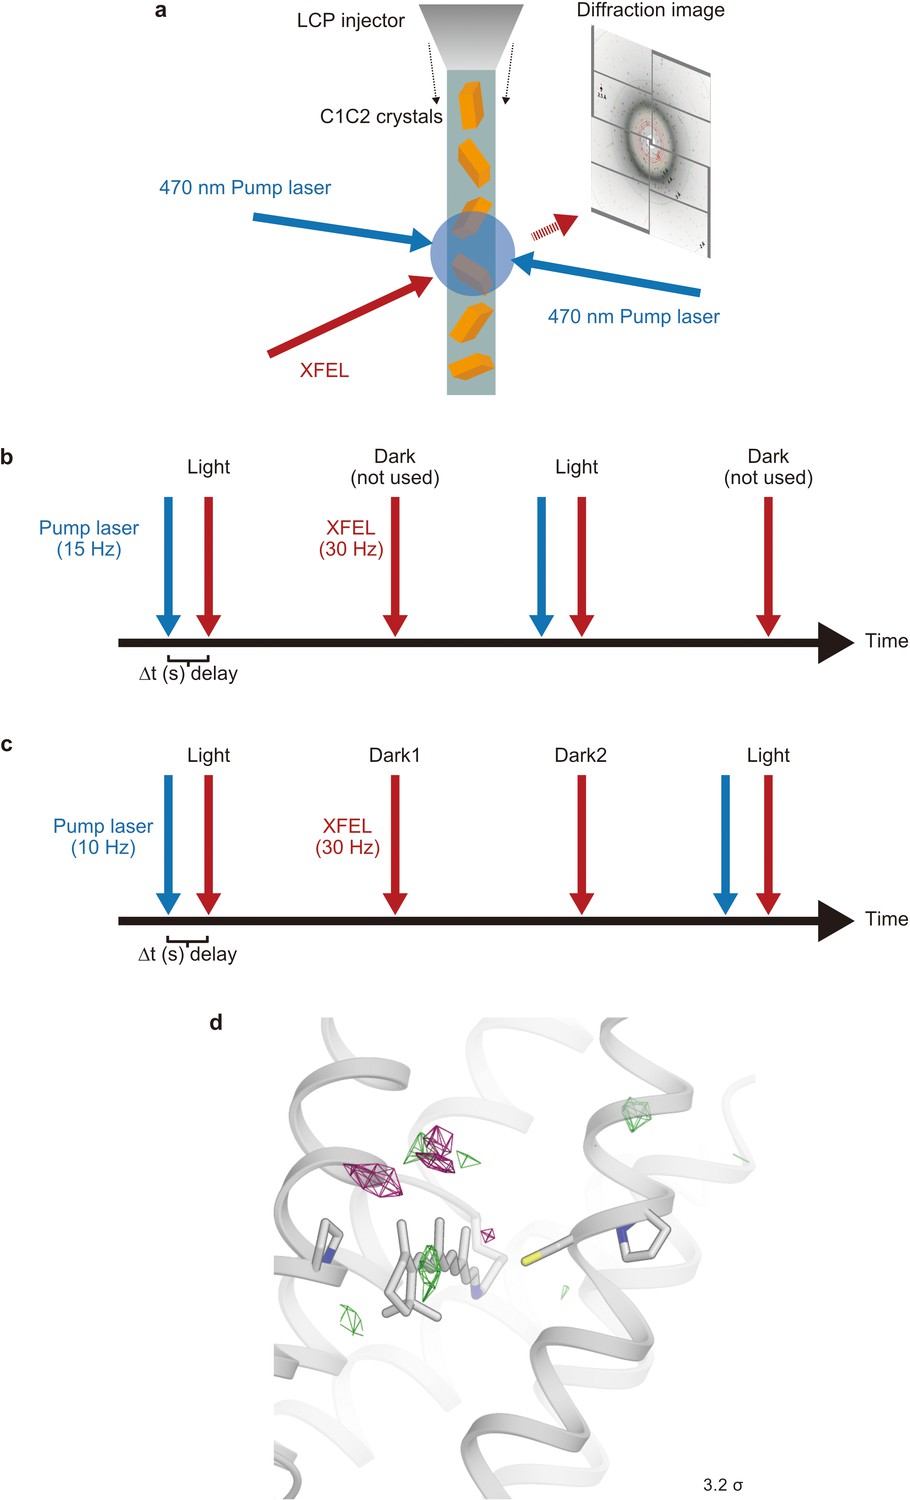
Schematic model of the time-resolved serial femtosecond crystallography setup.
(a) The lipidic cubic phase (LCP) microjet continuously transports microcrystals across the focused X-ray free electron laser (XFEL) beam. X-ray diffraction is recorded on a detector for each XFEL exposure. A blue ns laser is used to photo-activate C1C2 microcrystals prior to the arrival of an XFEL pulse. (b and c) Data collection sequence illustrating how X-ray diffraction data were collected at 30 Hz from photoactivated (blue laser flash, 15 Hz [b] and 10 Hz [c], respectively) and resting (no laser flash) phases in an interleaved fashion. Part of the time-resolved serial femtosecond crystallography (TR-SFX) was recorded with a 10 Hz laser flash to check for light-contamination. (d) Fourier difference map of dark2 from the ‘dark’ data set, which was separately collected (Materials and methods).
Figure 4 with 5 supplements
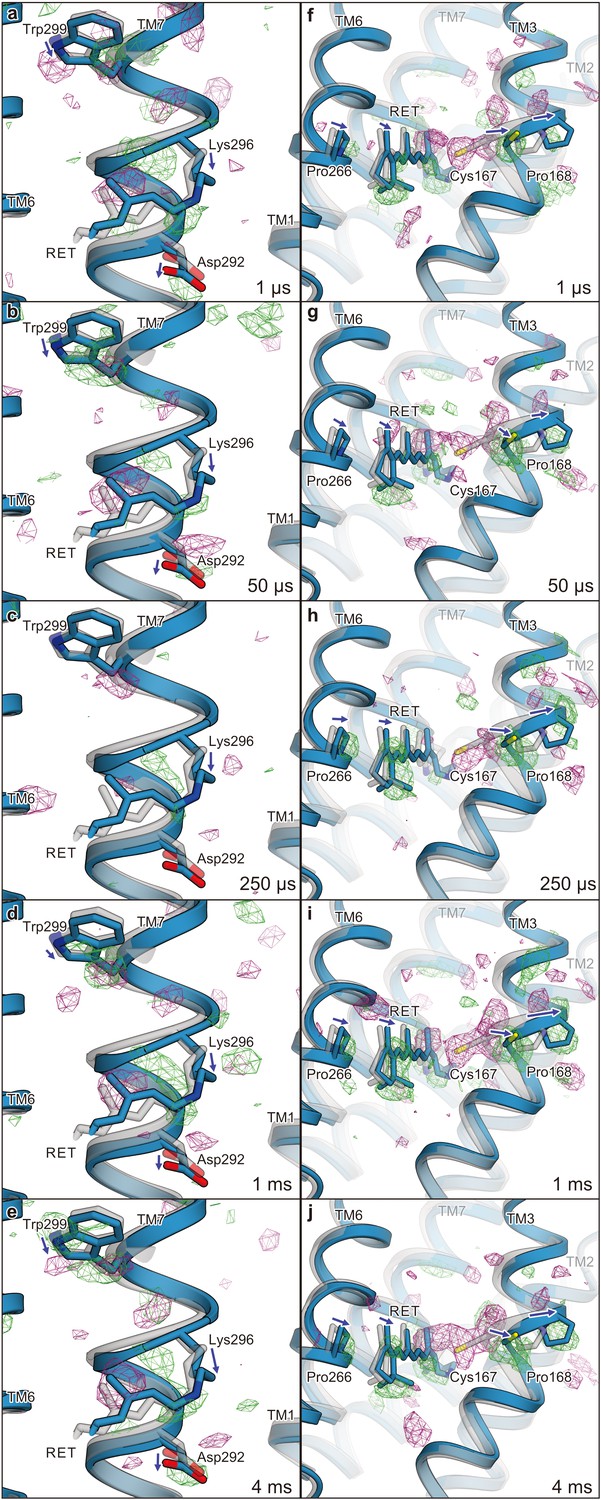
Difference Fourier electron density map and structural changes around TM7 and TM3.
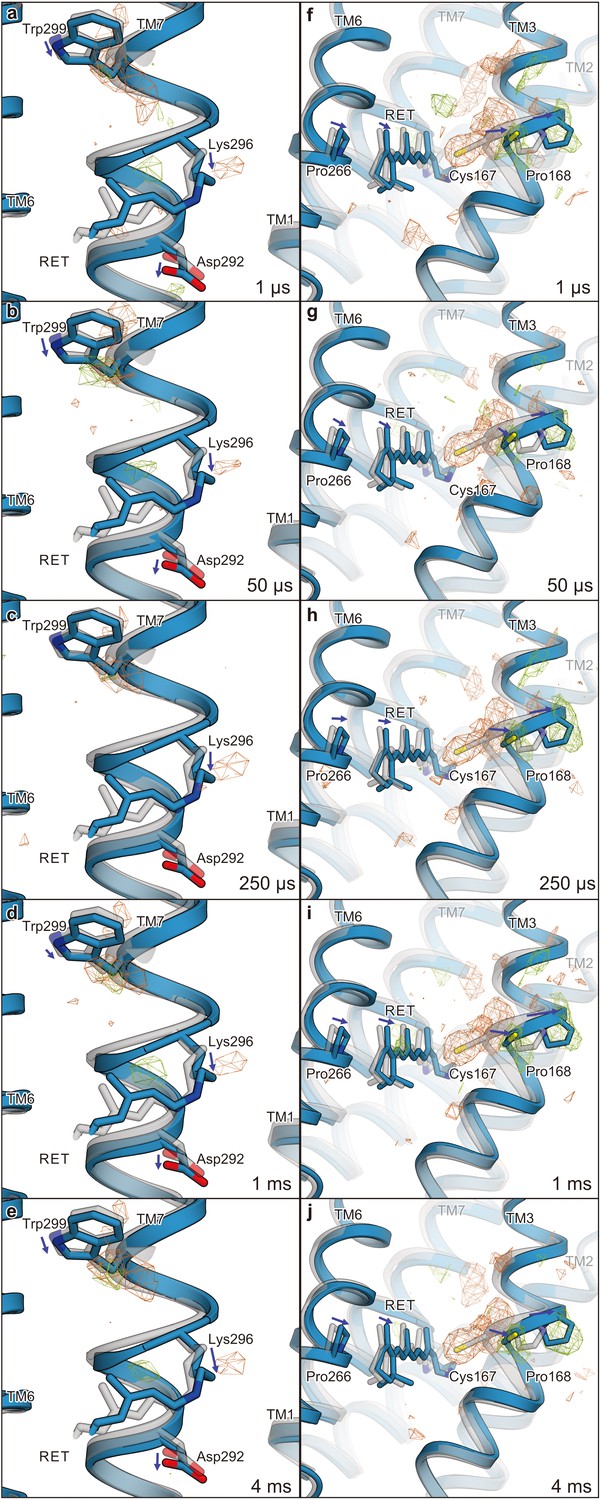
Views of the |Fobs|light− |Fobs|dark difference Fourier electron density maps and the structural changes around TM7 (a–e) and TM3 (f–j) for 1 μs (a and f), 50 μs (b and g), 250 μs (c and h), 1 ms (d and i), and 4 ms (e and j). Green and purple meshes indicate positive and negative difference electron densities, respectively (contoured at ±3.1 to 3.3σ, see also Figure 4—figure supplement 1). The difference Fourier maps were calculated by using the phases from the coordinates of the dark-adapted C1C2 structure (gray). Paired negative and positive difference electron densities indicate the downward shift of TM7 and the outward shift of TM3. The structural model (blue) was refined against the extrapolated data of each time point and the model was superimposed upon the initial-state C1C2 model (gray). Movements of the residues and the TM helices are indicated by arrows. Probably due to the variations in the crystal quality (Table 1), the difference density in the 250 μs time-delay seems rather weak.
Figure 4—figure supplement 1
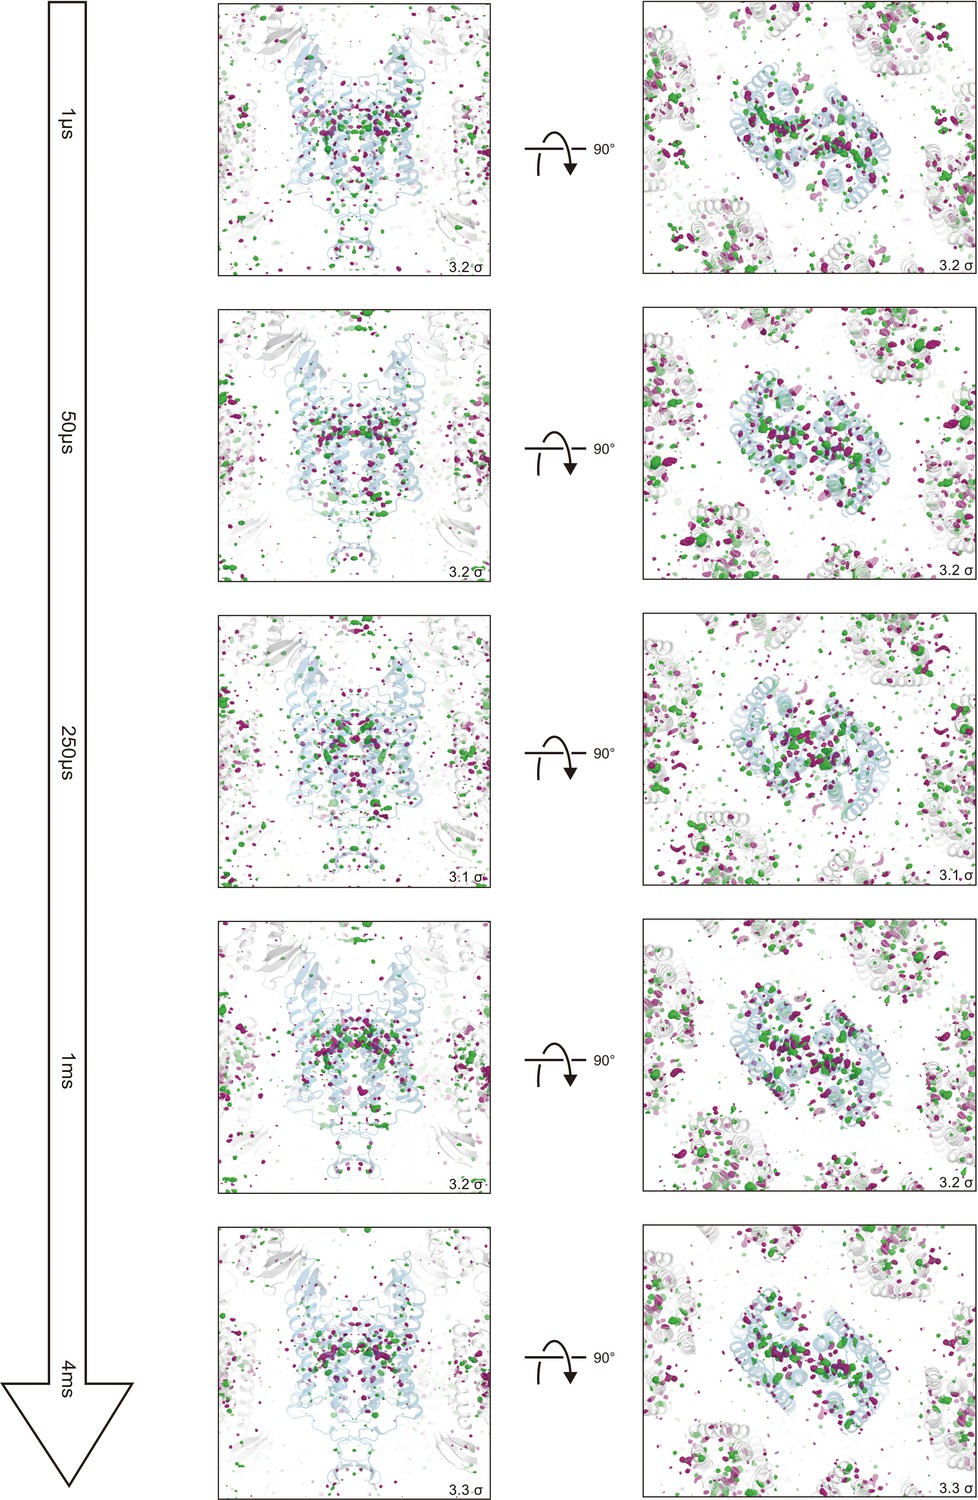
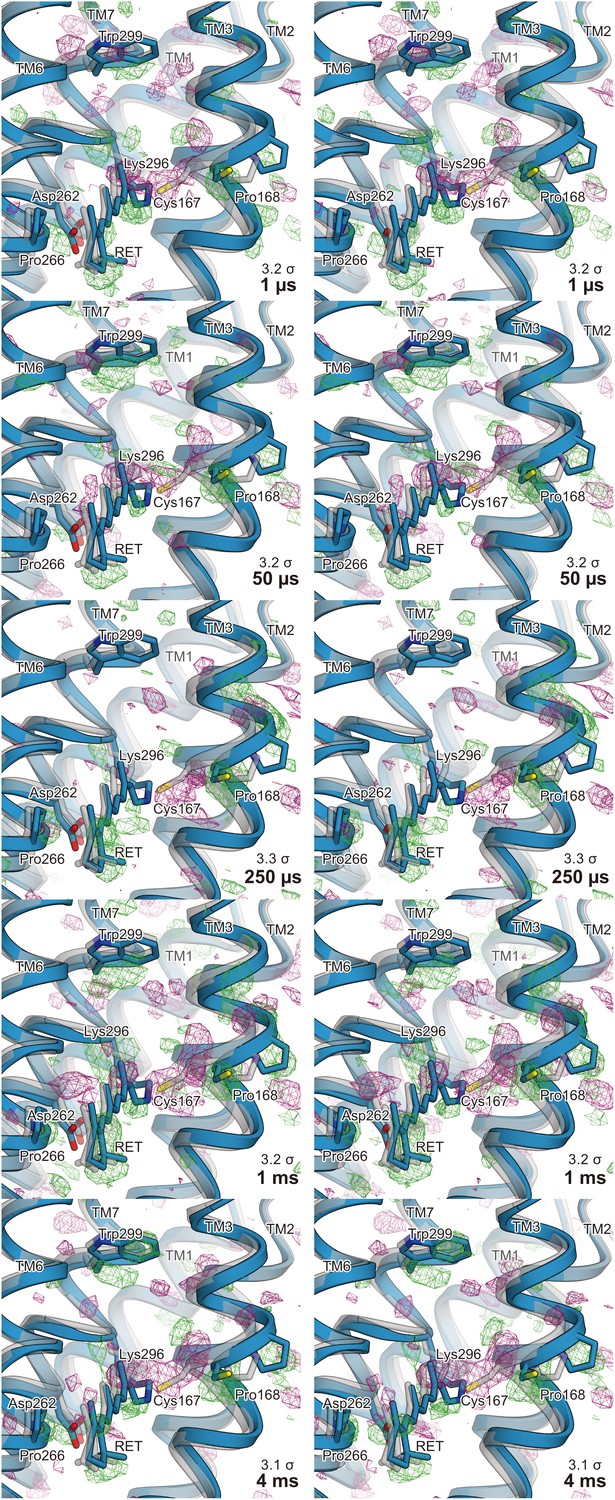
Overview of the |Fobs|light− |Fobs|dark difference Fourier electron density maps for five time points.
Green represents positive difference electron density (contoured at +3.1 to 3.3σ, where sigma represents the root mean square electron density of the unit cell) and purple represents negative difference electron density (contoured at −3.1 to −3.3σ). The initial-state C1C2 structure was used for the phases in calculating these difference Fourier maps and is shown in blue. Significant density changes were only observed in the protein regions.
Figure 4—figure supplement 2
Stereo views of the difference Fourier electron density maps and structural changes.
Stereo views of the |Fobs|light− |Fobs|dark difference Fourier electron density maps and the structural changes of C1C2. Each time point is indicated in the respective maps. The structural model (blue) was refined against the extrapolated data of each time point and the model was superimposed upon the initial-state C1C2 model (gray).
Figure 4—figure supplement 3
Electron density of extrapolated map.
A stereo view of the extrapolated electron density map for the retinal binding pocket, shown as a mesh representation contoured at 1.2σ. The 13-cis retinal and the surrounding residues are indicated by sticks. The red spheres indicate water molecules.
Figure 4—figure supplement 4
Calculated difference |Fcalc|light− |Fcalc|dark map and structural changes around TM7 and TM3.
Views of the structural changes around TM7 (a–e) and TM3 (f–j) for 1 μs (a and f), 50 μs (b and g), 250 μs (c and h), 1 ms (d and i), and 4 ms (e and j). Light green and orange mesh indicate positive and negative difference electron densities, respectively (contoured at ±3.9 to 4.2 σ, see also Figure 4—figure supplement 1). The structural model (blue) was refined against the extrapolated data of each time point and the model was superimposed upon the initial-state C1C2 model (gray). Movements of the residues and the TM helices are indicated by arrows.
Figure 4—figure supplement 5
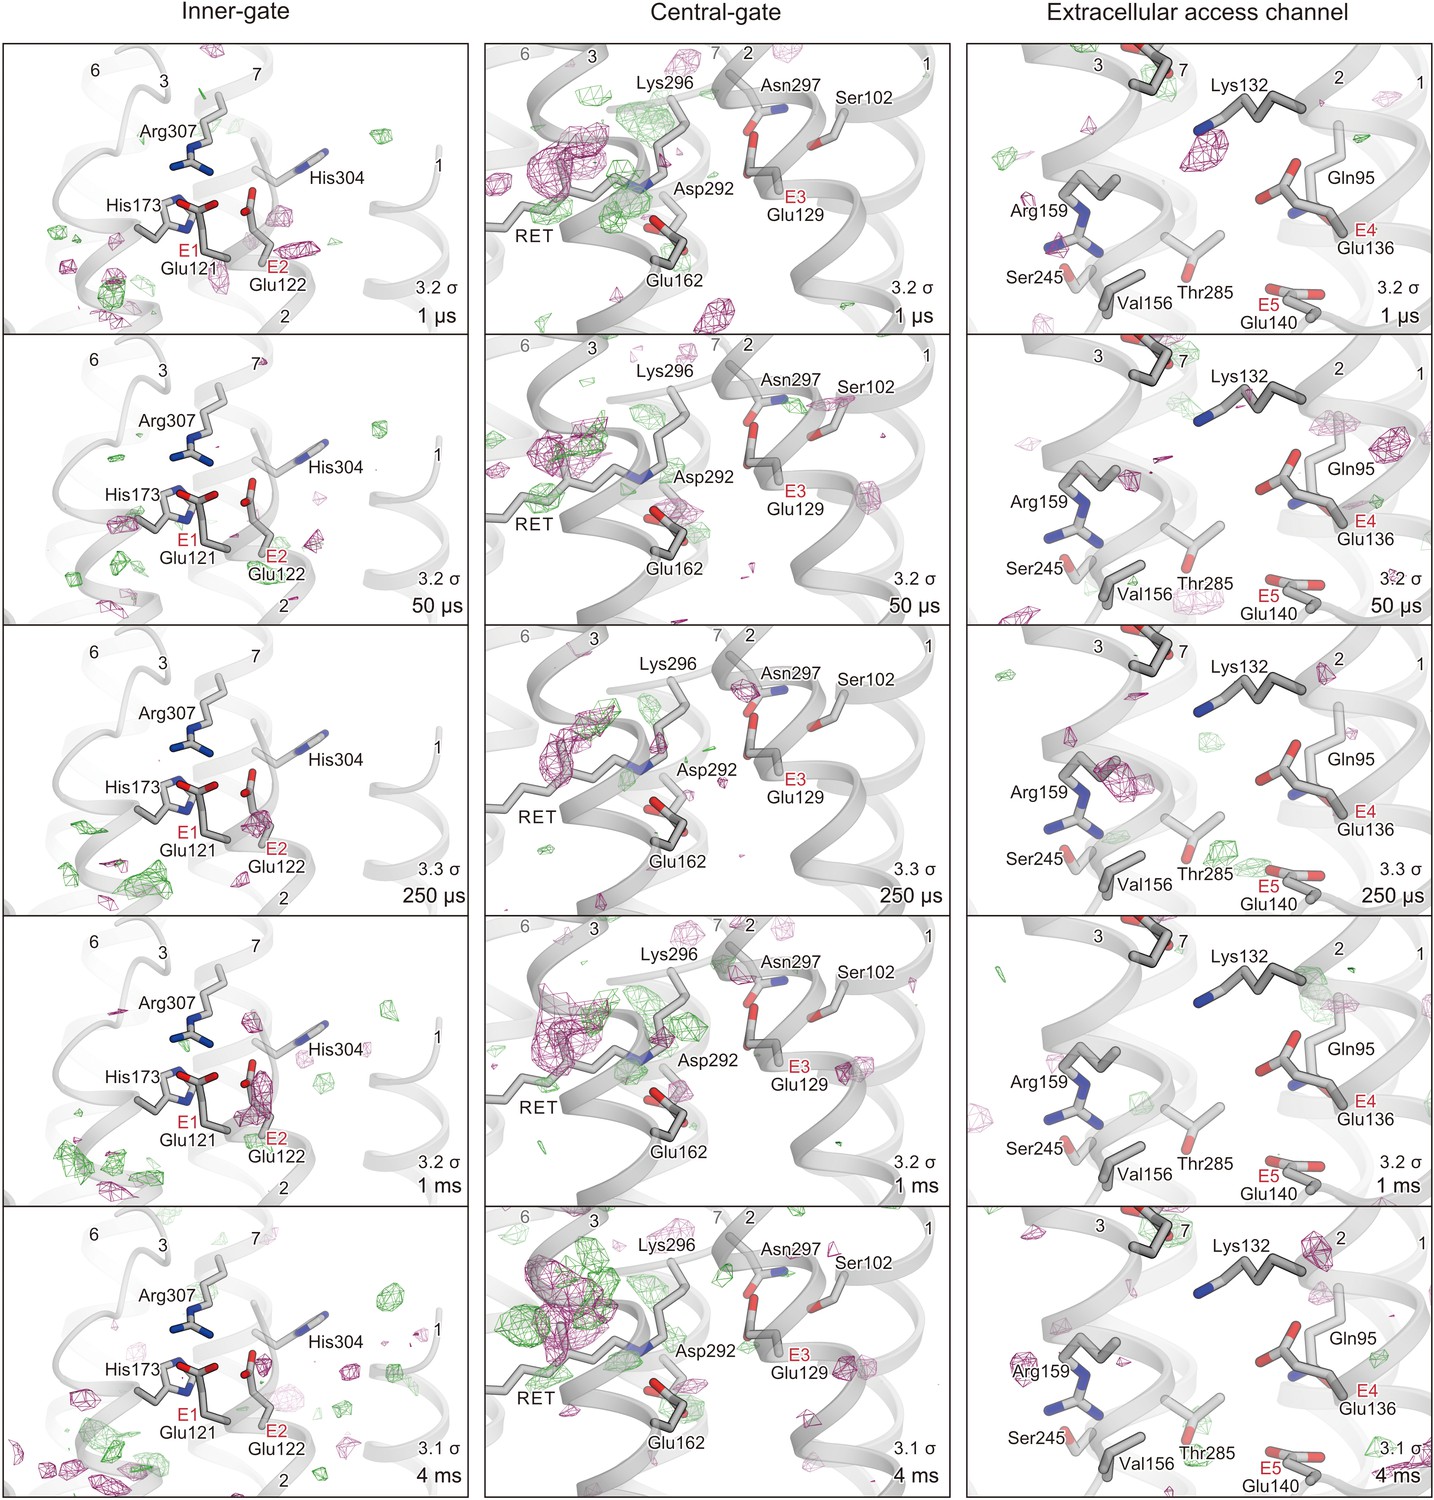
Difference Fourier maps along the putative ion pore.
Difference maps of different time delays are shown for the inner-gate (left), central-gate (middle), and extracellular water access channel (right). Each time point and contour level is indicated in the respective maps.
Figure 5
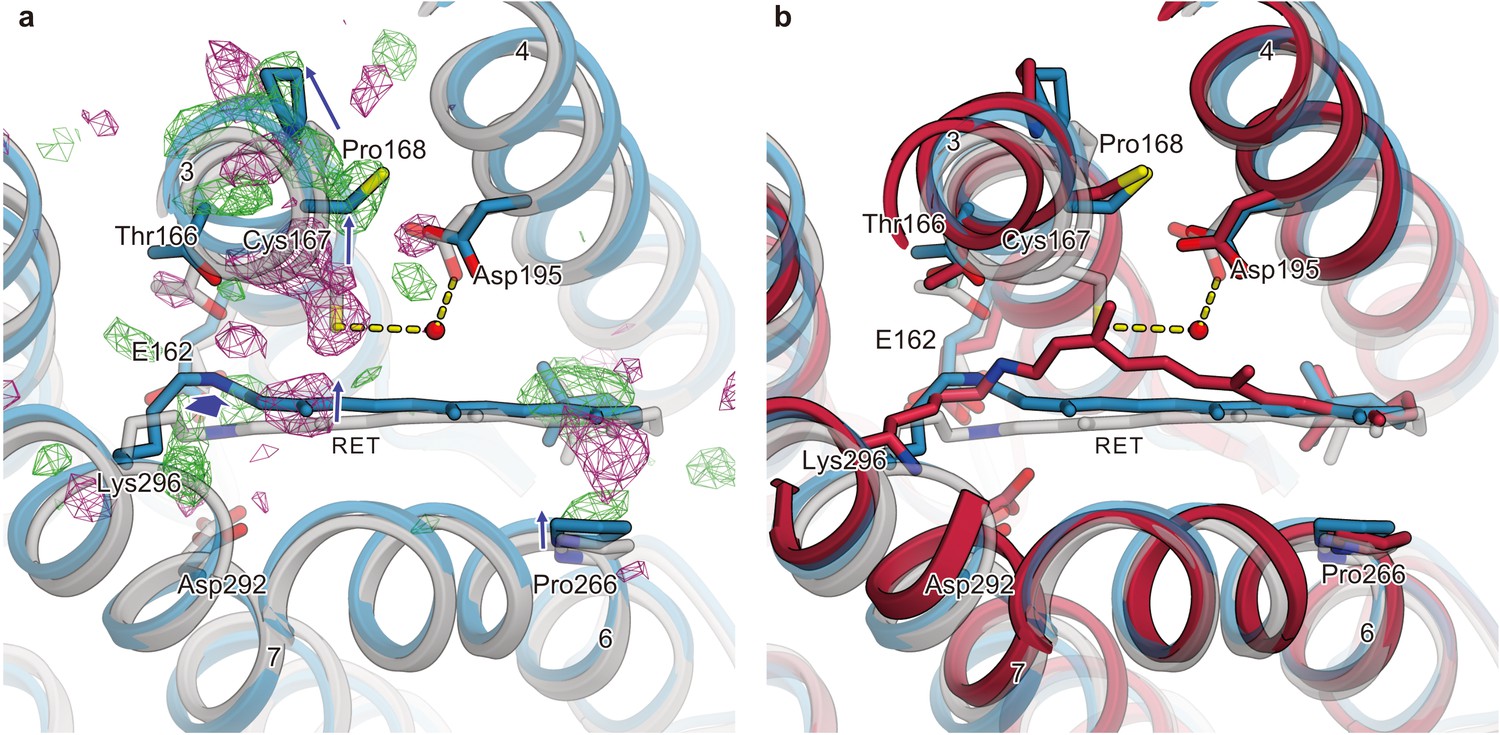
Conformational change of retinal and comparison with QM/MM model.
(a) Intracellular view of the |Fobs|light− |Fobs|dark difference Fourier electron density map and the structural changes around the retinal. Green and purple meshes indicate positive and negative difference electron densities, respectively. The structural model (blue) was refined against the extrapolated data of 1 ms and the model was superimposed upon the initial-state C1C2 model (gray). Movements of residues or TM helices are indicated by arrows. (b) The retinal pocket of dark-adapted C1C2 (gray), the model at the 1 ms delayed-time point (blue), and the model at 400 ns of the QM/MM simulation (Cheng et al., 2018) (red) are superimposed together.
Figure 6
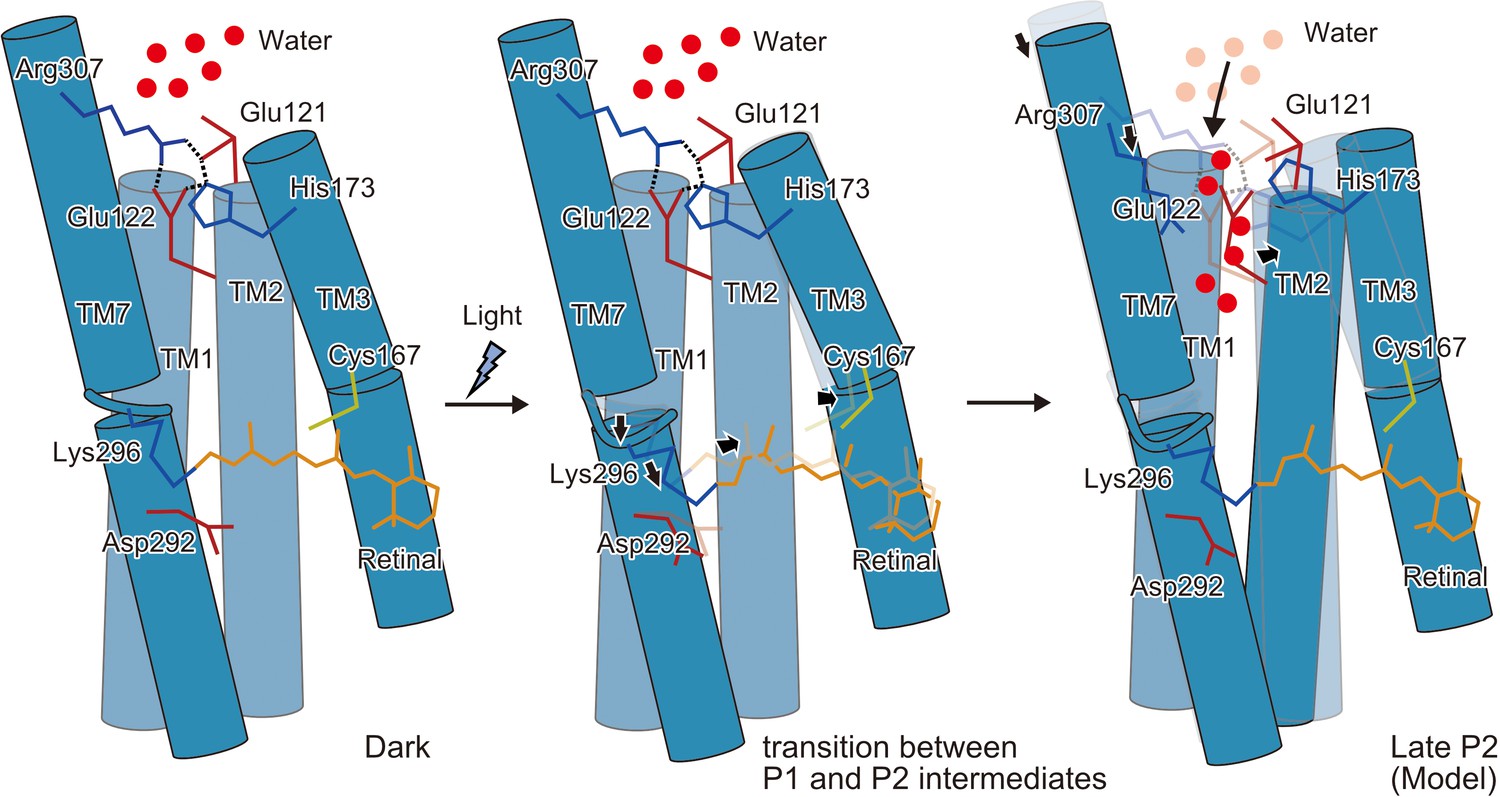
Schematic model of the C1C2 channel opening.
The inner gate formed by Glu121, Glu122, His173, and Arg307 prevents water influx in the initial dark-adapted state. After the retinal isomerization reaction, the retinal twists and shifts toward Cys167 and induces an outward shift of TM3, originating at the kink introduced by Pro168. Isomerization of the retinal also induces a downward shift of the middle portion of TM7, especially at the retinal-attached residue, Lys296 (transition between the P1 and P2 intermediates). These movements are likely to induce water influx, by destabilizing the intracellular constriction, and further induce rearrangement of the surrounding helices (Open model).
Videos
Video 1
Overview of the |Fobs|light− |Fobs|dark difference.
Fourier electron density maps for five time points and structural changes. Views of the |Fobs|light− |Fobs|dark difference Fourier electron density maps and the structural changes. Green and purple meshes indicate positive and negative difference electron densities, respectively (contoured at ±3.1 to 3.3σ, see also Figure 4—figure supplement 1). The difference Fourier maps were calculated by using the phases from the coordinates of the dark-adapted C1C2 structure (gray). Paired negative and positive difference electron densities indicate the downward shift of TM7 and the outward shift of TM3. The structural model (blue) was refined against the extrapolated data of each time point and the model was superimposed upon the initial-state C1C2 model (gray). Movements of the residues and the TM helices are indicated by arrows. Probably due to the variations in the crystal quality (Supplementary file 1), the difference density in the 250 μs time-delay seems rather weak.
Additional files
-
Supplementary file 1
Crystallographic data and refinement statistics.
Values in parenthesis are those of the highest resolution shell.
- https://cdn.elifesciences.org/articles/62389/elife-62389-supp1-v1.docx
-
Supplementary file 2
Refinement statistics associated with extrapolated data.
Because of the large variance of the extrapolated structure factor amplitude, the R values tend to be worse.
- https://cdn.elifesciences.org/articles/62389/elife-62389-supp2-v1.docx
-
Transparent reporting form
- https://cdn.elifesciences.org/articles/62389/elife-62389-transrepform-v1.pdf
Download links
A two-part list of links to download the article, or parts of the article, in various formats.
Downloads (link to download the article as PDF)
Open citations (links to open the citations from this article in various online reference manager services)
Cite this article (links to download the citations from this article in formats compatible with various reference manager tools)
Time-resolved serial femtosecond crystallography reveals early structural changes in channelrhodopsin
eLife 10:e62389.
https://doi.org/10.7554/eLife.62389


