Selenium supplementation inhibits IGF-1 signaling and confers methionine restriction-like healthspan benefits to mice
- Department of Biology, Orentreich Foundation for the Advancement of Science, United States
- Department of Pathology and Laboratory Medicine, Weill Cornell Medicine, United States
Figures
Figure 1 with 1 supplement
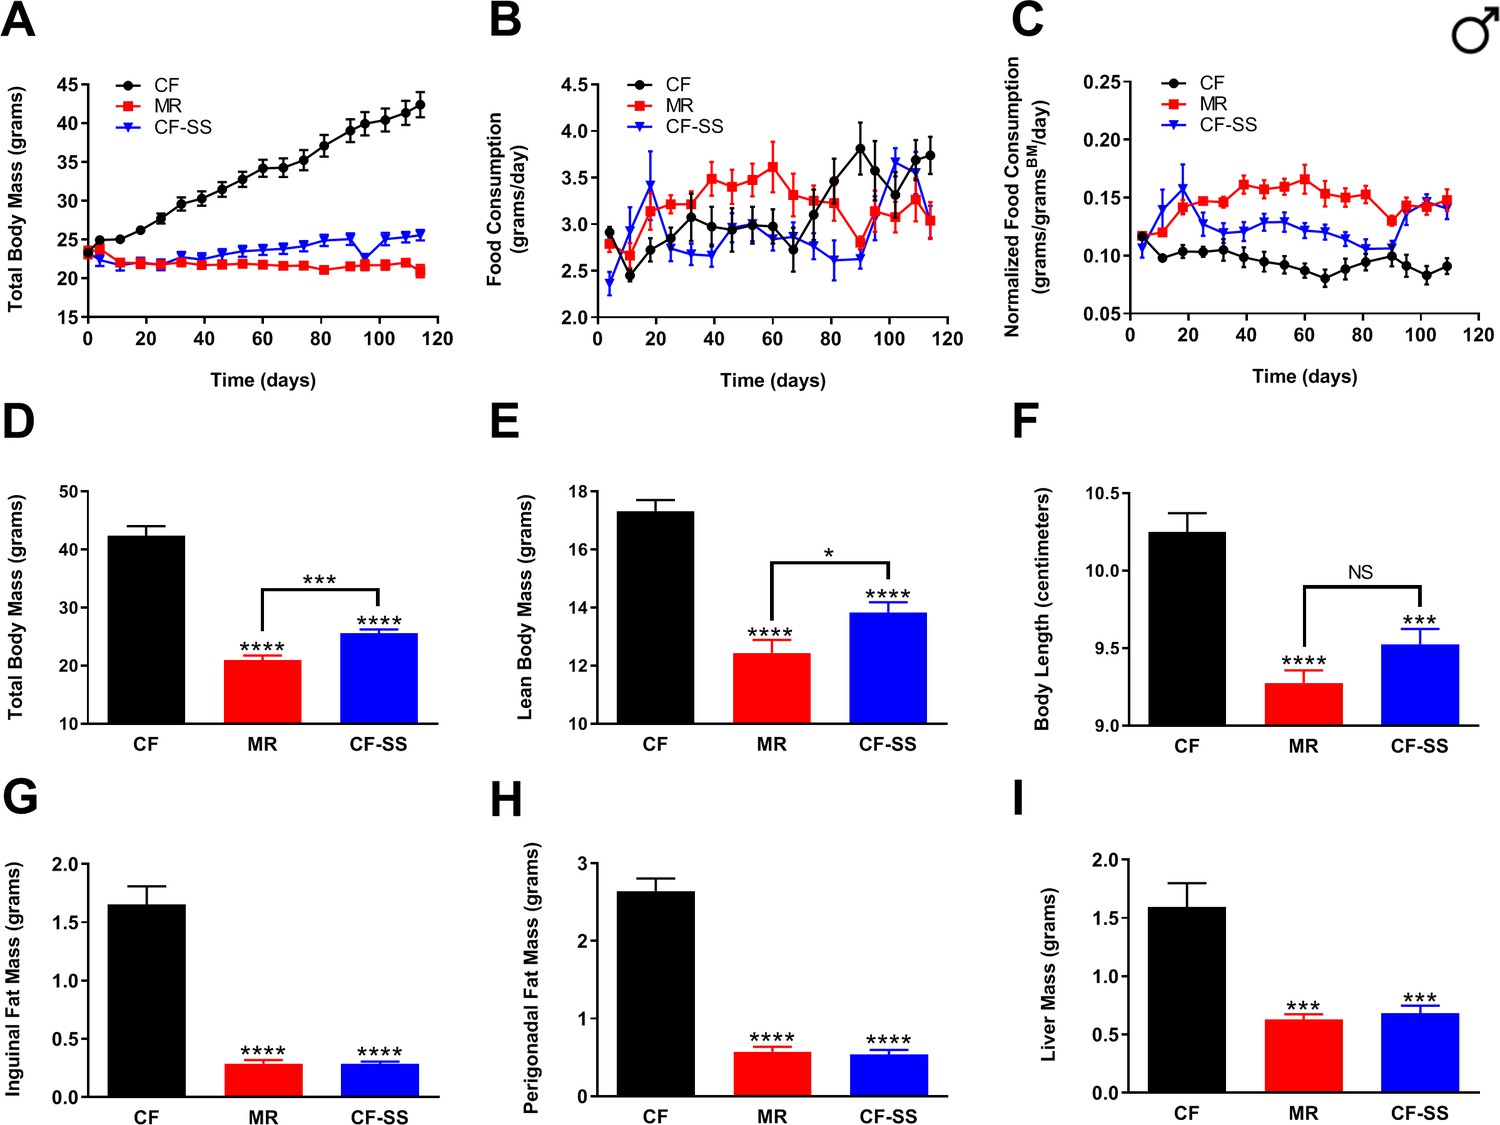
Sodium selenite supplementation protects male mice against diet-induced obesity.
Comparisons over time of average values for (A) total body mass, (B) food consumption, and (C) food consumption normalized to total body mass for control-fed (CF; black circles), methionine-restricted (MR; red squares), and sodium selenite-supplemented (CF-SS; blue triangles) male mice. Average values at conclusion of the experiment (16.3 weeks) are also shown for (D) total body mass, (E) lean body mass, (F) body length, (G) mass of inguinal fat pads, (H) mass of perigonadal fat pads, and (I) liver mass for all feeding conditions. For all panels, bars denote standard error of the mean (SEM). For panels D–I, statistically significant differences (as compared with the corresponding CF values) are indicated (***p<0.001; ****p<0.0001). N = 8 for all groups.
Figure 1—figure supplement 1
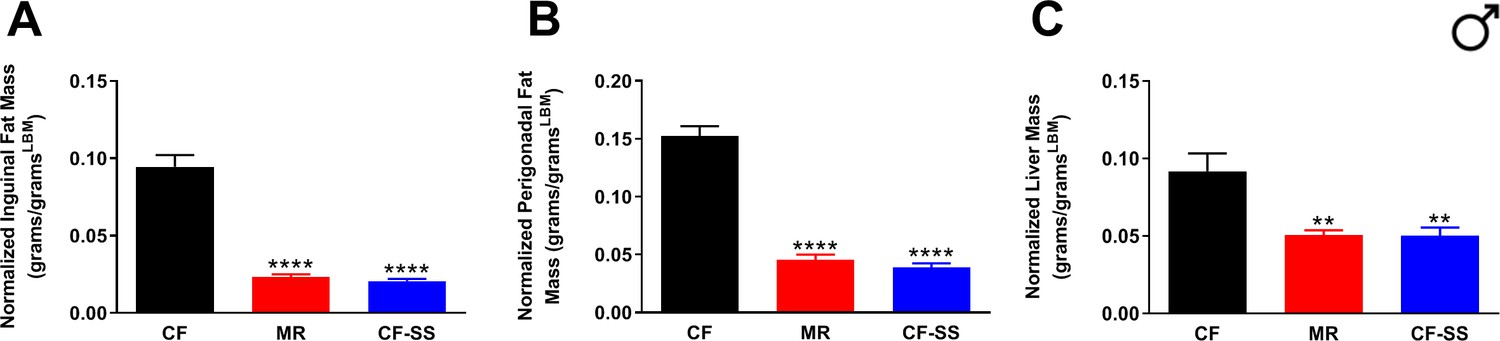
Fat depot and liver sizes normalized to lean body mass for sodium selenite-supplemented male mice.
Normalized values at conclusion of the experiments are shown for (A) mass of inguinal fat pads, (B) mass of perigonadal fat pads, and (C) liver mass for male mice that were control-fed (CF), methionine-restricted (MR), or sodium selenite-supplemented (CF-SS). Bars denote standard error of the mean (SEM). Statistically significant differences (as compared with the corresponding CF values) are indicated (**p<0.01; ****p<0.0001). N = 8 for all groups.
Figure 2 with 1 supplement
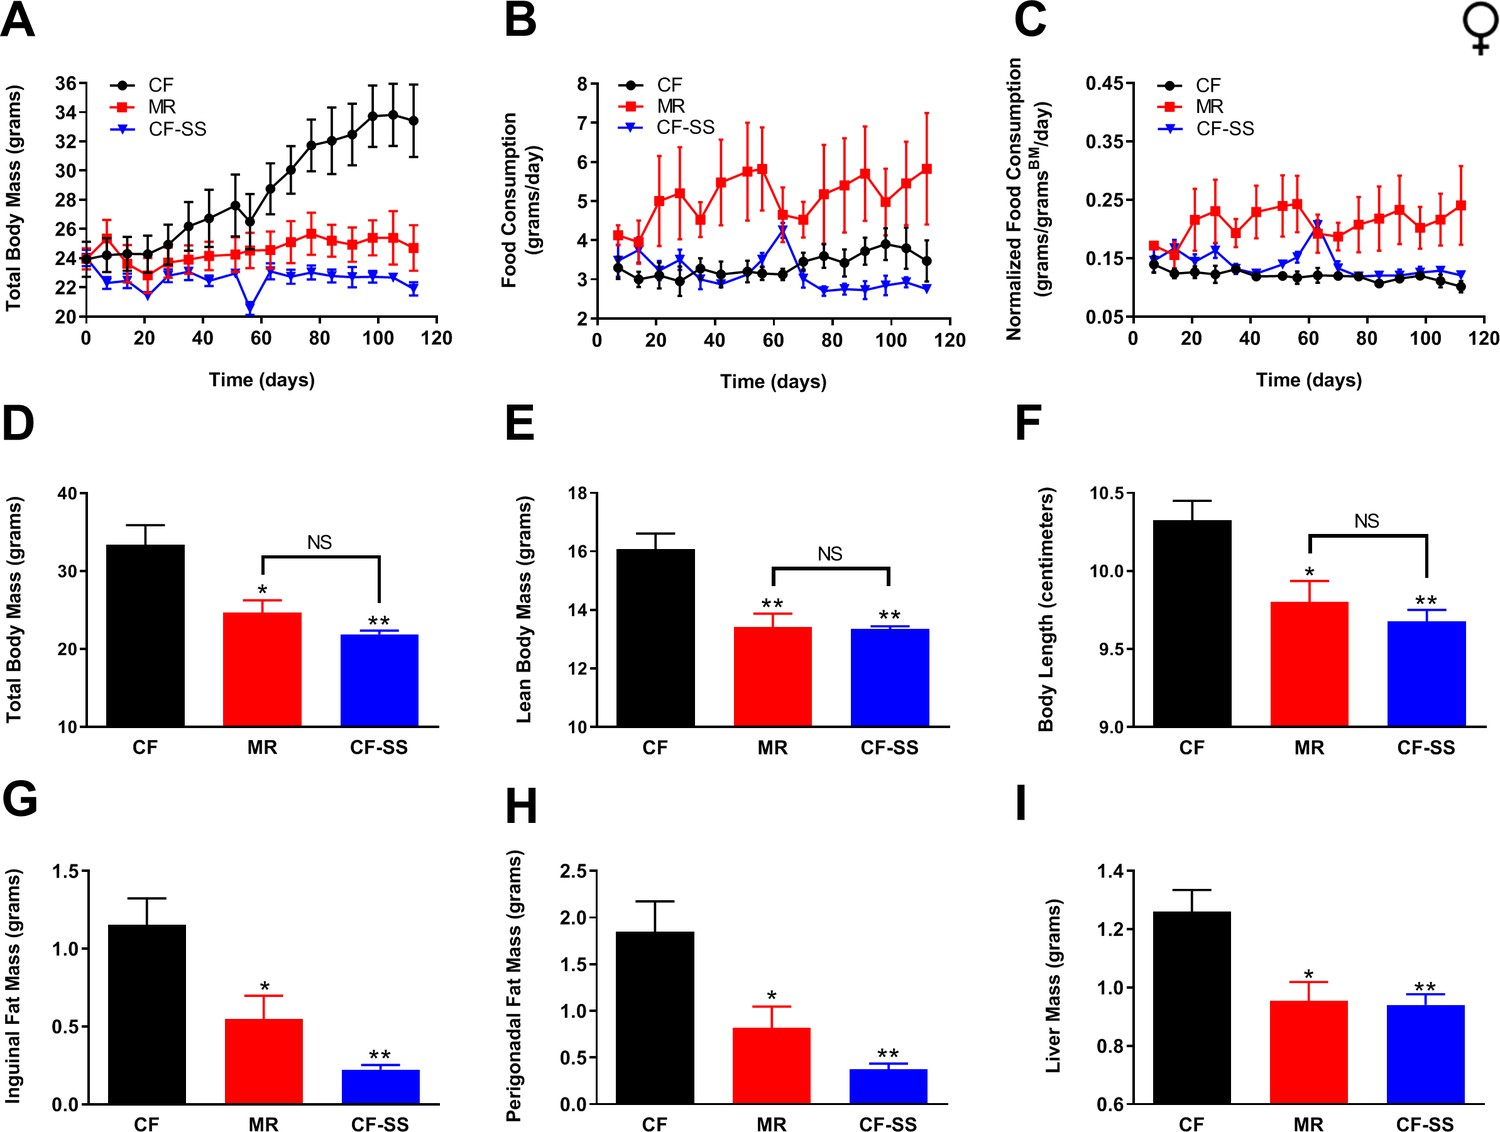
Sodium selenite supplementation protects female mice against diet-induced obesity.
Comparisons over time of average values for (A) total body mass, (B) food consumption, and (C) food consumption normalized to total body mass for control-fed (CF; black circles), methionine-restricted (MR; red squares), and sodium selenite-supplemented (CF-SS; blue triangles) female mice. Average values at conclusion of the experiment (16 weeks) are also shown for (D) total body mass, (E) lean body mass, (F) body length, (G) mass of inguinal fat pads, (H) mass of perigonadal fat pads, and (I) liver mass for all feeding conditions. For all panels, bars denote SEM. For panels D–I, statistically significant differences (as compared with the corresponding CF values) are indicated (*p<0.05; **p<0.01). N = 4 for all groups.
Figure 2—figure supplement 1
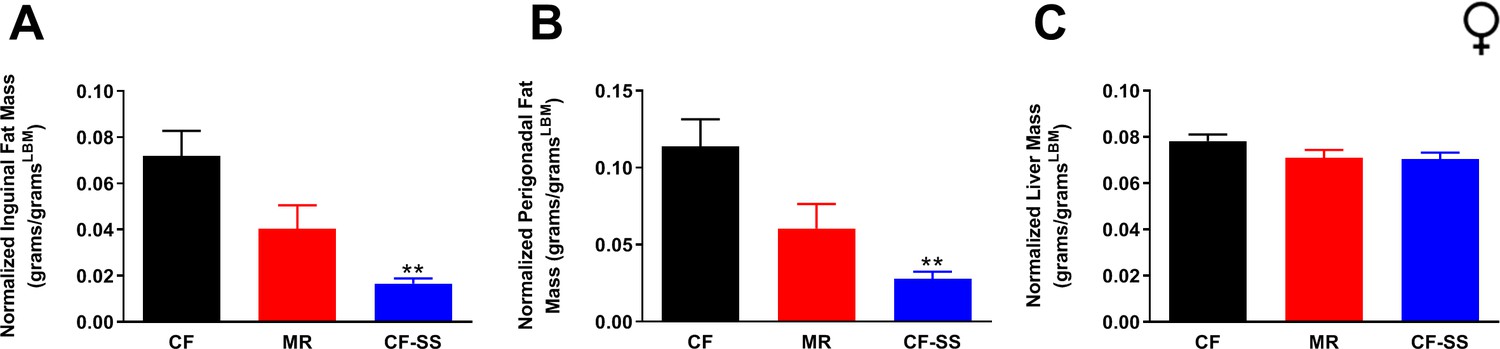
Fat depot and liver sizes normalized to lean body mass for sodium selenite-supplemented female mice.
Normalized values at conclusion of the experiments are shown for (A) mass of inguinal fat pads, (B) mass of perigonadal fat pads, and (C) liver mass for female mice that were control-fed (CF), methionine-restricted (MR), or sodium selenite-supplemented (CF-SS). Bars denote standard error of the mean (SEM). Statistically significant differences (as compared with the corresponding CF values) are indicated (**p<0.01). N = 4 for all groups.
Figure 3
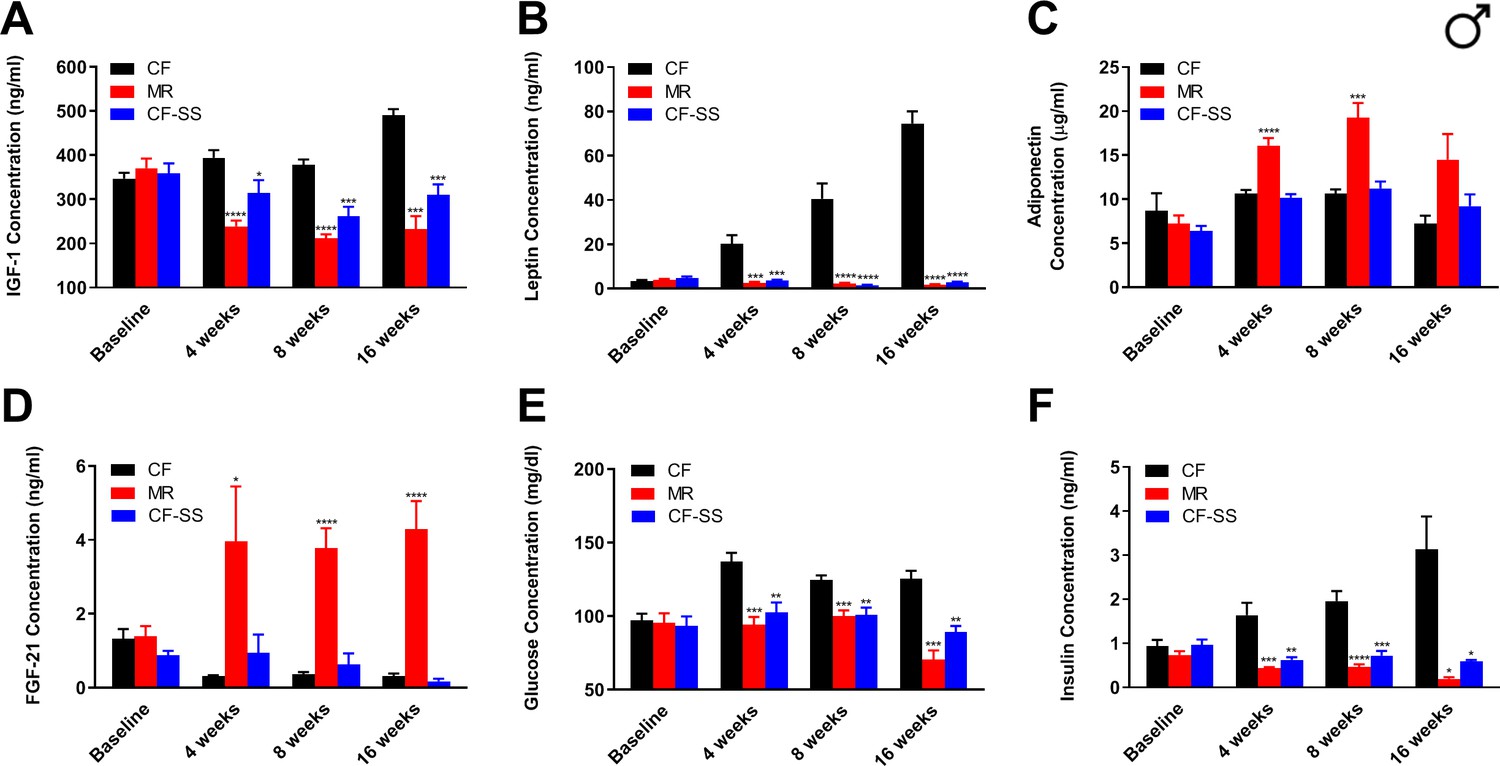
Sodium selenite supplementation decreases IGF-1 levels in male mice and results in beneficial plasma hormone and chemical changes typically associated with MR.
Longitudinal comparisons of the plasma concentrations of (A) IGF-1, (B) leptin, (C) FGF-21, (D) adiponectin, (E) glucose, and (F) insulin for control-fed (CF), methionine-restricted (MR), and sodium selenite-supplemented (CF-SS) male mice. Bars denote SEM. Statistically significant differences (as compared with the corresponding CF values) are indicated (*p<0.05; **p<0.01; ***p<0.001; ****p<0.0001). N = 8 for all groups.
Figure 4 with 1 supplement
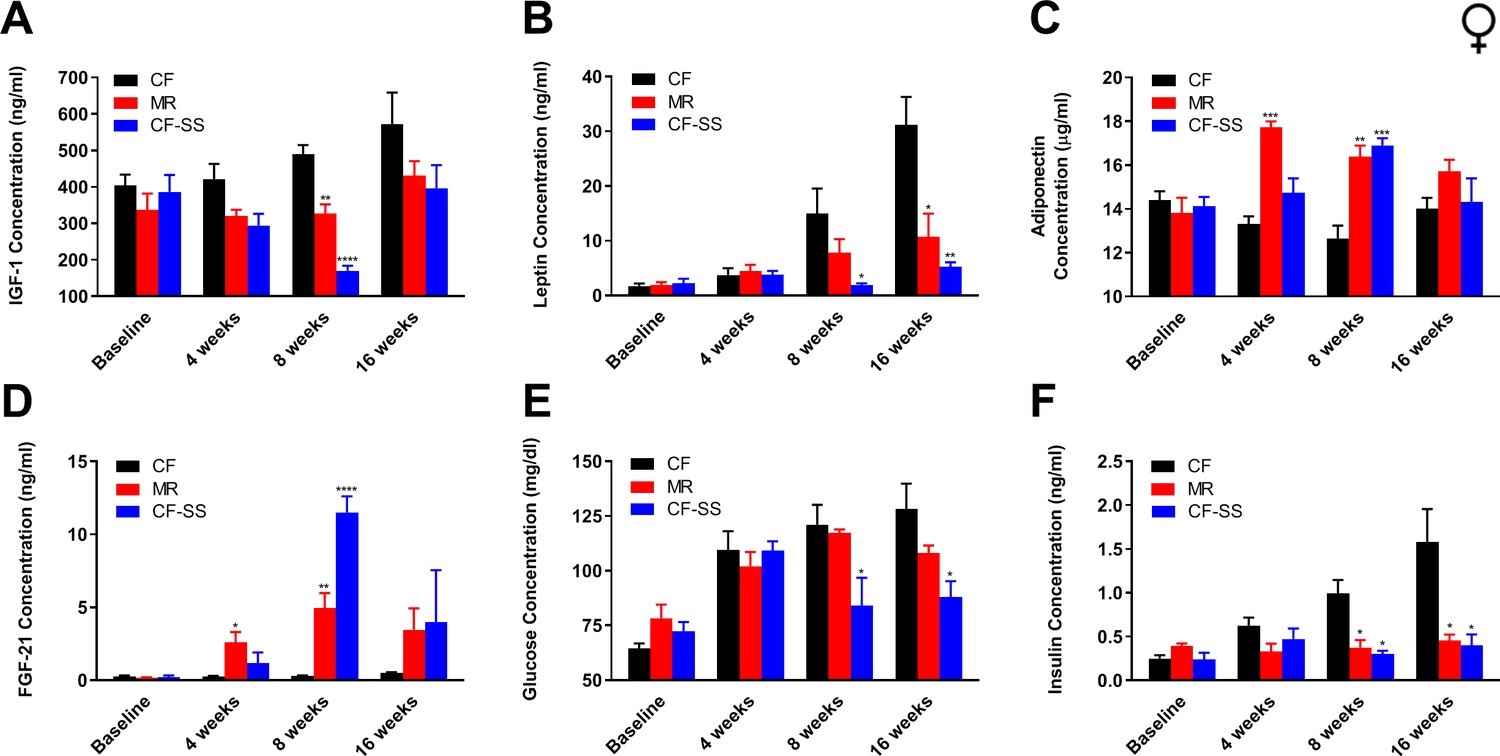
Sodium selenite supplementation decreases IGF-1 levels in female mice and results in beneficial plasma hormone and chemical changes typically associated with MR.
Longitudinal comparisons of the plasma concentrations of (A) IGF-1, (B) leptin, (C) FGF-21, (D) adiponectin, (E) glucose, and (F) insulin for control-fed (CF), methionine-restricted (MR), and sodium selenite-supplemented (CF-SS) female mice. Bars denote SEM. Statistically significant differences (as compared with the corresponding CF values) are indicated (*p<0.05; **p<0.01; ***p<0.001; ****p<0.0001). N = 4 for all groups.
Figure 4—figure supplement 1
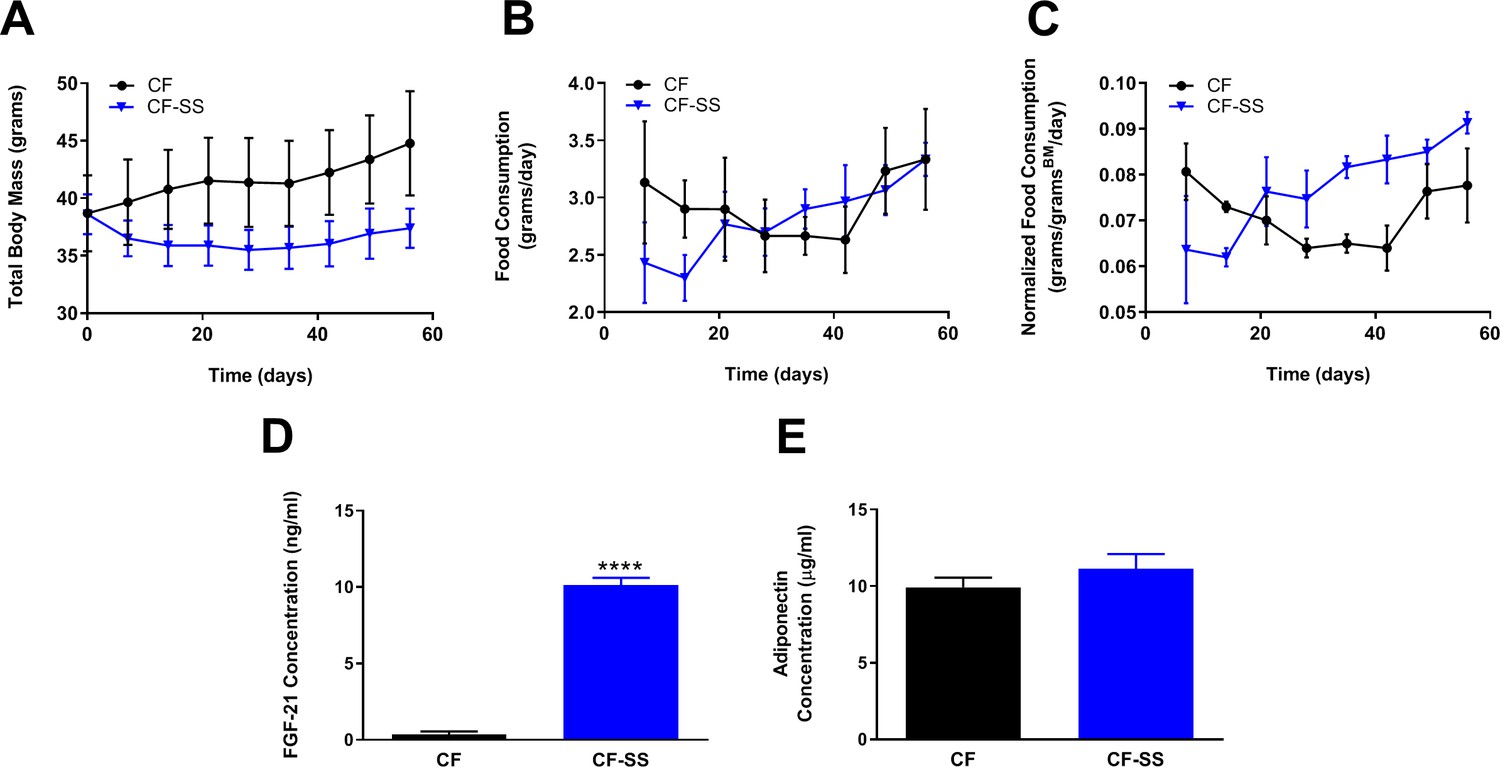
Sodium selenite supplementation-mediated increases in circulating FGF-21 levels are age-dependent.
Comparisons over time of average values for (A) total body mass, (B) food consumption, and (C) food consumption normalized to total body mass for control-fed (CF; black circles) and sodium selenite-supplemented (CF-SS; blue triangles) adult male mice (8 months old). Also shown are the plasma concentrations of (D) FGF-21 and (E) adiponectin for control-fed and sodium selenite-supplemented male mice at the conclusion of the experiment (8 weeks). For all panels, bars denote SEM. For panel D, the difference depicted is statistically significant (****p<0.0001), whereas no change in FGF-21 levels was observed for young male mice (2 months old; see Figure 3). In addition, sodium selenite supplementation fails to produce a significant difference in the plasma levels of adiponectin in adult male mice (panel E). N = 3 for both groups.
Figure 5
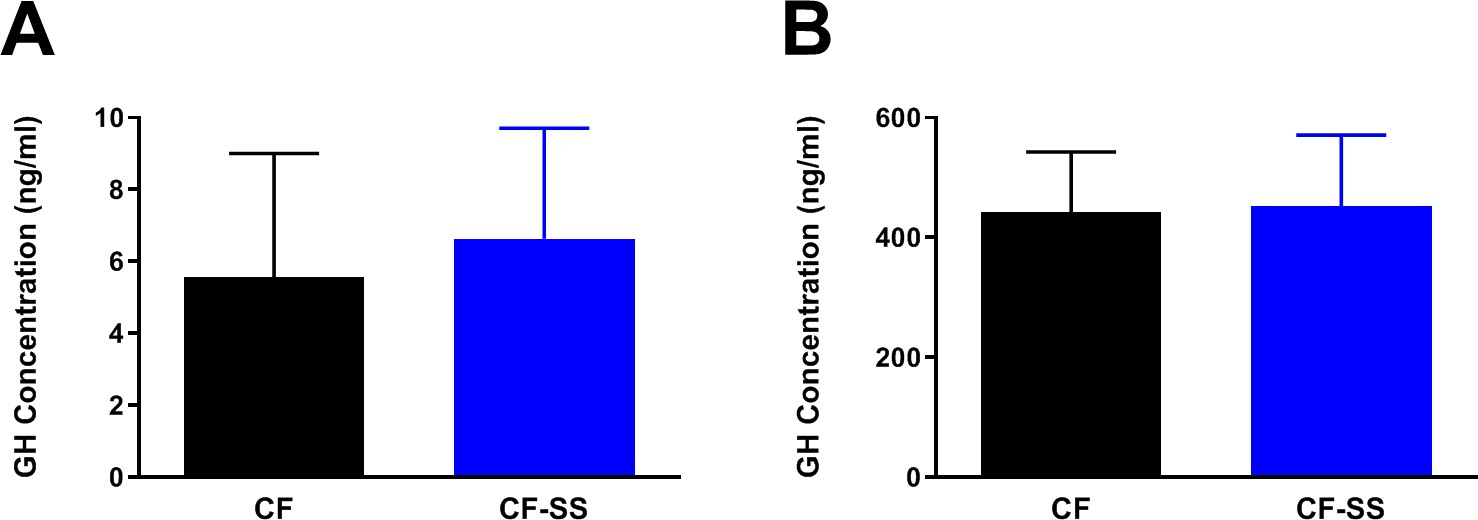
Sodium selenite supplementation is not associated with changes in plasma GH levels in male mice.
Shown are comparisons of the plasma concentrations of GH in (A) male mice fed for 16 weeks with either the control diet (CF) or a diet containing sodium selenite (CF-SS) or (B) male mice fed these diets for 4 weeks and following injection with GH-releasing peptide 2 (GHRP-2) to achieve maximum circulating levels of GH. Bars denote SEM. There are no significant differences in GH levels between the two groups. For panel A, n = 8 for both groups. For panel B, n = 9 for both groups.
Figure 6

Selenium supplementation using an organoselenium compound confers a dose-dependent partial protection against diet-induced obesity to male mice.
Comparisons over time of average values for (A) total body mass, (B) food consumption, and (C) food consumption normalized to total body mass for control-fed (CF; black circles) and moderately selenomethionine-supplemented (CF-SM; light blue triangles) male mice, as well as mice fed a slightly higher amount of selenomethionine (CF-SM 2×; dark blue squares). Average values at conclusion of the experiment (13.3 weeks) are also shown for (D) total body mass, (E) lean body mass, (F) body length, (G) mass of inguinal fat pads, (H) mass of perigonadal fat pads, and (I) liver mass for all feeding conditions. For all panels, bars denote SEM. For panels D–I, statistically significant differences (as compared with the corresponding CF values) are indicated (*p<0.05; **p<0.01). N = 8 for all groups.
Figure 7
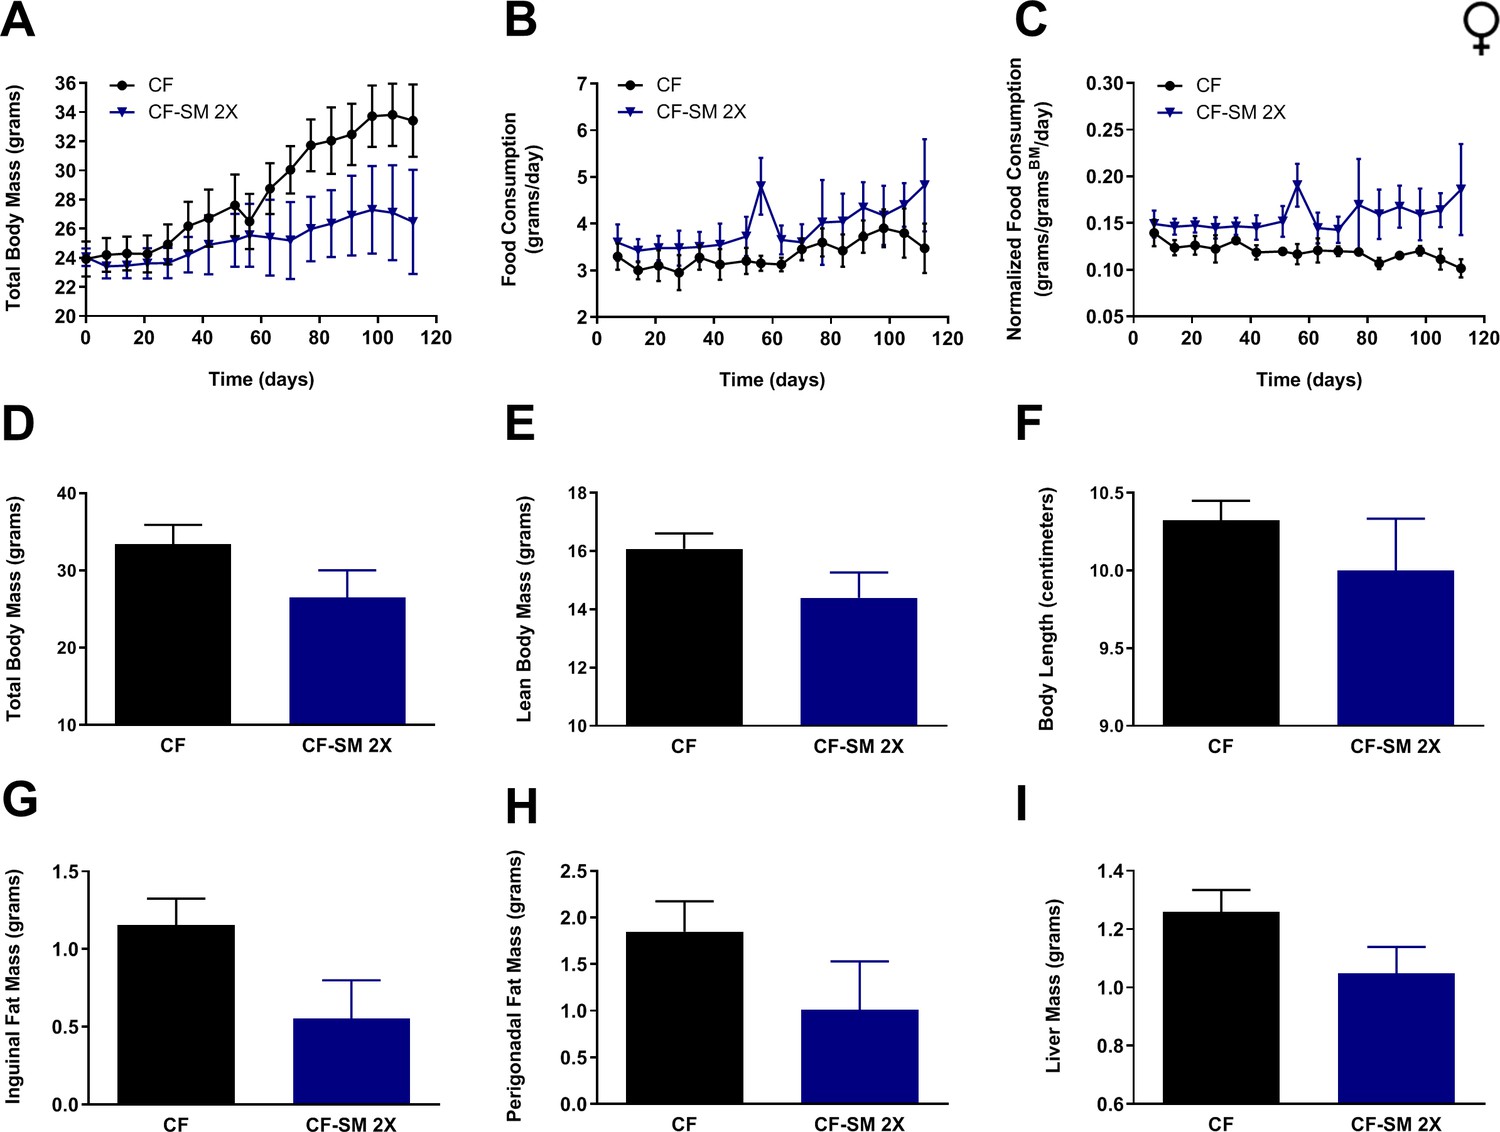
Selenium supplementation using an organoselenium compound confers partial protection against diet-induced obesity to female mice.
Comparisons over time of average values for (A) total body mass, (B) food consumption, and (C) food consumption normalized to total body mass for control-fed (CF; black circles) female mice, as well as mice fed the higher of two amounts of selenomethionine used for these studies (CF-SM 2×; dark blue triangles). Average values at conclusion of the experiment (16 weeks) are also shown for (D) total body mass, (E) lean body mass, (F) body length, (G) mass of inguinal fat pads, (H) mass of perigonadal fat pads, and (I) liver mass for all feeding conditions. For all panels, bars denote standard error of the mean (SEM). N = 4 for all groups.
Figure 8
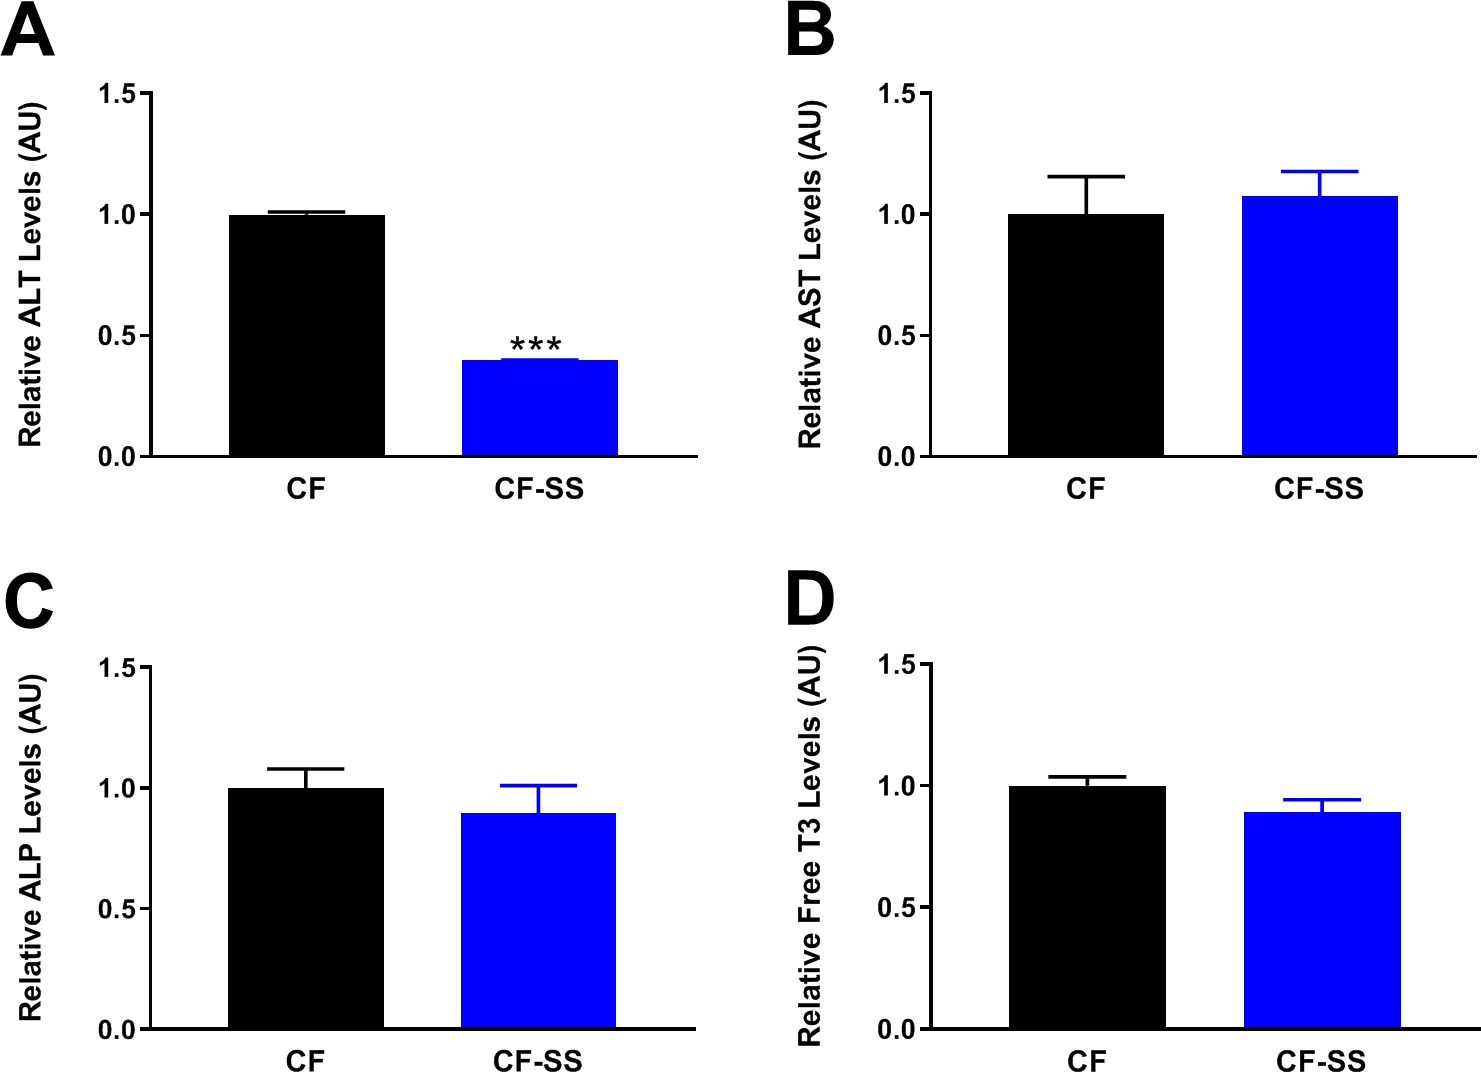
Long-term consumption of the sodium selenite-containing diet is not toxic to mice.
Shown are the results of a toxicology panel comprising the relative plasma levels of liver enzymes (A) ALT, (B) AST, and (C) ALP, as well as the relative plasma levels of free triiodothyronine (T3; D). For the liver enzymes, values are shown for male mice fed for 16 weeks with either the control diet (CF) or a diet containing sodium selenite (CF-SS). Free T3 levels were assessed in the same animals fed the indicated diets for 25 weeks. Bars denote SEM. Statistically significant differences (as compared with the corresponding CF values) are indicated (***p<0.001). For selenium-supplemented animals, the plasma levels of ALT, AST, ALP, and free T3 are either the same as those of control-fed littermates (AST, ALP, and free T3), or lower (ALT), indicating that the sodium selenite-containing diet is not toxic to mice. N ≥ 8 for all groups.
Figure 9 with 1 supplement

Selenium supplementation extends yeast lifespan, with chronological lifespan extension being dependent on mitophagy and Alt1 transaminase activity.
Survival curves are shown for experiments assessing the effects of selenium supplementation on yeast chronological lifespan (A, C–E) and replicative lifespan (B). The presence of selenomethionine (SM) extends the chronological lifespan (A) and replicative lifespan (B) of wild-type yeast as compared with controls. Both the core mitophagy factor Atg32 (C) and the Alt1 transaminase (D) are required for the full extension of yeast chronological lifespan by selenium supplementation. In contrast, the Alt1 transaminase is dispensable for the extension of chronological lifespan by methionine restriction (E). Bars denote SEM.
Figure 9—figure supplement 1

Selenium supplementation decreases yeast histone deacetylase activity.
Shown are the relative levels of HDAC activity present in wild-type yeast incubated with selenomethionine (SM), the HDAC inhibitors trichostatin A (TSA) and sodium butyrate (BUT), as well as untreated controls. Also shown are the levels of HDAC activity present in otherwise wild-type cells lacking the Alt1 transaminase, both in the absence (alt1Δ) and presence (alt1Δ + SM) of selenomethionine. Cells used for these analyses were harvested after either 5 hr or 72 hr of treatment, as indicated. At the latter time-point, selenium supplementation causes an approximately 50% reduction in HDAC activity as compared with untreated cells, and this decrease is dependent on the presence of Alt1. Bars denote SEM. Statistically significant differences (as compared with the corresponding control values) are indicated (*p<0.05). N = 2 for all groups.
Tables
Key resources table
| Reagent type (species) or resource | Designation | Source or reference | Identifiers | Additional information |
|---|---|---|---|---|
| Gene (S. cerevisiae) | ATG32 | Saccharomyces Genome Database | SGD:S000001408 | |
| Gene (S. cerevisiae) | ALT1 | Saccharomyces Genome Database | SGD:S000004079 | |
| Gene (S. cerevisiae) | MET15 | Saccharomyces Genome Database | SGD:S000004294 | |
| Genetic reagent (M. musculus) | C57BL/6J | Jackson Laboratory | Stock No:000664 | |
| Commercial assay or kit | IGF-1 Quantikine ELISA kit | R&D Systems | Cat. No:MG100 | |
| Commercial assay or kit | Adiponectin Quantikine ELISA kit | R&D Systems | Cat. No:MRP300 | |
| Commercial assay or kit | Leptin Quantikine ELISA kit | R&D Systems | Cat. No:MOB00B | |
| Commercial assay or kit | FGF-21 ELISA kit | Millipore Corp. | Cat. No:EZRMFGF21-26K | |
| Commercial assay or kit | GH ELISA kit | Millipore Corp. | Cat. No:EZRMGH-45K | |
| Commercial assay or kit | Insulin ELISA kit | ALPCO Diagnostics | Cat. No:80-INSMS-E01 | |
| Commercial assay or kit | ALT activity assay kit | Sigma-Aldrich | Cat. No:MAK052 | |
| Commercial assay or kit | AST activity assay kit | Sigma-Aldrich | Cat. No:MAK055 | |
| Commercial assay or kit | Alkaline phosphatase detection kit | Sigma-Aldrich | Cat. No:APF | |
| Commercial assay or kit | Free T3 AccuBind ELISA kit | Monobind, Inc | Cat. No:1325–300 | |
| Commercial assay or kit | HDAC assay kit | Sigma-Aldrich | Cat. No:CS1010 | |
| Peptide, recombinant protein | GHRP-2 | Sigma-Aldrich | Cat. No:SML2056 | |
| Chemical compound, drug | Sodium selenite | Sigma-Aldrich | Cat. No:71950 | |
| Chemical compound, drug | Seleno-L-methionine | Sigma-Aldrich | Cat. No:S3132 | |
| Chemical compound, drug | Trichostatin A | Sigma-Aldrich | Cat. No:T1952 | |
| Chemical compound, drug | Sodium butyrate | Sigma-Aldrich | Cat. No:303410 | |
| Software, algorithm | GraphPad Prism | GraphPad Software | RRID:SCR_002798 | Version 8.0.0 |
Additional files
-
Supplementary file 1
Composition of mouse high-fat diets.
- https://cdn.elifesciences.org/articles/62483/elife-62483-supp1-v2.xlsx
-
Transparent reporting form
- https://cdn.elifesciences.org/articles/62483/elife-62483-transrepform-v2.pdf
Download links
A two-part list of links to download the article, or parts of the article, in various formats.
Downloads (link to download the article as PDF)
Open citations (links to open the citations from this article in various online reference manager services)
Cite this article (links to download the citations from this article in formats compatible with various reference manager tools)
Selenium supplementation inhibits IGF-1 signaling and confers methionine restriction-like healthspan benefits to mice
eLife 10:e62483.
https://doi.org/10.7554/eLife.62483


