Molecular mechanism for direct actin force-sensing by α-catenin
- Laboratory of Structural Biophysics and Mechanobiology, The Rockefeller University, United States
- Tri-Institutional PhD Program in Chemical Biology, The Rockefeller University, United States
- Laboratory of Nanoscale Biophysics and Biochemistry, The Rockefeller University, United States
Figures
Figure 1 with 2 supplements
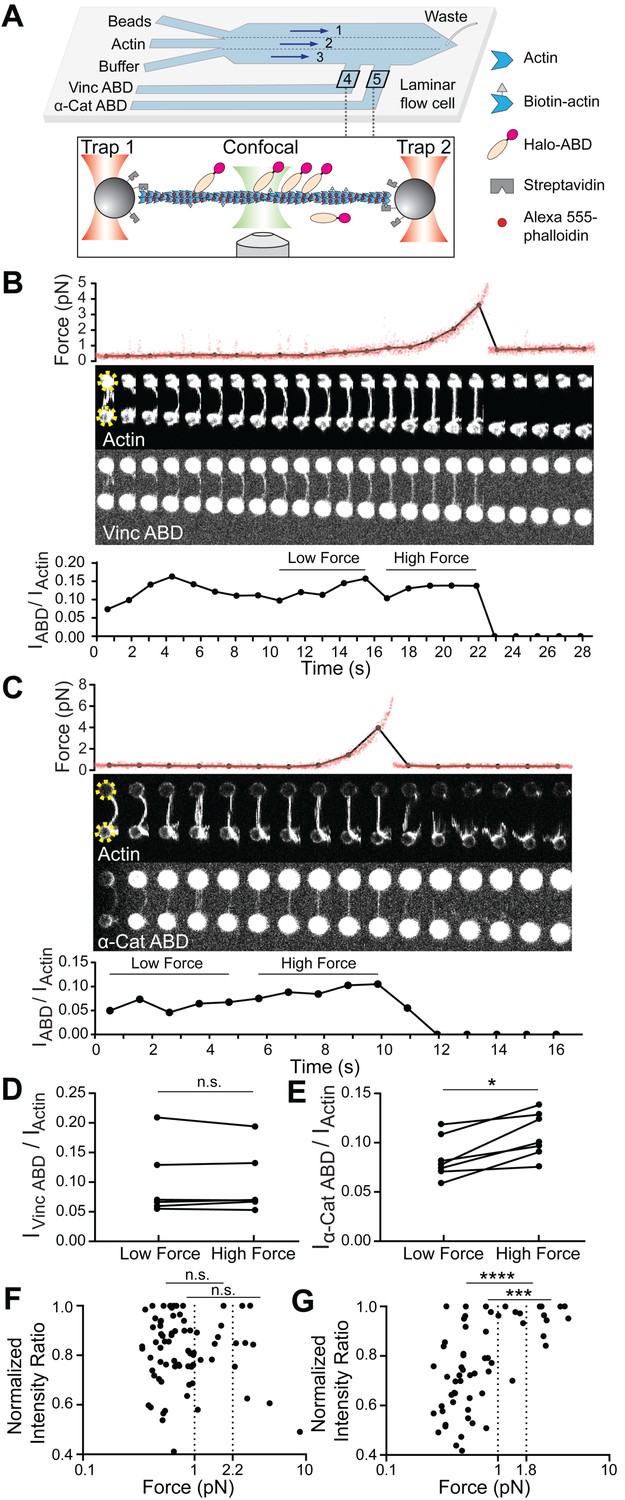
Piconewton load across individual filaments activates α-catenin binding, while vinculin is force insensitive.
(A) Top: Geometry of the microfluidic chamber. Bottom: Cartoon of correlative single-filament force and fluorescence assay. (B and C) Representative single-filament constant velocity pulling experiments (0.1 µm/s) for vinculin ABD (B) and α-catenin ABD (C). Top: Force versus time plot. Red dots, raw data; black dots, force values binned to an interval of confocal frames. Middle: Montage of confocal frames of actin and ABD channels. Positions of beads are indicated with yellow circles (diameter, 4 μm). Bottom: IABD/Iactin ratio versus time plot. High-force: Average of five intensity ratios before actin breakage; low-force: average of five intensity ratios immediately before high-force average. Concentration of vinculin ABD or α-catenin ABD: 2 μM. (D and E) Paired analysis of low-force and high-force averages across trials for vinculin ABD (D) (N = 6, p=0.84) and α-catenin ABD (E) (N = 7, p=0.0156). Wilcoxon signed-rank test: *p<0.05; n.s. (not significant), p>0.05. (F and G) Scatter plots of normalized fluorescence ratios versus force. Statistical comparisons are between intensity ratios divided into two bins: force below and above 1 pN or 2.2 pN (dotted lines) for vinculin ABD (F) (1 pN: below: n = 62, above: n = 20, p=0.65; 2.2 pN: below: n = 72, above: n = 10, p=0.74), and force below and above 1 pN or 1.8 pN (dotted lines) for α-catenin ABD (G) (1pN: below: n = 53, above: n = 15, p<0.0001; 1.8 pN: below: n = 59, above: n = 9, p=0.0002). KS test: ****p<0.0001; ***p<0.001; n.s., p>0.05.
Figure 1—figure supplement 1
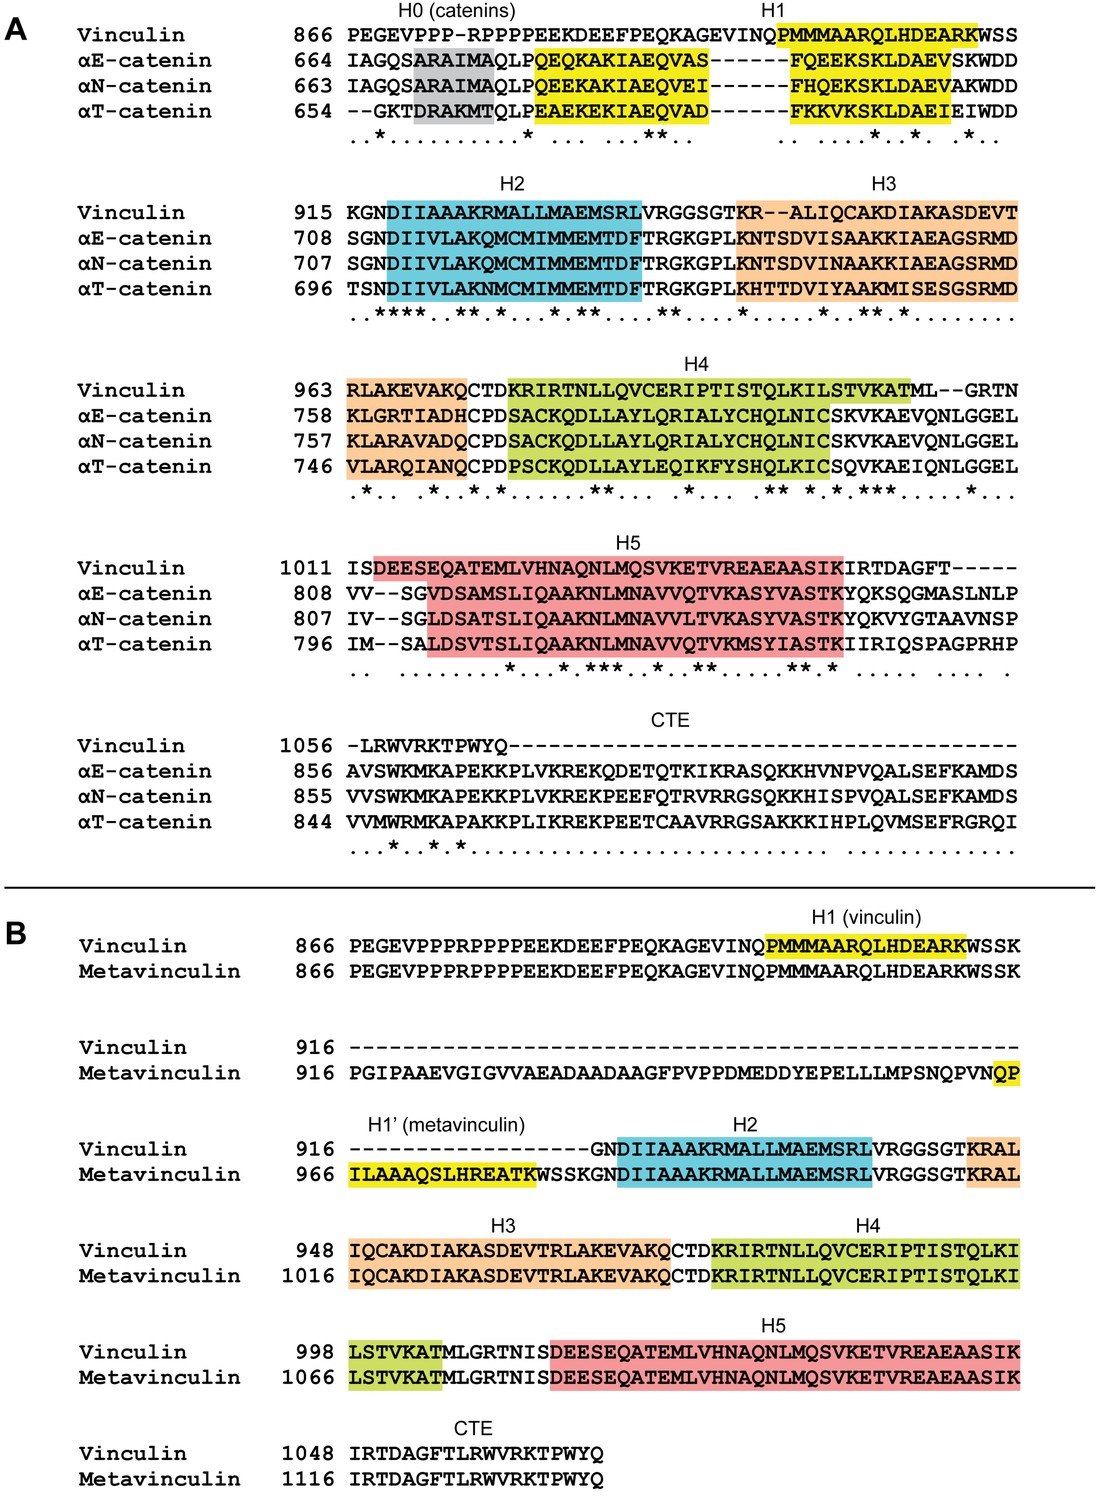
Multiple sequence alignments of human vinculin and α-catenin isoforms.
(A) Sequence alignment (see Materials and methods) of human vinculin, αE-catenin, αN-catenin, and αT-catenin. (B) Sequence alignment of human vinculin and metavinculin.
Figure 1—figure supplement 2
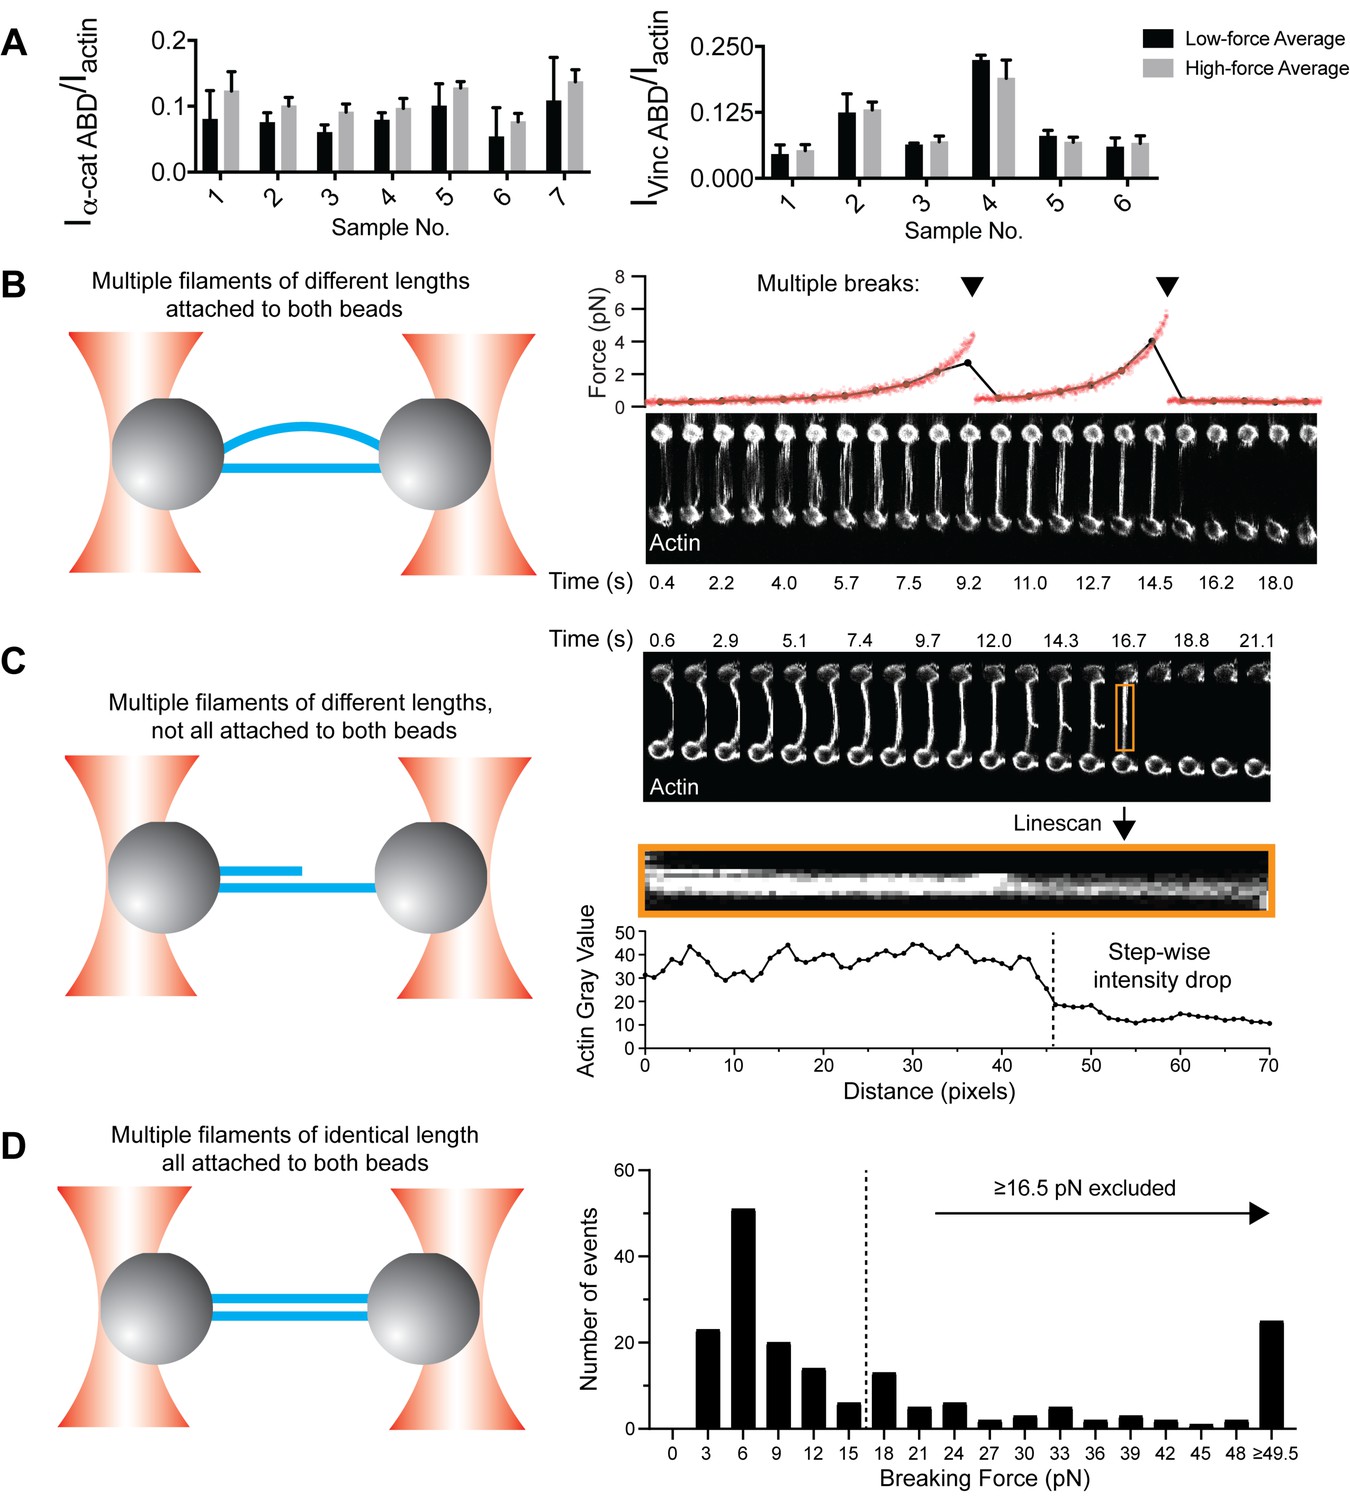
Additional analysis of single filament correlative force and fluorescence assays.
(A) Bar plots of mean ± standard deviation of high-force and low-force averages for all trials displayed in Figure 1D and E. (B–D) Single-filament analysis was achieved by excluding actin bundles from the dataset, including multiple actin filaments of different lengths attached to both beads (B); multiple actin filaments of different lengths not all attached to both beads (C); and multiple actin filaments of the same length attached to both beads (D).
Figure 2 with 9 supplements

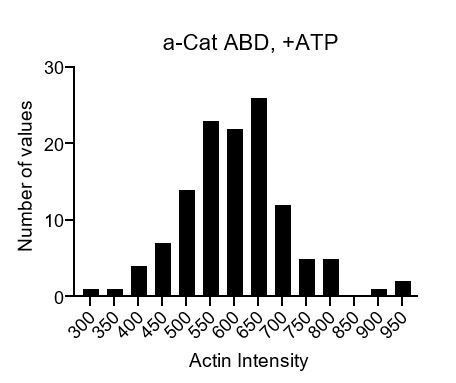
Forces generated by myosin motors activate α-catenin binding to F-actin.
(A) Cartoon of TIRF force reconstitution assay utilizing surface-anchored myosin motor proteins with opposing directionality. (B and C) TIRF assays of vinculin ABD (B) and α-catenin ABD (C). Left: Representative movie frames of actin and ABD channels in the absence (top) and presence (bottom) of ATP to activate motors. Scale bar, 20 μm. Right: Montages of individual filament regions. Scale bar, 5 μm. Concentration of vinculin ABD or α-catenin ABD: 2 μM. (D and E) Time-averaged IABD/Iactin intensity ratio distributions of filament regions before and after ATP addition for vinculin ABD (D, quantification of (B)) and α-catenin ABD (E, quantification of (C)). (F and G) Paired analysis of the overall average intensity ratio change before and after ATP addition for vinculin ABD (F) (N = 9, p=0.50) and α-catenin ABD (G) (N = 6, p=0.031). Wilcoxon signed-rank test: *p<0.05; n.s. (not significant), p>0.05.
Figure 2—figure supplement 1
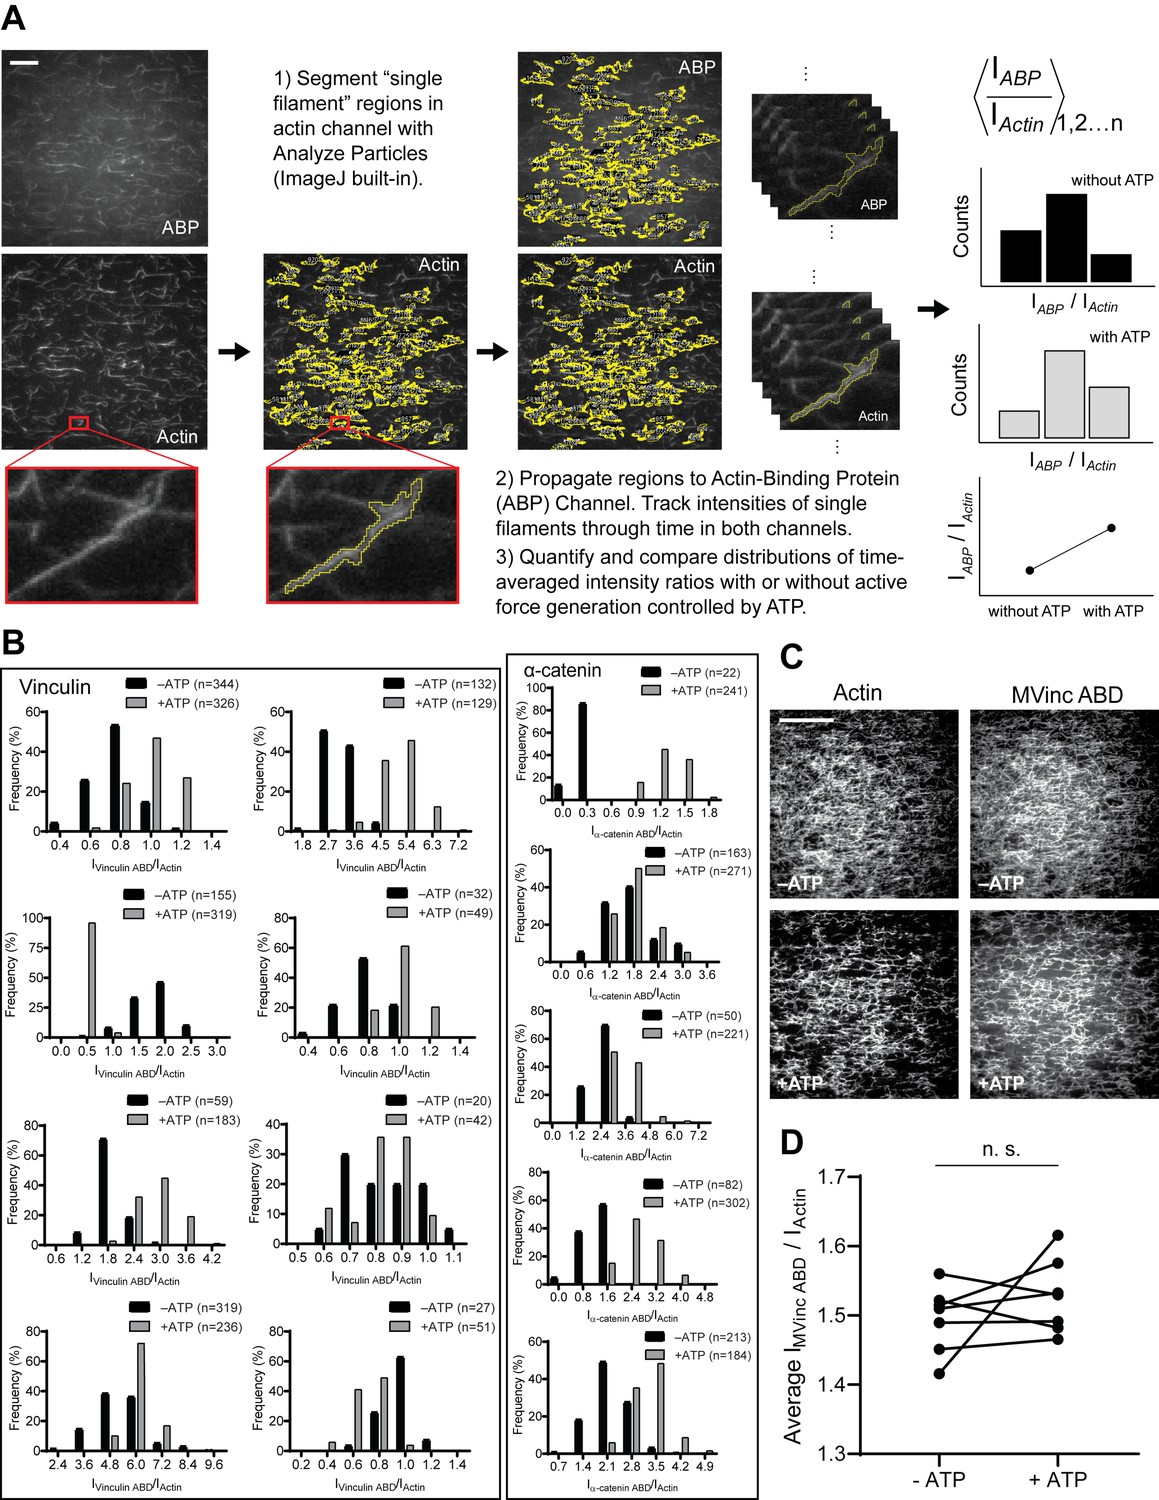
Workflow of TIRF data quantification, additional intensity ratio distributions of single-filament regions for WT α-catenin and vinculin ABDs, and TIRF assays with the metavinculin ABD.
(A) Workflow of quantifying and comparing single-filament region intensity ratios (IABD/Iactin) in the TIRF assay. Scale bar, 20 μm. (B) Time-averaged IABD/Iactin intensity ratio distributions of single-filament regions before and after ATP addition for vinculin ABD (left) and α-catenin ABD (right). Along with data presented in Figure 1D and E, these data were used in the analysis presented in Figure 1F and G. (C) Representative TIRF-assay movie frames of actin (left) and metavinculin ABD (right) channels in the absence (top) and presence (bottom) of ATP to activate motors. Scale bar, 40 μm. Concentration of metavinculin ABD: 2 μM. (D) Paired analysis of the overall average intensity ratio change before and after ATP addition for metavinculin ABD (N = 7, p=0.47). Wilcoxon signed-rank test: n.s. (not significant), p>0.05.
Figure 2—figure supplement 2
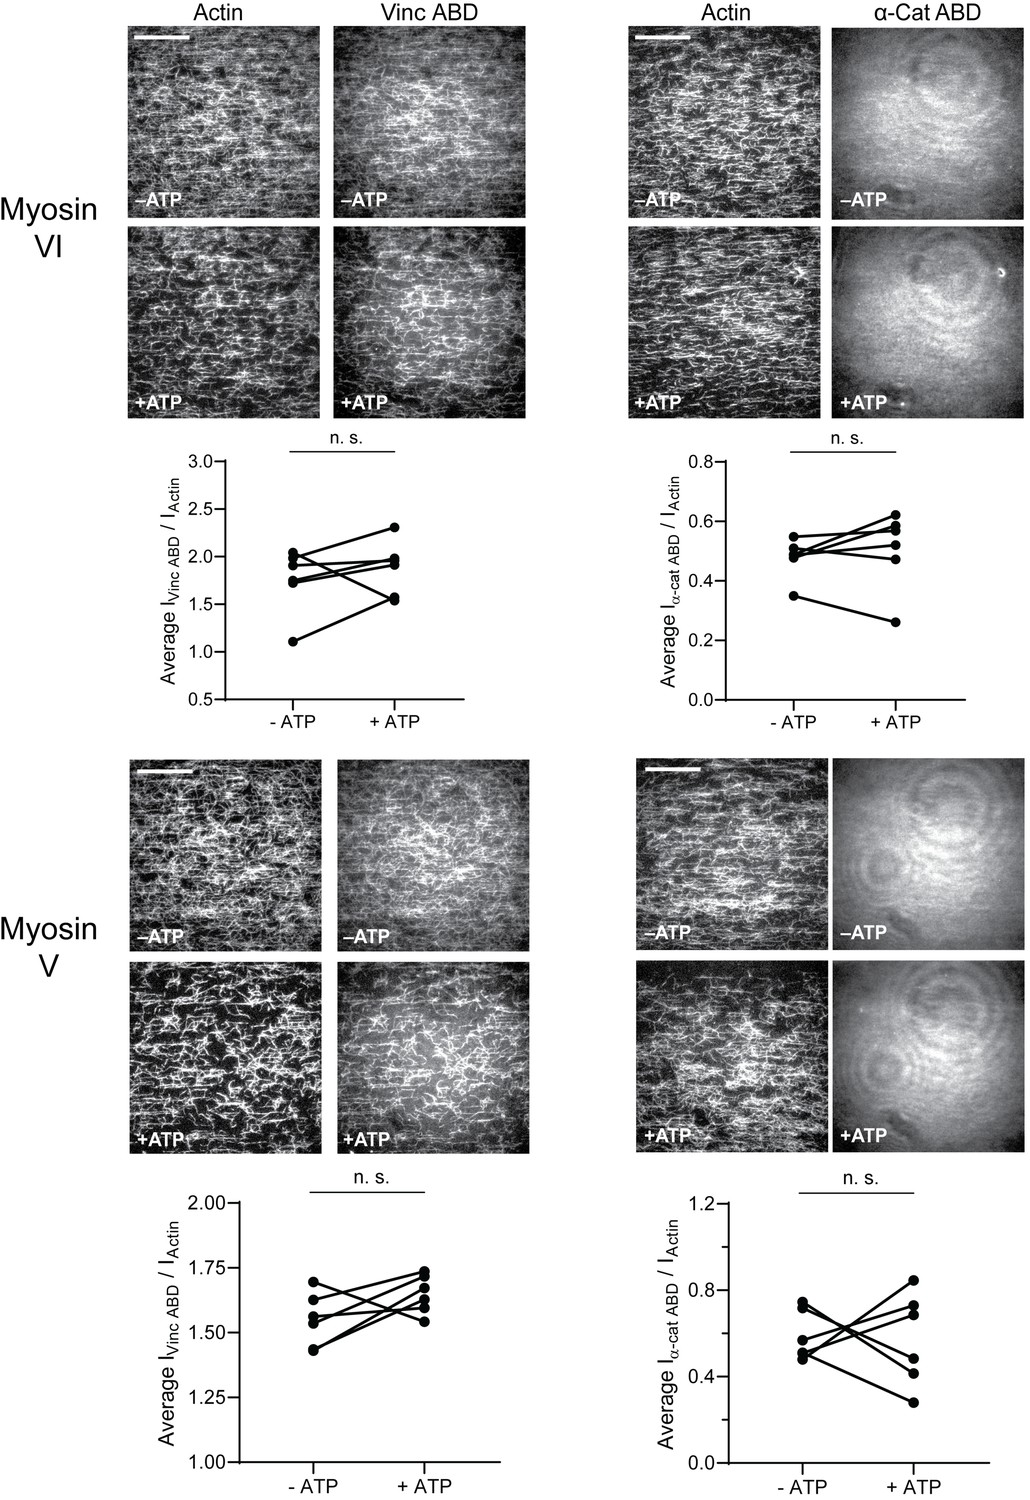
Single motors do not activate actin binding by the vinculin or α-catenin ABD.
Related to Figure 2. TIRF force reconstitution assays performed with only myosin VI (first panel) or myosin V motor (second panel). Top: Representative movie frames in the presence and absence of ATP. Scale bar, 40 μm. Bottom: Paired analysis of the overall intensity ratio changes upon ATP addition. Wilcoxon signed-rank test: n.s. (not significant), p>0.05. Constructs assayed were: vinculin ABD (myosin VI, N = 6, p=0.43); vinculin ABD (myosin V, N = 6, p=0.15); α-catenin ABD (myosin VI, N = 6, p=0.56); α-catenin ABD (myosin V, N = 6, p=0.84). Concentration of vinculin ABD or α-catenin ABD: 2 μM.
Figure 2—figure supplement 3

Additional analysis of TIRF assays.
Bar plots of mean ± SEM of high-force and low-force averages for all trials displayed in Figure 2 and its supplements.
Figure 2—video 1
TIRF force reconstitution assay of wild-type vinculin ABD.
First 100 s of representative dual-color TIRF-assay movies of actin (left) and vinculin ABD (right) in the absence (top) and presence (bottom) of ATP, as shown in Figure 2B. Scale bar, 20 µm.
Figure 2—video 2
TIRF force reconstitution assay of wild-type α-catenin ABD.
First 100 s of representative dual-color TIRF-assay movies of actin (left) and α-catenin ABD (right) in the absence (top) and presence (bottom) of ATP, as shown in Figure 2C. Scale bar, 20 µm.
Figure 2—video 3
TIRF force reconstitution assay (myosin V only) of wild-type vinculin ABD.
First 100 s of representative single-motor, dual-color TIRF-assay movies of actin (left) and vinculin ABD (right) in the absence (top) and presence (bottom) of ATP with myosin V, as shown in Figure 2—figure supplement 2. Scale bar, 20 µm.
Figure 2—video 4
TIRF force reconstitution assay (myosin V only) of wild-type α-catenin ABD.
First 100 s of representative single-motor, dual-color TIRF-assay movies of actin (left) and α-catenin ABD (right) in the absence (top) and presence (bottom) of ATP with myosin V, as shown in Figure 2—figure supplement 2. Scale bar, 20 µm.
Figure 2—video 5
TIRF force reconstitution assay (myosin VI only) of wild-type vinculin ABD.
First 100 s of representative single-motor, dual-color TIRF-assay movies of actin (left) and vinculin ABD (right) in the absence (top) and presence (bottom) of ATP with myosin VI, as shown in Figure 2—figure supplement 2. Scale bar, 20 µm.
Figure 2—video 6
TIRF force reconstitution assay (myosin VI only) of wild-type α-catenin ABD.
First 100 s of representative single-motor, dual-color TIRF-assay movies of actin (left) and α-catenin ABD (right) in the absence (top) and presence (bottom) of ATP with myosin VI, as shown in Figure 2—figure supplement 2. Scale bar, 20 µm.
Figure 3 with 1 supplement

Cryo-EM structures of metavinculin and α-catenin–F-actin complexes.
(A) Representative cryo-EM micrographs of F-actin decorated with metavinculin ABD (top) and α-catenin ABD (bottom). Scale bars, 100 nm. (B) Segmented regions of reconstructed density maps of F-actin decorated with metavinculin ABD (left) and α-catenin ABD (right), colored as indicated. (C) Overlay of the metavinculin ABD-actin complex and α-catenin ABD-actin complex atomic models, superimposed on actin and colored as in (B). Actin subunits from the α-catenin structure are displayed in varying shades.
Figure 3—figure supplement 1
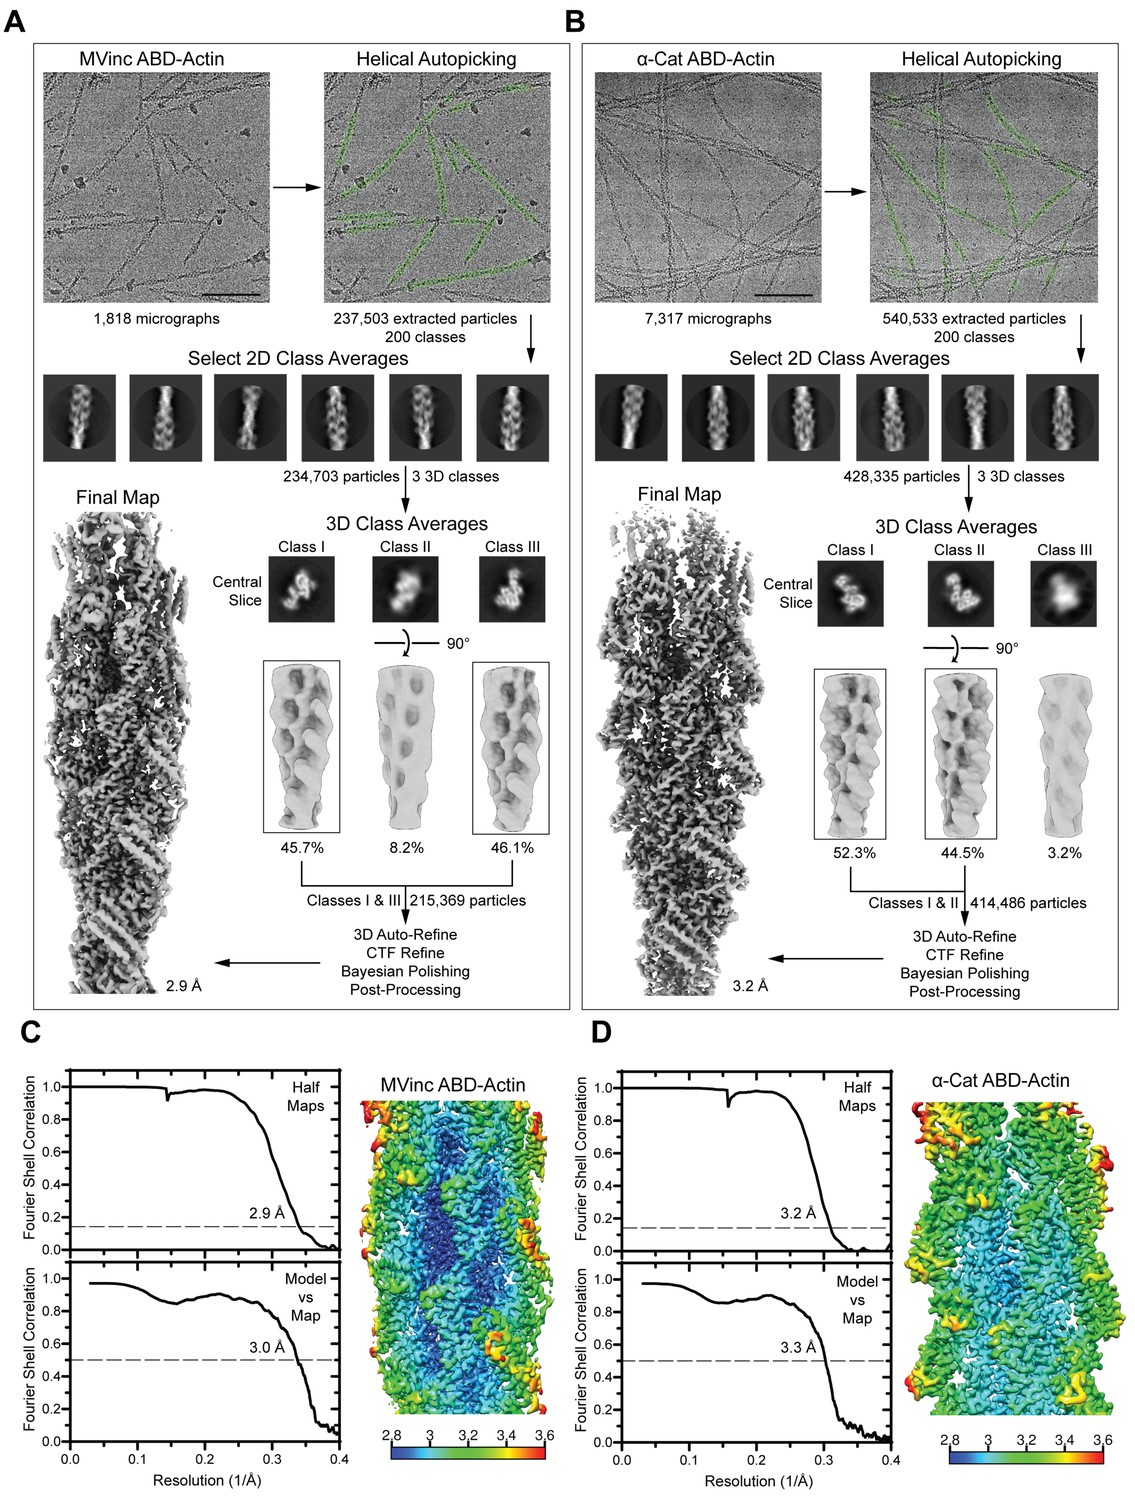
Cryo-EM data processing workflow and 3D reconstruction analysis.
(A and B) Cryo-EM processing workflow for metavinculin ABD–F-actin complex (A) and α-catenin ABD–F-actin complex (B) datasets. Scale bars, 100 nm. (C and D) Left: Gold-standard Fourier Shell Correlation (FSC) between independent half maps (top, FSC 0.143) and FSC between map and model (bottom, FSC 0.5). Right: Reconstruction colored by local resolution for metavinculin ABD–F-actin reconstruction (C) and α-catenin ABD–F-actin reconstruction (D).
Figure 4 with 3 supplements

Major ABD conformational rearrangements upon actin binding.
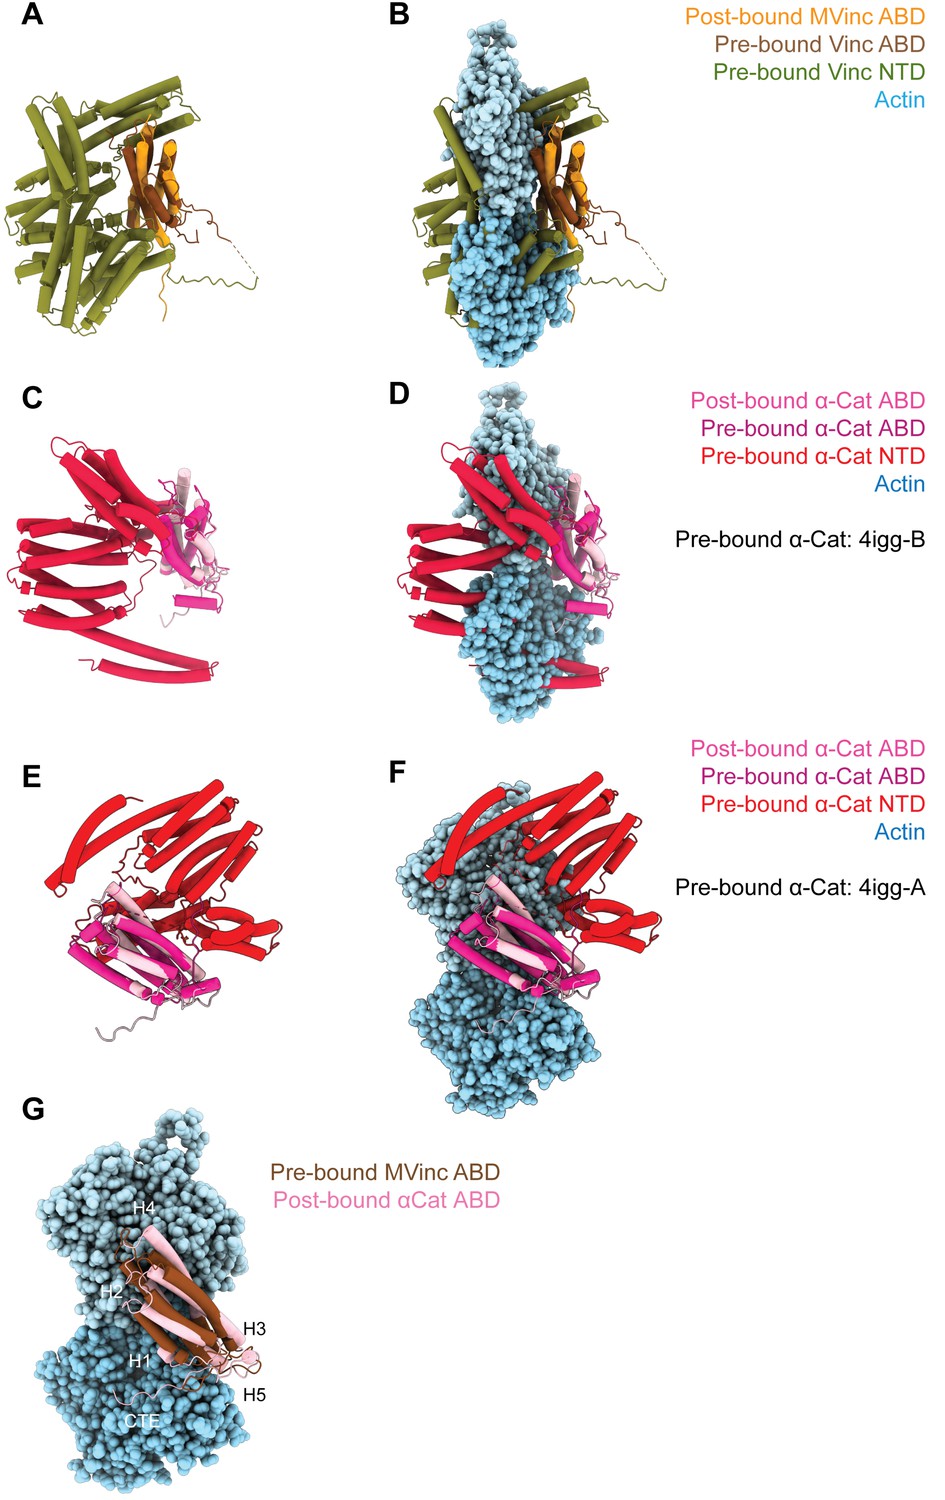
(A) Cartoons and crystal structures of pre-bound (meta)vinculin ABD (PDB 1st6, dark orange, top) and α-catenin ABD (PDB 4igg chain B, dark pink, bottom). Regions that undergo major rearrangements are highlighted in brown (metavinculin) or magenta (α-catenin); regions not resolved in the actin-bound cryo-EM structures are transparent. (B) Cryo-EM structures of metavinculin ABD (orange, top) and α-catenin ABD (pink, bottom). Flexible regions colored as in (A); actin, shades of blue. (C) Superimposed pre-bound and post-bound structures of metavinculin ABD (top) and α-catenin ABD (bottom). Green arrows indicate displacement of helices; rotation angles indicate repositioning of C-terminal extensions (CTEs).
Figure 4—figure supplement 1
(Meta)vinculin and α-catenin activation mechanisms.
(A and B) Superimposed pre-bound full-length vinculin crystal structure (PDB 1st6) and post-bound metavinculin ABD cryo-EM structure in the absence of actin (A), or in the presence of actin (B). (C, D, E, and F) Superimposed pre-bound full-length α-catenin crystal structures (PDB 4igg: C and D: Chain B; E and F: Chain A) and post-bound α-catenin ABD cryo-EM structure without (C and E) or with (D and F) actin. (G) Superimposed pre-bound full-length vinculin crystal structure (PDB 1st6) and post-bound α-catenin ABD cryo-EM structure in the presence of actin highlights the similar orientations of their CTEs.
Figure 4—video 1
Overall conformational changes in ABDs upon actin binding.
Linear interpolation morph of pre-bound to post-bound structures of the (meta)vinculin ABD (left) and α-catenin ABD (right). Colors, views, and superpositions are equivalent to Figure 4A and B.
Figure 4—video 2
Rearrangements in the helical bundle regions of ABDs upon actin binding.
Linear interpolation morph of pre-bound to post-bound structures of the (meta)vinculin ABD (left) and α-catenin ABD (right), focused on their similar twisting re-arrangements in helices H2–H5. Colors, views, and superpositions are equivalent to Figure 4C.
Figure 5 with 2 supplements
The actin-binding interfaces of metavinculin and α-catenin.
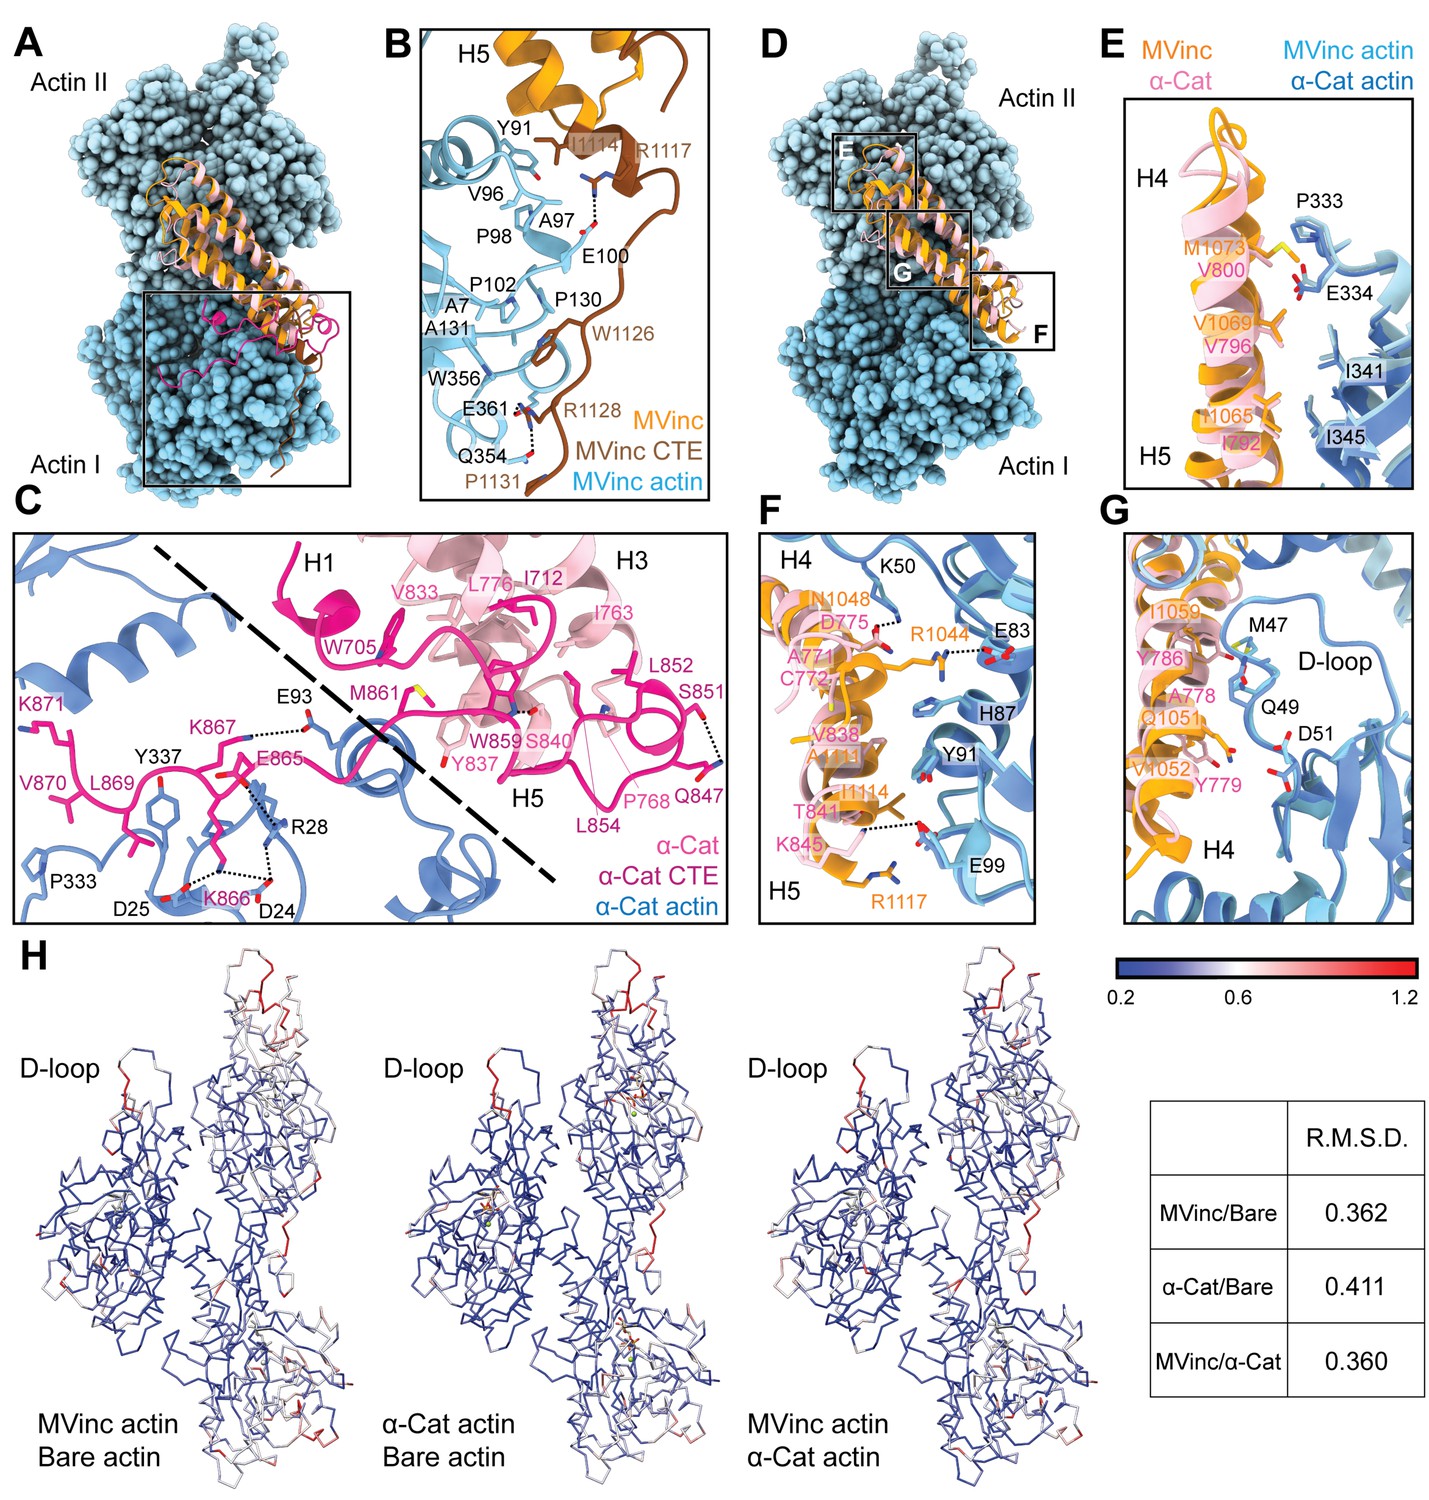
(A) Overlay of the metavinculin ABD-actin complex and α-catenin ABD-actin complex atomic models highlighting C-terminal extensions (CTEs) of metavinculin ABD and α-catenin ABD, superimposed on Actin I and colored as in Figure 4. Actins from α-catenin structure are displayed. (B and C) Detailed views of key contacts at minor interfaces: metavinculin CTE and actin (B); within the α-catenin tryptophan latch (right) and between its CTE and actin (left) (C). (D) Overlay of the metavinculin ABD-actin complex and α-catenin ABD-actin complex atomic models highlighting helical binding interfaces of metavinculin ABD and α-catenin ABD, superimposed and colored as in (A). Actins from α-catenin structure are displayed. (E, F, and G) Detailed views of key contacts at the major interface between metavinculin/α-catenin helices H4–H5 and Actin I (E); Actin II (F); Actin II D-loop (G). (H) Actin Cα traces colored by per-residue RMSD from the indicated comparisons. For superposition, segmented actin density from the cryo-EM maps was first aligned, followed by fitting the atomic models into their corresponding maps.
Figure 5—figure supplement 1
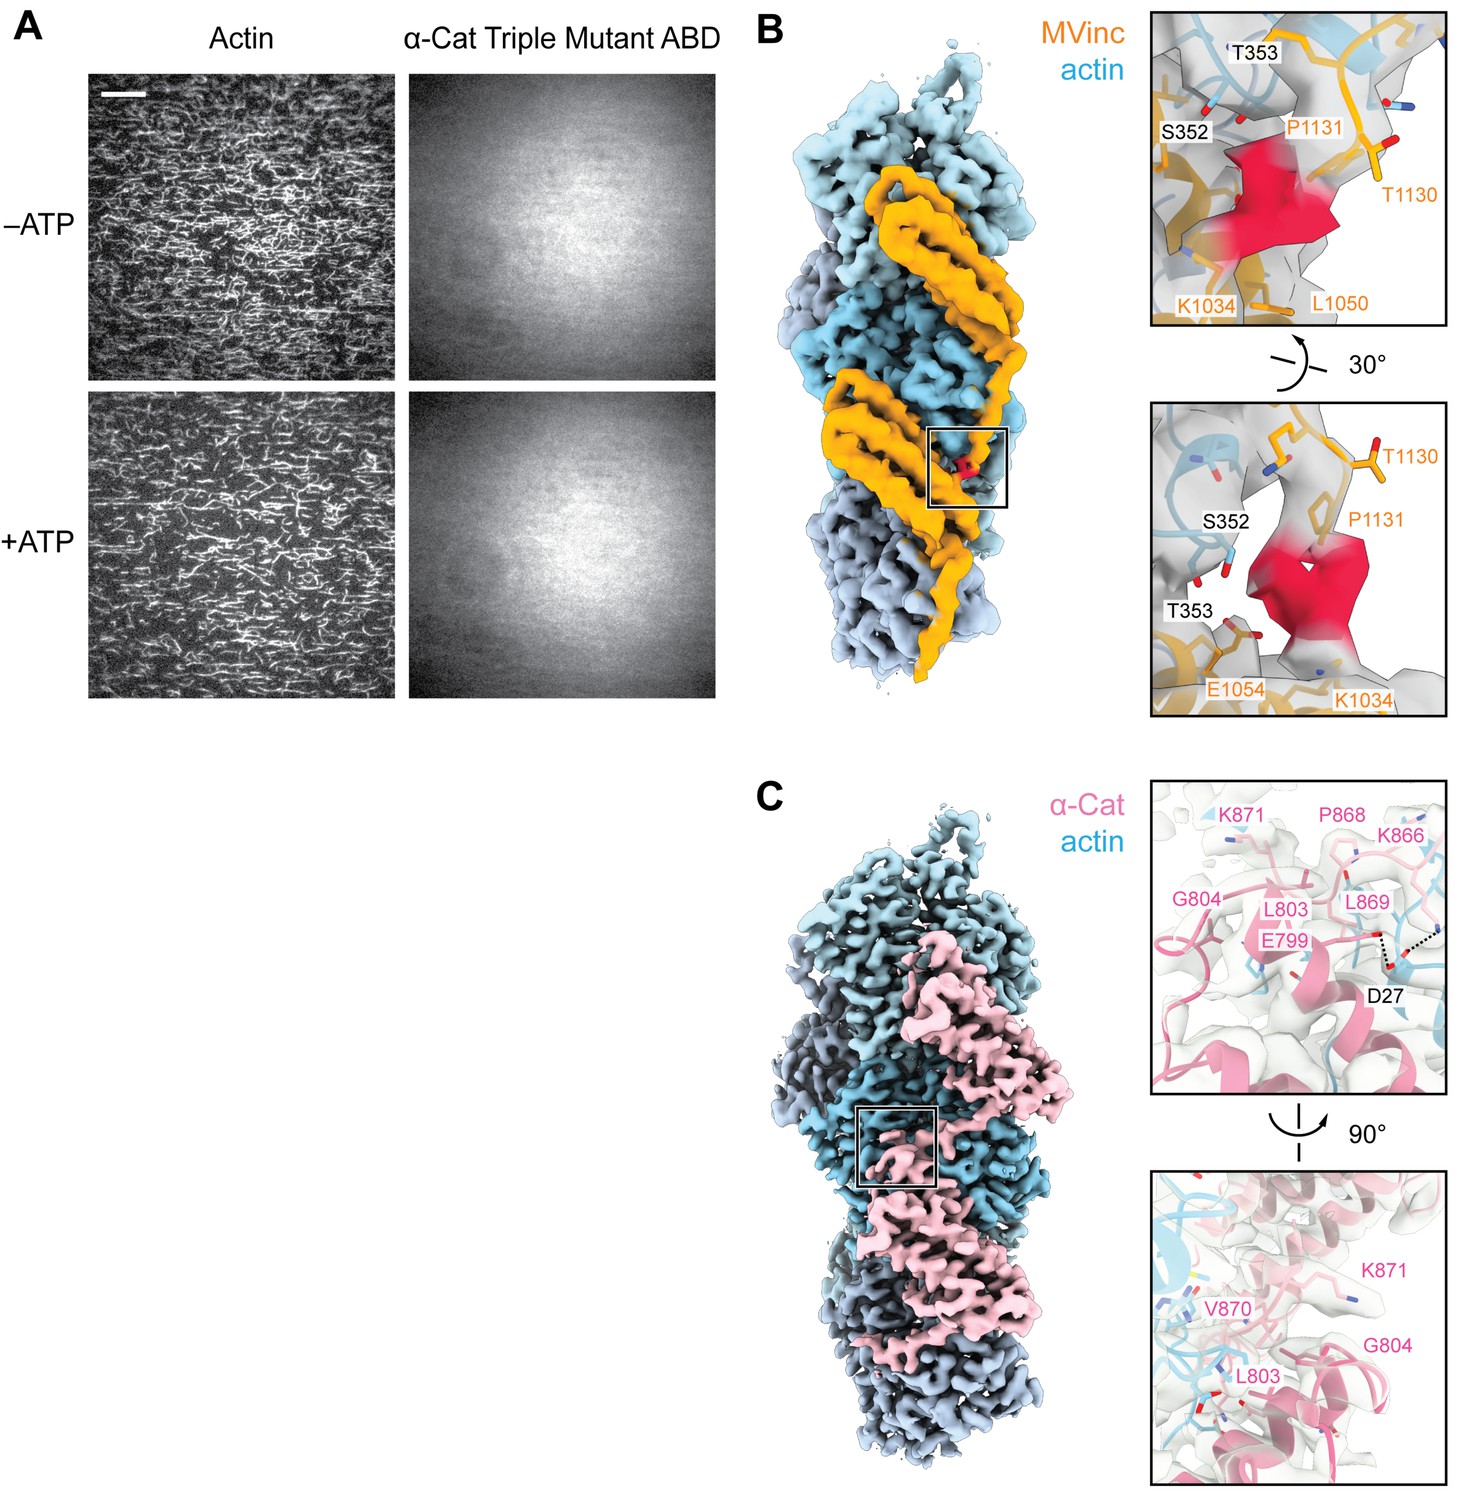
TIRF assays for the α-catenin ABD triple mutant which does not bind actin, and putative ABD-ABD contacts along F-actin.
(A) Representative TIRF-assay movie frames of actin (left) and α-catenin ABD ‘triple mutant’ (α-cat ABD-tm) (right) channels in the absence (top) and presence (bottom) of ATP to activate motors. As the ABD did not visibly associate with F-actin in either condition, these data were not quantified. Scale bar, 20 μm. Concentration of triple mutant ABD: 2 μM. (B and C) Views of potential contacts between longitudinally-adjacent actin-bound ABDs mediated by CTEs for metavinculin (B) and α-catenin (C). Left: Segmented density maps highlighting contact regions (boxes). Right: Detailed view of putative contacts, with the density map shown in gray transparent representation. The distal end of the metavinculin CTE (residues W1132, Y1133, Q1134), which is positioned to mediate inter-ABD contacts, was not modeled due to weak density (red).
Figure 5—video 1
Detailed views of distinct conformational changes in CTEs.
Linear interpolation morph of pre-bound to post-bound structures of the (meta)vinculin ABD (left) and α-catenin ABD (right), focusing on distinct re-arrangements in their CTEs in the vicinity of key tryptophans. Colors and views are equivalent to Figure 5A–C; superpositions as in Figure 4. For metavinculin, E1110, S1113, and W1126 are displayed, corresponding to E1042, S1045, and W1058 in vinculin. For α-catenin, Y837, S840, and W859 are displayed.
Figure 6 with 4 supplements
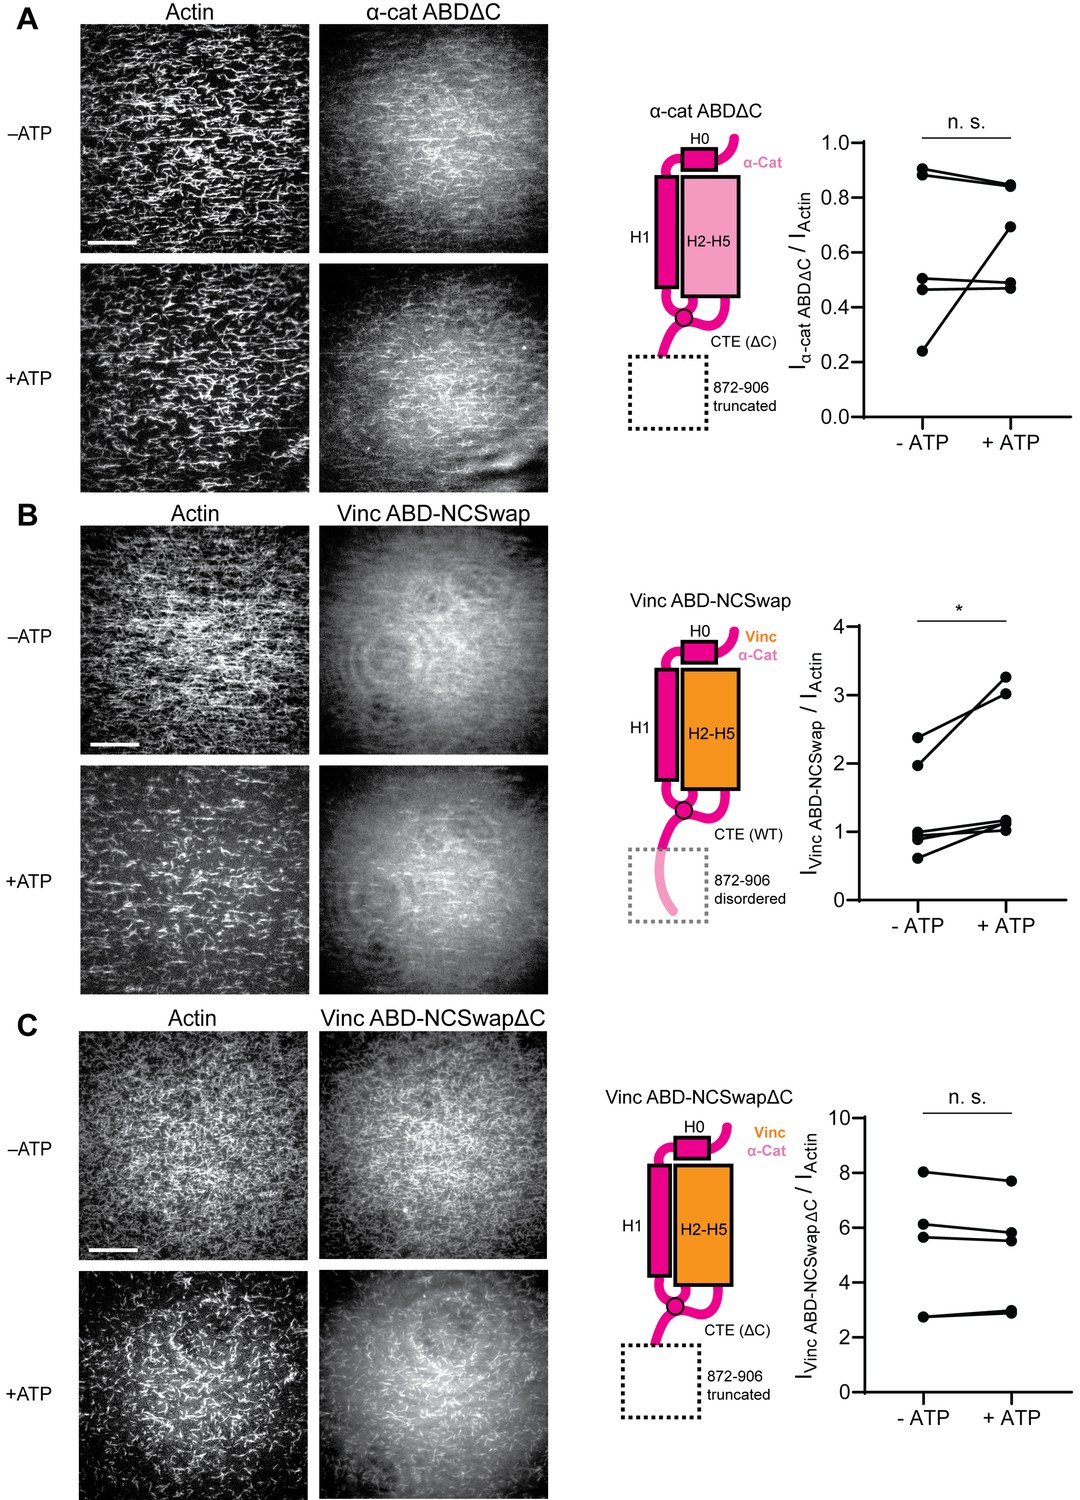
The distal tip of α-catenin’s C-terminus is a force detector.
(A, B, and C) TIRF force reconstitution assays. Left: Representative movie frames in the presence and absence of ATP. Scale bar, 30 μm. Right: Cartoon of ABD construct (left) and paired analysis of the overall intensity ratio change upon ATP addition (right). Wilcoxon signed-rank test: *p<0.05; n.s. (not significant), p>0.05. Constructs assayed were: α-cat ABDΔC (A) (αE-catenin664-871, N = 5, p=0.81); Vinc ABD-NCSwap (B) (αE-catenin664-708-vinculin916-1041-αE-catenin837-906, N = 6, p=0.031); Vinc ABD-NCSwapΔC (C) (αE-catenin664-708-vinculin916-1041-αE-catenin837-871, N = 5, p=0.63). Concentration of ABD constructs: 2 μM.
Figure 6—figure supplement 1
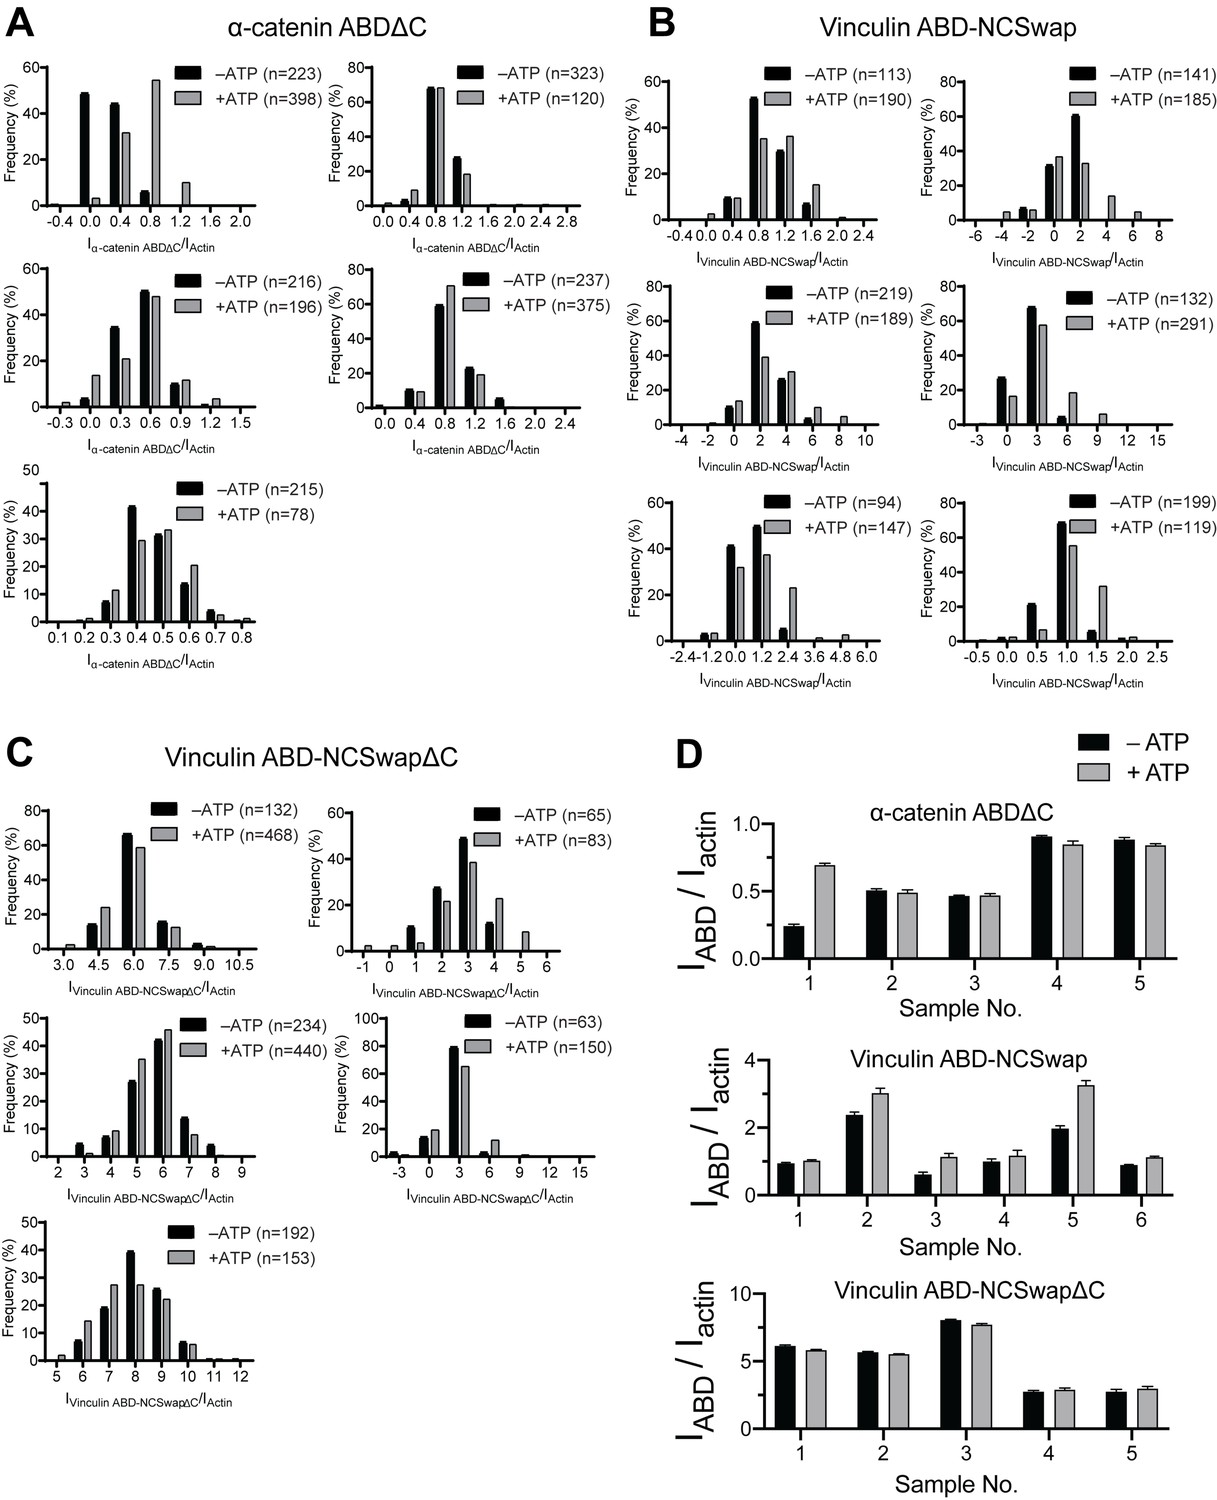
Intensity ratio distributions of single-filament regions for α-catenin and vinculin CTE mutants.
(A, B, and C) Time-averaged IABD/Iactin intensity ratio distributions of single-filament regions before and after ATP addition for α-catenin ABDΔC (A); Vinc ABD-NCSwap (B); Vinc ABD-NCSwapΔC (C). These data were used for the analysis presented in Figure 6A–C. (D) Bar plots of mean ± SEM of high-force and low-force averages for all trials displayed in Figure 6.
Figure 6—video 1
TIRF force reconstitution assay of α-catenin ABDΔC truncation mutant.
First 100 s of representative dual-color TIRF-assay movies of actin (left) and α-catenin ABDΔC (right) in the absence (top) and presence (bottom) of ATP, as shown in Figure 6A. Scale bar, 20 µm. This construct loses force-activated binding activity, binding actin equivalently in both conditions.
Figure 6—video 2
TIRF force reconstitution assay of Vinc ABD-NCSwap chimera.
First 100 s of representative dual-color TIRF-assay movies of actin (left) and Vinc ABD-NCSwap (right) in the absence (top) and presence (bottom) of ATP, as shown in Figure 6B. Scale bar, 20 µm. This construct gains force-activated binding activity, displaying impaired binding in the absence of force.
Figure 6—video 3
TIRF force reconstitution assay of Vinc ABD-NCSwapΔC chimera truncation mutant.
First 100 s of representative dual-color TIRF-assay movies of actin (left) and Vinc ABD-NCSwapΔC (right) in the absence (top) and presence (bottom) of ATP, as shown in Figure 6C. Scale bar, 20 µm. This construct loses force-activated binding activity versus the Vinc ABD-NCSwap chimera, binding actin equivalently in both conditions.
Figure 7

Molecular and cellular mechanisms for force-activated binding by α-catenin.
(A and B) Cartoons of two conceptual mechanistic models for force-activated actin binding by the α-catenin ABD. Orange box represents the force detector (residues 872–906) at the distal tip of the CTE. Blue gradient represents a force-induced conformational transition in the actin protomer. (C) Cartoon of proposed biological functions for force-activated actin binding by the two cellular populations of α-catenin. Membrane-associated cadherin-catenin complexes are illustrated in purple.
Author response image 1
Author response image 2
Tables
Table 1
Cryo-EM data collection, refinement, and validation statistics.
| Metavinculin ABD‒F-actin (EMDB-20844, PDB 6UPW) | α-catenin ABD‒F-actin (EMDB-20843, PDB 6UPV) | |
|---|---|---|
| Data collection and processing | ||
| Microscope | Titan Krios | Titan Krios |
| Voltage (kV) | 300 | 300 |
| Detector | K2 Summit | K2 Summit |
| Magnification | 29,000 | 29,000 |
| Electron exposure (e‒/Å2) | 60 | 60 |
| Exposure rate (e–/pixel/ s) | 6 | 6 |
| Calibrated pixel size (Å) | 1.03 | 1.03 |
| Defocus range (µm) | ‒1.5 to ‒3.5 | ‒1.5 to ‒3.5 |
| Helical symmetry | C1 | C1 |
| 27.06 Å rise | 27.03 Å rise | |
| −167.07° twist | −166.88° twist | |
| Initial filament segments (no.) | 237,503 | 540,533 |
| Final filament segments (no.) | 215,369 | 414,486 |
| Map resolution (Å) | 2.94 | 3.24 |
| FSC threshold | 0.143 | 0.143 |
| Refinement | ||
| Initial model (PDB ID) | 3JBK, 3J8A | 4IGG, 3J8A |
| Model resolution (Å) | 2.98 | 3.28 |
| FSC threshold | 0.5 | 0.5 |
| Map sharpening B factor (Å2) | ‒58 | ‒85 |
| Model composition | 5 actin protomers, 2 actin-binding domains | |
| Non-hydrogen atoms | 16,896 | 17,233 |
| Protein residues | 2152 | 2201 |
| Ligands | 5 Mg.ADP | |
| B factors (Å2) | ||
| Protein | 53.41 | 71.59 |
| Ligand | 47.29 | 56.65 |
| R.M.S. deviations | ||
| Bond lengths (Å) | 0.012 | 0.012 |
| Bond angles (°) | 0.860 | 0.833 |
| Validation | ||
| MolProbity score | 1.23 | 1.33 |
| Clash score | 3.32 | 4.63 |
| Poor rotamers (%) | 0.06 | 0.05 |
| Ramachandran plot | ||
| Favored (%) | 97.46 | 97.56 |
| Allowed (%) | 2.54 | 2.44 |
| Disallowed (%) | 0.00 | 0.00 |
| EMRinger Score | 4.40 | 3.87 |
Key resources table
| Reagent type (species) or resource | Designation | Source or reference | Identifiers | Additional information |
|---|---|---|---|---|
| Recombinant DNA Reagent | pET His-Strep-TEV and pET His-Strep-TEV-Halo vectors | This paper | Ampicillin resistance; expression vectors for E. coli Contact Alushin Lab for distribution | |
| Recombinant DNA Reagent | pFastBac Dual Expression Vector | ThermoFisher | 10712024 | Expression vectors for sf9 insect cells |
| Gene (H. sapiens) | Vinculin; HsVCL isoform 1 | Synthesized by Genewiz | UniProt:P18206-2 | |
| Gene (H. sapiens) | Metavinculin; HsVCL isoform 2 | Synthesized by Genewiz | UniProt:P18206-1 | |
| Gene (H. sapiens) | αE-catenin; HsCTNNA1 | Addgene # 24194 | UniProt:P35221 | |
| Strain, strain background (E. coli) | Rosetta2 (DE3) | Novagen | 71400–4 | E. coli strain for protein expression |
| Cell line (S. frugiperda) | Gibco Sf9 insect cell | ThermoFisher | 11496015 | Insect cell line for protein expression |
| Transfected construct (S. frugiperda) | Gibco Bac-to-Bac Baculovirus Expression System | ThermoFisher | 10359016 | Insect cell line transfection kit for protein expression |
| Chemical compound, drug | Halo-tag ligand amine O4 | Promega | P6741 | Synthetic precursor for the fluorescent dye JF-646-Halo |
| Chemical compound, drug | JF-646 NHS-ester building block | TOCRIS | 6148 | Synthetic precursor for the fluorescent dye JF-646-Halo |
| Chemical compound, drug | HaloTag Alexa Fluor 488 Ligand | Promega | G1001 | |
| Chemical compound, drug | Alexa Fluor 555-Phalloidin | ThermoFisher | A34055 | |
| Biological sample (O. cuniculus) | Actin Protein (Rhodamine): Rabbit Skeletal Muscle | Cytoskeleton, Inc | AR05-C | |
| Biological sample (O. cuniculus) | Actin Protein (Biotin): Rabbit Skeletal Muscle | Cytoskeleton, Inc | AB07-C | |
| Other | Streptavidin Coated Polystyrene Particles | Spherotech | SVP-40–5 | Used in optical trapping experiments |
| Other | C-flat Holey Carbon Grids for TEM - Gold Only | EMS | CF313-100-Au | Used in cryo-EM experiments |
| Software, algorithm | C-trap viewer | LUMICKS | http://www.nat.vu.nl/~iheller/download.html | |
| Software, algorithm | TWOM viewer | LUMICKS | http://www.nat.vu.nl/~iheller/download.html | |
| Software, algorithm | ImageJ 1.5 | Schneider et al., 2012 https://doi.org/10.1038/nmeth.2089 | RRID:SCR_003070 | ImageJ plugin for TIRF image analysis:https://github.com/alushinlab/ActinEnrichment |
| Software, algorithm | RELION 3.0 | He and Scheres, 2017 https://doi.org/10.1016/j.jsb.2017.02.003 Schneider et al., 2012 https://doi.org/10.1016/j.jmb.2011.11.010 Zivanov et al., 2018 https://doi.org/10.7554/eLife.42166 | RRID:SCR_016274 | |
| Software, algorithm | CTFFIND 4.1.5 | Rohou and Grigorieff, 2015 https://doi.org/10.1016/j.jsb.2015.08.008 | RRID:SCR_016732 | |
| Software, algorithm | Phenix 1.17.1 | Afonine et al., 2018 https://doi.org/10.1107/S2059798318006551 | RRID:SCR_014224 | |
| Software, algorithm | Coot 0.8.9 | Emsley et al., 2010 https://doi.org/10.1107/S0907444910007493 | RRID:SCR_014222 | |
| Software, algorithm | UCSF Chimera 1.14 | Pettersen et al., 2004 https://doi.org/10.1002/jcc.20084 | RRID:SCR_004097 | |
| Software, algorithm | UCSF ChimeraX 1.0 | Goddard et al., 2018 https://doi.org/10.1002/pro.3235 | RRID:SCR_015872 | |
| Software, algorithm | GraphPad Prism 8 | GraphPad Software, Inc | RRID:SCR_002798 |
Additional files
Download links
A two-part list of links to download the article, or parts of the article, in various formats.
Downloads (link to download the article as PDF)
Open citations (links to open the citations from this article in various online reference manager services)
Cite this article (links to download the citations from this article in formats compatible with various reference manager tools)
Molecular mechanism for direct actin force-sensing by α-catenin
eLife 9:e62514.
https://doi.org/10.7554/eLife.62514


