ß-arrestin 2 germline knockout does not attenuate opioid respiratory depression
- Department of Physiology, University of California, San Francisco, United States
- Neuroscience Graduate Program, University of California, San Francisco, United States
- Biomedical Sciences Graduate Program, University of California, San Francisco, United States
Figures
Figure 1

Experimental approach to measure OIRD in each Arrb2 genotype.
(A) Breeding scheme to generate F2 Arrb2+/+, +/-, and -/- littermates. (B), Whole body plethysmography experimental scheme. On Day 1, recordings were performed 15 min after IP saline injection. Day 2, recordings 15 min after IP morphine (20 mg/kg). Recordings were first conducted under normoxic conditions (21% O2, 0% CO2) and then at least one week later under hypercapnic conditions (21% O2, 5% CO2). (C), Example analysis of a single breath. The approximated airflow (mL/s) was used to identify inspiration (insp. <0 mL/s) and expiration (expir. >0 mL/s). Instantaneous frequency (Hz, s–1) defined as the interval between inspiration onset and expiration offset. PIF, peak inspiratory airflow. These two parameters were used to define OIRD.
Figure 2
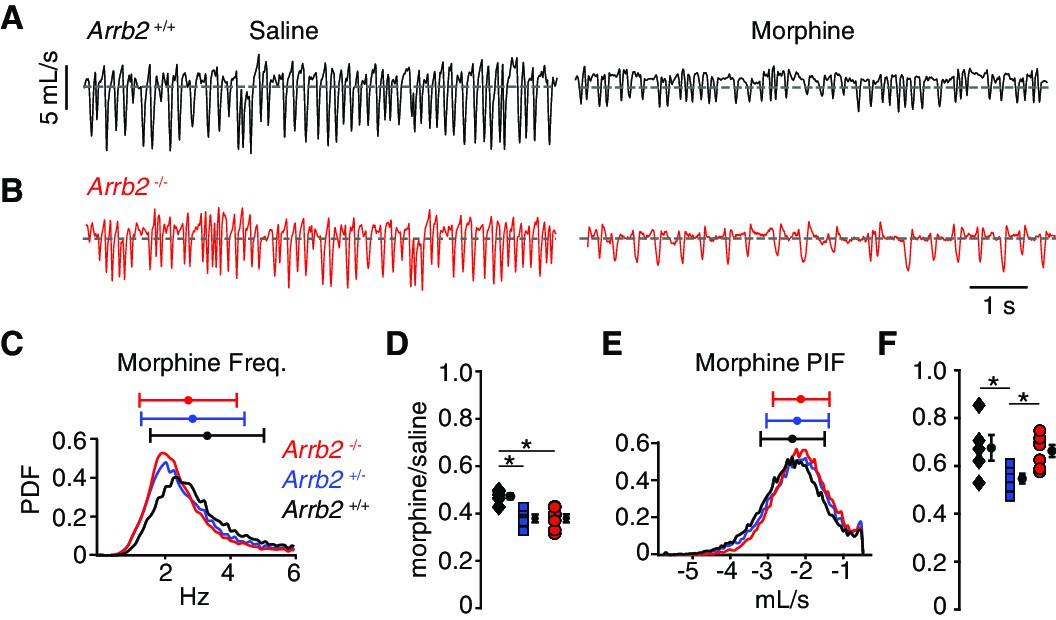
Basal respiration and OIRD in Arrb2 littermates in normoxic conditions.
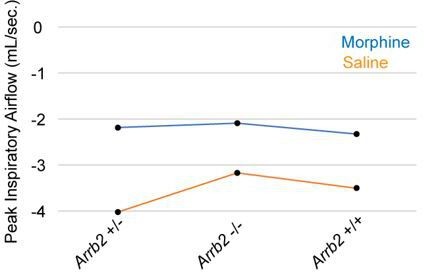
(A) Example breathing trace in normoxic conditions (21% O2, 0% CO2) following IP saline (left) and morphine (right) for Arrb2+/+. (B), Example breathing traces from Arrb2-/-. (C), Histogram of instantaneous respiratory frequency (Hz) for all breaths in morphine from Arrb2-/- (red, combined from n = 7 animals), Arrb2+/- (blue, n = 6), and Arrb2+/+ (black, n = 5). PDF, probability density function. Top, mean (circle)± standard deviation (bars). Values of respiratory measurements are reported in Table 1. (D), OIRD defined as the ratio of average respiratory frequency in morphine to saline for Arrb2-/-, Arrb2+/-, and Arrb2+/+. Mean (circle)± standard deviation (bars). Data values included in Table 2. Note, Arrb2+/+ mice have less OIRD when compared to Arrb2+/- and -/-. (E–F), Analysis of peak inspiratory airflow (PIF) displayed as in C–D. Note, PIF in Arrb2±mice shows more OIRD when compared to Arrb2+/+ and -/-. There is no statistically significant difference between Arrb2+/+ and -/-. Single and Two Factor ANOVA and unpaired t-test statistics reported in Table 2. *, indicates the post-hoc single factor ANOVA comparisons with p-value < 0.05. Statistics were not corrected for multiple comparisons to maximize the possibility of identifying differences between Arrb2 genotypes.
-
Figure 2—source data 1
Raw respiratory data, OIRD ratio, and statistical tests for recordings performed in normoxic conditions.
- https://cdn.elifesciences.org/articles/62552/elife-62552-fig2-data1-v3.xlsx
Figure 3 with 1 supplement
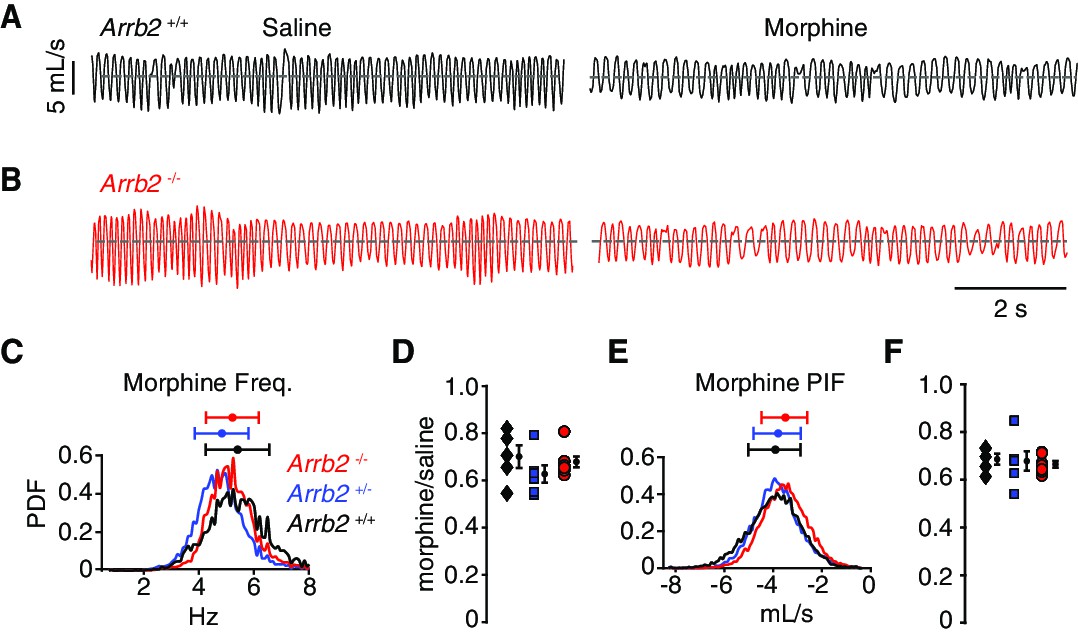
Basal respiration and OIRD in Arrb2 littermates in hypercapnic conditions.
(A) Example breathing trace in hypercapnic conditions (21% O2, 5% CO2) following IP saline (left) and morphine (right) for Arrb2+/+. (B), Example breathing traces from Arrb2-/-. (C), Histogram of instantaneous respiratory frequency (Hz) for all breaths in morphine from Arrb2-/- (red, combined from n = 7 animals), Arrb2+/- (blue, n = 6), and Arrb2+/+ (black, n = 5). PDF, probability density function. Top, mean (circle)± standard deviation (bars). Respiratory measurements for saline and morphine are reported in Table 3. (D), OIRD defined as the ratio of average respiratory frequency in morphine to saline for Arrb2-/-, Arrb2+/-, and Arrb2+/+. Mean (circle)± standard deviation (bars). Data included in Table 4. (E–F), Analysis of peak inspiratory airflow (PIF) as in C–D. but for peak inspiratory airflow. Single and Two Factor ANOVA and unpaired t-test statistics reported in Table 4. Statistics were not corrected for multiple comparisons to maximize the possibility of identifying differences between Arrb2 genotypes.
-
Figure 3—source data 1
Raw respiratory data, OIRD ratio, and statistical tests for recordings performed in hypercapnic conditions.
- https://cdn.elifesciences.org/articles/62552/elife-62552-fig3-data1-v3.xlsx
Figure 3—figure supplement 1
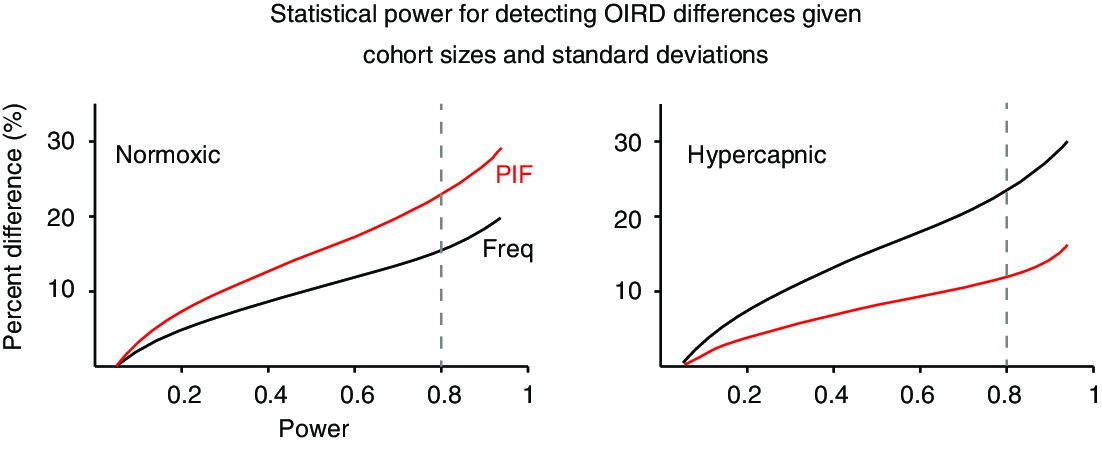
Power analysis to determine the OIRD effect size given the cohort sizes and data in normoxic and hypercapnic experimental conditions.
A power analysis was conducted with the hypothetical mean frequency and peak inspiratory airflow (PIF) of Arrb2+/+ compared to the measured mean from Arrb2-/-. The power analysis used the cohort size and measured standard deviation of Arrb2+/+ and -/-. Displayed is the percent difference in OIRD between Arrb2-/- and +/+ (y-axis) at each power (x-axis). Respiratory frequency (Freq, black). Peak inspiratory airflow (PIF, red). Right, Normoxic condition. Left, Hypercapnic condition. Gray dashed line, power of 0.8.
Figure 4
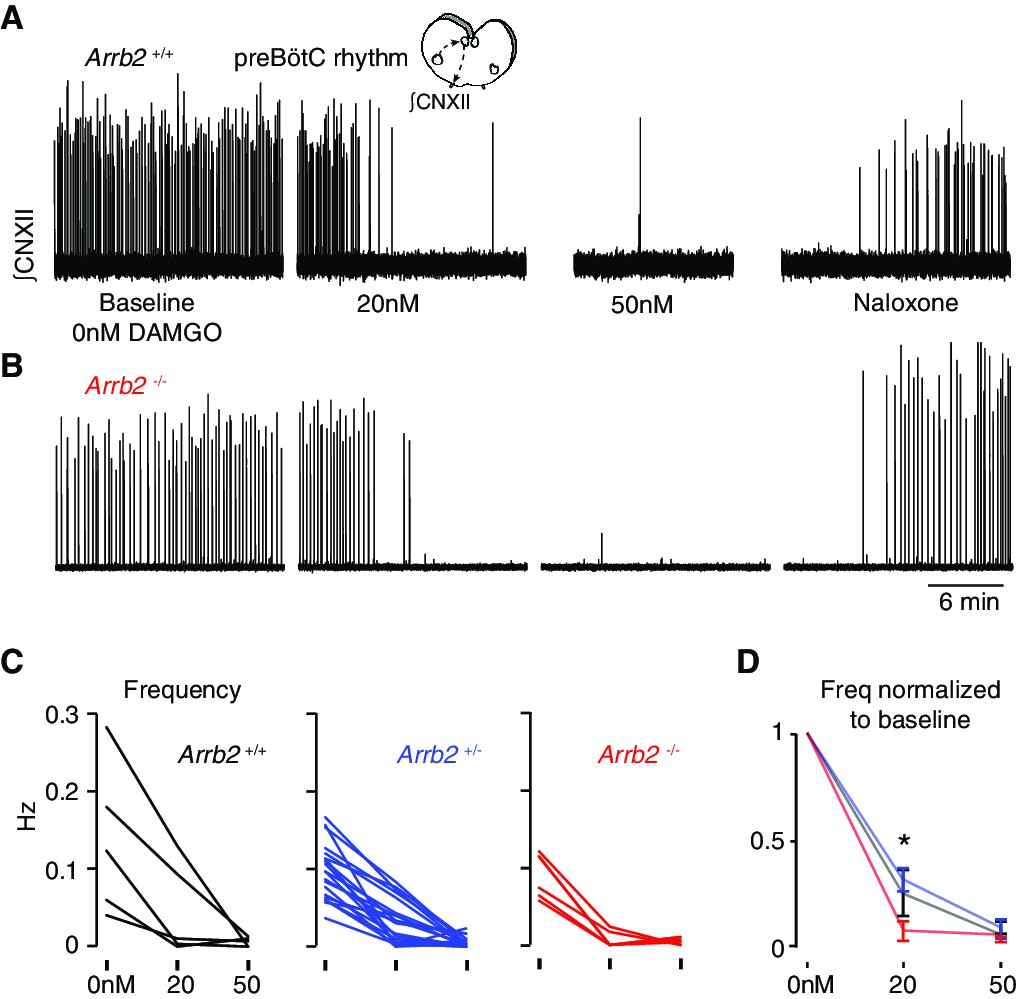
Slowing of preBötC rhythmicity with a MOR agonist from Arrb2 littermates.
A, Neonatal medullary preBötC slice preparation. PreBötC inspiratory activity is measured via the hypoglossal nerve rootlet (∫CNXII, arbitrary units). Example twenty minute recordings from an Arrb2+/+ slice where the rhythm is recorded at baseline (0 nM DAMGO), then 20 nM and 50 nM DAMGO, and then with the addition of 100 nM Naloxone. (B), As in A, but example recording from an Arrb2-/- littermate. (C), The preBötC frequency (Hz) for each slice from Arrb2+/+ (black, n = 5), +/- (blue, n = 20), and -/- (red, n = 6) littermates at each DAMGO dose. Average frequency (bursts per second) is measured during the last five minutes of each recording. (D), Mean ± SEM for normalized frequency for each genotype at each DAMGO dose. *, p-value < 0.05 for Kruskal-Wallis test. p-Values for pairwise Mann-Whitney: 0.10 for +/+ vs -/-, 0.45 for +/+ vs +/-, 0.02 for±vs -/-.
-
Figure 4—source data 1
Raw data and statistical tests for in vitro OIRD recordings.
The data contains raw and normalized data and corresponding statistical tests for each Arrb2 genotype.
- https://cdn.elifesciences.org/articles/62552/elife-62552-fig4-data1-v3.xlsx
Author response image 1
Tables
Table 1
Mean and confidence interval for normoxic condition raw respiratory frequency and peak inspiratory airflow after saline and morphine intraperitoneal injection.
| Arrb2 -/- mean ± SEM | Arrb2 -/-95% CI | Arrb2+/- mean ± SEM | Arrb2 +/-95% CI | Arrb2 +/+ mean ± SEM | Arrb2 +/+95% CI | |
|---|---|---|---|---|---|---|
| Freq. saline (Hz) | 7.05 ± 0.34 | 6.38 → 7.72 | 7.51 ± 0.41 | 6.71 → 8.31 | 6.93 ± 0.32 | 6.30 → 7.56 |
| Freq. morphine | 2.67 ± 0.16 | 2.36 → 2.98 | 2.83 ± 0.14 | 2.56 → 3.10 | 3.27 ± 0.16 | 2.96 → 3.58 |
| PIF saline(mL/s) | –3.17 ± 0.15 | –2.88 → –3.46 | –4.03 ± 0.25 | –3.54 → –4.52 | –3.5 ± 0.23 | –3.04 → –3.95 |
| PIF morphine | –2.09 ± 0.09 | –1.91 → –2.23 | –2.19 ± 0.10 | –1.99 → –2.39 | –2.33 ± 0.10 | –2.13 → –2.53 |
Table 2
OIRD values of respiratory frequency and peak inspiratory airflow in normoxic conditions and the several types of statistical tests.
The respiratory frequency OIRD in Arrb2+/+ is larger than Arrb2+/- and -/-. The PIF OIRD for Arrb2+/- is smaller than Arrb2+/+ and -/-.
| Arrb2 -/-OIRD mean (95% CI) | Arrb2+/- mean (95% CI) | Arrb2 +/+ mean (95% CI) | Arrb2 -/- vs. Arrb2 +/+ (t-test) | Arrb2 -/- vs. Arrb2 +/+(t-test 95% CI) | One-way anova | Tukey HSD/Kramer Arrb2 -/- vs. +/+ | Two-way anova regression(interaction) | |
|---|---|---|---|---|---|---|---|---|
| Freq. | 0.38 (0.35→0.41) | 0.38 (0.35→0.41) | 0.47 (0.44→0.50) | P = 0.001 | 0.05→0.14 | 0.002 | 0.003 | 0.22 |
| PIF | 0.66 (0.61→0.71) | 0.55 (0.48→0.56) | 0.68 (0.63→0.71) | P = 0.83 | –0.13→0.16 | 0.03 | 0.96 | 0.05 |
Table 3
Mean and confidence interval for hypercapnic condition raw respiratory frequency and peak inspiratory airflow after saline and morphine intraperitoneal injection.
| Arrb2 -/- mean ± SEM | Arrb2 -/-95% CI | Arrb2+/- mean ± SEM | Arrb2 +/-95% CI | Arrb2 +/+ mean ± SEM | Arrb2 +/+95% CI | |
|---|---|---|---|---|---|---|
| Freq. saline (Hz) | 7.68 ± 0.19 | 7.31 → 8.05 | 7.69 ± 0.16 | 7.38 → 8.00 | 7.77 ± 0.39 | 7.01 → 8.53 |
| Freq. morphine | 5.20 ± 0.10 | 5.00 → 5.40 | 4.79 ± 0.19 | 4.42 → 5.16 | 5.38 ± 0.18 | 5.02 → 5.73 |
| PIF saline (mL/s) | –5.34 ± 0.27 | –4.81 → –5.87 | –5.75 ± 0.25 | –5.26 → –6.24 | –5.71 ± 0.20 | –5.32 → –6.10 |
| PIF morphine | –3.54 ± 0.16 | –3.22 → –3.85 | –3.86 ± 0.15 | –3.57 → –4.15 | –3.93 ± 0.24 | –3.46 → –4.40 |
Table 4
OIRD values of respiratory frequency and peak inspiratory airflow in hypercapnic conditions and the several types of statistical tests.
| Arrb2 -/-OIRD median or mean (95% CI) | Arrb2+/- mean (95% CI) | Arrb2 +/+ mean (95% CI) | Arrb2 -/- vs. Arrb2 +/+ (Mann-Whitney or unpaired t-test, two tail) | Arrb2 -/- vs. Arrb2 +/+(95% CI) | Kruskal-Wallis orOne-way anova | Two-way Anova - regression(interaction) | |
|---|---|---|---|---|---|---|---|
| Freq. | 0.66 | 0.63 (0.55→0.71) | 0.70 (0.60→0.80) | P = 0.52 (MW) | –0.11→0.15 | 0.16 (KW) | 0.45 |
| PIF | 0.66 (0.64→0.68) | 0.68 (0.61→0.77) | 0.69 (0.64→0.72) | P = 0.46 (t) | –0.04→0.08 | 0.86 (anova) | 0.96 |
Key resources table
| Reagent type (species) or resource | Designation | Source or reference | Identifiers | Additional information |
|---|---|---|---|---|
| Strain, strain background (Mus musculus, male and female) | Arrb2-/- | The Jackson Laboratory | 011130 | |
| Strain, strain background (Mus musculus, male and female) | C57Bl/6 J | The Jackson Laboratory | 000664 | |
| Peptide, recombinant protein | DAMGO | Abcam | Ab12067 | |
| Chemical compound, drug | Morphine sulfate | Henry Schein | 057202 | |
| Chemical compound, drug | Naloxone | Sigma Aldrich | N7758 | |
| Software, algorithm | Matlab | Mathworks | https://github.com/YackleLab/Opioids-depress-breathing-through-two-small-brainstem-sites |
Additional files
Download links
A two-part list of links to download the article, or parts of the article, in various formats.
Downloads (link to download the article as PDF)
Open citations (links to open the citations from this article in various online reference manager services)
Cite this article (links to download the citations from this article in formats compatible with various reference manager tools)
ß-arrestin 2 germline knockout does not attenuate opioid respiratory depression
eLife 10:e62552.
https://doi.org/10.7554/eLife.62552


