Circuits for integrating learned and innate valences in the insect brain
- HHMI Janelia Research Campus, United Kingdom
- Neurobiology Division, MRC Laboratory of Molecular Biology, United Kingdom
- Department of Zoology, University of Cambridge, United Kingdom
- Department of Neuroscience & Neurology, & Zuckerman Mind Brain Institute, Columbia University, United States
- Department of Molecular, Cell and Developmental Biology, University California Los Angeles, United States
- Department of Physics, New York University, United States
- Department of Physics, Harvard University, United States
- Center for Brain Science, Harvard University, United States
- Center for Neural Science, New York University, United States
- Neuroscience Institute, New York University, United States
- Department of Biology, University of Washington, United States
- Department of Physiology, Development & Neuroscience, University of Cambridge, United Kingdom
Figures
Figure 1

Aversive learning modulates turning to switch odor approach to avoidance.
(a) The behavior of larvae in a linear gradient (Gershow et al., 2012) of an innately attractive odor, ethyl acetate, (EA) is recorded after odor presentation is intercalated (’unpaired’ training protocol) or coincident (’paired’ training protocol) with fictive punishment (optogenetic activation of nociceptive basin neurons [Ohyama et al., 2015]). Larvae navigate via kinesis, modulating turn rate over time and in response to different conditions, and via klinotaxis/tropotaxis, choosing turn side (Gershow et al., 2012; Gomez-Marin and Louis, 2012; Schulze et al., 2015; Gepner et al., 2015). Here, we record turn rate as a function of larval orientation in the odor gradient (c). (b) Navigation index following paired and unpaired protocols (computed by dividing the mean velocity in the direction of the gradient by the mean crawling speed). The positive index after the unpaired protocol indicates that larvae approach the odor, the negative index after the paired protocol indicates they avoid it. (c) Turn rate as a function of larval orientation in the gradient. Unpaired group larvae approach the odor by turning less in response to an increase in odor concentration (when crawling up the gradient, toward the odor source), and more in response to a decrease in odor concentration (when crawling down the gradient, away from the odor source). Paired group larvae avoid the odor by turning more in response to an increase in the odor concentration (when crawling up the gradient), and by turning less in response to a decrease in odor concentration (when crawling down the gradient). Values are mean s.e.m. *: p < 0.05, **: p < 0.01 in a Welch Z-test, N = 10 repeats.
Figure 2 with 3 supplements
Positive- and negative-valence MBONs repress and promote turning, respectively.
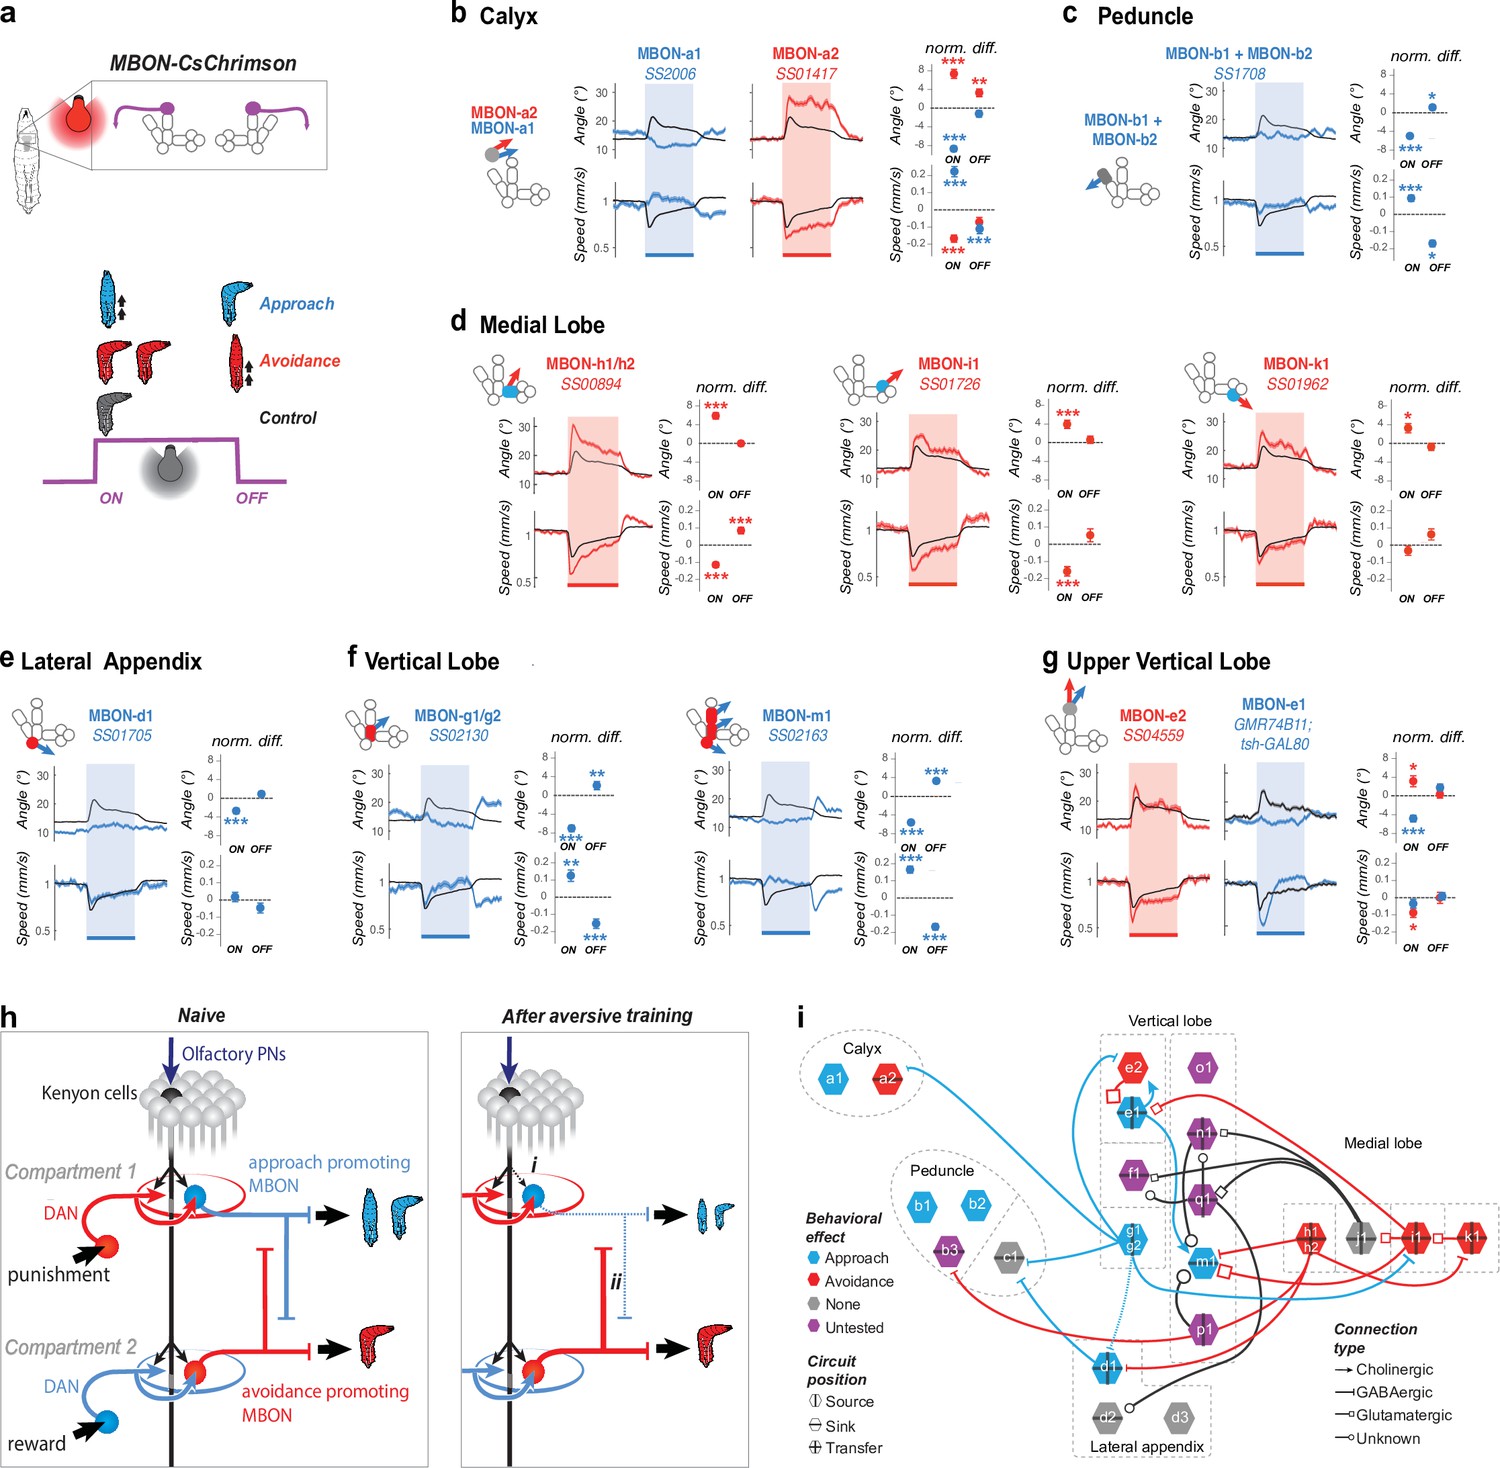
(a) We recorded the behavior of larvae expressing CsChrimson in one or two pairs of MBONs and classified their responses to a 15 s red light stimulation as approach-like (blue larva), avoidance-like (red larva), or neutral by comparing them to controls. Approach-like responses are characterized by significantly decreased turning and/or increased crawling speed in response to an increase (at the onset of optogenetic activation), and/or increased turning and decreased crawling in response to a decrease in MBON activity (at the offset of optogenetic activation). Avoidance-like responses are characterized by the reverse responses. We classified MBONs whose activation suppresses turning and promotes approach as positive-valence MBONs (blue in b–i), and those whose activation promotes turning and promoted avoidance as negative-valence MBONs (red in b–i). (b–g) Behavioral response to optogenetic activation of MBONs (GAL4 lines indicated in italic; see Figure 2—figure supplement 1 for expression patterns). Turn angle (deg) is the absolute value of the distance from the least-squares line fit of the posterior 2/3 of the animal’s spine points to the point in the anterior 1/5 of the animal’s spine most distant from that line. Left, schematics depicting compartments innervated by MBONs, colored according to memory induced when odor is paired with DAN activation in that compartment: appetitive (blue), aversive (red), or unknown (gray, Eschbach et al., 2020). Middle, time series of mean (+/− s.e.m) turn angle (top) and crawling speed (normalized to baseline prior to stimulation, bottom). Shading indicates the period of optogenetic activation. Right, the difference between the experimental (red or blue dots with error bars) and control (dotted line at 0) turn angle (top) and crawling speed (bottom) averaged over a time window after the onset (0–5 s, normalized to baseline before light) and offset (2–7 s. after light off, normalized to baseline during light) of optogenetic stimulation. Note that the control animals (black curve in b–g) display a slightly aversive response to the onset of red light used for optogenetic activation. The control is the empty GAL4 line y w;attP40;attP2 crossed to UAS-CsChrimson (Nexp = 343, Nlarvae >10,000) for all lines except for MBON-e1 (g) for which the control line is yw;;attP2 crossed to UAS-CsChrimson; tsh-GAL80. Plots are mean +/− s.e.m. *: p < 0.05, **: p < 0.01, ***: p < 0.001 (Welch’s Z test). (b) Activating the two calyx-MBONs induced opposite responses: approach and avoidance, for MBON-a1 (Nexp = 7, Nlarvae = 250) and MBON-a2 (Nexp = 7, Nlarvae = 280), respectively. (c) Activating peduncle-MBONs, MBON-b1/b2 together (Nexp = 8, Nlarvae = 340) induced approach. MBON-c1 activation had no significant effect (Figure 2—figure supplement 2). (d) Activating medial lobe MBONs induced avoidance: MBON-h1/h2 (Nexp = 10, Nlarvae = 450), MBON-i1 (Nexp = 6, Nlarvae = 240), and MBON-k1 (Nexp = 6, Nlarvae = 210). MBON-j1 activation had no significant effect (Figure 2—figure supplement 2). (e) Activating the lateral appendix-MBON-d1 (Nexp = 9, Nlarvae = 250) induced approach. MBON-d2 and -d3 activation did not have a significant effect (Figure 2—figure supplement 2). (f) Activating the vertical lobe-MBONs induced approach: MBON-g1/g2 (Nexp = 6, Nlarvae = 210) and MBON-m1 (Nexp = 9, Nlarvae = 450). (g) Activating the two MBONs in the tip of vertical lobe had opposite effects: MBON-e2 (Nexp = 5, Nlarvae = 140) and -e1 (Nexp = 6, Nlarvae = 250, using tsh-GAL80 to eliminate nerve cord expression) induced avoidance- and approach-like responses, respectively. Note that most negative-valence MBONs innervate appetitive-memory com- partments (3/5), and the remainder innervate compartment with unknown roles. By contrast, most positive-valence MBONs (4/6) innervate aversive-memory compartment, and the remainder innervate compartments with unknown roles. (h) Schematic showing a naive state (left) and two main mechanisms (right) potentially enabling the MB network to switch from encoding positive or neutral to negative valence after aversive learning. Left, In a naive state KC-connections to positive- and negative-valence MBONs is similar. Right, (i) aversive learning depresses the synapse between the conditioned odor-KCs and positive-valence MBONs (Hige et al., 2015b), skewing the balance towards negative-valence MBONs. (ii) Decreased conditioned odor drive to inhibitory positive-valence MBONs can disinhibit the negative-valence MBONs. (i) Synaptic-resolution circuit diagram from Eichler et al., 2017 overlaid with MBON neurotransmitter profiles also from Eichler et al., 2017 and valence (b–g), reveals lateral inhibition between MBONs that encode opposite valence. Blue rim, positive-valence; red rim, negative-valence; grey rim, no behavioral effect; purple; not tested. Arrows, excitatory cholinergic; bars, inhibitory GABAergic; squares, glutamatergic, likely inhibitory (Liu and Wilson, 2013) connections; circles, unknown neurotransmitter. Vertical and horizontal bars, source (i.e. emitting projections), sink (i.e. receiving projections), or transfer MBONs (i.e. emitting and receiving projections).
-
Figure 2—source data 1
Value angles showing turn responses of animals during activation of MBONs.
Mean and std values of the turn angles over time in the different experimental groups shown in Figure 2b–g.
- https://cdn.elifesciences.org/articles/62567/elife-62567-fig2-data1-v3.csv
Figure 2—figure supplement 1
Expression patterns of Split-GAL4 lines.
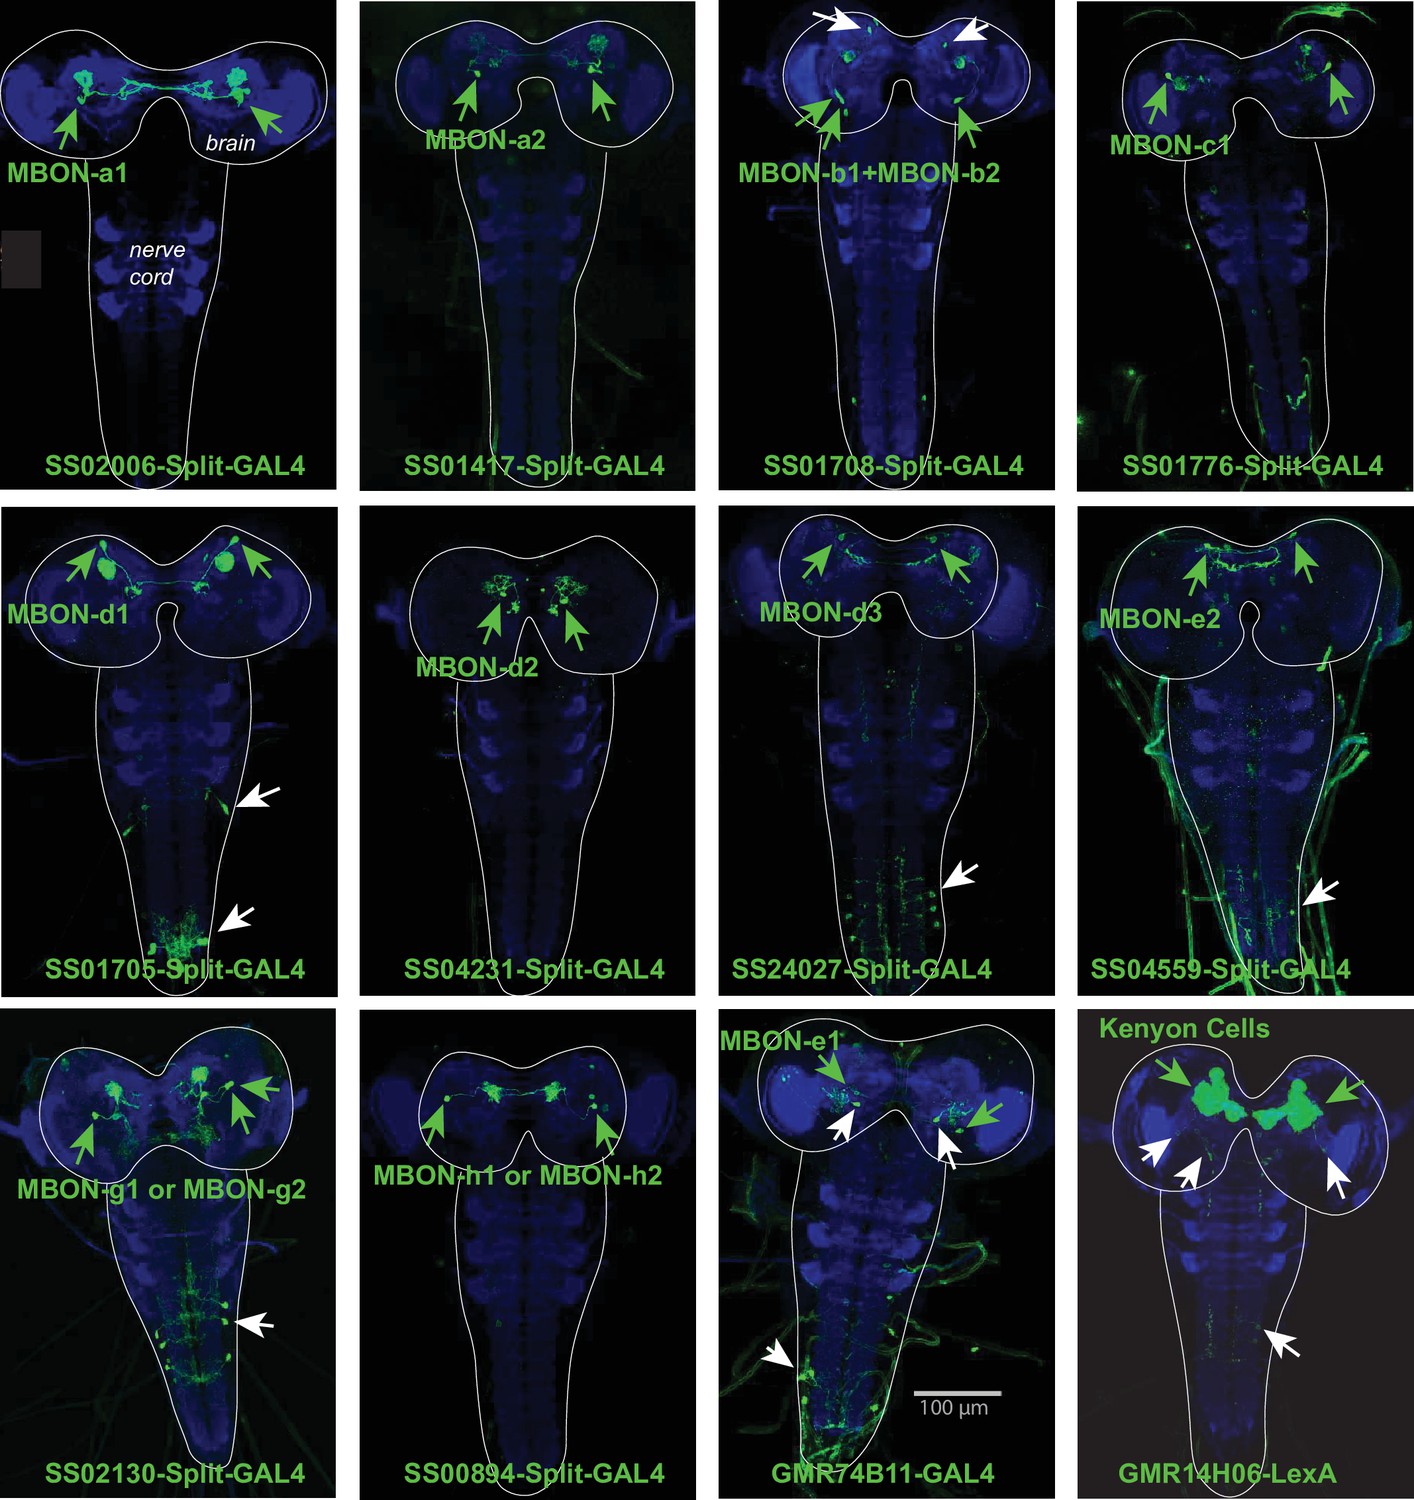
Each panel shows a confocal maximum intensity projection of the complete central nervous system (CNS) of third-instar larvae (outlined by the dotted line), with the neuropil labelled with anti-N-Cad antibody (blue) and the driver line expression pattern revealed by driving UAS-myr-GFP (green). Arrowheads indicate cell bodies of identified neurons: in green the targeted neuron, in white other neurons. The Split-GAL4 lines SS02006 (for MBON-a1), SS01417 (for MBON-a2), SS01776 (for MBON-c1), SS04321 (for MBON-d2), SS00894 (for MBON-h1 and -h2) drive expression specifically in the neurons of interest. The lines SS01708 (for MBONb1 and -b2) also drive expression in another brain neuron type. SS01705 (for MBON-d1), SS24027 (for MBON-d3), SS04559 (for MBON-e2), SS02130 (for MBON-g1 or -g2) target interneurons in the ventral nerve cord in addition to the neuron of interest; and GMR-74B11 (MBON-e1) drive expression in another brain neuron and in neurons of the ventral nerve cord (eliminated using the GAL80 repressor in teashirt-LexA for the ventral nerve cord). The 14H06-LexA line drives expression in the MB Kenyon cells and weakly and stochastically in two additional brain neurons, and in an additional neuron in the ventral nerve cord.
Figure 2—figure supplement 2
Some MBONs do not promote visible response when optogenetically activated.
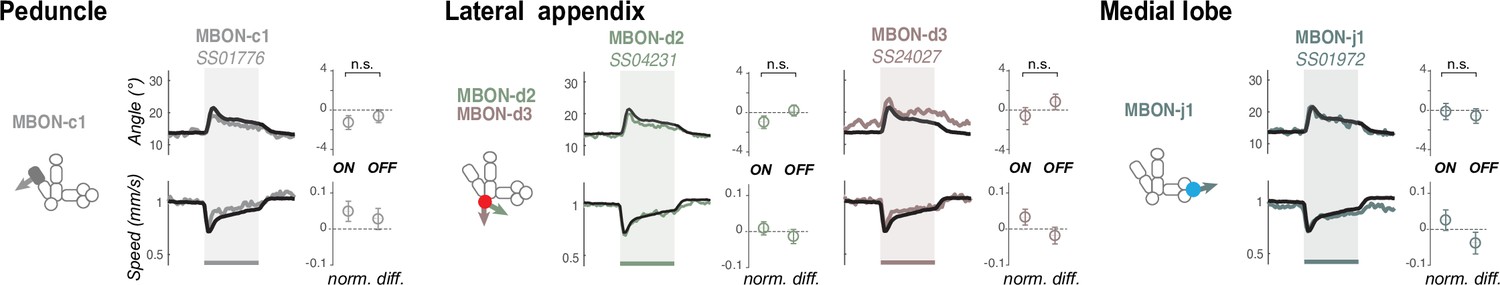
The behavior of larvae expressing CsChrimson in one or two pairs of MBONs were recorded and compared to the response of the control empty driver line to red light (black, which itself shows a slight increase in turn in response to light onset). All experiments include at least six runs with ca. 40 animals per run. Here, we show the responses evoked by the lines driving expression in MBONs and that were not significantly different from the control response. The name of the Split-GAL4 line used is shown in italic. The schematics depict the compartments where the MBONs extend their dendrites. Color indicate type of memory induced when the DAN that innervates that compartment is paired with odor (Eschbach et al., 2020): appetitive (blue), aversive (red), or unknown (gray). Plots and quantification as in Figure 2b–g. n.s.: p > 0.05 of difference to control (Welch Z test).
Figure 2—figure supplement 3
Reverse-correlation analysis of turn behavior with optogenetics.
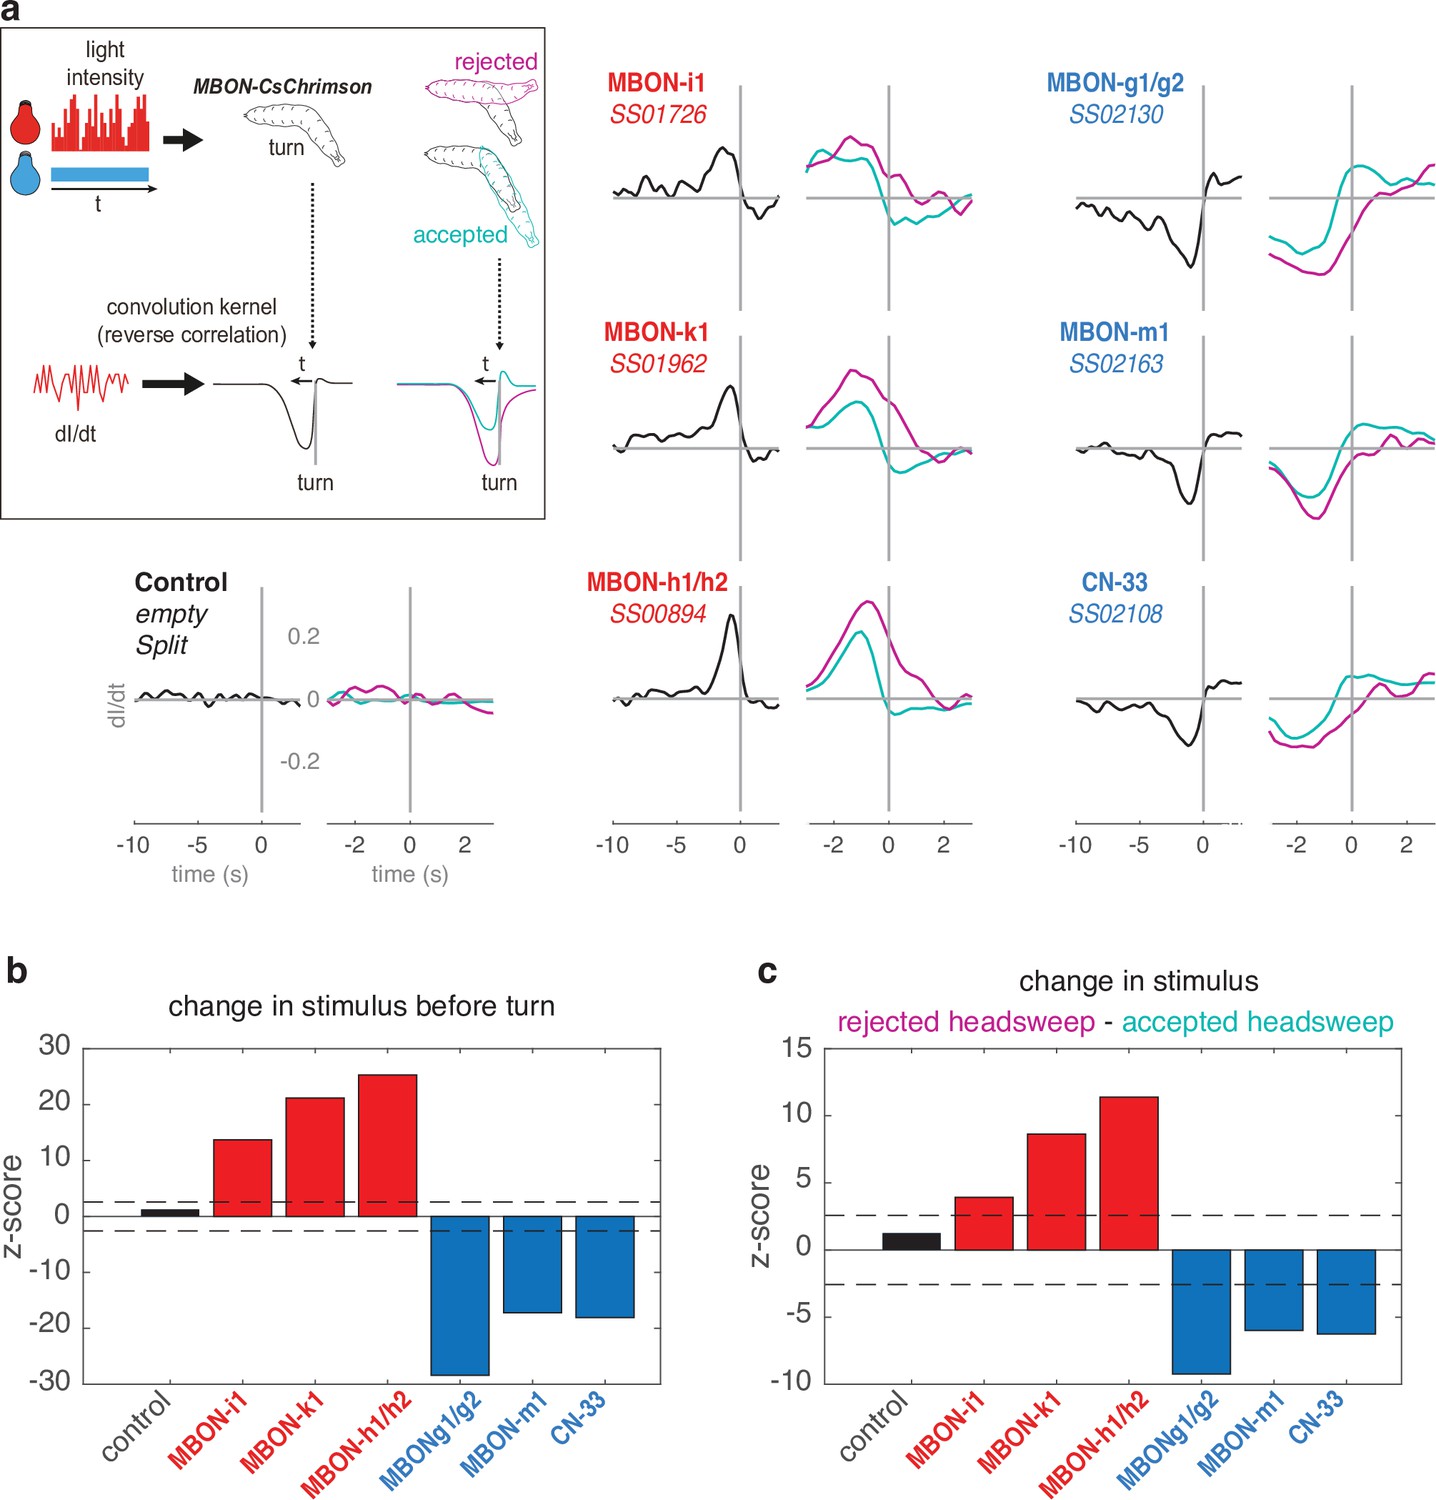
(a) To confirm the opposite roles of negative vs. positive-valence MBONs on turn, we used CsChrimson-mediated temporally varying MBON input. Larvae expressing CsChrimson in pair(s) of MBONs, or control larvae (UAS-CsChrimson x empty Split-GAL4) were exposed to red light of varying intensity (from 0 to 911 μW/cm2, 112 Hz) in addition to constant blue light (3.7 μW/cm2, used to mask the red light). The larva’s navigational decision to initiate turns was modelled as the output of a Linear-Nonlinear-Poisson cascade and reverse-correlation was used to fit parameters to this model, as in Gepner et al., 2015. Left plots (black curves) show the average convolution kernel of the light stimulation correlated with turns. Right plots show convolution kernels obtained that are correlated with accepted turns (i.e. followed by a straight run, therefore accepted redirection, cyan) or with rejected turns (i.e. followed by another turn, magenta). The convolution kernel obtained for control line is flat, indicating that the red light has negligible effect on turn (contrary to the optogenetic activation in Figure 2). An increasing activity in negative-valence MBONs (categorised as such from the constant optogenetic activation experiment presented in Figure 2) correlated with high probability to turn; and higher increase correlated with higher probability to further reject the redirection. On the contrary, decreasing activity in positive-valence MBONs correlated with high probability to turn; and higher decrease correlated with higher probability to further accept the redirection. These results allow categorising MBON-i1, -k1, and h1/h2 as encoding negative valence, and MBON-g1/g2, -m1, and CN-33 as encoding positive valence, consistent with the experimental approach depicted in Figures 2, 5b and 6e. (b) Z-scores associated with the black curves. (c) Z-scores associated with the black curves. In b–c, colored bars indicate significance from zero.
Figure 3 with 6 supplements
Patterns of convergence between innate and learnt olfactory pathways.
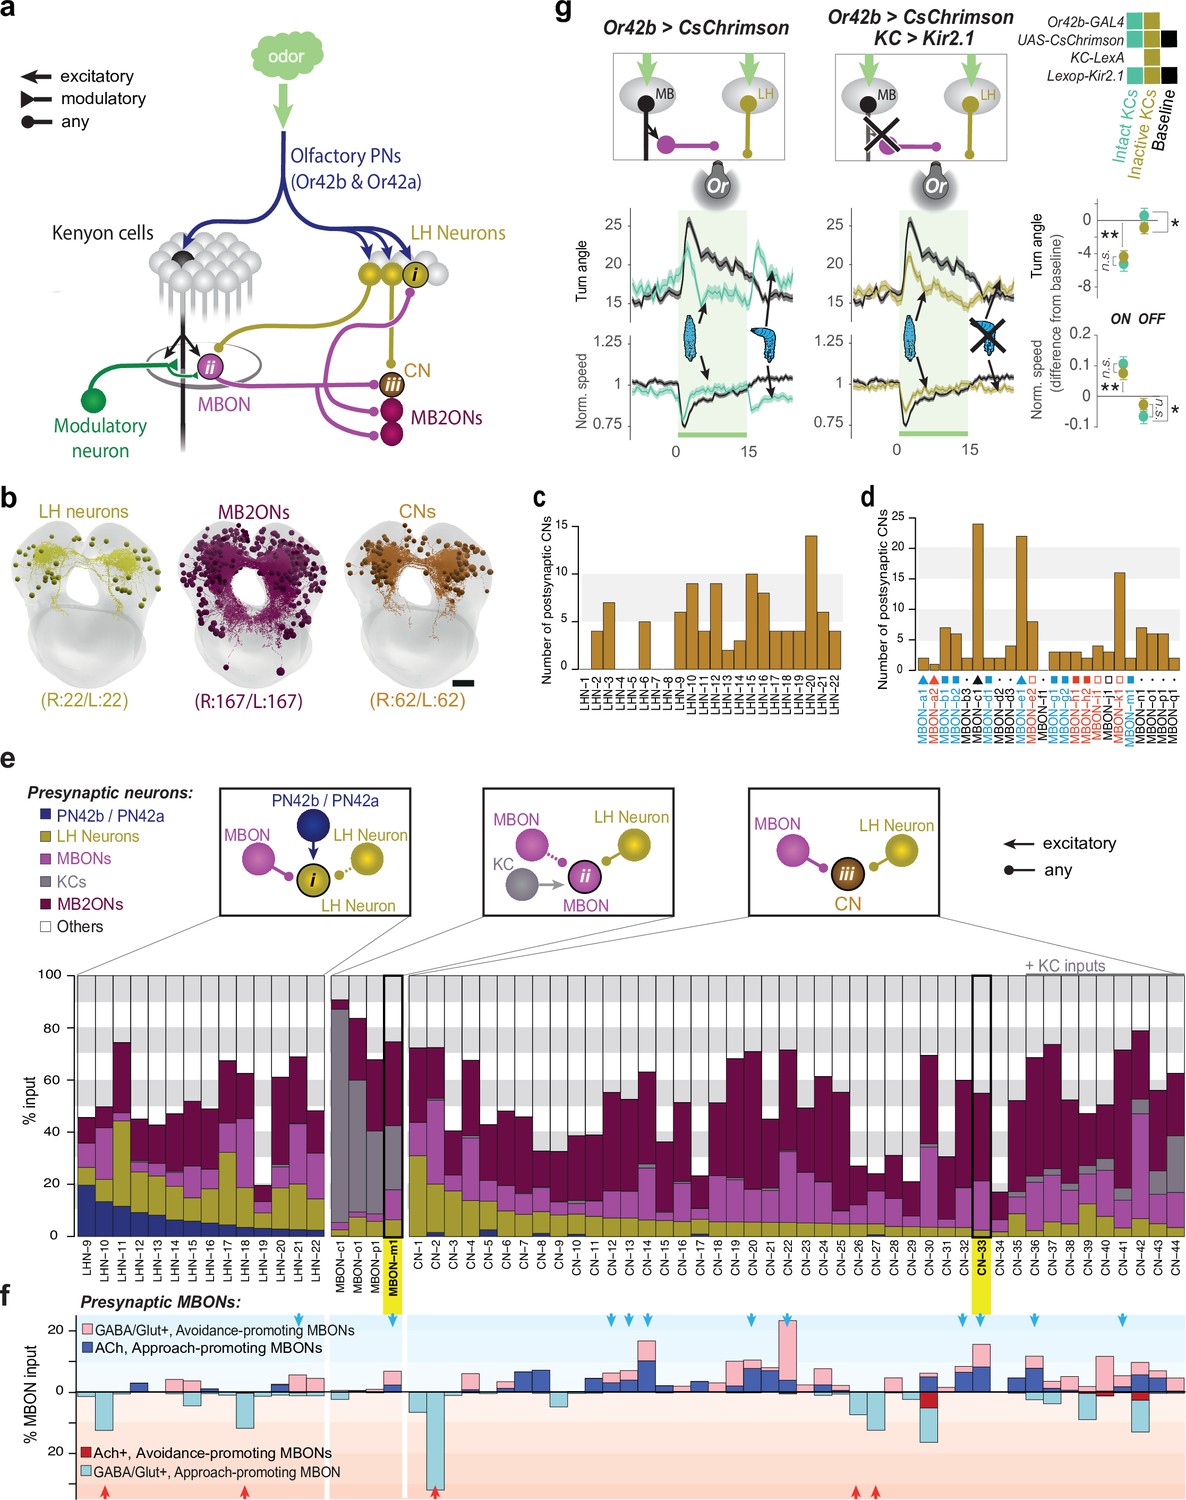
(a) Schematic of interactions between the LH and MB. All neurons (167 pairs) postsynaptic to all MBONs (MB2ONs, dark purple) and all neurons (22 pairs) postsynaptic to two olfactory PNs in an innately attractive LH pathway (LHNs, dark yellow, Figure 3—figure supplement 1). This revealed three types of convergence: (i) some LHNs receive direct MBON input, (ii) some MBONs receive direct LHN input, and (iii) many MB2ONs receive direct MBON and LHN input. Collectively we call neurons that receive convergent MBON and LHN input convergence neurons (CNs). Some LHNs that receive direct MBON input also receive reliable input from other LHNs, and some MBONs (MBON-m1) that receive direct LHN input also receive reliable input from other MBONs(e), and are therefore also CNs (LHN-CNs and MBON-CNs), but we continue to call them LHNs and MBONs for brevity. (b) Projections of the reconstructed brain neurons. (c) Number of CNs downstream of each LHN. Some target more CNs than others. (d) Number of CNs downstream of each MBON. Some target more CNs than others. (e) All identified neurons receiving convergent LH and MB inputs. Top schematics show the three different types of convergent interactions described in (a). The bar graphs show the fraction of inputs each neuron receives from different types of neurons. Some CNs receive direct KC input, but were not classified as MBONs because connections from individual KCs were weak ( < 3 synapses) or asymmetric ( ≥ 3 KC connection(s) only present in one hemilateral partner) (CN-35,–36, −37,–38, −39,–40, –42), KC inputs were axo-axonic (CN-43), or do not receive any modulatory neuron input (CN-44, Eichler et al., 2017). Some CNs receive asymmetric or subthreshold PN input (e.g. CN-5) and are therefore not considered LHNs. f. Some CNs were predicted to encode positive (blue arrows) or negative (red arrows) value based on MBON inputs. Figure shows fraction of input each neuron receives from inhibitory (light blue, bottom) or excitatory (dark blue, top) positive-valence MBONs (respectively 6 and 2 MBONs form these categories), and inhibitory (light red, top) or excitatory (dark red, bottom) negative-valence MBONs (respectively 5 and 1 MBONs form these categories). CNs receiving excitatory and inhibitory inputs from positive- and negative-valence MBON(s), respectively, or inhibitory inputs from multiple negative-valence MBONs could encode positive valence (blue arrows). CNs integrating inhibitory inputs from multiple positive-valence MBONs could encode negative valence (red arrows). Only neurons with at least 5% of input from the appropriate MBONs were included in the predictions (blue arrows, red arrows). g. Increase in ORN42b activity (as when the animal crawls towards an odor source) represses turning via the LH pathway, indicating this LH pathway signals positive valence. Plots and quantification as in Figure 2b–f. Left, In untrained larvae, onset and offset of optogenetic activation of ORN42b reduced and increased turning, respectively (cyan, N = 250), compared to controls (black, N = 350). Middle, Silencing KCs with Kir2.1 (dark yellow, N = 300) did not alter the onset response but abolished the offset response. Right, quantification. *: p < 0.05, **: p < 0.01 (Welch’s Z test).
-
Figure 3—source data 1
Value angles showing turn responses of animals during activation of Or42b with or without functional MB.
Mean and std values of the turn angles over time in the different experimental groups shown in Figure 3g.
- https://cdn.elifesciences.org/articles/62567/elife-62567-fig3-data1-v3.csv
Figure 3—figure supplement 1
Connectivity matrix.
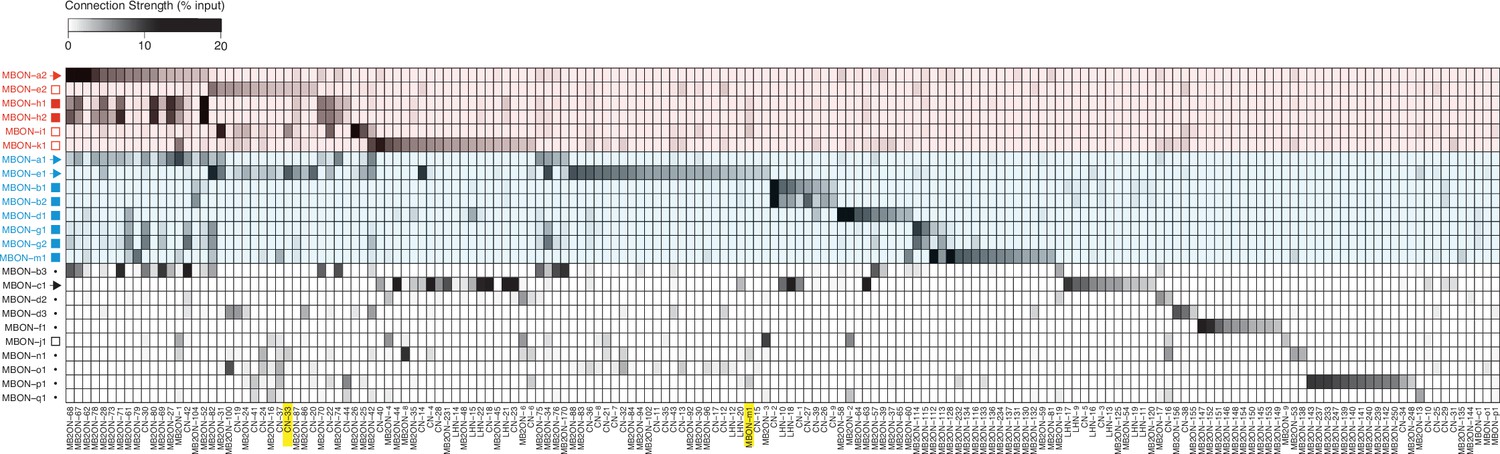
Connectivity matrix showing normalized synaptic input (expressed as % input) neuron (columns) receives from each MBON (rows). MBONs are color-coded according to the type of behavior they promote (Figure 2b–g and i): approach (blue), avoidance (red), or unde- fined/unknown (black). The symbols indicate neurotransmitter they release when known from previous immunostaining experiments (Eichler et al., 2017). Colored shades indicate the type of behavior MBONs promote: approach (blue), avoidance (red). Yellow boxes highlight neurons which were functionally investigated, namely CN-33 and MBON-m1. Normalized synaptic input (% input) is calculated by number of synapses per cell, divided by total number of postsynaptic sites in the column neuron.
Figure 3—figure supplement 2
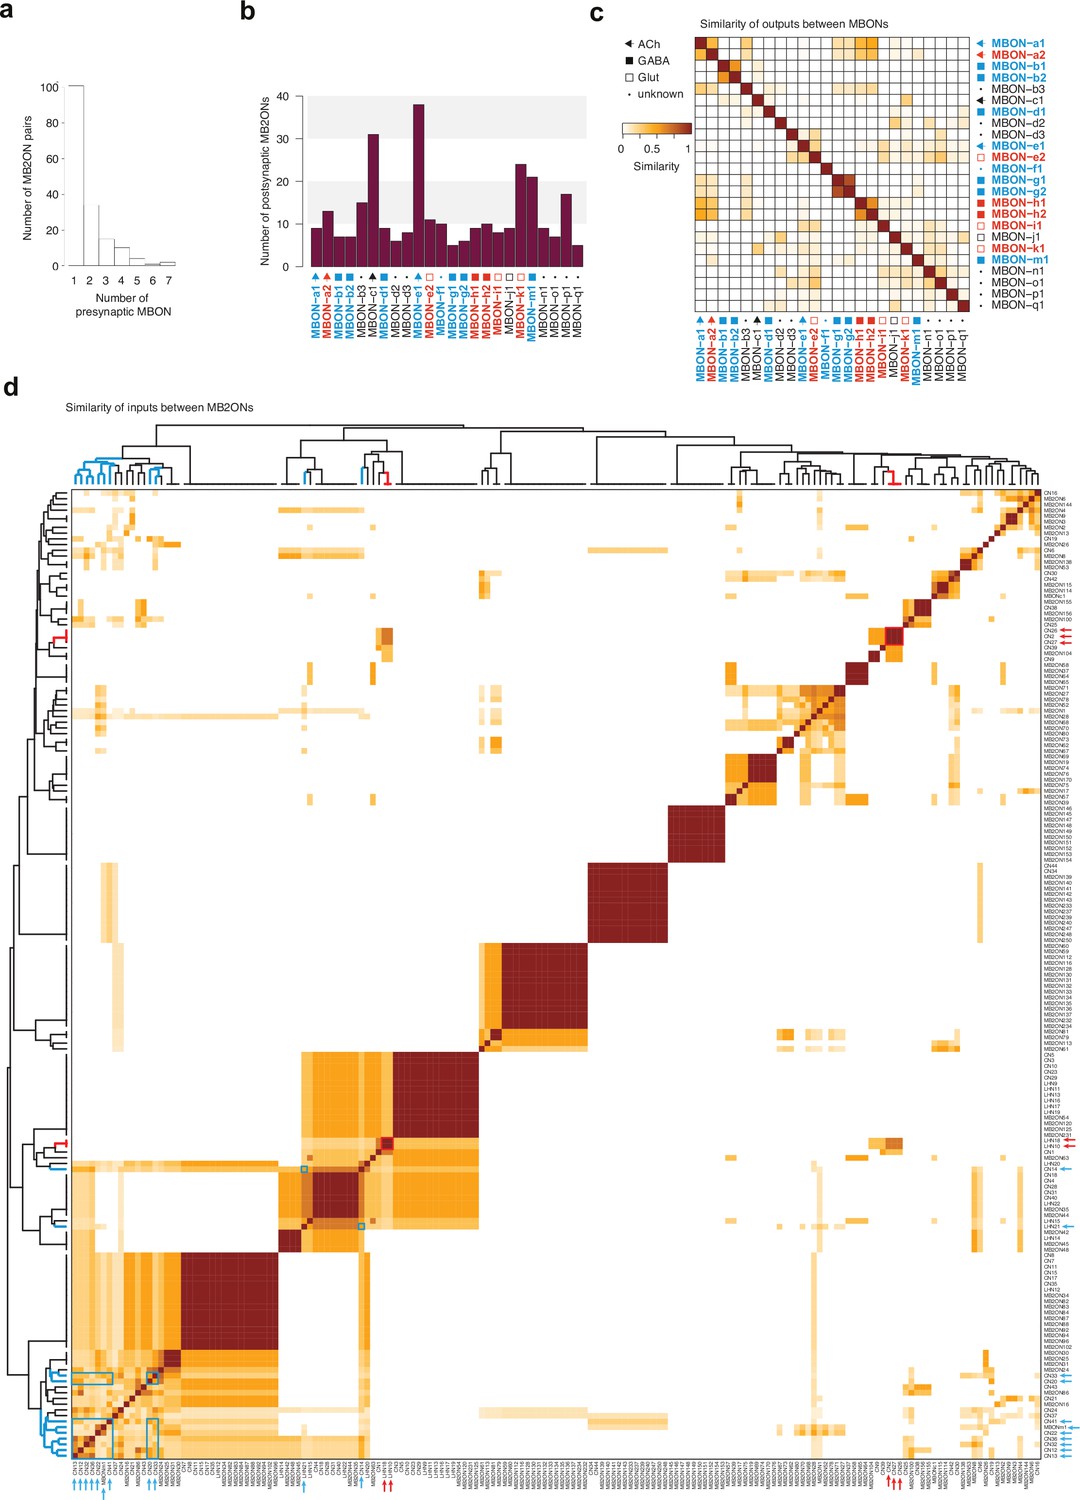
Analysis of M2BONs inputs.
For all the analyses (a–d), left-right homologous neurons are pooled. (a) Histogram of number of strong presynaptic connections from MBONs to each MB2ON. (b) Number of strong postsynaptic connections onto MB2ONs from each MBON. (c) Matrices of similarity between MBONs based on their outputs onto MB2ONs. Similarity is obtained by counting the total number of outputs in a row neuron that are also outputs in a column neuron (matches) and counting the total number of outputs that are only observed in row or column neurons, but not both (mismatches). The similarity score is the total number of matches, divided by the total number of matches and mismatches. An output connection is only considered if there are at least three synapses from the presynaptic left neuron and three synapses from the presynaptic right neuron onto the postsynaptic left and right neurons and a sum of at least 10 synapses total. Ipsilateral and contralateral connections are considered. Most MBONs have a unique combination of postsynaptic partners and display low similarity scores. (d) Similarity matrix of MB2ONs based on their total number of inputs from MBONs. Methodology similar to c., but comparing column neuron inputs, instead of row neuron outputs. Many MB2ONs have low similarity scores but there are some groups that receive strong connections from the same MBON(s). Hierarchical clustering was applied to the similarity scores to sort MB2ONs. Blue and red arrows indicate positive and negative value neurons, respectively, independently predicted based on MBON inputs (from Figure 3f). Blue and red boxes highlight similarity between the predicted positive and negative value neurons, respectively, within clusters.
Figure 3—figure supplement 3
Circuit diagram of MBONs and LHNs.
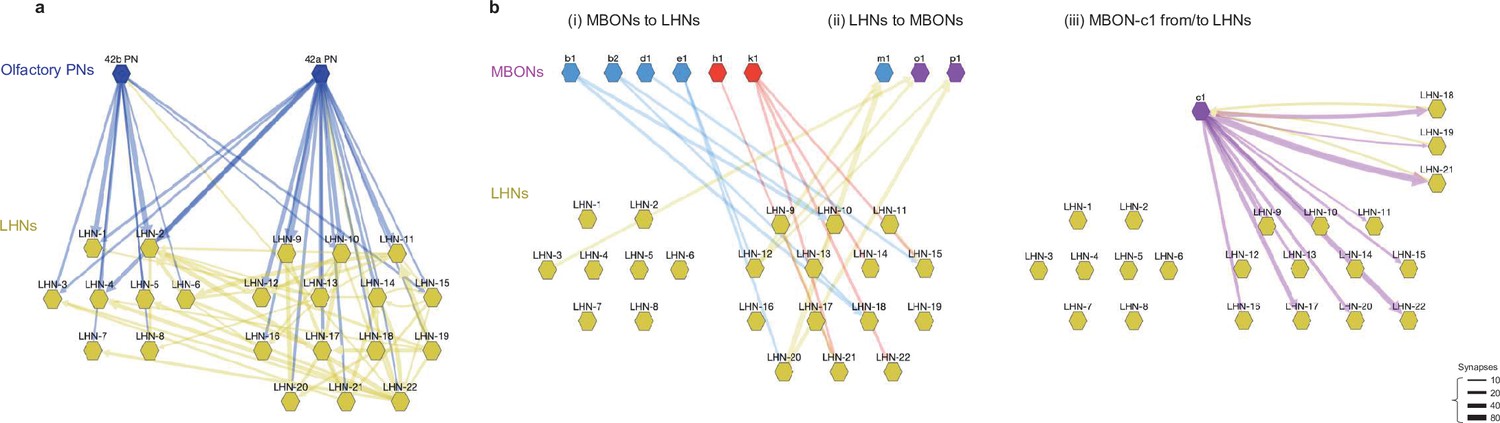
(a) The EM circuit graph of the 22 LHNs downstream of PN42a and PN42b olfactory PNs (tuned to attractive odors). The network reveals many common targets for the two types of PNs and tight interconnection between these putatively appetitive LHNs. Each node represents a pair of left-right homologous neurons. Connections with fewer than 10 synapses are not included. The left cluster of LHNs 1–8 is not postsynaptic to MBONs, whereas the right cluster of LHNs 9–22 is. (b) Detailed EM circuit graph showing MBONs and LHN interactions: (i) synaptic connections from MBONs to LHNs (blue and red; MBON that promote approach and avoidance, respectively), (ii) synaptic connections from LHNs to MBONs (yellow arrows), (iii) MBON-c1 from/to LHNs. Unlike other MBONs, MBON-c1 has reciprocal connections with some LHNs (yellow arrows from LHNs, purple arrows to LHNs).
Figure 3—figure supplement 4
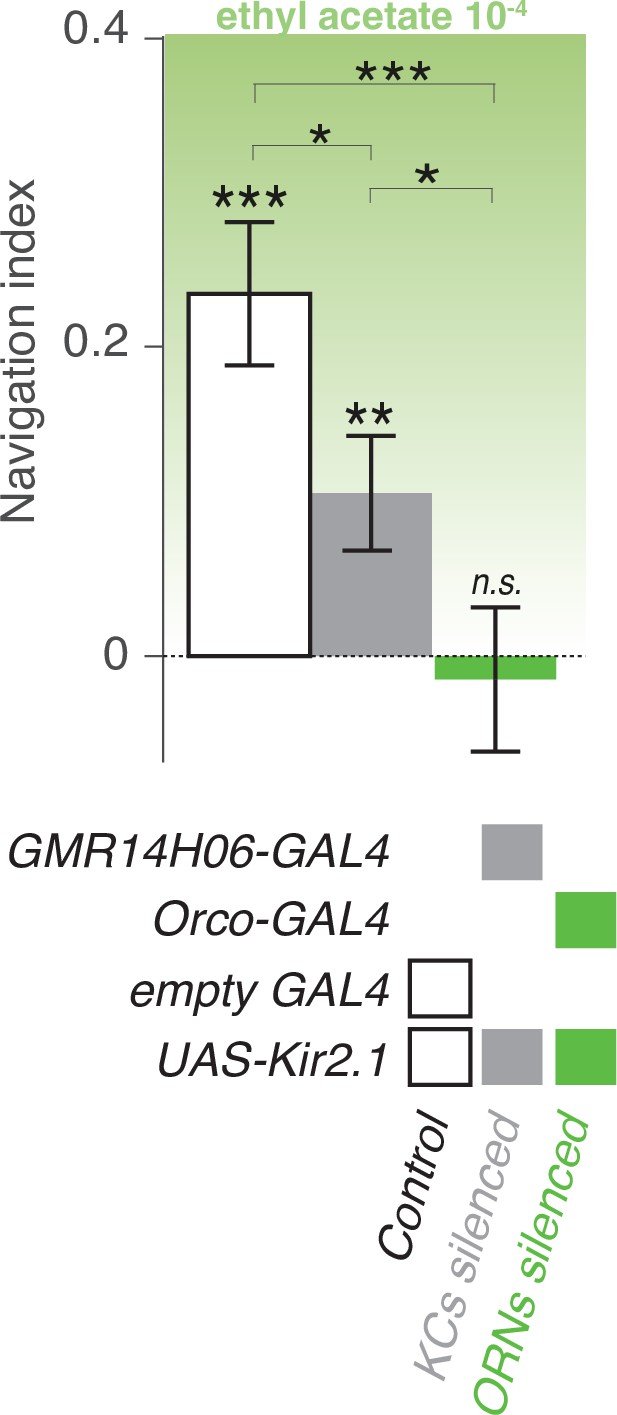
Functioning Kenyon Cells are required for normal approach behavior of an odor.
The behavior of larvae in a linear gradient of an innately attractive odor (EA) is assessed in naive larvae with silenced KCs (using GMR14H06-GAL4 crossed to UAS-Kir2.1) and ORNs (using orco-GAL4 crossed to UAS-Kir2.1). The navigational index in larvae with non functioning MBs is lower than the in control larvae (empty GAL4 crossed to UAS-Kir2.1), but navigation is not abolished (navigation index is significantly higher than 0). Inhibiting ORNs abolishes navigation. *: p < 0.05, **: p < 0.01, ***:p < 0.001 (Welch Z test).
Figure 3—figure supplement 5
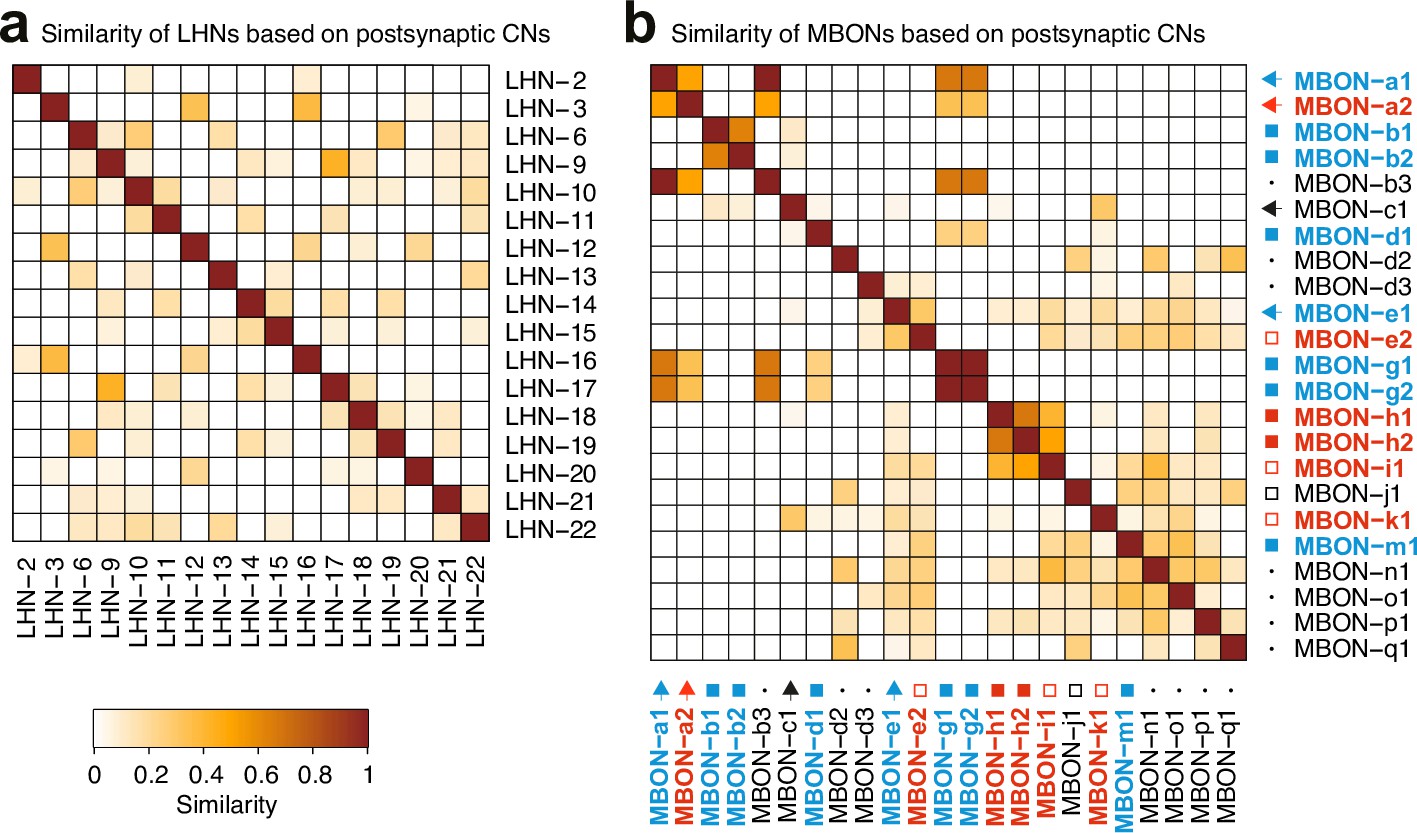
AnalysiCof CNs inputs.
a-b. Matrices of similarity between neurons based on their output connections onto CNs, defined as the subset of MB2ONs which receives inputs from both the LH pathway downstream of ORN42a/ORN42b and MBONs. Similarity is obtained following the method described in Figure 3—figure supplement 2c. (a). Similarity matrix of LHNs based on outputs to CNs. (b) Similarity matrix of MBONs based on outputs to CNs. Most MBONs and LH neurons have a unique combination of postsynaptic CN partners.
Figure 3—figure supplement 6
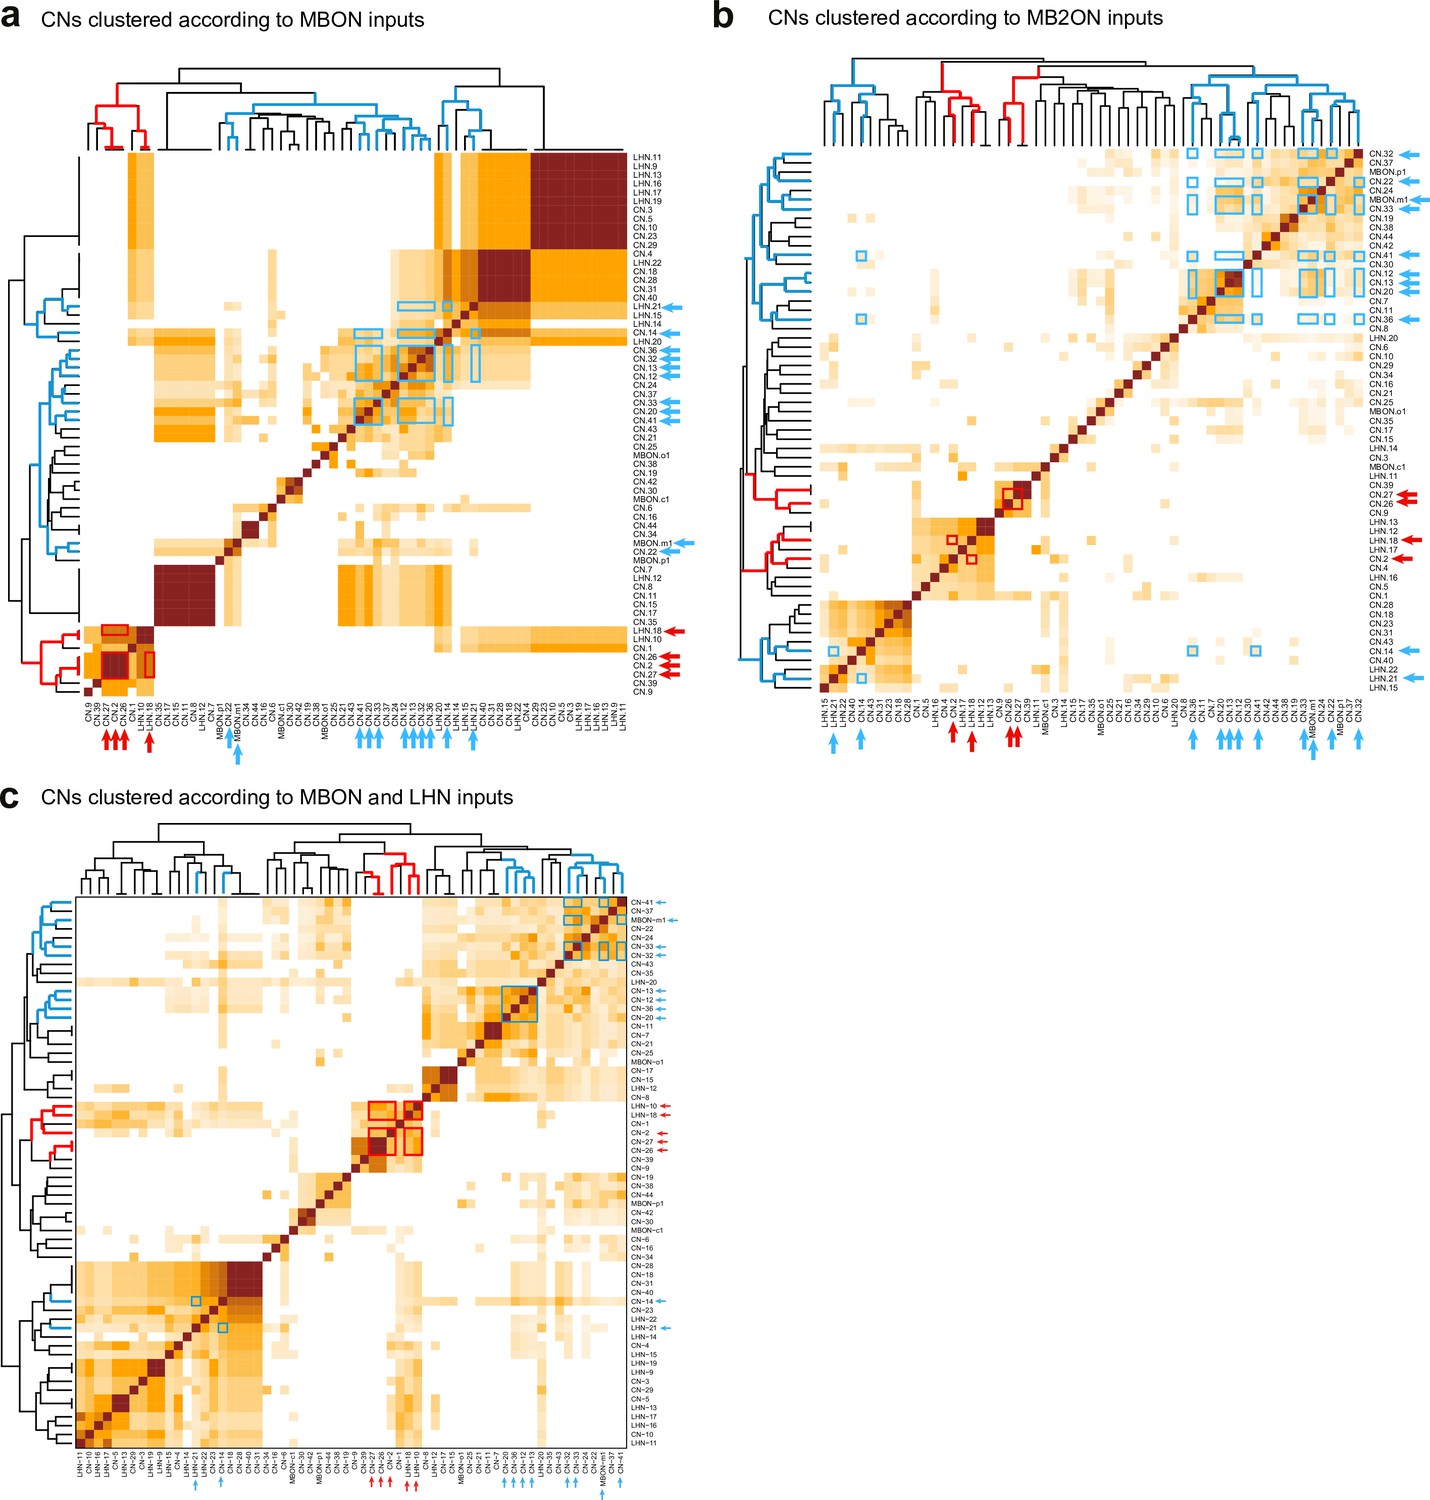
Clustering of CNs based on their different kinds of inputs.
Hierarchical clustering was applied to the similarity scores to sort them based on total number of inputs from the different populations of neurons considered. Most CNs receive a unique combination of inputs but CNs with similar predicted valence share common inputs not only from MBONs (a), used to estimate their valence, but also from MB2ONs (b), and when considering both inputs from MBONs and LHNs (c). Blue and red arrows indicate positive and negative valence neurons, respectively, predicted based on MBON inputs (from Figure 3f). Blue and red boxes highlight similarity between the predicted positive and negative valence neurons, respectively, within clusters.
Figure 4 with 2 supplements
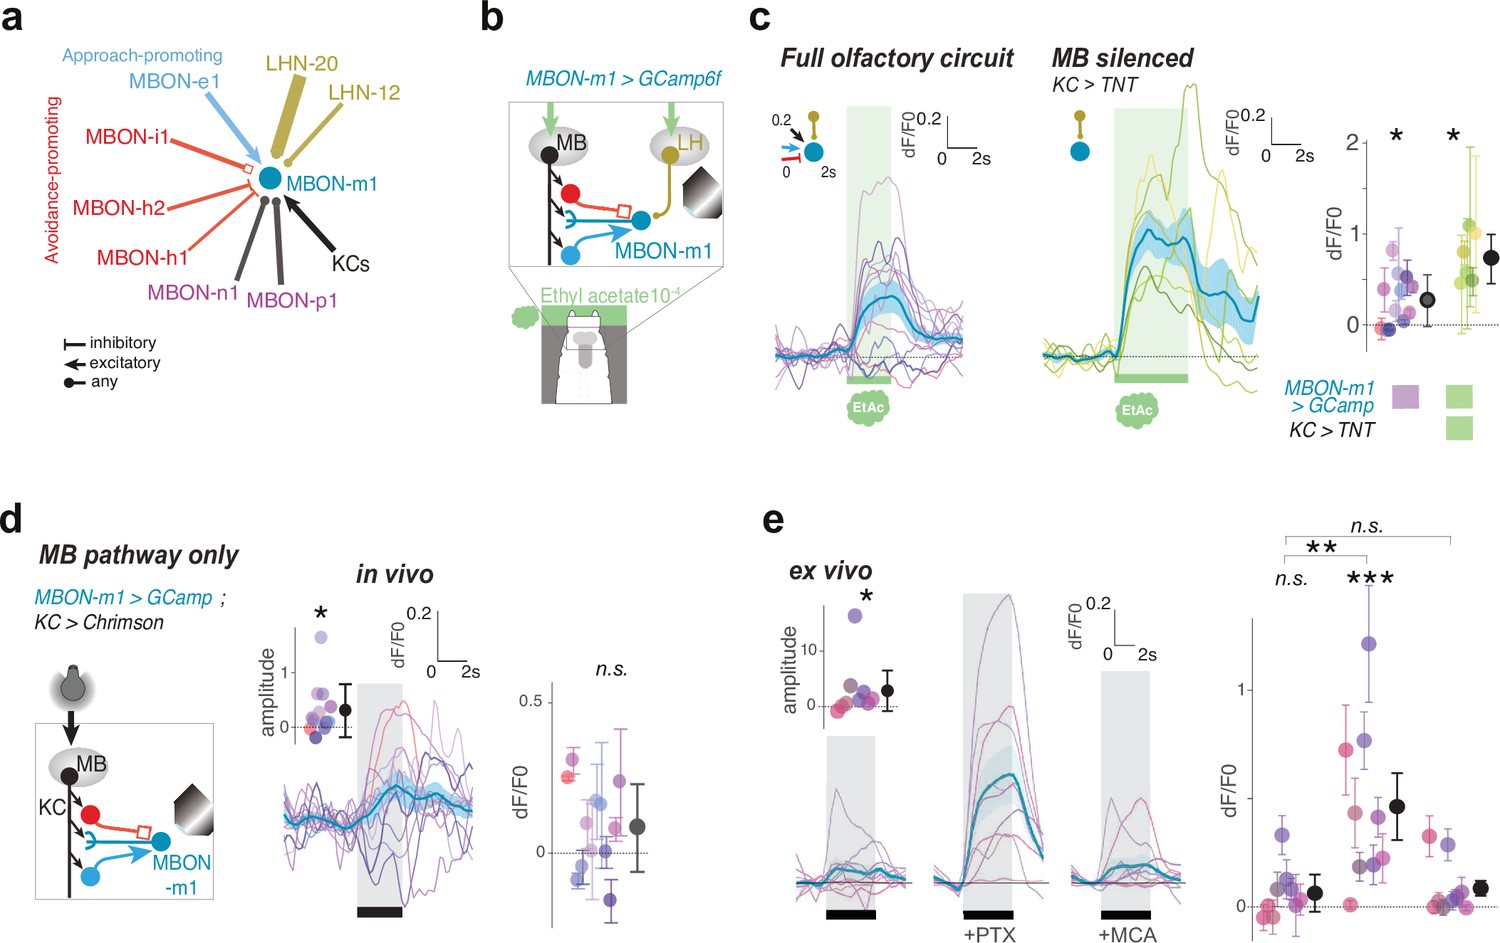
MBON-m1 receives functional inputs from LH and MB.
(a) MBON and LHN inputs onto MBON-m1 revealed by EM reconstruction. (b) Calcium activity of MBON-m1 in response to an innately attractive odor (EA) (c) and/or to optogenetic activation of CsChrimson-expressing KCs (d) was imaged in vivo in first instar larvae immobilised in a microfluidic chip as in Si et al., 2019. (c–e) Plots show fluorescence normalized to baseline (prior to odor presentation, δF/F0). Scores are calculated for the first 3 s of odor presentation. *: p < 0.05, **: p < 0.01, ***: p < 0.001, Wilcoxon test. See Figure 4—figure supplement 2 for individual animal responses. (c) Left, In untrained larvae MBON-m1 is excited by the innately attractive odor (N = 12). Middle, Silencing the MB pathway (by expressing TNTe in KCs) does not impair the excitatory response of MBON-m1 to the innately attractive odor (N = 6). This confirms a functionally excitatory connection from LHNs to MBON-m1. Right, quantification shows significant MBON-m1 responses to odor in the presence (left) and absence (middle) of a functional MB pathway. The comparison suggests that in the naive animals the excitatory odor drive could come mainly from the LH pathway. (d) Across the population of untrained larvae, the average change in δF/F0 in response to optogenetic activation of KCs is not significantly different from 0. However, the amplitude of δF/F0 (|max δF/F0 - min δF/F0|) was significantly increased after, compared to before, KC activation, suggesting that MBON-m1 receives functionally excitatory inputs from the MB in some individuals, and inhibitory in others (N = 12). (e) Activation of KCs in brain explants together with pharmacological blockers confirm mixed inhibitory and excitatory inputs from the MB pathway (N = 9). In saline, MBON-m1 response to KC activation does not differ from zero, with excitatory or inhibitory responses depending on individuals (inset shows the amplitudes of the responses significantly differ from zero). However, when bathed with PTX, thereby blocking chloride gating GABA and glutamate receptors, MBON-m1 is robustly excited by KC activation. Bath with MCA mostly abolishes the response to KC activation.
-
Figure 4—source data 1
Individual GCaMP fluorescence values in response to odour presentation by MBON-m1 of animals with intact olfactory pathway.
Fluorescence values of the ROI over time for each repeats and each individuals as plotted in Figure 4c (left panel).
- https://cdn.elifesciences.org/articles/62567/elife-62567-fig4-data1-v3.csv
-
Figure 4—source data 2
Individual GCaMP fluorescence values in response to odour presentation by MBON-m1 of animals with silenced MB.
Fluorescence values of the ROI over time for each repeats and each individuals as plotted in Figure 4c (right panel).
- https://cdn.elifesciences.org/articles/62567/elife-62567-fig4-data2-v3.csv
-
Figure 4—source data 3
Individual GCaMP fluorescence values in response to Kenyon cells optogenetic activation by MBON-m1.
Fluorescence values of the ROI over time for each repeats and each individuals as plotted in Figure 4d.
- https://cdn.elifesciences.org/articles/62567/elife-62567-fig4-data3-v3.csv
Figure 4—figure supplement 1
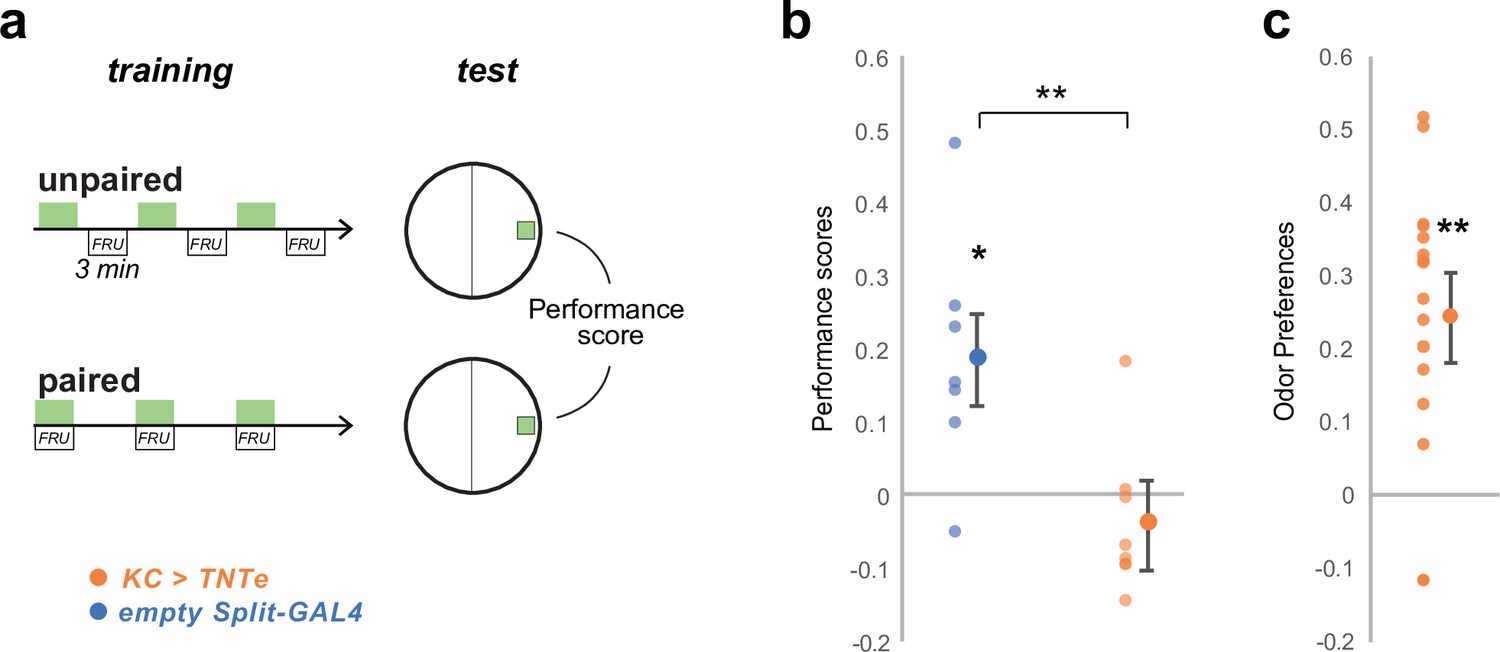
Silencing KC impairs olfactory memory performances but maintains olfactory perception.
We verified that silencing KCs with TNTe (KC> TNTe) as in Figures 4c and 6 impairs associative learning as a control to show that the same inactivation method is working. (a) We trained groups of 30 third-instar larvae in sets of two. For each pair, one group, the ‘paired group’, was presented with EA (green rectangles) and fructose-supplemented agar for three times 3-min-long pairing intercalated with 3 min of no odor and pure agar. The other group, the ‘unpaired group’, received EA for 3 min and fructose-supplemented agar for the three next min, three times with no overlapping. The two groups were then tested for their preference for EA, which was estimated by PrefEA = (NEA – Nair) / (NEA+ Nair), and a Performance Score was computed by subtracting the PrefEA in the ‘paired’ group to the PrefEA obtained in the ‘unpaired’ group. A positive score indicates appetitive memory, whereas a zero score indicates no memory. (b) The third-instar larvae with silenced KCs (KC> TNTe; N = 8) did not show appetitive short-term memory while the control line (empty Split-GAL4, N = 7) did. *: p < 0.05, **: p < 0.01, Wilcoxon test. Individual data points and mean ± s.e.m. are shown. (c) The experimental larvae (KC> TNTe N = 8) still exhibited attraction to the trained odor, indicating that learning performance was abolished, but odor navigation was not fully abolished. Statistics are the same as in b.
Figure 4—figure supplement 2
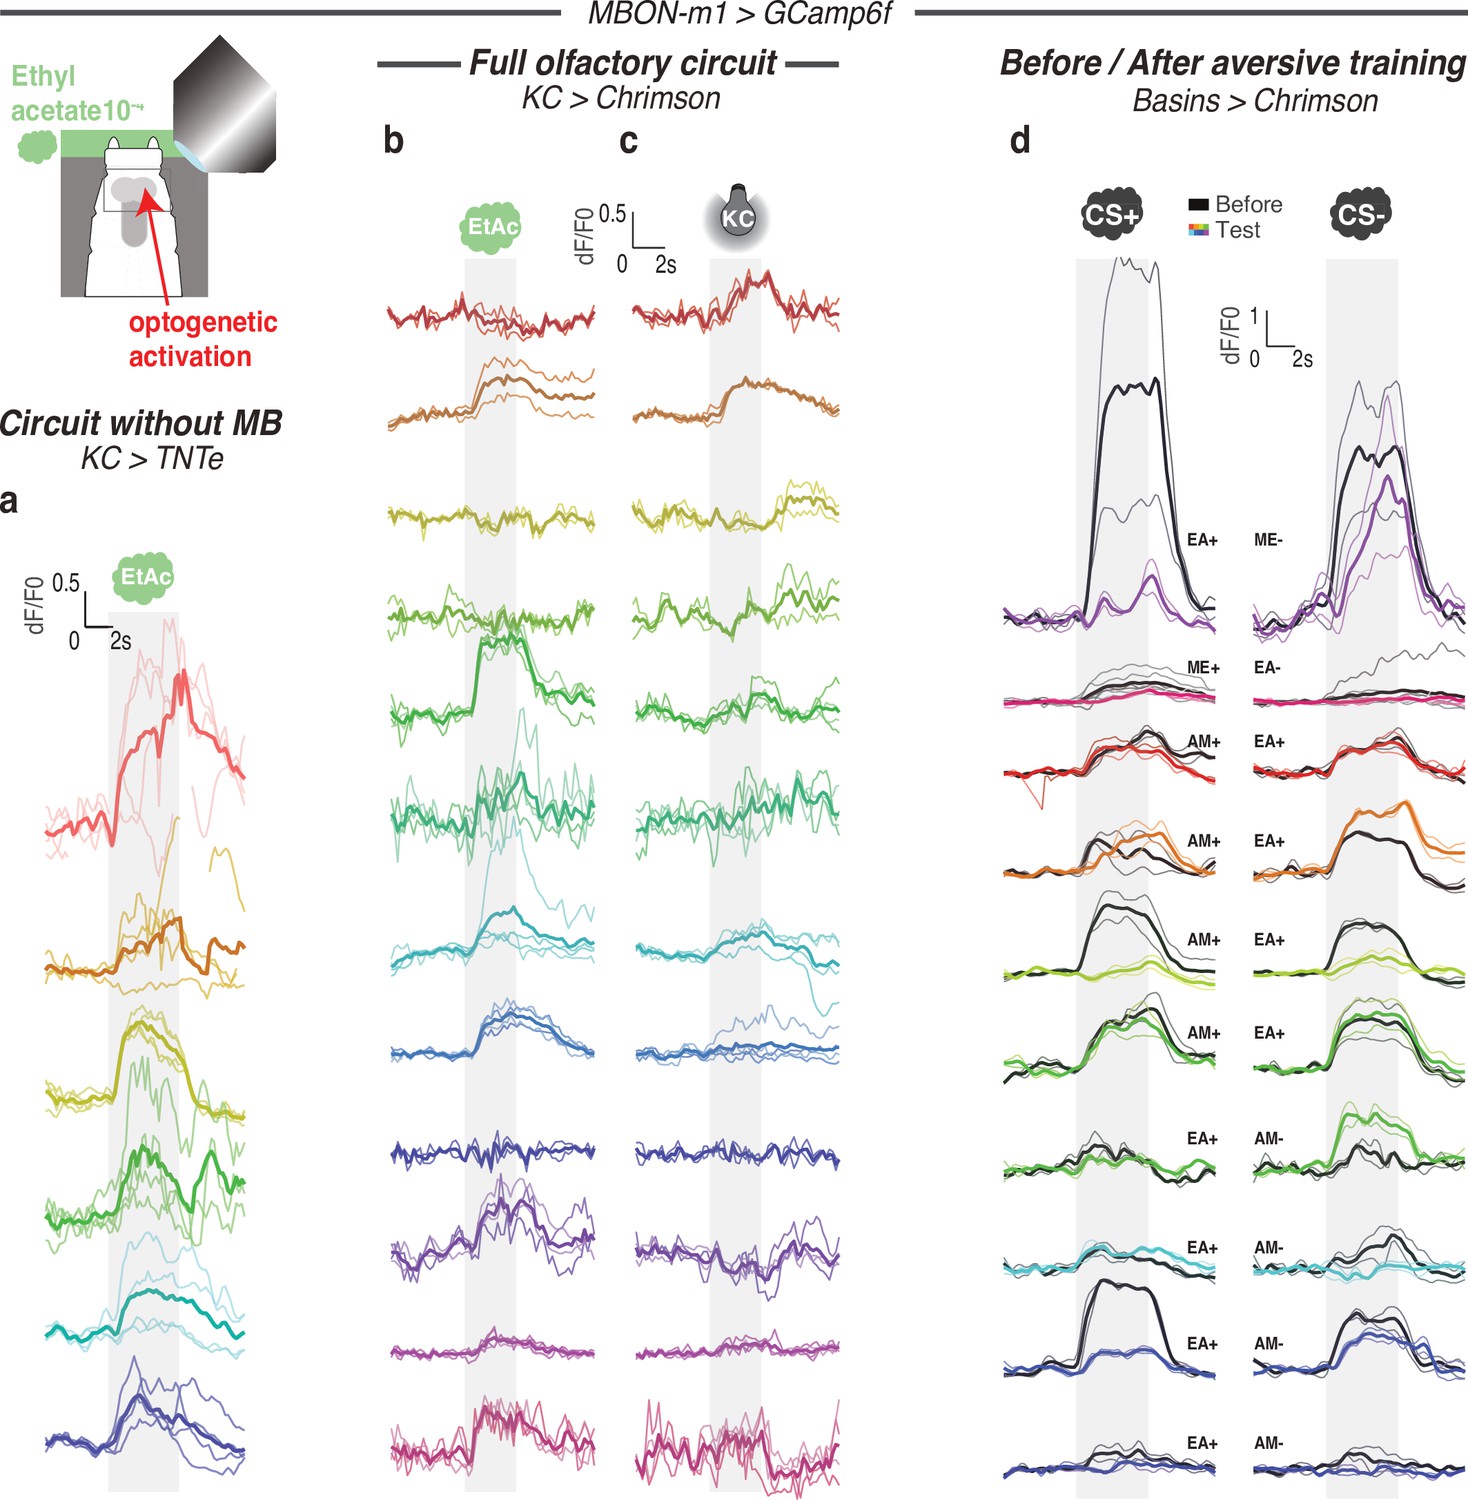
Calcium responses of MBON-m1 for each individual.
Calcium activity of MBON-m1 was imaged in vivo (using SS02163-GAL4> UAS-GCamp6f) in first instar larvae immobilised in a microfluidic device (Si et al., 2019) and exposed to the odor EA (a,b,d) and/or to optogenetic activation of CsChrimson-expressing KCs (c,d). Each curve shows fluorescence normalized to baseline (before odor presentation) for each repeat (2–4) per animal (mean +/− s.e.m.). Each color corresponds to one individual, thicker curve is averaged response for this individual. In b-c responses in the same animal to different kinds of stimulations (odor or KC activation) are shown in the same color. Smoothed averaged individual responses are also shown in Figures 4c–d ,–5a. (a) Response of MBON-m1 to EA in larvae with silenced MB (using 14H06-LexA> LexAop TNTe). (b) Response of MBON-m1 to EA in larvae with intact MB (in 14H06-LexA> LexAop-CsChrimson). (c) Response of MBON-m1 to activation of MB (using 14H06-LexA> LexAop-CsChrimson). (d) Response of MBON-m1 to two odors, CS+ and CS-, before (in black) and after (in color) the CS+ was paired with optogenetic activation of the nociceptive neurons Basins (olfactory aversive training).
Figure 5 with 1 supplement
MBON-m1 activity regulates approach and is modified by experience.
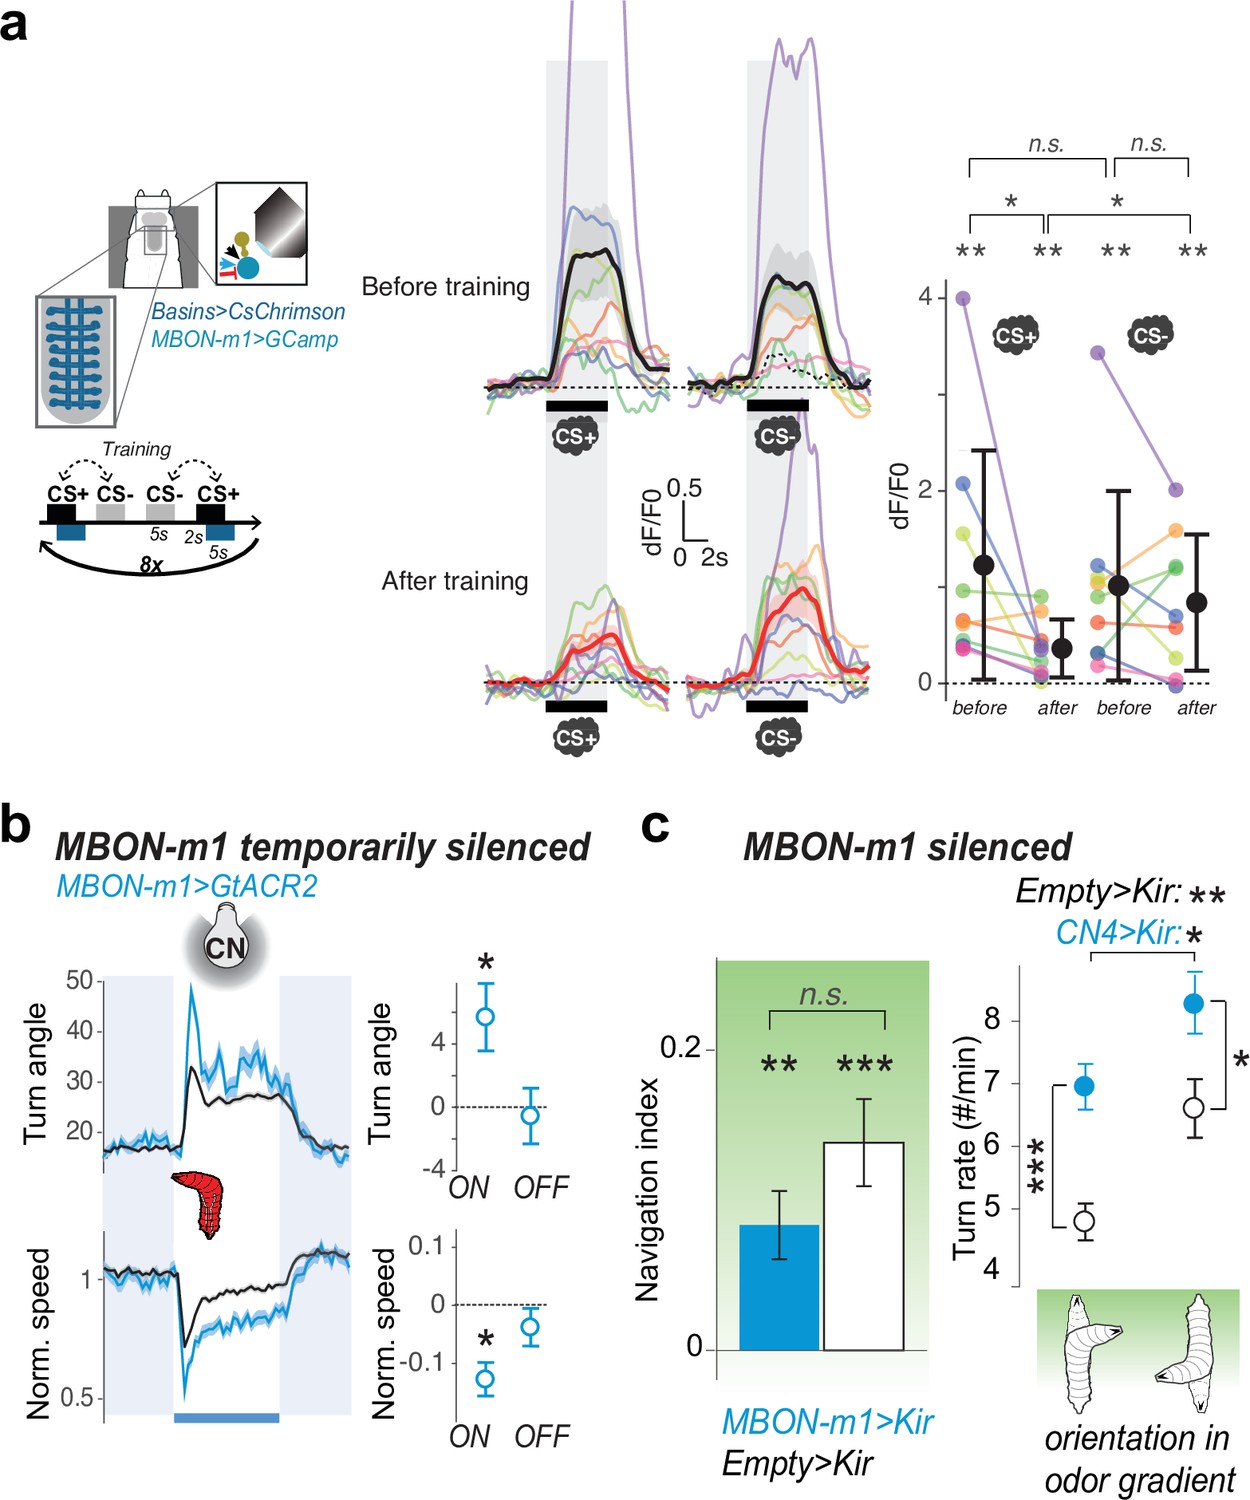
(a) Calcium activity of MBON-m1 was imaged in vivo (as in Figure 4b), before and aversive after training. Fictive punishment (optogenetic activation of Basins) was delivered 2 s after the exposure to the paired odor (CS+). Another odor (CS-) was presented without punishment. The response to CS+, but not to CS-, significantly decreased after training (N = 9). Curves show average fluorescence normalized to baseline (i.e. before odor presentation)+/− s.e.m. Plots show mean fluorescence scores during odor delivery per animal, and their average+/− s.e.m. in black. The odors presented were different for different animals and were one of the following 4 combinations of CS+/CS- odors: n-amyl acetate AM+/EA- (N = 4), EA+/AM- (N = 3), EA+/ME- (N = 1), ME+/EA- (N = 1) (where AM: n-amyl acetate 10–3, EA: ethyl acetate 10–4, ME: methanol 10–1). *: p < 0.05, **: p < 0.01 in a paired Wilcoxon test. (b) Acute optogenetic silencing of MBON-m1 (with GtACR2, Nexp = 4, Nlarvae = 95; control empty line: Nexp = 20, Nlarvae = 700) increases turning, in contrast to its activation which reduces turning (Figure 2f). Plot and quantification as in Figure 2b–g. *: p < 0.05 in Welch’s Z test. (c) Constitutively silencing MBON-m1 (with Kir2.1, Nexp = 9; control empty line: Nexp = 10) also induced an increase in turn frequency during odor navigation (in a gradient of ethyl acetate), consistent with acute inactivation results (left panel), *: p < 0.05, **: p < 0.001, ***: p < 0.0001 in Welch’s Z test. We also observed a reduction in the approach of the attractive odor source, likely due to a reduced ability to modulate turn rate as a function of orientation in odor gradient, but the effect did not reach significance (right panel), n.s.: p > 0.05.
-
Figure 5—source data 1
GCaMP responses to presentation of unpaired odour by MBON-m1 in animals after pairing odour and aversive stimulation.
Fluorescence values of the ROI over time for each presentation of CS+ and each individuals as plotted in Figure 5a.
- https://cdn.elifesciences.org/articles/62567/elife-62567-fig5-data1-v3.csv
-
Figure 5—source data 2
GCaMP responses to presentation of paired odour by MBON-m1 in animals after pairing odour and aversive stimulation.
Fluorescence values of the ROI over time for each presentation of CS- and each individuals as plotted in Figure 5a.
- https://cdn.elifesciences.org/articles/62567/elife-62567-fig5-data2-v3.csv
-
Figure 5—source data 3
Value angles showing turn responses of animals during optogenetic silencing of MBON-m1.
Mean and std values of the turn angles over time in the different experimental groups shown in Figure 5b.
- https://cdn.elifesciences.org/articles/62567/elife-62567-fig5-data3-v3.csv
Figure 5—figure supplement 1
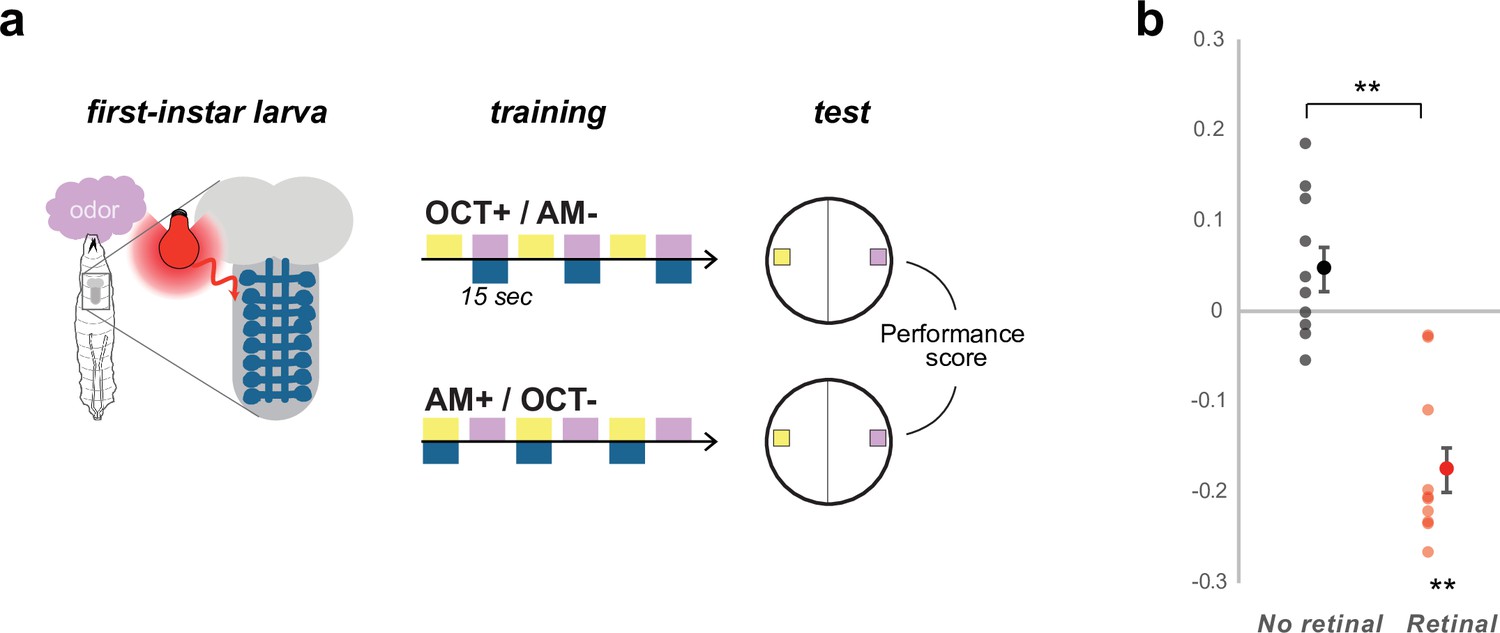
Learning performances in first-instar larvae.
Most learning paradigms are done in third-instar larvae, although first-instar larvae are also capable of robust appetitive associative- learning using optogenetic stimuli (Eichler et al., 2017). Here, we demonstrated once more that the first instar larvae are capable of aversive associative learning using the same optogenetic US as in Figure 5. (a) We trained pairs of groups of 30 first-instar larvae to associate either 3-octanol (OCT+) or n-amyl acetate (AM+) with optogenetic activation of the aversive Basins neurons (drawn in dark blue) for 15 s long pairing whereas the other odor was presented alone for 15 s. The larvae were then tested for their choice between the two odors, which was estimated by PrefAM = (NAM – NOCT) / (NAM + NOCT), and a Performance Score was computed by subtracting the PrefAM after OCT+/AM- training to the PrefAM obtained in the group that received AM+/OCT- training. A negative score indicates aversive memory, whereas a zero score indicates no memory. (b) The first-instar larvae of the same genotype as in Figure 5 form an aversive short-term memory if they were raised in the presence of trans-retinal in the food (necessary for a functional channelrhodopsin and thus for the aversive neurons to be depolarized during training), but not if they were raised without retinal. N = 10, **: p < 0.01, Wilcoxon test.
Figure 6 with 2 supplements
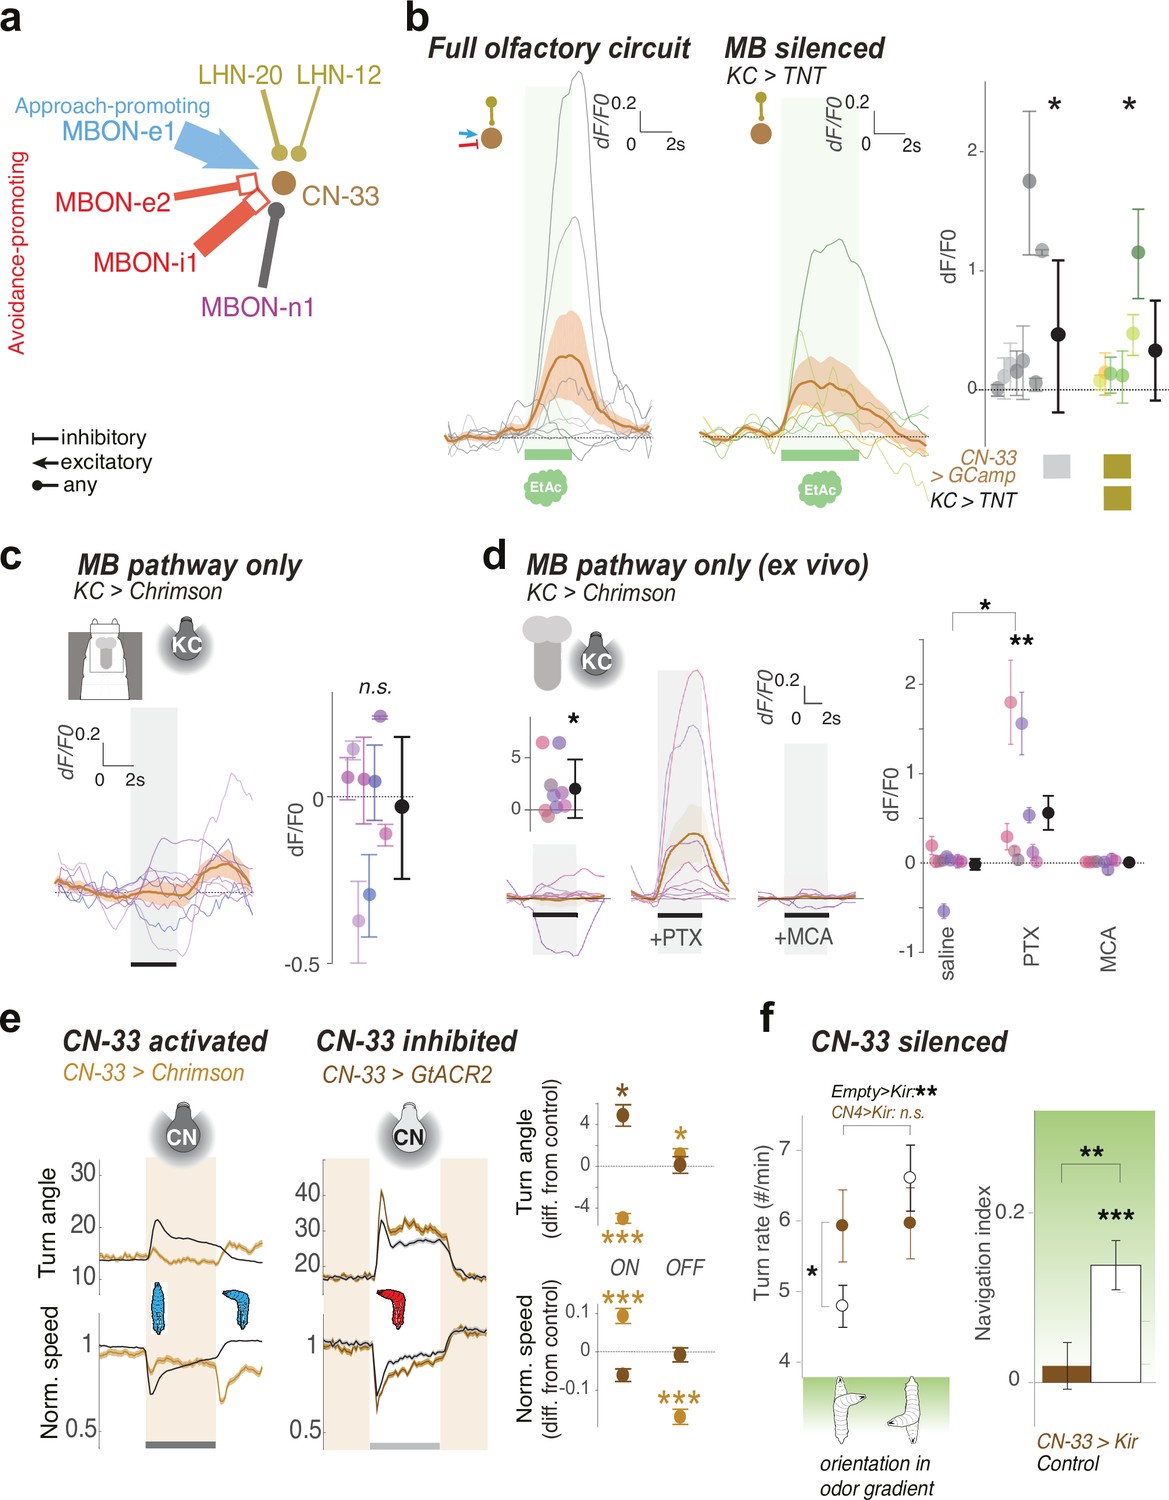
CN-33 integrates functional LH and MB inputs and regulates approach.
(a) MBON and LHN inputs onto CN-33 revealed by EM reconstruction. (b–d) Calcium responses of CN-33 in untrained larvae to an innately attractive odor (EA) (b), or to optogenetic activation of KCs (c–d). Plots show fluorescence normalized to baseline (before odor presentation, δF/F0) and scores are calculated for the first 3 s of odor presentation. Individual animal traces are shown in Figure 6—figure supplement 1. *: p < 0.05, **: p < 0.01 in Wilcoxon test. (b) Calcium responses of CN-33 to an innately attractive odor (EA) was imaged in vivo as in Figure 4b–c, either with the MB pathway intact (left) or blocked (by expressing TNTe in KCs) (middle). Left, On average, in untrained larvae, CN-33 is excited by the innately attractive odor (N = 8). Middle, Silencing the MB pathway does not impair the excitatory response of CN-33 to the innately attractive odor (N = 6). This confirms a functionally excitatory connection from LHNs to CN-33. Right, quantification shows no significant difference between CN-33 responses to odor in the presence (left) and absence (middle) of a functional MB pathway, suggesting in naive animals the excitatory odor drive could come mainly from the LH. (c–d) CN-33 responses to optogenetic activation of KCs in vivo (c) and in brain explant (d) confirm functional excitatory and inhibitory connections from MBONs to CN-33. c. Across the population of untrained larvae the average change in δF/F0 in response to optogenetic activation of KCs does not differ from zero. We observed a slight excitation at light offset, possibly due to inhibitory rebound. Also, the amplitude of δF/F0 (|max δF/F0 - min δF/F0|) was significantly increased after, compared to before, KC activation, suggesting that, similar to MBON-m1, CN-33 receives functionally excitatory inputs from the MB in some individuals, and inhibitory in others (N = 8). (d) Activation of KCs in brain explants together with pharmacological blockers confirm mixed inhibitory and excitatory inputs from the MB pathway (N = 8) onto CN-3. While responses to KC activation do not differ from zero in saline or MCA bath, blocking inhibitory signal integration with PTX unravels excitatory inputs derived from MBONs. (e) Optogenetic activation of CN-33 (as in Figure 2b–g, Nexp = 11, Nlarvae = 400; control empty line: Nexp = 20, Nlarvae = 700) leads to decreased and increased turning at onset and offset of activation, respectively (left). Acute optogenetic inactivation of CN-33 (as in Figure 5b) increases turning (middle). Plots and quantification (right) as in Figure 2b–g. See Figure 6—figure supplement 2 for additional controls. (f) Constitutively silencing CN-33 (with Kir2.1, Nexp = 8, Nlarvae = 146; control empty line: Nexp = 10) abolished the ability of larvae to modulate turn rate as a function of orientation in odor gradient (left panel) and significantly impairs approach of an innately attractive odor in untrained animals (right panel). *: p < 0.05, **: p < 0.001, ***: p < 0.0001 in Welch’s Z test. See Figure 6—figure supplement 2 for additional controls. *: p < 0.05, ***: p < 0.001 in Welch’s Z test.
-
Figure 6—source data 1
Individual GCaMP fluorescence values in response to odour presentation by CN-33 of animals with intact olfactory pathway.
Fluorescence values of the ROI over time for each repeats and each individuals as plotted in Figure 6b (left).
- https://cdn.elifesciences.org/articles/62567/elife-62567-fig6-data1-v3.csv
-
Figure 6—source data 2
Individual GCaMP fluorescence values in response to odour presentation by CN-33 of animals with silenced mushroom body.
Fluorescence values of the ROI over time for each repeats and each individuals as plotted in Figure 6b (right).
- https://cdn.elifesciences.org/articles/62567/elife-62567-fig6-data2-v3.csv
-
Figure 6—source data 3
Individual GCaMP fluorescence values in response to Kenyon cells optogenetic activation by CN-33.
Fluorescence values of the ROI over time for each repeats and each individuals as plotted in Figure 6c.
- https://cdn.elifesciences.org/articles/62567/elife-62567-fig6-data3-v3.csv
-
Figure 6—source data 4
Value angles showing turn responses of animals during optogenetic silencing of CN-33.
Mean and std values of the turn angles over time in the different experimental groups shown in Figure 6e.
- https://cdn.elifesciences.org/articles/62567/elife-62567-fig6-data4-v3.csv
Figure 6—figure supplement 1
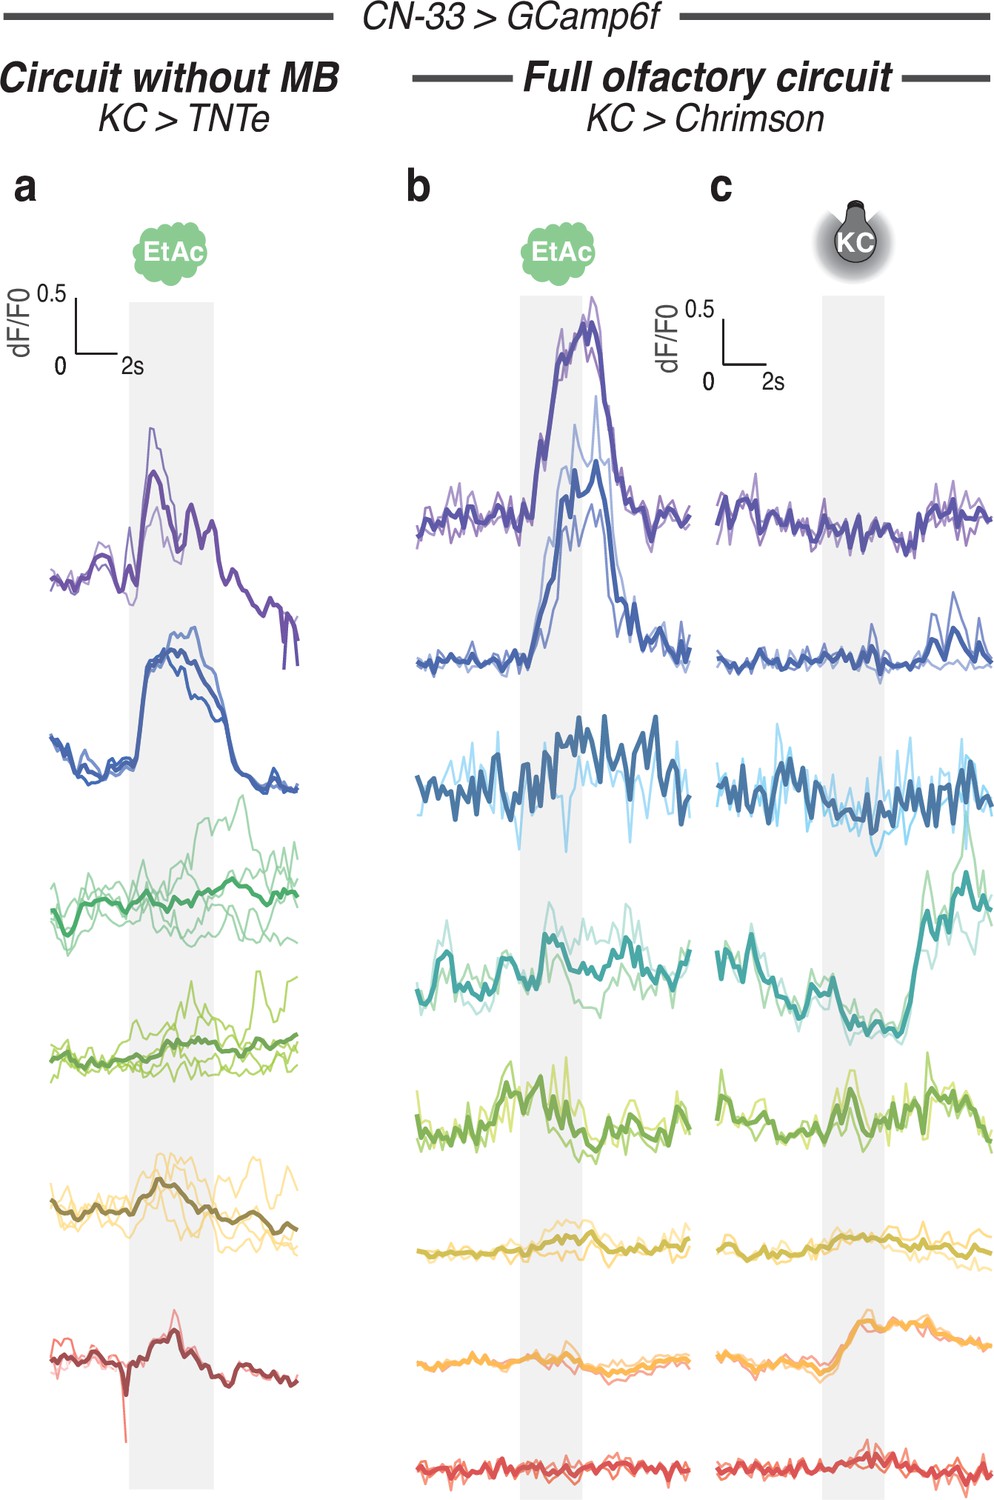
Calcium responses of CN-33 for each individual.
Calcium activity of CN-33 was imaged in vivo (using SS02108-GAL4> UAS-GCamp6f) in first instar larvae immobilised in a microfluidic device (Si et al., 2019) and exposed to the odor EA (a,b,d) and/or to optogenetic activation of CsChrimson-expressing KCs (c,d). Plots show fluorescence normalized to baseline (before odor presentation). Two to four repeats are done for each individual, thick curve shows the average response of each individual. The left and right curves in b show the responses of CN-33 in the same animal to different kinds of stimulations. Averaged curves are also shown in Figure 6b and c after smoothing to ease readout. (a) Response of CN-33 to EA in larvae with silenced MB (using 14H06-LexA> LexAop TNTe). (b) Response of CN-33 to EA in larvae with intact MB (using 14H06-LexA> LexAop-CsChrimson). (c) Response of CN-33 to activation of MB (using 14H06-LexA> LexAop-CsChrimson).
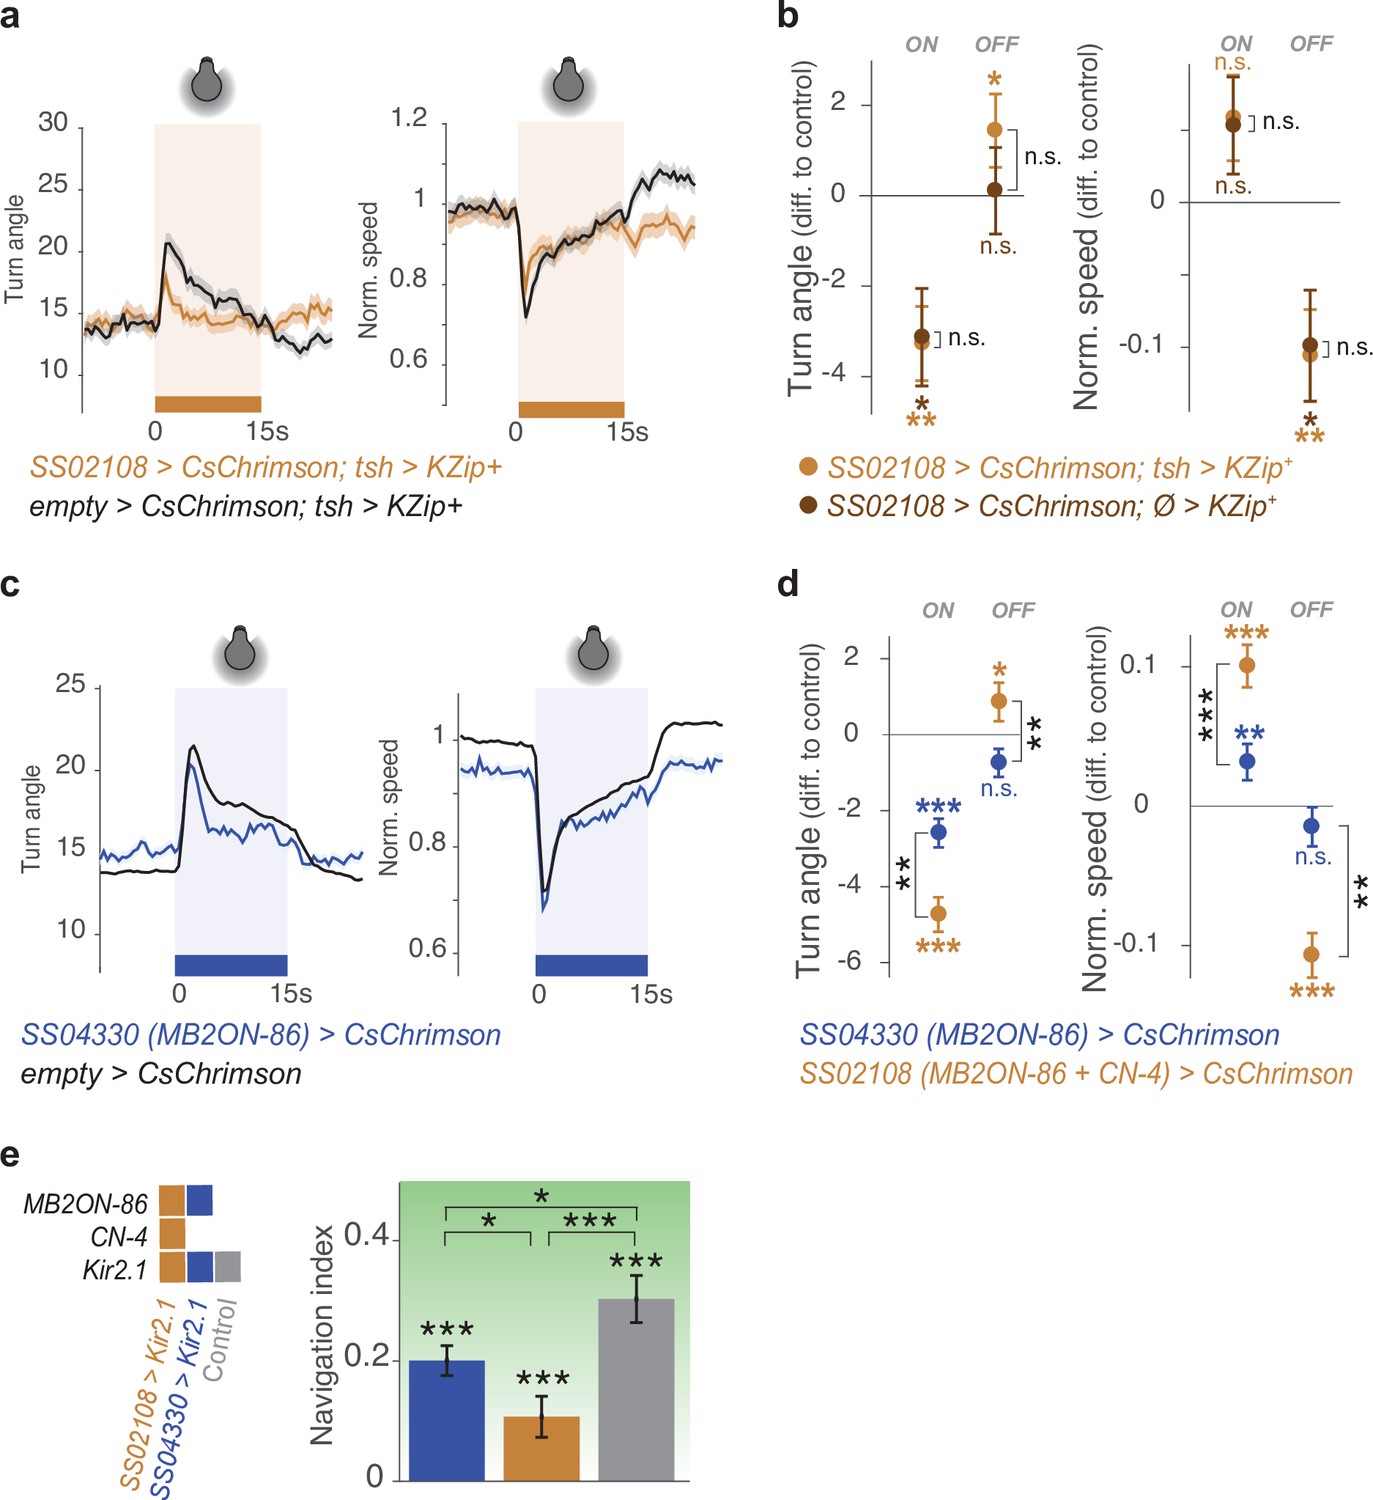
Figure 6—figure supplement 2
Control crosses in activation or silencing experiments confirm that CN-33 is involved in approach behavior.
a-b. We removed SS02108-driven neural expression in the nerve cord by expressing the Split-GAL4 repressor Killer Zipper LexAop-KZip+::3xHA, (Dolan et al., 2017) under the control of teashirt-LexA driver (SS02108> CsChrimson; tsh> KZip + ). With this genetic manipulation, we verified that the approach behavior of larvae observed in Figure 4b was due to the brain neurons present in the SS02108 expression pattern. Plots and quantification as in Figure 2b–g. (a) Even without nerve cord expression (light brown, SS02108> CsChrimson; tsh> KZip + . Nexp = 10, Nlarvae = 380), the brain neurons (CN-33 and MB2ON-86) from this line were sufficient to repress and promote turning in response to activation onset, and offset, respectively, relative to controls (black, empty Split-GAL4> CsChrimson; tsh> KZip + . Nexp = 16, Nlarvae = 450). (b) Removing neural expression in the nerve cord (light brown, SS02108> CsChrimson; tsh> KZip + ) did not change optogenetically induced behavior as compared to not removing it (dark brown, SS02108> CsChrimson; Ø> KZip + , Nexp = 7, Nlarvae = 250). c-d. The line SS04330 drives expression in MB2ON-86 alone (Eschbach et al., 2020) and is thus used to verify how specific to CN-33 are the behavioral effects found with the line SS02108 (which targets both CN-33 and more weakly MB2ON-86). Plots and quan- tification as in Figure 2b–g. (c) Activating MB2ON-86 mildly increases turning (blue, SS04330> CsChrimson, Nexp = 25, Nlarvae = 890) compared to controls (black, empty Split-GAL4> CsChrimson, Nexp = 340, Nlarvae >10,000) in response to activation onset, but does not decrease turning in response to activation offset. (d) Optogenetic activation of MB2ON-86 (SS04330> CsChrimson) induced signif- icantly less turning in response to activation onset than activating MB2ON-86 and CN-33 together (SS02108> CsChrimson, Nexp = 16, Nlarvae = 650). Furthermore, activating MB2ON-86 alone (with SS04330) did not increase turning in response to activation offset. *: p < 0.05, **: p < 0.01, Welch Z test. (e) Constitutive silencing of MB2ON-86 affects navigation performance. Nlarvae = 135 (SS02108> Kir2.1), 92 (SS04330> Kir2.1), 211 (empty Split-GAL4> Kir2.1), Nexp = 7, 4, 6, respectively. For b,d,e, *: p < 0.05, **: p < 0.01, ***: p < 0.001, Welch Z test.
-
Figure 6—figure supplement 2—source data 1
Value angles showing turn responses of control lines for CN-33 activation.
Mean and std values of the turn angles over time in the control experimental groups shown in Figure 6—figure supplement 2a-d.
- https://cdn.elifesciences.org/articles/62567/elife-62567-fig6-figsupp2-data1-v3.csv
Figure 7
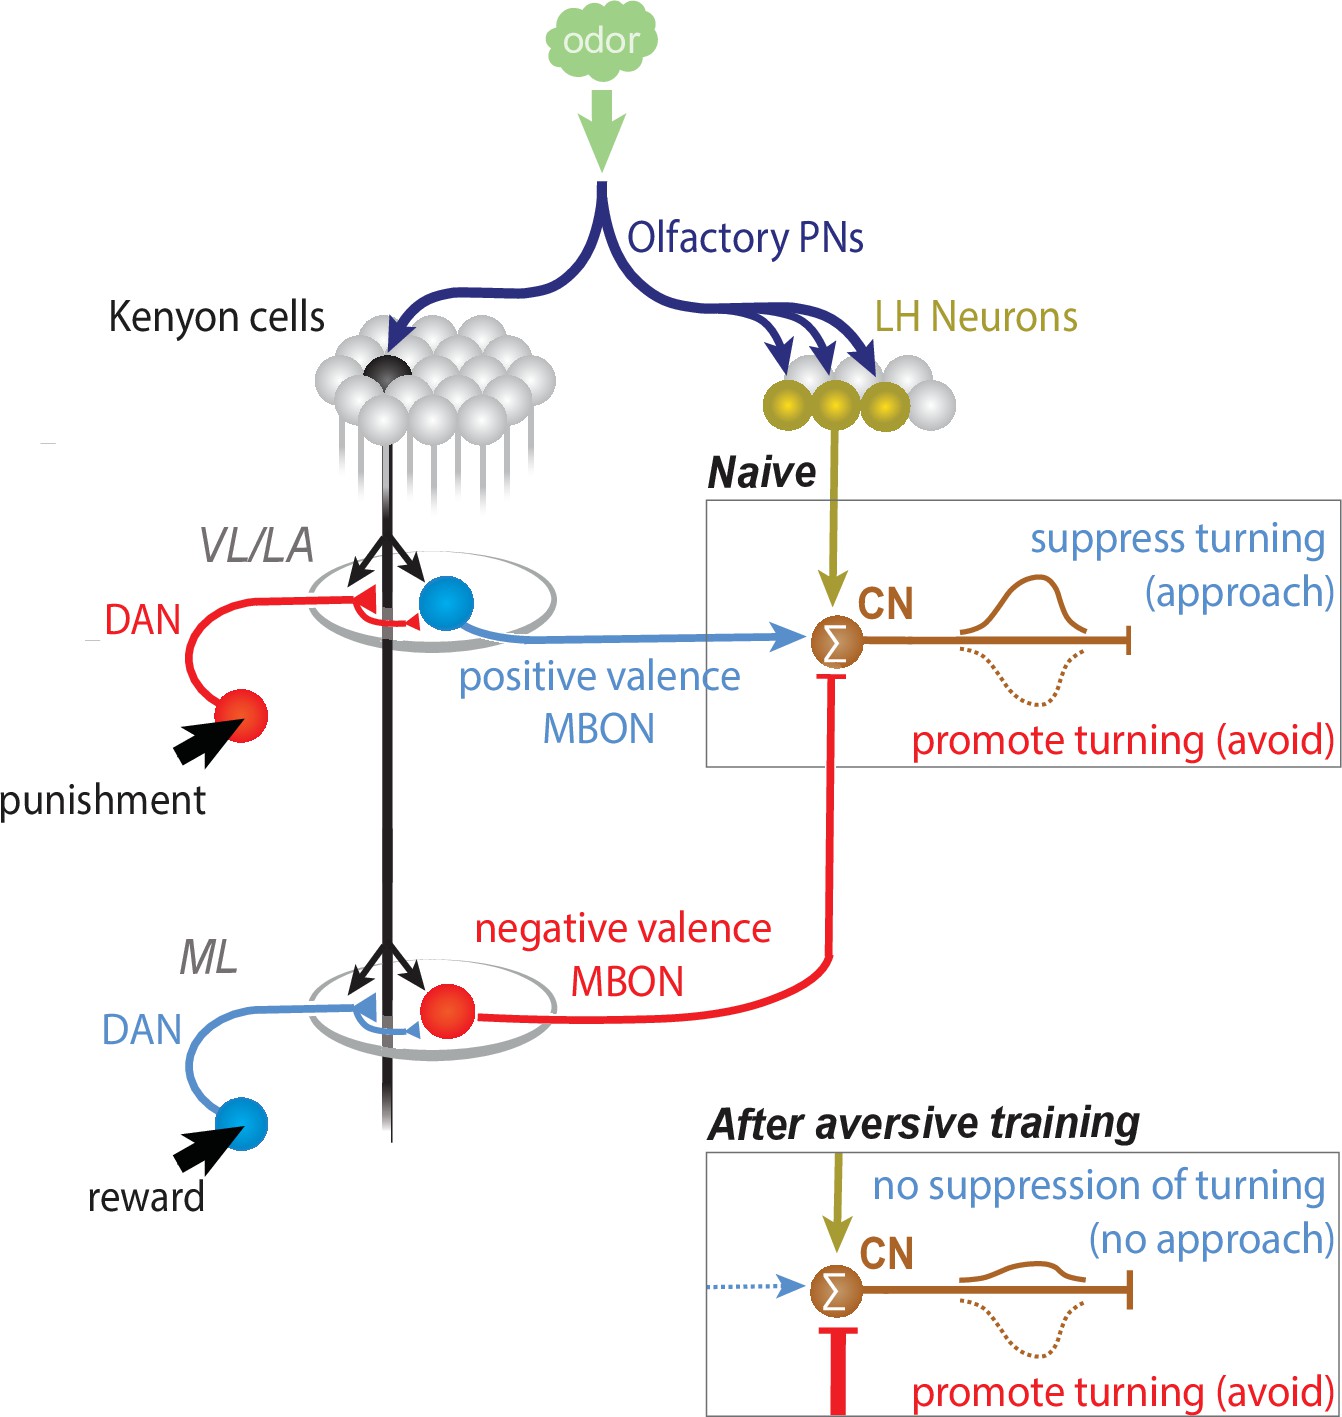
CN-33 integrates LH and MB-derived inputs.
CNs whose activation suppresses turning are activated by innately attractive odors in naive animals via the LH pathway (when the net MB output onto them is 0). Learning could bidirectionally skew the net MB output onto the CNs towards excitation (appetitive learning), or inhibition (aversive learning). After aversive learning the conditioned odor would activate these CNs less, failing to suppress turning, or sometimes even inhibit them, thereby inducing turning and inducing avoidance.
Tables
Author response table 1
| Detailed statistics (Analysis of variance): | |||||
|---|---|---|---|---|---|
| 'Source' | 'Sum Sq.' | 'd.f.' | 'Mean Sq.' | 'F' | 'Prob>F' |
| 'indiv' | 0.26 | 4 | 0.065 | 10.9 | 2.8e-07 |
| 'CS' | 0.09 | 2 | 0.046 | 7.8 | 0.0007 |
| 'indiv*CS' | 0.11 | 8 | 0.014 | 2.4 | 0.021 |
| 'Error' | 0.55 | 93 | 0.006 | [] | [] |
| 'Total' | 1.00 | 107 | [] | [] | [] |
Additional files
-
Supplementary file 1
Adjacency matrix of all reconstructed neurons.
Adjacency matrix between all neurons (all type of synaptic connection) reconstructed and considered in this and in previous studies (Eichler et al., 2017; Eschbach et al., 2020): Olfactory Projection Neurons downstream of ORN42a and 42b (PNs), Lateral Horn Neurons downstream of these PNs (LHNs), Mushroom Body Output Neurons (MBONs), MB 2nd-Order Neurons downstream of MBONs (MB2ONs), Convergence Neurons (CNs). modulatory neurons (dopaminergic, octopaminergic, or unknown: respectively DANs, OANs, MBINs), Feedback 2nd-order Neurons (FB2Ns), Feed-Forward Neurons (FFNs), Kenyon Cells (KCs).
- https://cdn.elifesciences.org/articles/62567/elife-62567-supp1-v3.csv
-
Supplementary file 2
Results of statistical analyses.
Details of statistical analyses of imaging data: probability resulting from Wilcoxon rank test and ANOVA.
- https://cdn.elifesciences.org/articles/62567/elife-62567-supp2-v3.csv
-
Transparent reporting form
- https://cdn.elifesciences.org/articles/62567/elife-62567-transrepform1-v3.pdf
Download links
A two-part list of links to download the article, or parts of the article, in various formats.
Downloads (link to download the article as PDF)
Open citations (links to open the citations from this article in various online reference manager services)
Cite this article (links to download the citations from this article in formats compatible with various reference manager tools)
Circuits for integrating learned and innate valences in the insect brain
eLife 10:e62567.
https://doi.org/10.7554/eLife.62567


