The trajectory of cortical GABA across the lifespan, an individual participant data meta-analysis of edited MRS studies
- Center for Cognitive Aging and Memory, University of Florida, United States
- McKnight Brain Research Foundation, University of Florida, United States
- Department of Clinical and Health Psychology, University of Florida, United States
- Department of Neuroscience, Columbia University Medical Center, United States
- Zuckerman Mind Brain Behavior Institute, Columbia University, United States
- Russell H. Morgan Department of Radiology and Radiological Science, The Johns Hopkins University School of Medicine, United States
- F.M. Kirby Research Center for Functional Brain Imaging, Kennedy Krieger Institute, United States
- Department of Forensic and Neurodevelopmental Sciences, Sackler Institute for Translational Neurodevelopment, Institute of Psychiatry, Psychology, and Neuroscience, King’s College London, United Kingdom
Figures
Figure 1
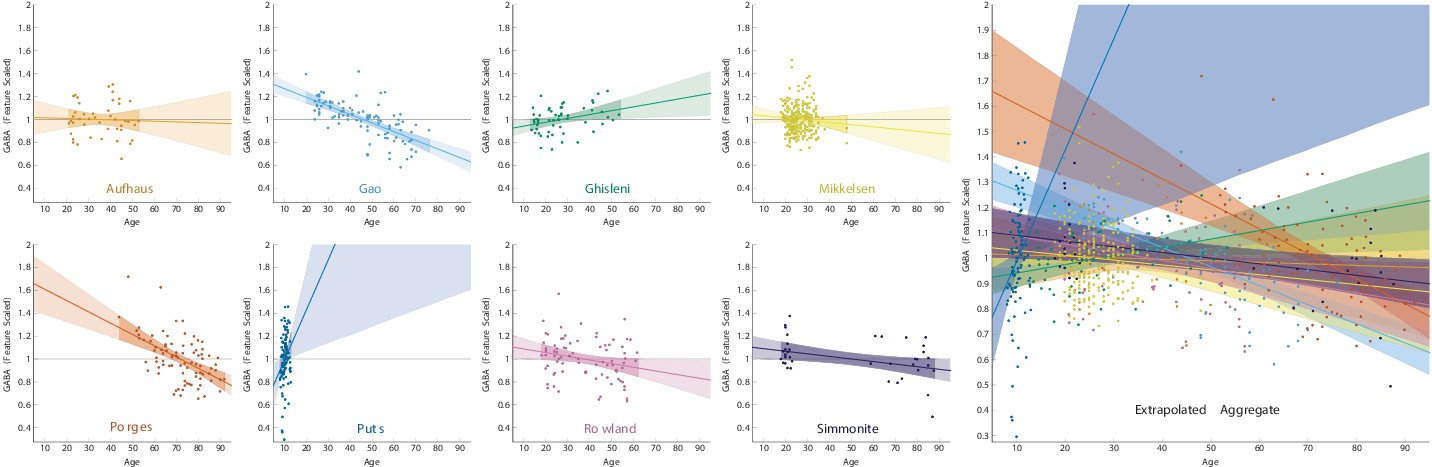
Linear relationships between age and γ-aminobutyric acid (GABA) signal, showing that linear extrapolation over the lifespan is not appropriate.
In each dataset, GABA was scaled relative to the geometric mean. Linear models were fit for each dataset separately. Dark shaded regions represent the 95% credible interval for the interpolated regression line, given the data from each study and the assumption of a linear effect, whereas the light shaded regions represent the 95% credible interval for the extrapolated regression line.
Figure 2

Non-linear regression models of γ-aminobutyric acid (GABA) signal integrating all data simultaneously.
The shaded region depicts the 95% credible interval for the mean. (Left) Penalized basis spline model. (Right) Log-normal model.
Figure 3
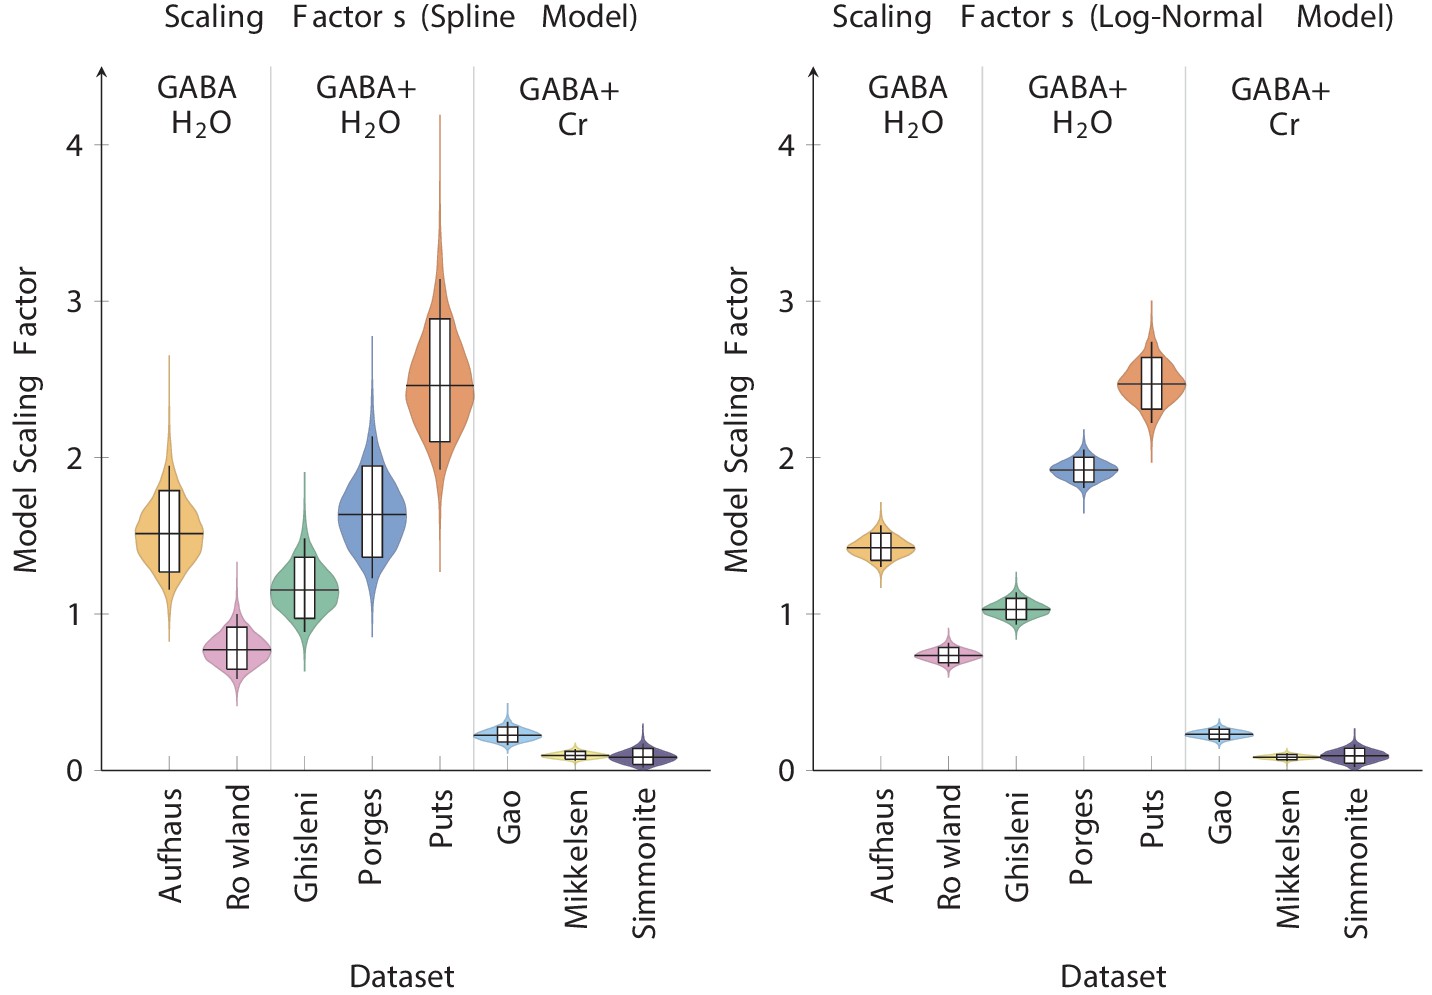
Posterior estimates of the relative scaling factor for each study in the penalized basis spline model (left) and the log-normal model (right), sorted by reference method.
Boxes represent the 80% credible interval for the posterior estimate, whereas whiskers represent the 95% credible interval.
Figure 4 with 1 supplement
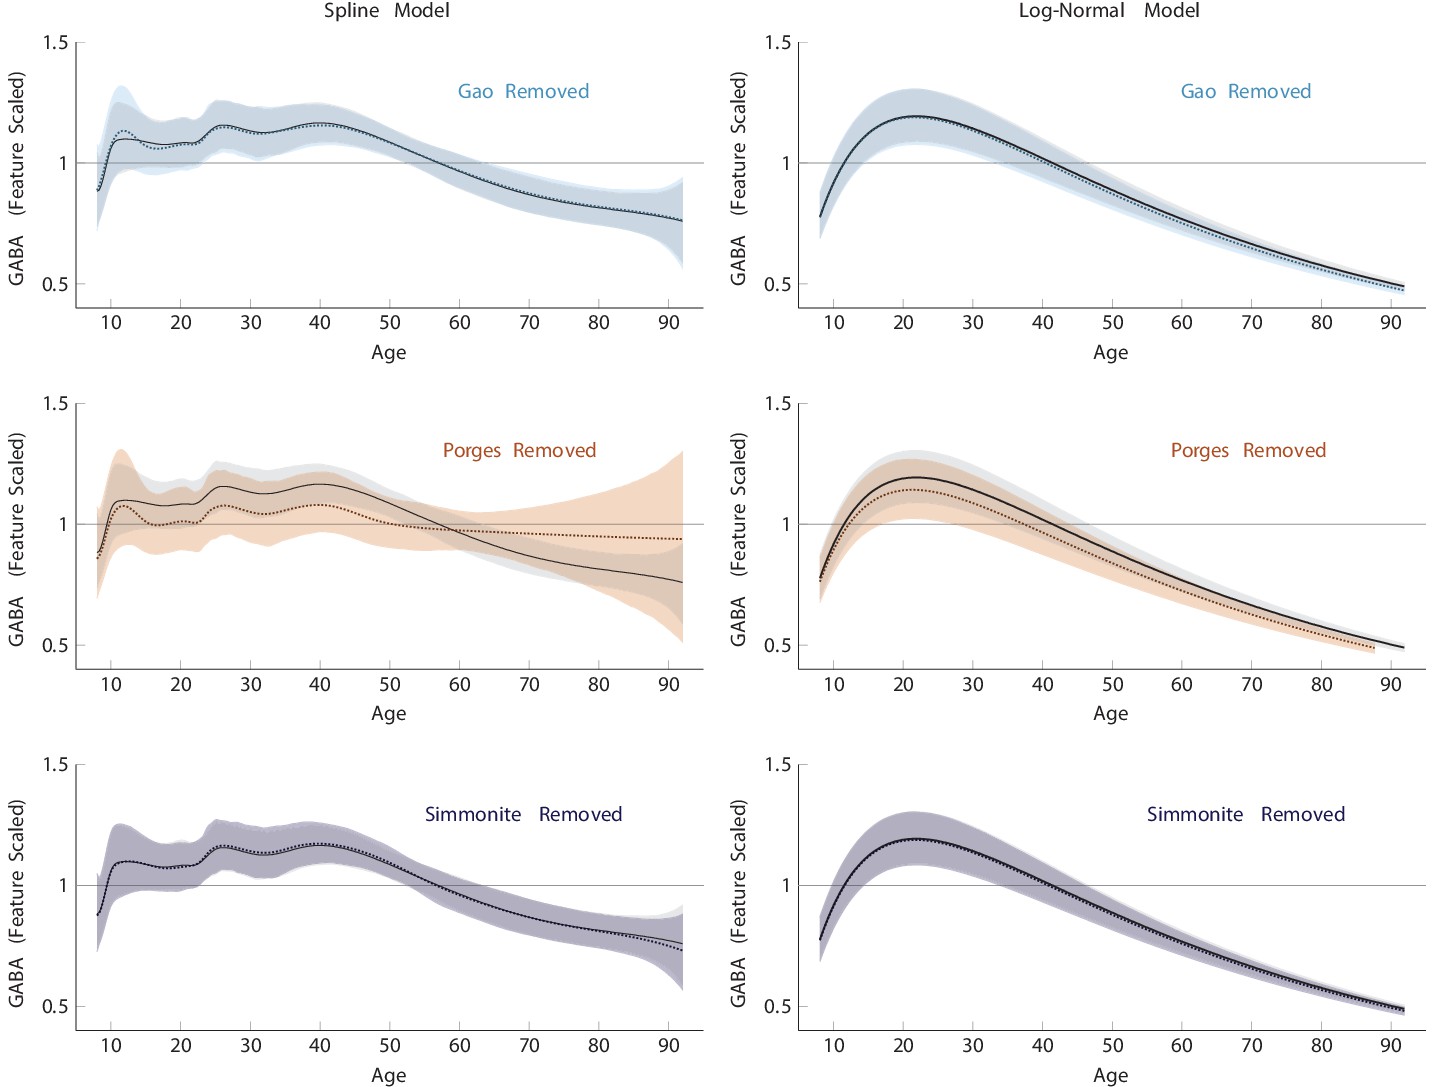
Non-linear regression models of γ-aminobutyric acid (GABA) signal performed using a leave-one-out (LOO) cross-validation approach.
The gray shaded region and black line depict the 95% credible interval for the mean for the model and the colored shaded region and dotted line show the model with the respective data left out. In all cases, a similar overall trajectory to the full data is implied by each of the subsets, albeit with greater variation in the posterior estimates.
Figure 4—figure supplement 1
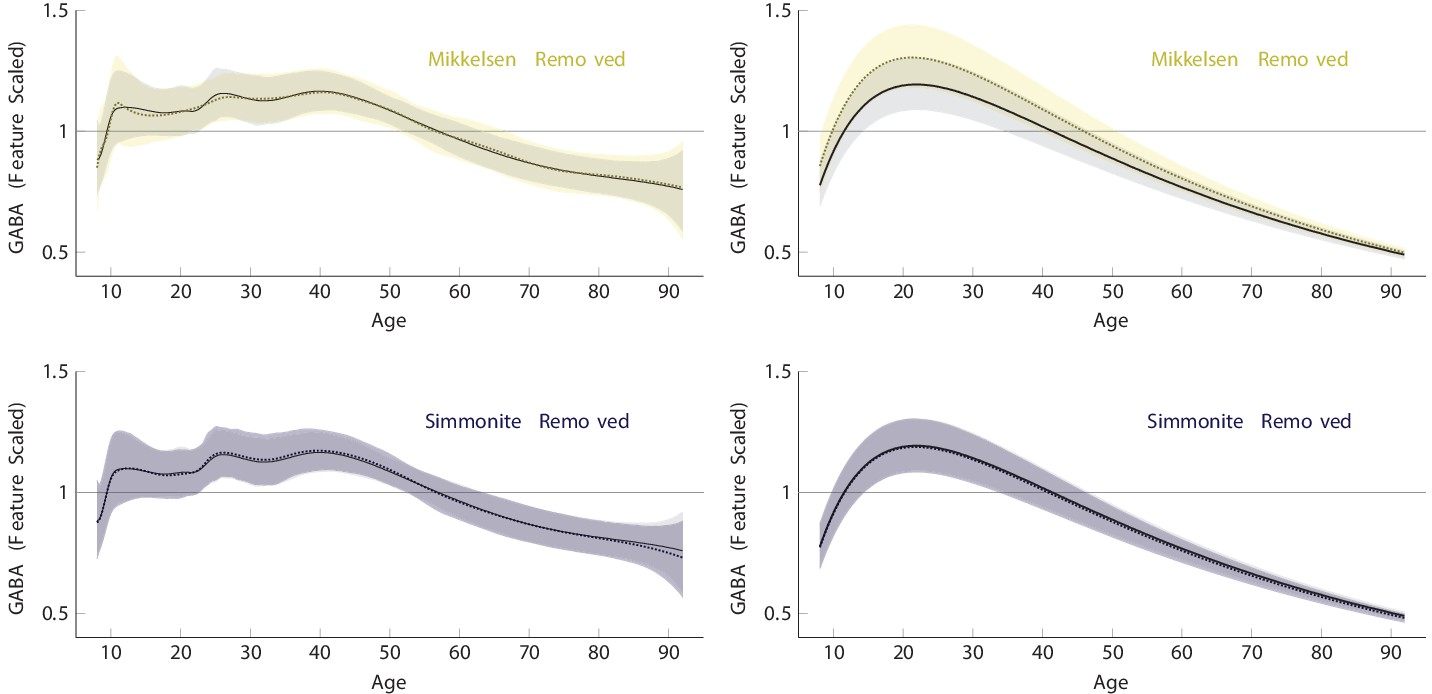
To accompany Figure 4, we performed additional analysis on frontal data only (removing Mikkelsen et al. and Simmonite et al., respectively) to investigate whether the inclusion of non-frontal regions biased our data.
These data show no substantial impact on the direction of the slope over time.
Figure 5
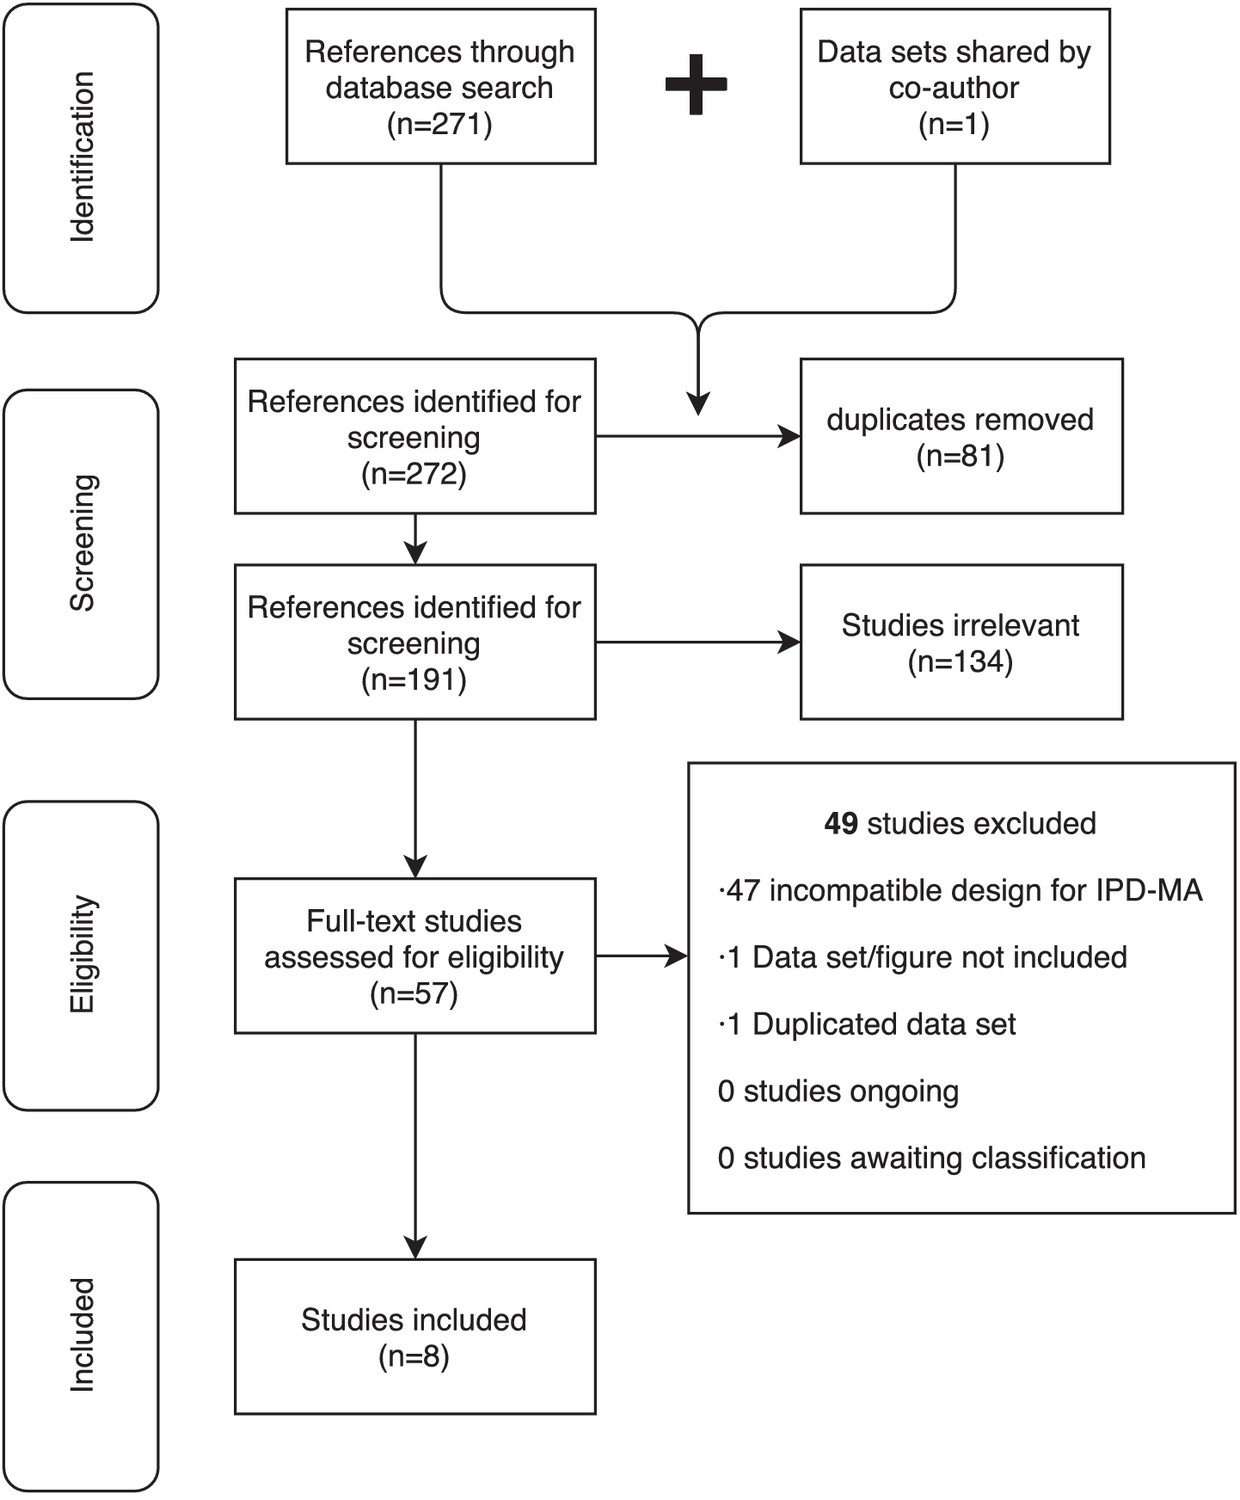
PRISMA 2009 flow diagram of study identification and inclusion.
Figure 6
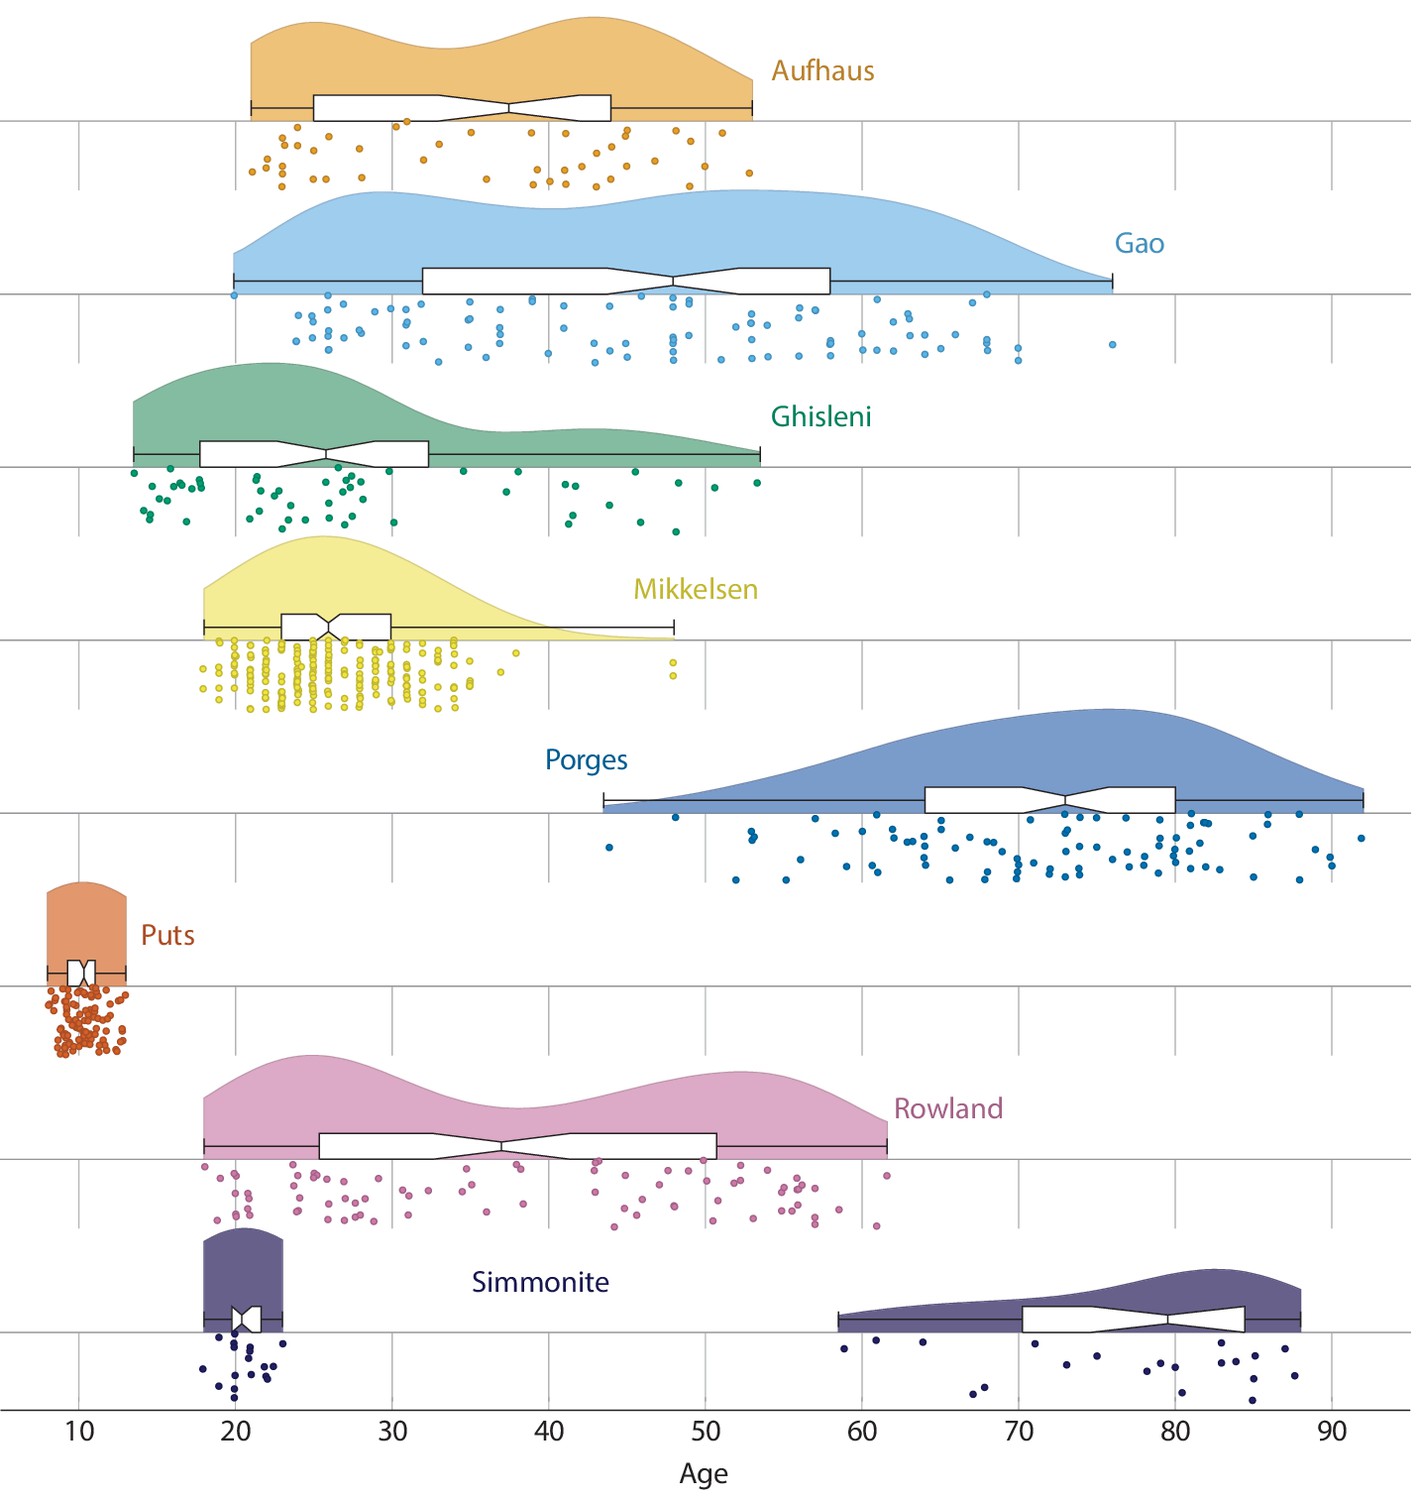
Raincloud plot depicting the age distribution in each of the eight included datasets.
Plotted densities are scaled within study. Boxes represent the first and third quartiles, while whiskers represent the range of the data. The central notch corresponds to the bootstrapped confidence interval for median. Kernel density estimates for each dataset were computed using a Gaussian kernel according to Silverman, 1986. The relevant analysis script for these densities is included as supplementary material.
Tables
Table 1
Regression statistics for simple linear fits.
| GABA study | Mean slope | Lower and upper bounds (0.025–0.975 quantiles) | Mean residual | Lower and upper bounds (0.025–0.975 quantiles) | R2 |
|---|---|---|---|---|---|
| Aufhaus | −0.0008 | −0.0055 to 0.0041 | 0.155 | 0.125 to 0.194 | 0.003 |
| Gao | −0.0075 | −0.0092 to −0.0058 | 0.121 | 0.106 to 0.140 | 0.459 |
| Ghisleni | 0.0034 | 0.0007 to 0.0061 | 0.111 | 0.092 to 0.134 | 0.106 |
| Mikkelsen | −0.0019 | −0.0054 to 0.0016 | 0.129 | 0.117 to 0.142 | 0.005 |
| Porges | −0.0099 | −0.0133 to −0.0064 | 0.172 | 0.148 to 0.200 | 0.279 |
| Puts | 0.0436 | 0.0085 to 0.0795 | 0.215 | 0.188 to 0.249 | 0.058 |
| Rowland | −0.0032 | −0.0060 to −0.0004 | 0.176 | 0.151 to 0.207 | 0.061 |
| Simmonite | −0.0023 | −0.0040 to −0.0005 | 0.160 | 0.127 to 0.203 | 0.156 |
Table 2
Neuroimaging acquisition and analysis details for eight studies included in the analysis.
Reference method refers to either reference to water (in estimated concentration/H2O) or as a ratio to creatine plus phosphocreatine (Cr+PCr) and describes whether data was acquired macromolecule-suppressed (γ-aminobutyric acid [GABA]) or as GABA+ macromolecules (GABA+). MRS averages refer to the number of ON + OFF transients. *The manuscript refers to 96 averages. It was clarified with the authors that this referred to 96 ON and 96 OFF averages.
| GABA study | Type of scanner | Analysis software | Reference method | Voxel volume (ml3) | MRS means | TE (ms) | TR (ms) | Voxel location |
|---|---|---|---|---|---|---|---|---|
| Aufhaus et al., 2013* | 3 T Siemens | jMRUI/LCModel | GABA/H2O | 24 | 192* | 68 | 3000 | Medial frontal lobe |
| Gao et al., 2013 | 3 T Philips | jMRUI | GABA+/Cr+PCr | 27 | 320 | 68 | 2000 | Medial frontal lobe |
| Ghisleni et al., 2015 | 3 T GE | LCModel | GABA+/H2O | 30 | 320 | 68 | 2000 | Left dorsolateral prefrontal lobe |
| Mikkelsen et al., 2017 | 3 T GE/Philips/Siemens | Gannet | GABA+/Cr+PCr | 27 | 320 | 68 | 2000 | Medial parietal lobe |
| Porges et al., 2017a | 3 T Philips | Gannet | GABA+/H2O | 27 | 320 | 68 | 2000 | Medial frontal lobe |
| Puts et al., 2017 | 3 T Philips | Gannet | GABA+/H2O | 27 | 320 | 68 | 2000 | Right precentral sulcus |
| Rowland et al., 2016 | 3 T Philips | Gannet | GABA/H2O | 24 | 256 | 68 | 2000 | Medial frontal lobe |
| Simmonite et al., 2019 | 3 T Philips | Gannet | GABA+/Cr+PCr | 22.5 | 256 | 68 | 1800 | Medial occipital lobe |
Table 3
Descriptive statistics for eight studies included in the analysis.
This gives a basic description of sample size and age range for the eight datasets. Additionally, Figure 6 depicts the distribution of ages using a raincloud plot (Allen et al., 2018).
| GABA study | # of subjects | Mean age | Age (SD) | Age range | Reference |
|---|---|---|---|---|---|
| Aufhaus | 44 | 35.5 | 10 | 21–53 | Aufhaus et al., 2013 |
| Gao | 96 | 45.7 | 14.5 | 20–76 | Gao et al., 2013 |
| Ghisleni | 55 | 27.2 | 11 | 13–53 | Ghisleni et al., 2015 |
| Mikkelsen | 220 | 26.5 | 4.9 | 18–48 | Mikkelsen et al., 2017 |
| Porges | 86 | 71.8 | 10.6 | 43–92 | Porges et al., 2017a |
| Puts | 101 | 10.3 | 1.2 | 8–13 | Puts et al., 2017 |
| Rowland | 82 | 38.0 | 13.7 | 18–62 | Rowland et al., 2016 |
| Simmonite | 38 | 50.1 | 29.2 | 18–87 | Simmonite et al., 2019 |
Additional files
Download links
A two-part list of links to download the article, or parts of the article, in various formats.
Downloads (link to download the article as PDF)
Open citations (links to open the citations from this article in various online reference manager services)
Cite this article (links to download the citations from this article in formats compatible with various reference manager tools)
The trajectory of cortical GABA across the lifespan, an individual participant data meta-analysis of edited MRS studies
eLife 10:e62575.
https://doi.org/10.7554/eLife.62575


