Proteomic and transcriptomic profiling reveal different aspects of aging in the kidney
- The Jackson Laboratory, United States
- Harvard Medical School, United States
- VividionTherapeutics, United States
- Institute of Physiology, University of Zurich, Switzerland
Figures
Figure 1
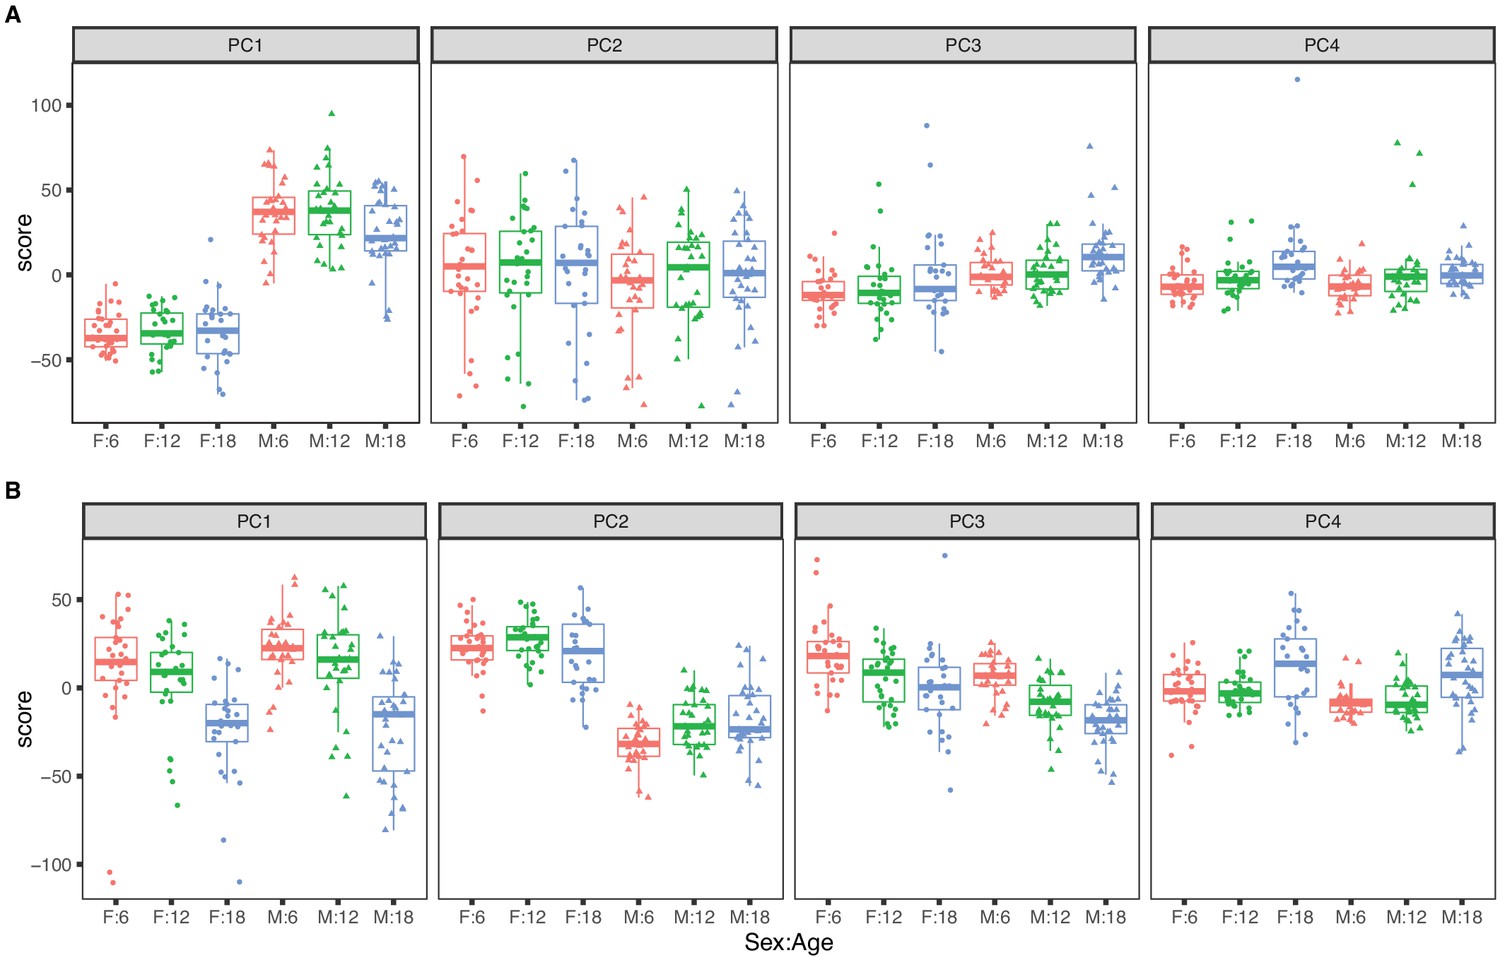
Principal component analysis for females (dots) and males (triangles) at 6 (red), 12 (green), and 18 months (blue) of age.
The top four principal components for (A) RNA expression, with sex as the dominant factor and (B) protein expression, with age as the dominant factor.
Figure 2 with 2 supplements
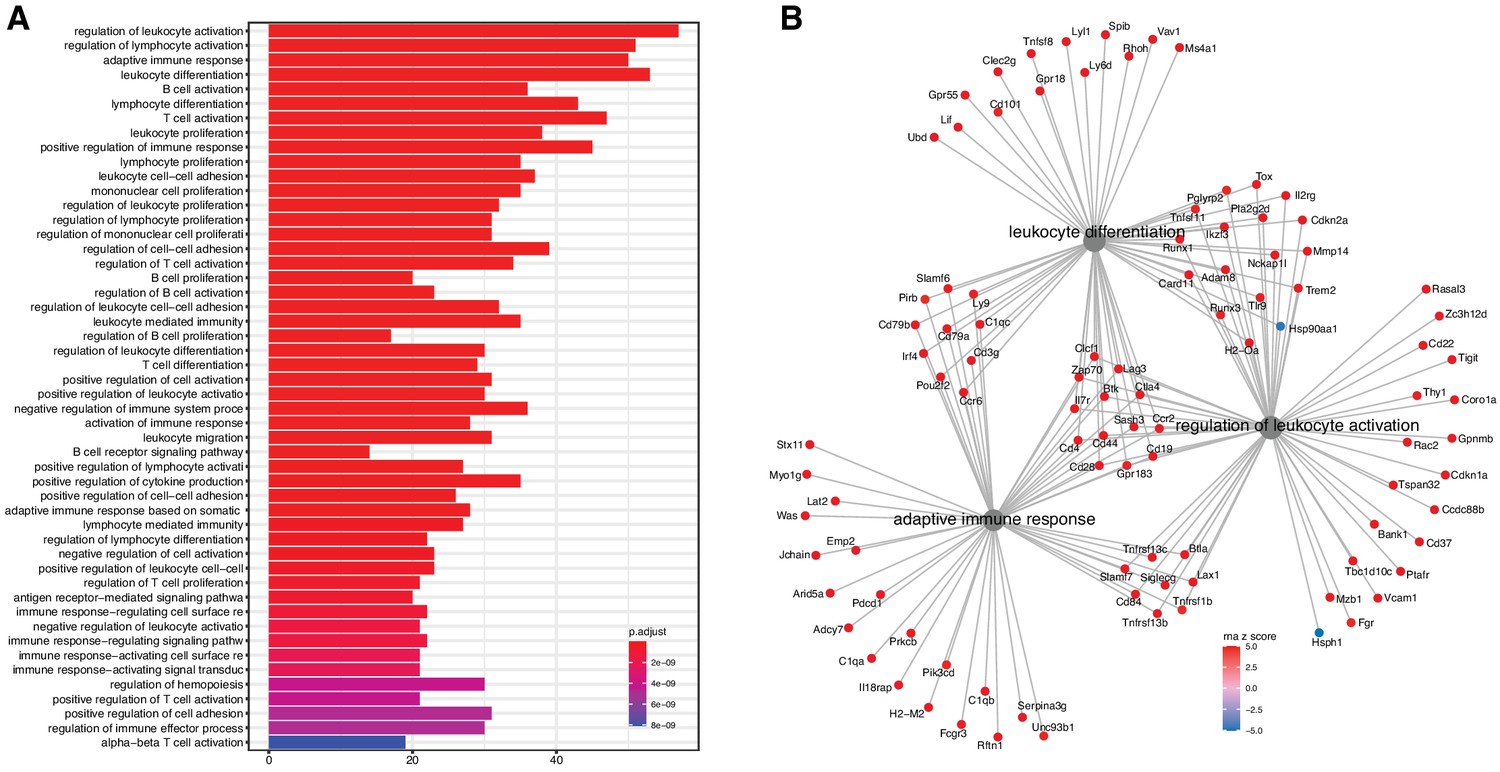
Analysis of differentially expressed mRNA with age.
(A) Functional enrichment and (B) network analysis, using ClusterProfiler, show overrepresentation of genes involved in immune and inflammatory response and is likely the result of immune cell infiltration into the kidney.
Figure 2—figure supplement 1
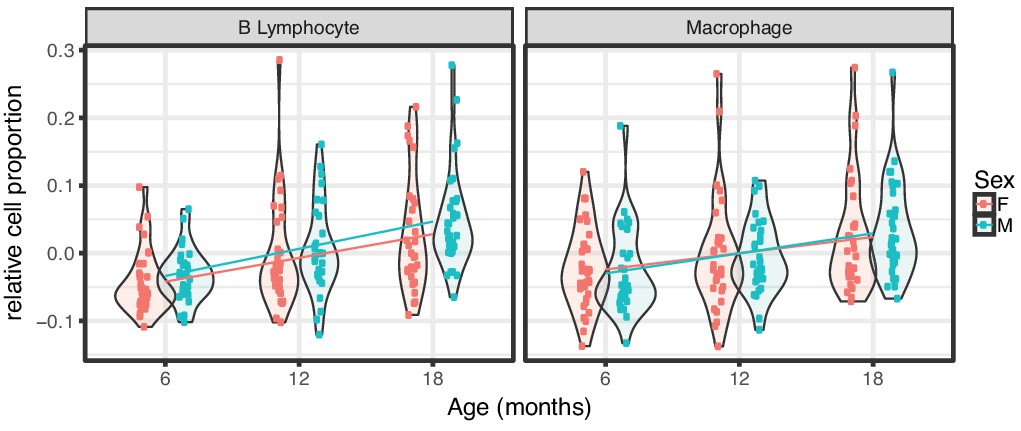
Relative changes in kidney cell composition as a function of age.
Plots show relative cell proportions in kidneys for B lymphocyte and macrophage subsets as depicted in facets. Each point represents a cell proportion inferred for an individual mouse, and violin plots illustrate the density of points along the vertical axis. Lines depict linear regressions fit separately by sex. All elements of the plot are colored according to sex as illustrated in legend at right. Relative cell proportions were inferred from bulk RNA-Seq data using the CellCODE R package as detailed in Materials and methods.
Figure 2—figure supplement 2
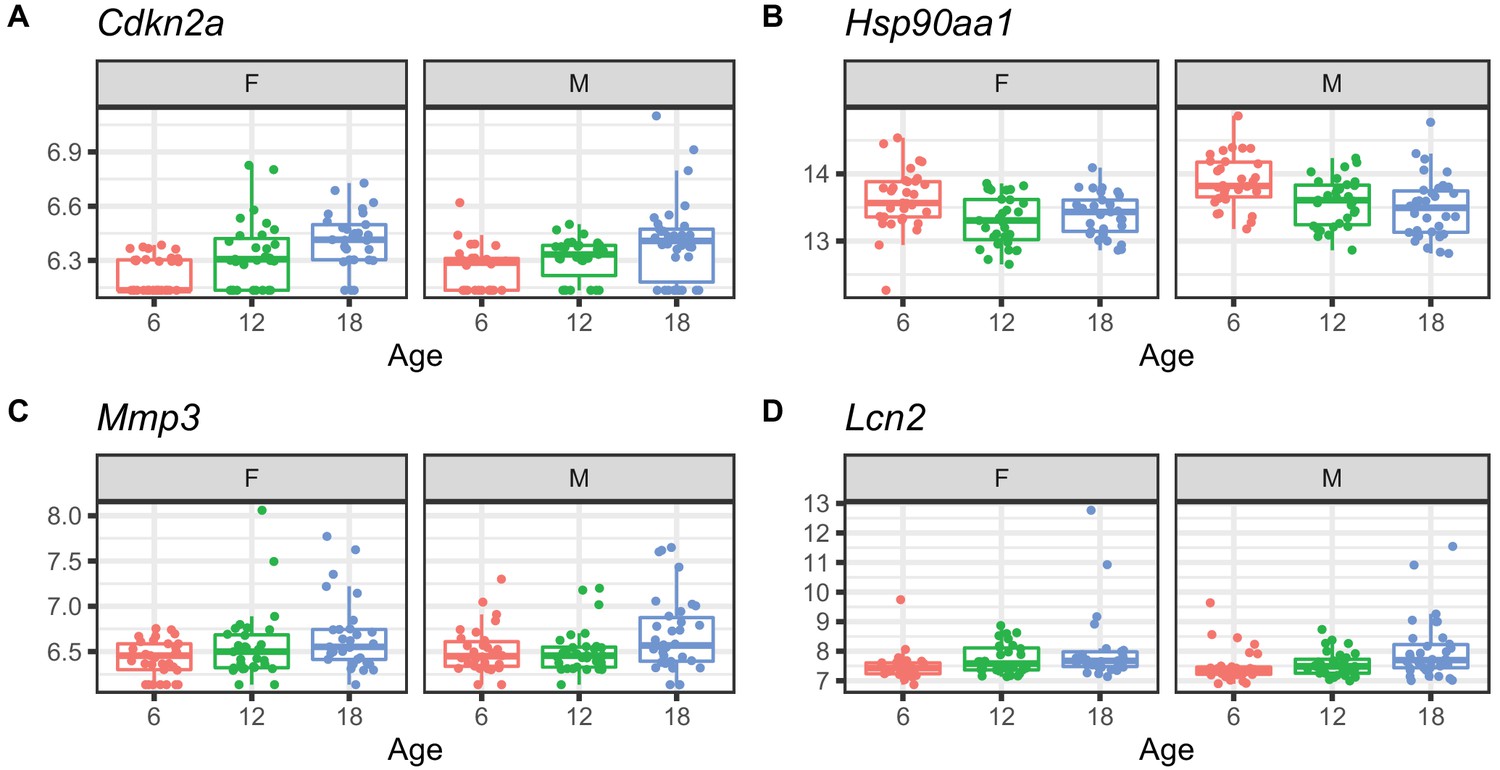
Examples of differential mRNA expression with age.
(A) Increased expression of Cdkn2a, which encodes the senescence marker p16, (B) decreased expression of Hsp90aa1, a heat shock protein, (C) increased expression of Mmp3, a marker of cellular senescence, and (D) increased expression of Lcn2, a marker of proximal tubule damage.
Figure 3 with 1 supplement

Examples of differential protein expression with age.
(A) Decreased expression of HIST1H1B, a histone protein (B) increased expression of ACTA2, a marker of renal fibrosis, (C) decreased expression of NCLN, a part of the endoplasmic reticulum, and (D) decreased expression of CISD2, which is involved in mitochondrial autophagy.
Figure 3—figure supplement 1
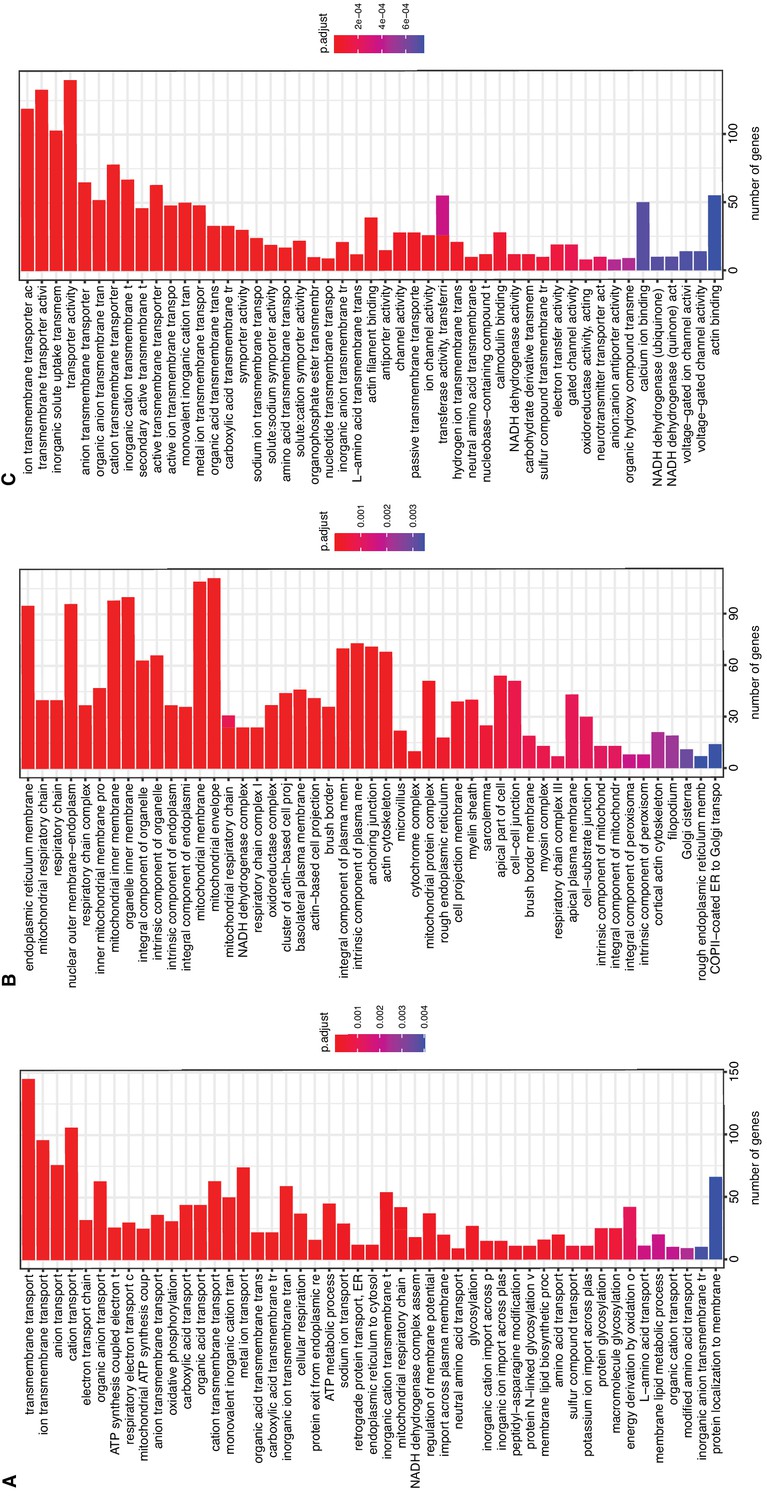
Functional enrichment of differentially expressed proteins and networks.
We evaluated the proteins for functional enrichment of GO categories using ClusterProfiler and observed overrepresentation of genes associated with 186 terms (adjusted p-value < 0.01) representing a wide array of (A) biological processes, (B) cellular compartments, and (C) molecular functions.
Figure 4
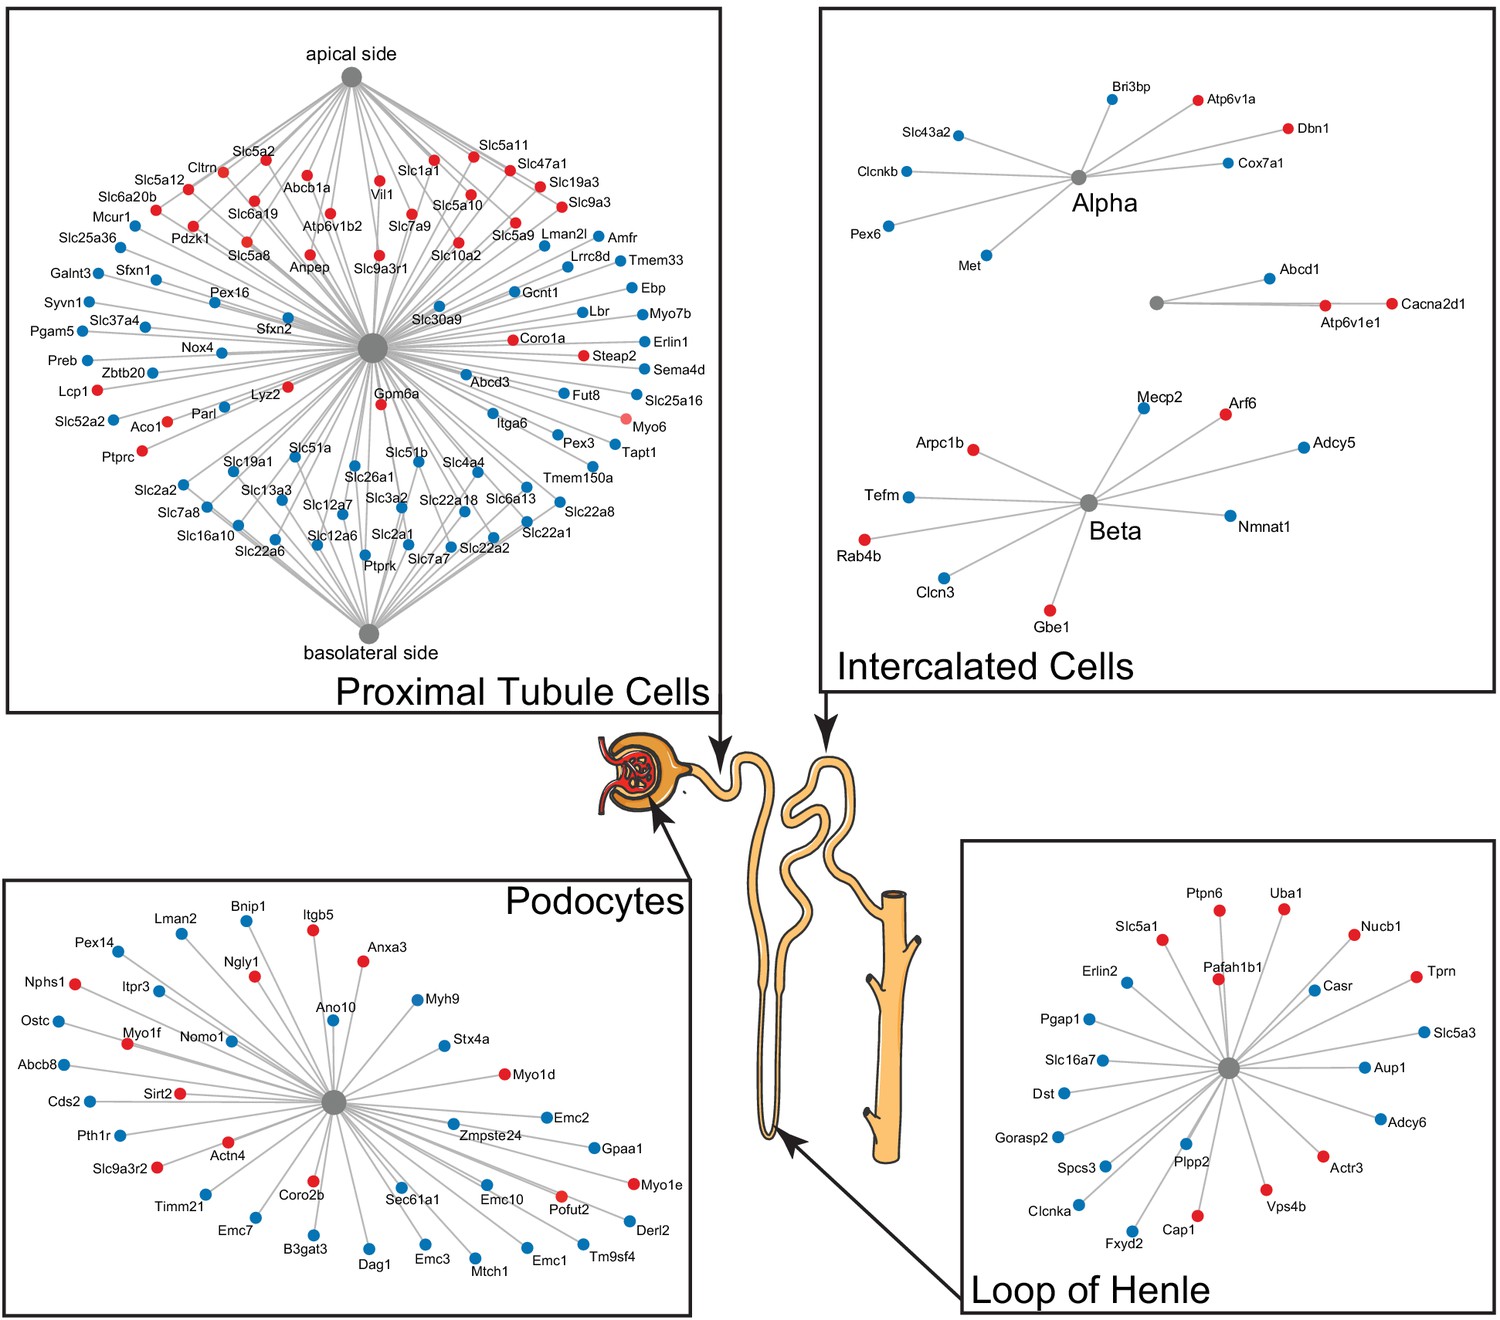
A subset of differentially expressed proteins with age that are specific for various parts of the nephron, based on single-cell data, show distinct changes with age, such as actin-cytoskeleton rearrangement in podocytes and changes in intercalated cells and the loop of Henle.
Striking are the changes in channels and transporters of the proximal tubular transport, where there is an upregulation at the basolateral side and a downregulation at the apical side.
Figure 5
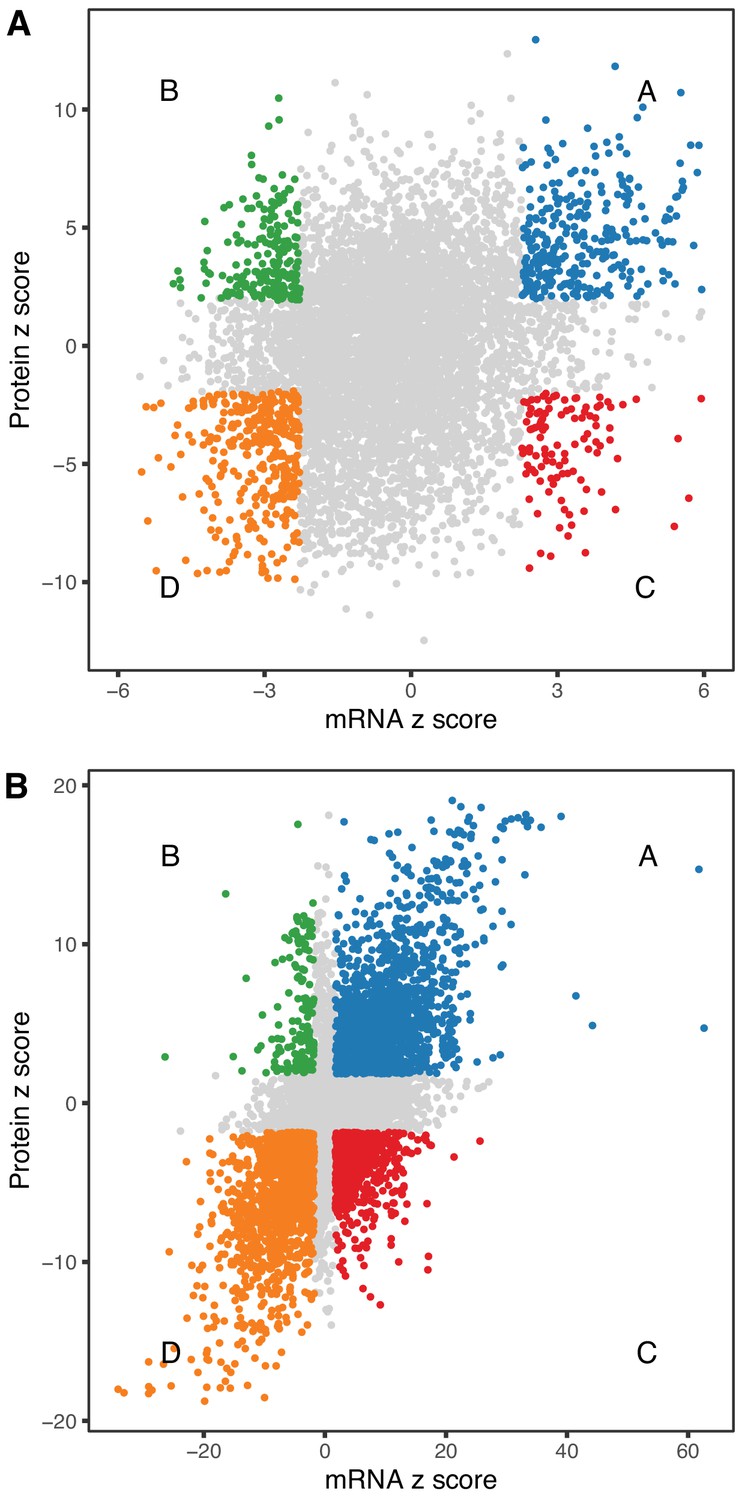
Comparison of age-related changes in mRNA and protein.
We identified 6514 genes with both mRNA and protein data of which 972 had significant differences with age (A) for both mRNA and protein. These can be divided in four groups depending on the direction of change, with decreased RNA and increased protein (green), decreased RNA and decreased protein (orange), increased RNA and increased protein (blue), and increased RNA and decreased protein (red). There is a similar pattern for sex-specific differences, although these are much more likely to be concordant (B). Each point represents a gene with significantly decreased RNA and increased protein (green), decreased RNA and decreased protein (orange), increased RNA and increased protein (blue), and increased RNA and decreased protein (red).
Figure 6
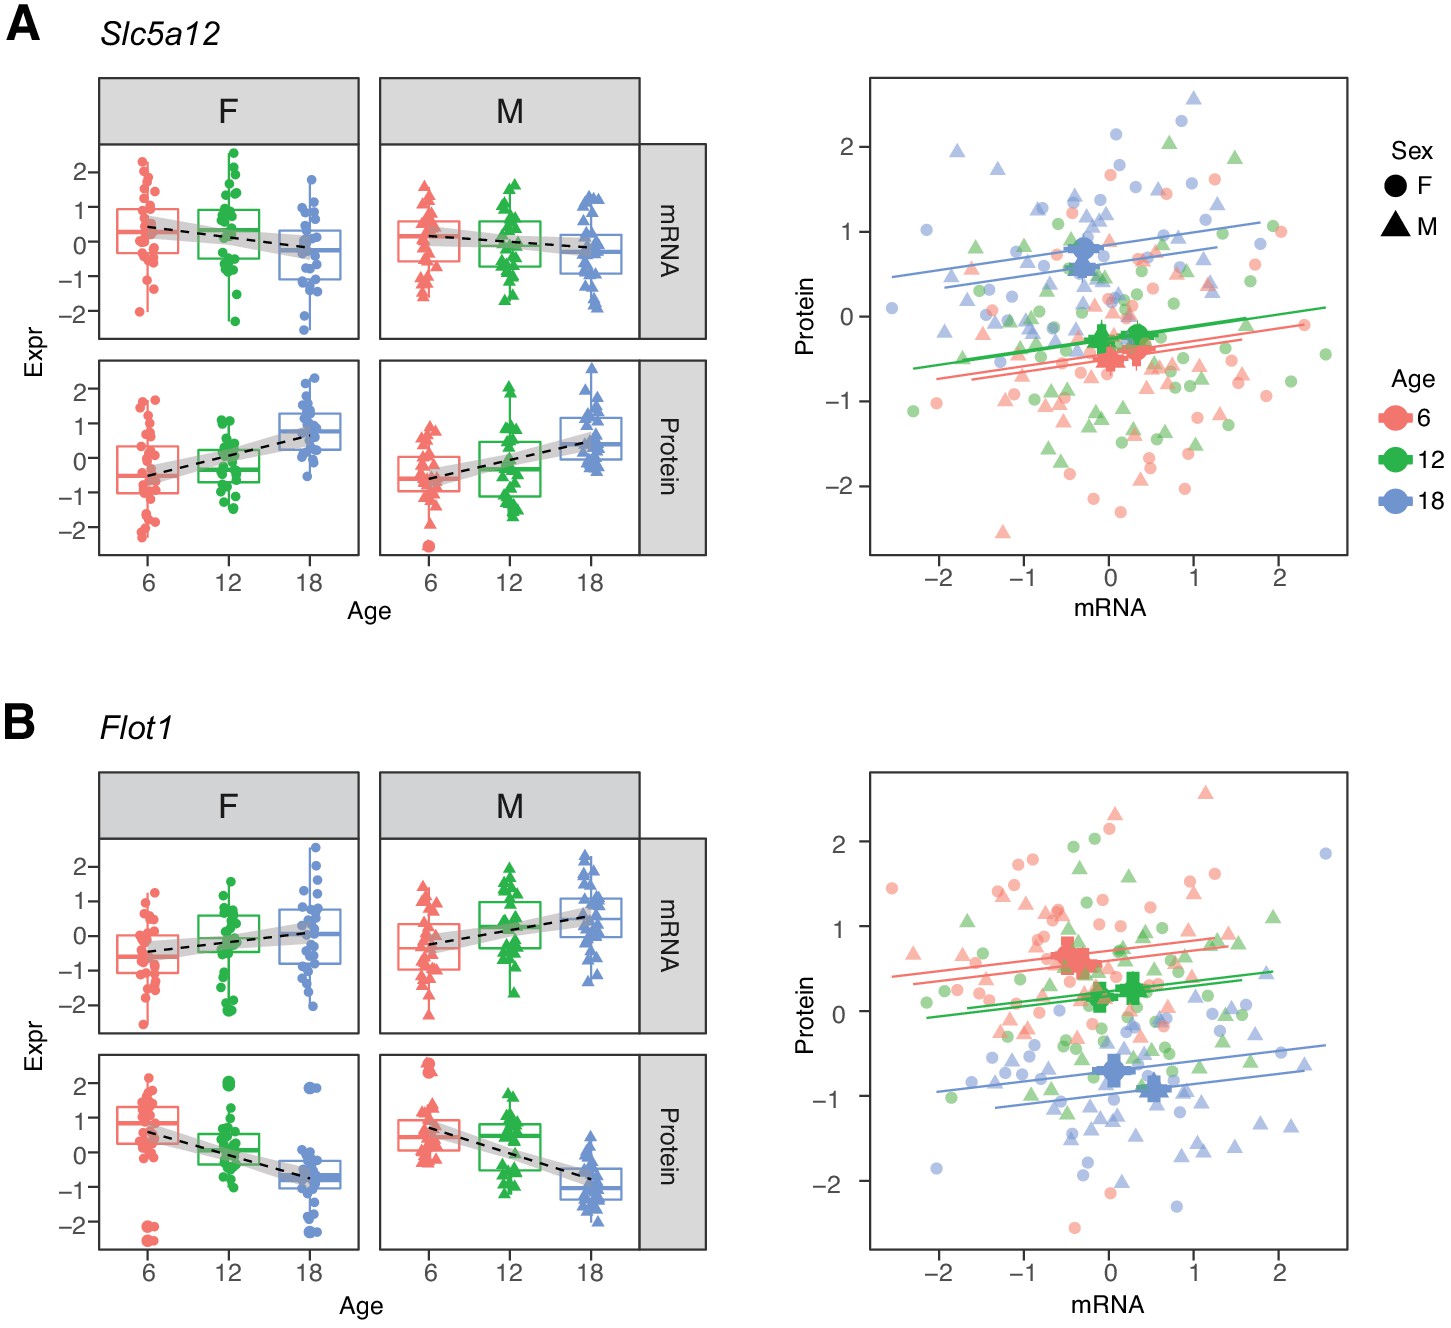
Examples of genes with opposite directions of age-related changes between mRNA and protein.
(A) Slc5a12 shows a decrease in mRNA and an increase in protein with age. Within age groups there is a positive correlation between mRNA and protein expression, but comparison between time points. (B) Flot1 shows the opposite with increased mRNA and decreased protein with age. Females (dots) and males (triangles) at 6 (red), 12 (green), and 18 months (blue) of age.
Figure 7
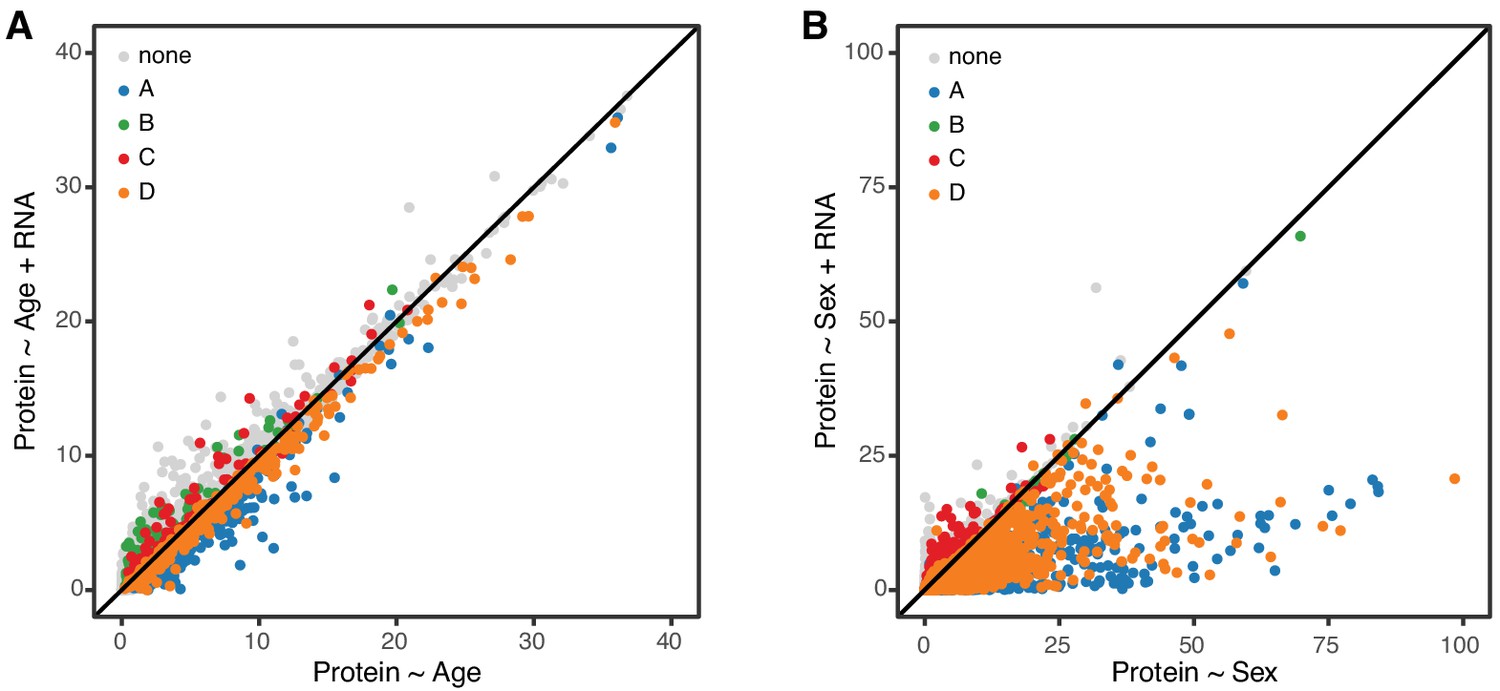
Age-related changes in protein expression are not mediated by mRNA expression.
We computed the −log10 p-value from the likelihood ratio test of the age effect on protein in two regression models, without and with mRNA as a predictor. These are displayed on the x- and y-axes of the plot in panel A. If mRNA is a mediator of the age effect on protein, we expect to see reduced significance of the age effect when mRNA is in the regression model. Each point in the figure represents one gene (mRNA and protein) and they are colored coded to show the concordant and discordant change groups as in Figure 4. The points fall close to the identity line, indicating little or no drop in the −log10 p-values, and thus no evidence for mediation. Panel B shows a similar analysis to evaluate whether mRNA is a mediator of the effects of sex on protein. Here the −log10 p-values for most genes are reduced after including mRNA in the regression model, as expected if the effects of sex on protein are mediated through changes in mRNA.
Figure 8
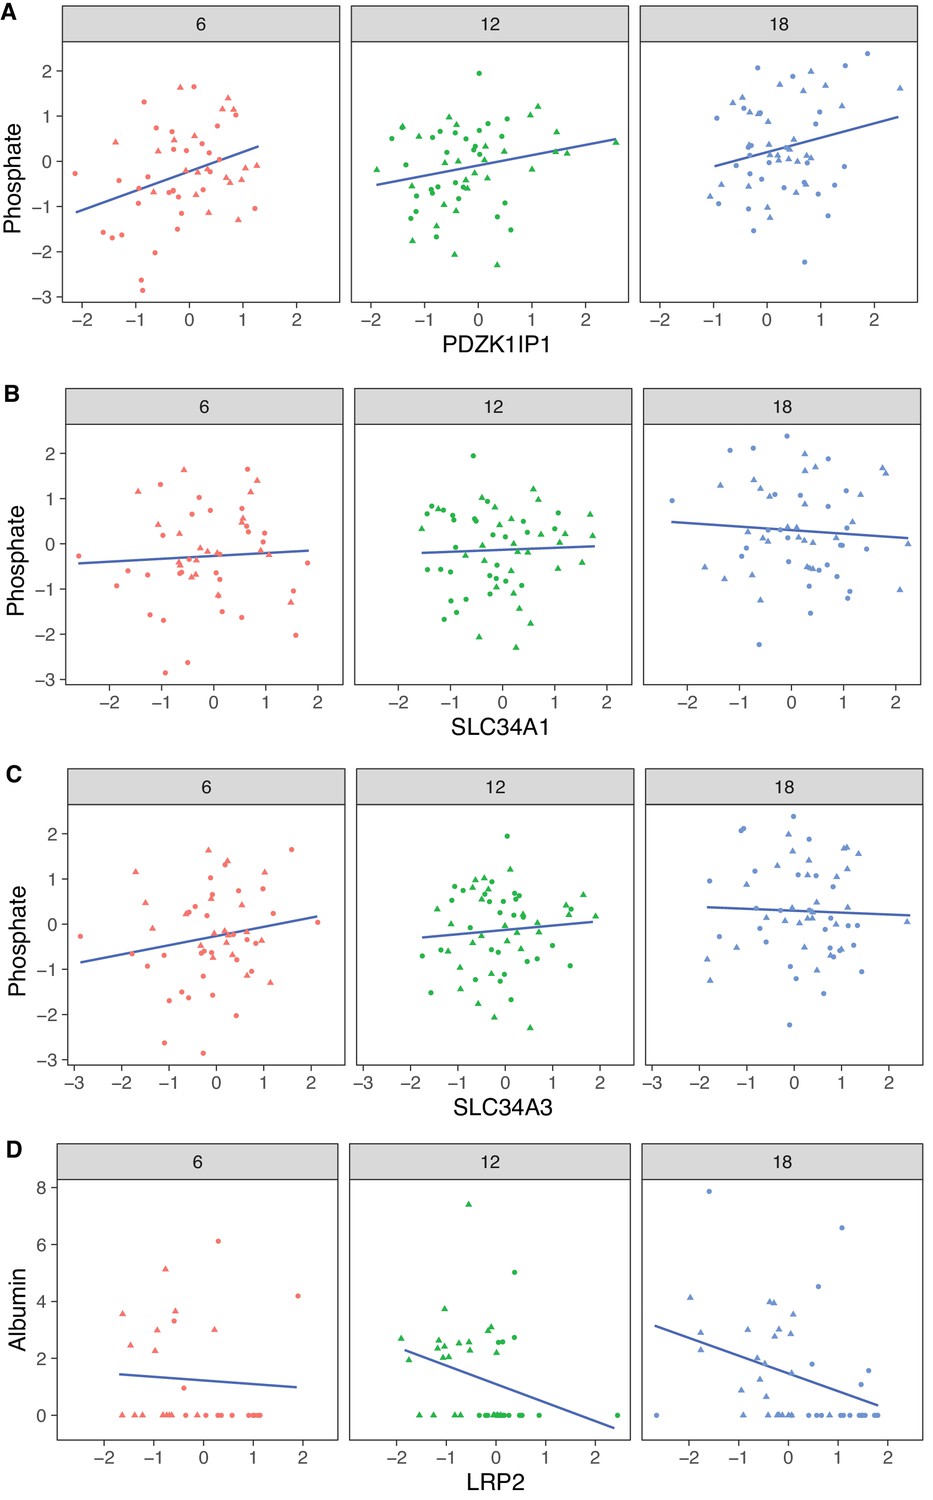
Correlation with phosphate and albumin (normalized to creatinine).
(A) PDZK1IP1 is the protein with the highest correlation with urinary phosphate levels and mediation analysis suggests the protein is a mediator for changes in urinary phosphate levels. There are no significant correlations for phosphate with SLC34A1 (B) or SLC34A3 (C) that form the main phosphate transporter in the proximal tubule. (D) Significant correlation between albumin and its proximal tubule receptor Megalin (LRP2). Females (dots) and males (triangles) at 6 (red), 12 (green), and 18 months (blue) of age.
Figure 9

Pdzk1 (A), Pdzk1ip1 (B), and Lrp2 (C) are genes with decreased mRNA and increased protein expression with age.
Females (dots) and males (triangles) at 6 (red), 12 (green), and 18 months (blue) of age.
Additional files
-
Supplementary file 1
List of genes with significant age-related, sex-related, and age-by-sex interaction-related changes in mRNA expression levels.
- https://cdn.elifesciences.org/articles/62585/elife-62585-supp1-v3.csv
-
Supplementary file 2
List of genes with significant age-related, sex-related, and age-by-sex interaction-related changes in protein expression levels.
- https://cdn.elifesciences.org/articles/62585/elife-62585-supp2-v3.csv
-
Supplementary file 3
List of genes with significant age-associated changes in both mRNA and protein levels and their direction of change.
- https://cdn.elifesciences.org/articles/62585/elife-62585-supp3-v3.csv
-
Transparent reporting form
- https://cdn.elifesciences.org/articles/62585/elife-62585-transrepform-v3.docx
Download links
A two-part list of links to download the article, or parts of the article, in various formats.
Downloads (link to download the article as PDF)
Open citations (links to open the citations from this article in various online reference manager services)
Cite this article (links to download the citations from this article in formats compatible with various reference manager tools)
Proteomic and transcriptomic profiling reveal different aspects of aging in the kidney
eLife 10:e62585.
https://doi.org/10.7554/eLife.62585


