Single-cell RNA-seq reveals transcriptomic heterogeneity mediated by host–pathogen dynamics in lymphoblastoid cell lines
- Department of Molecular Genetics and Microbiology, Center for Virology, Duke University School of Medicine, United States
- Department of Biostatistics and Bioinformatics, Duke University School of Medicine, United States
- Department of Pharmacology and Cancer Biology, Duke University School of Medicine, United States
- Department of Medicine, University of Massachusetts Medical School, United States
- Duke Molecular Physiology Institute and Department of Neurology, Duke University School of Medicine, United States
- Department of Pathology and Laboratory Medicine, Warren Alpert Medical School, Brown University, United States
Figures
Figure 1 with 16 supplements
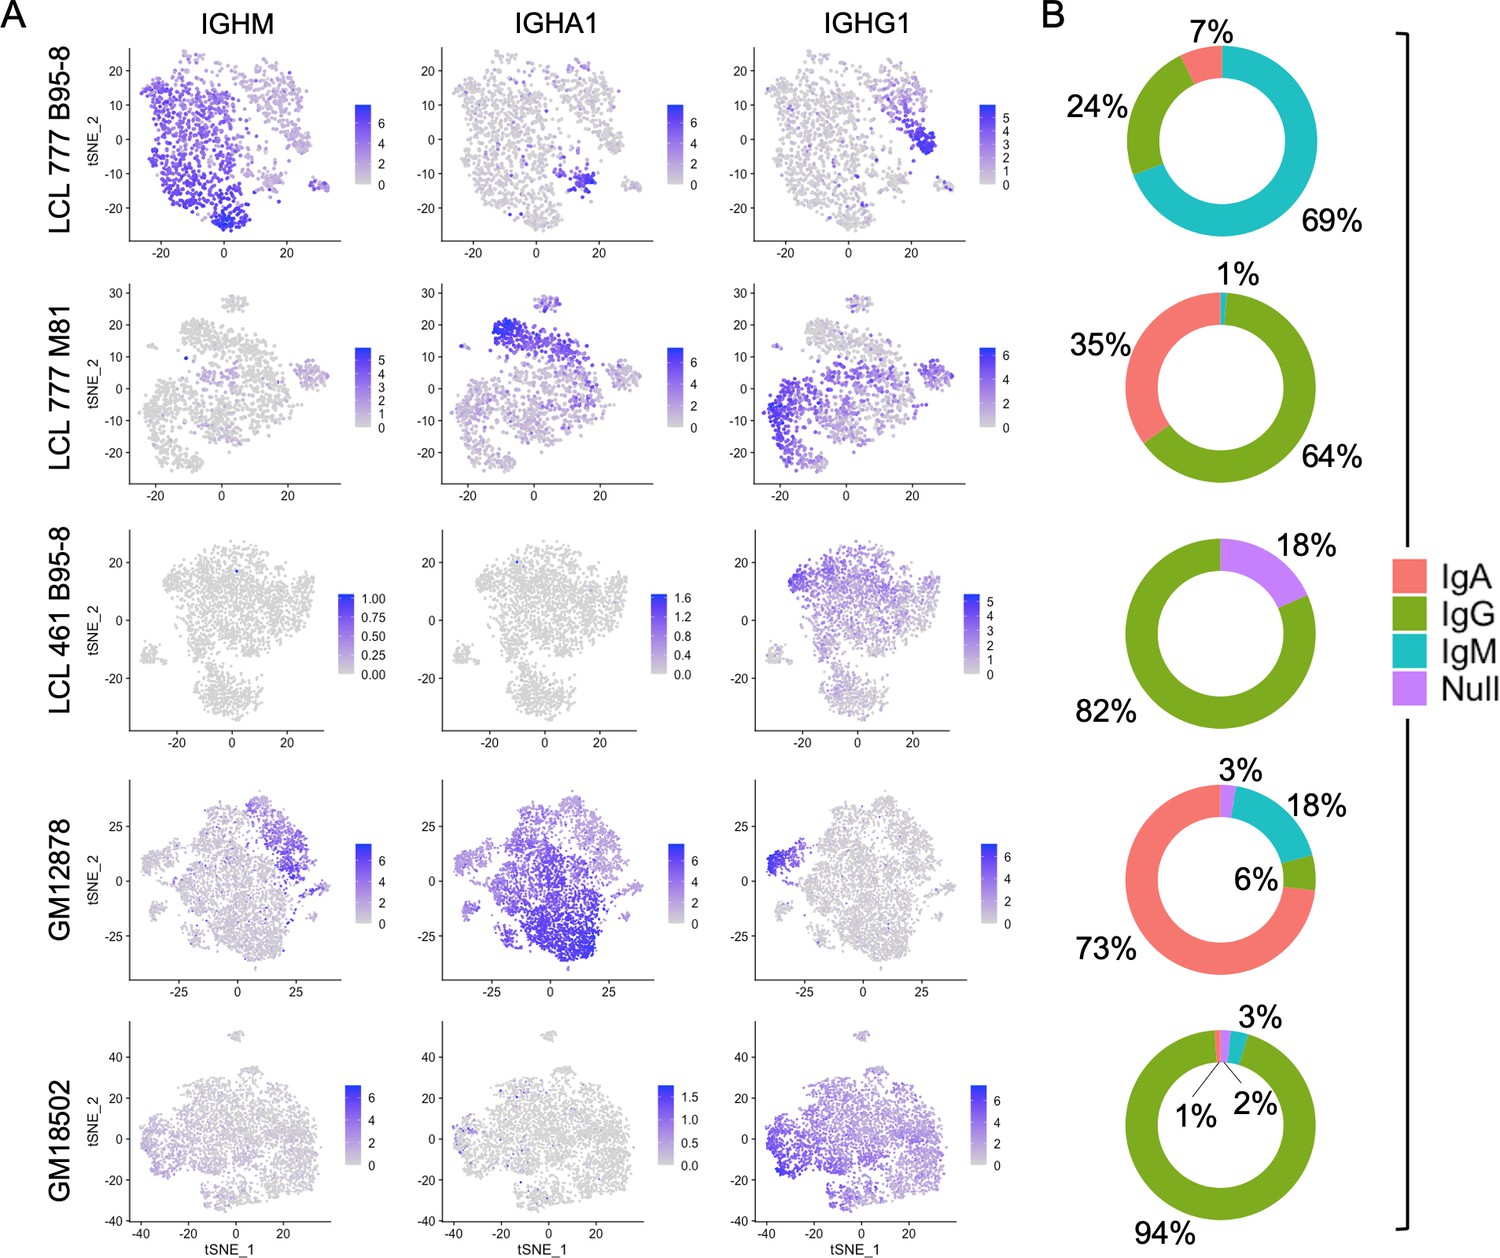
Immunoglobulin isotype heterogeneity within and across lymphoblastoid cell lines (LCLs).
(A) Relative expression of immunoglobulin heavy chain genes (IGHM, IGHA1, and IGHG1) in five LCLs analyzed by single-cell RNA sequencing. Data are represented by dimensional reduction (t-distributed stochastic neighbor embedding) of principal components generated from feature selection following out-regression of cell cycle markers (see Experimental methods). (B) Percentage of cells in LCL population within each isotype class. Null classification represents cells exhibiting negligible immunoglobulin heavy chain expression.
Figure 1—figure supplement 1
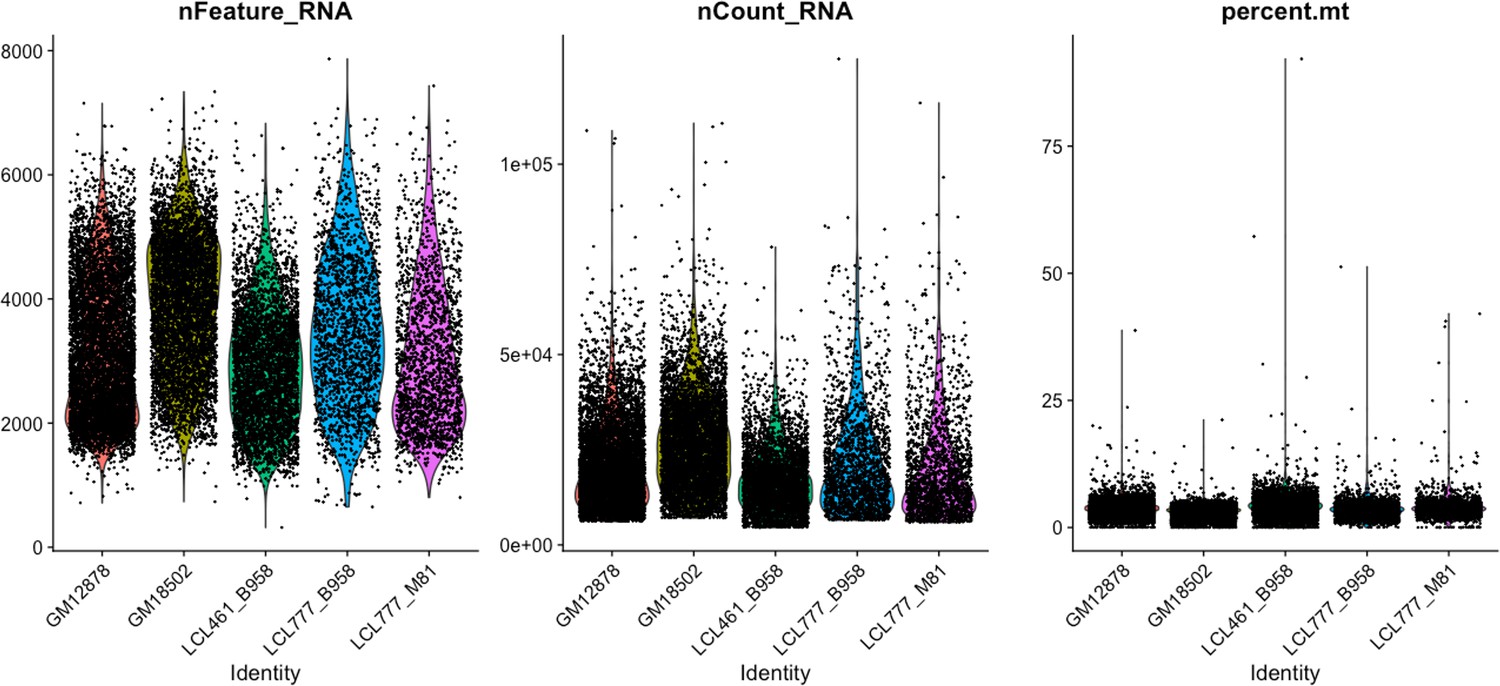
Distributions of features used for QC across five lymphoblastoid cell line (LCL) samples.
Figure 1—figure supplement 2
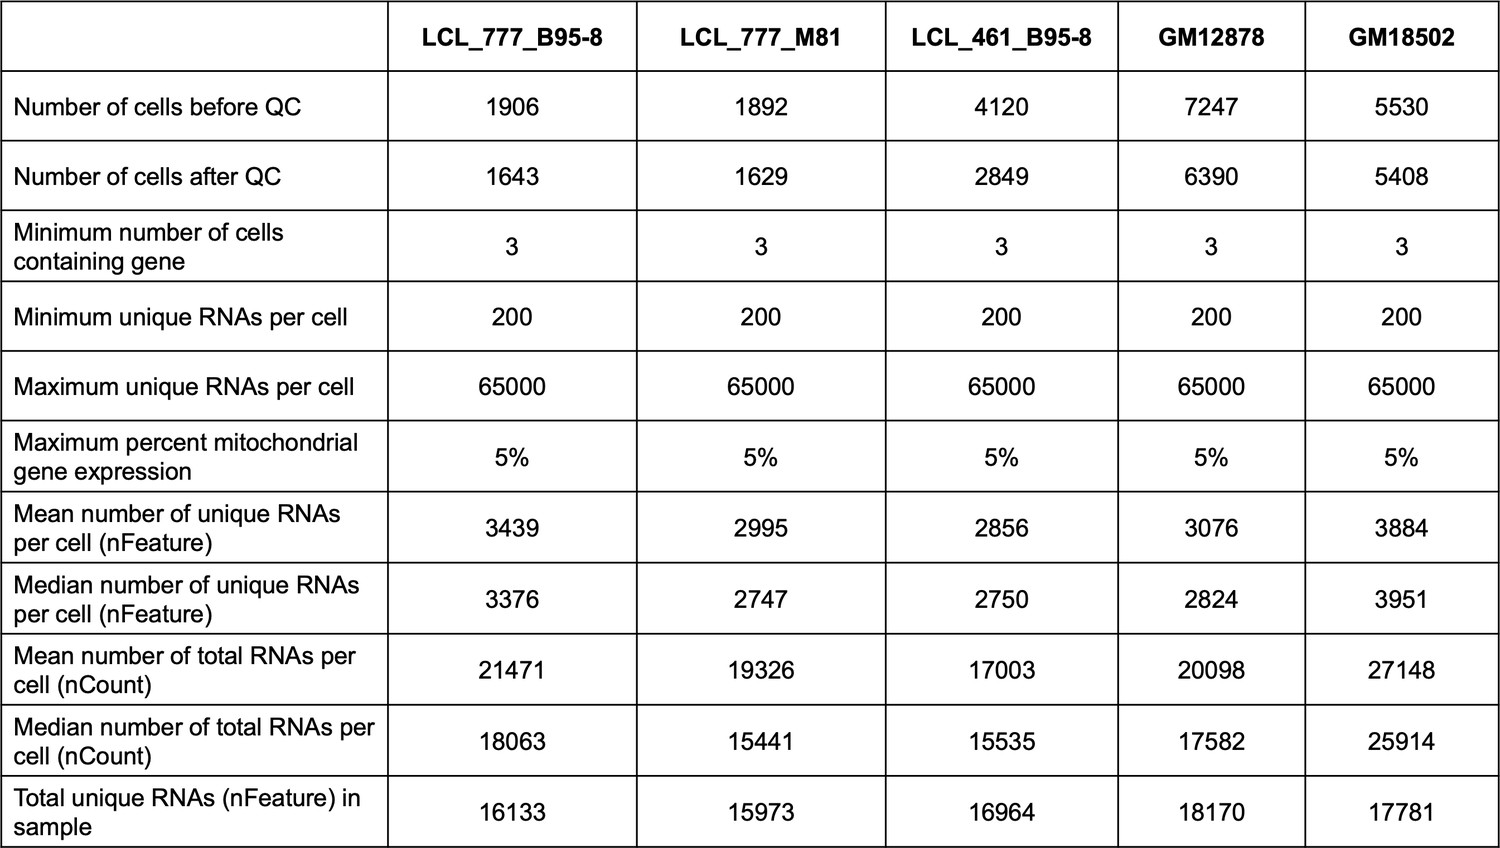
Summary of QC statistics across five lymphoblastoid cell line (LCL) samples.
Cell lines were cultured in R10 media with 5% CO2, and all samples were prepared using the 10× Genomics Chromium Controller with v2 chemistry (see Materials and methods).
Figure 1—figure supplement 3
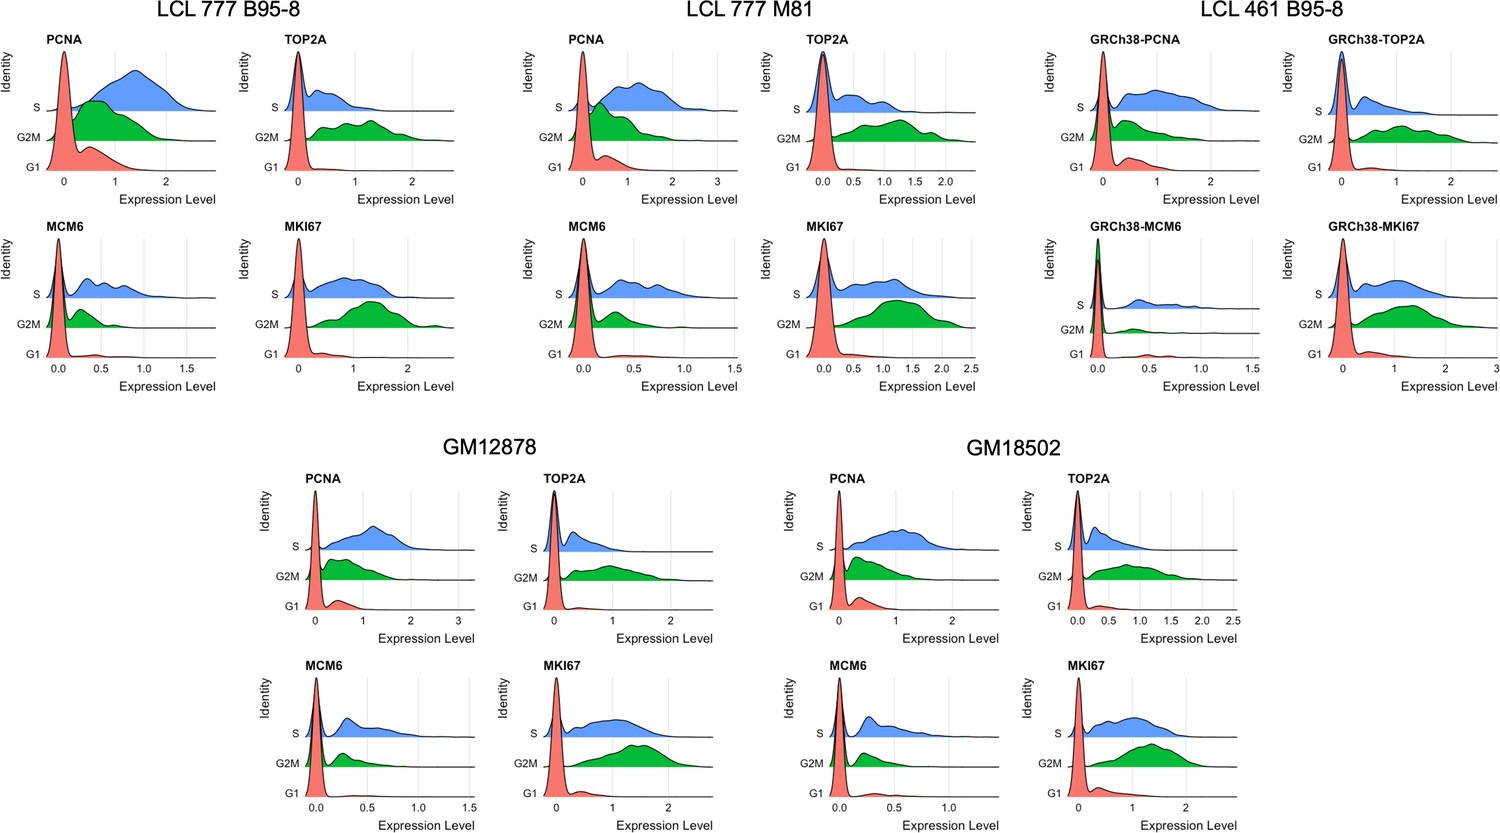
Distributions of representative markers used for cell cycle scoring and regression.
Figure 1—figure supplement 4
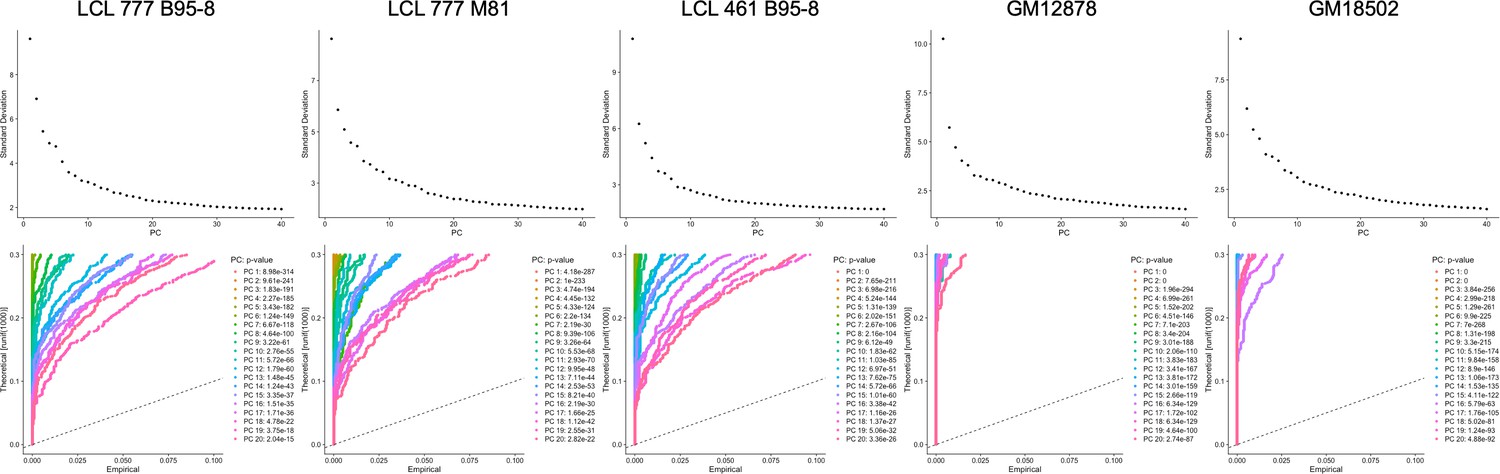
Elbow and Jackstraw plots used for determination of principal components to use for dimensional reduction and clustering.
Figure 1—figure supplement 5
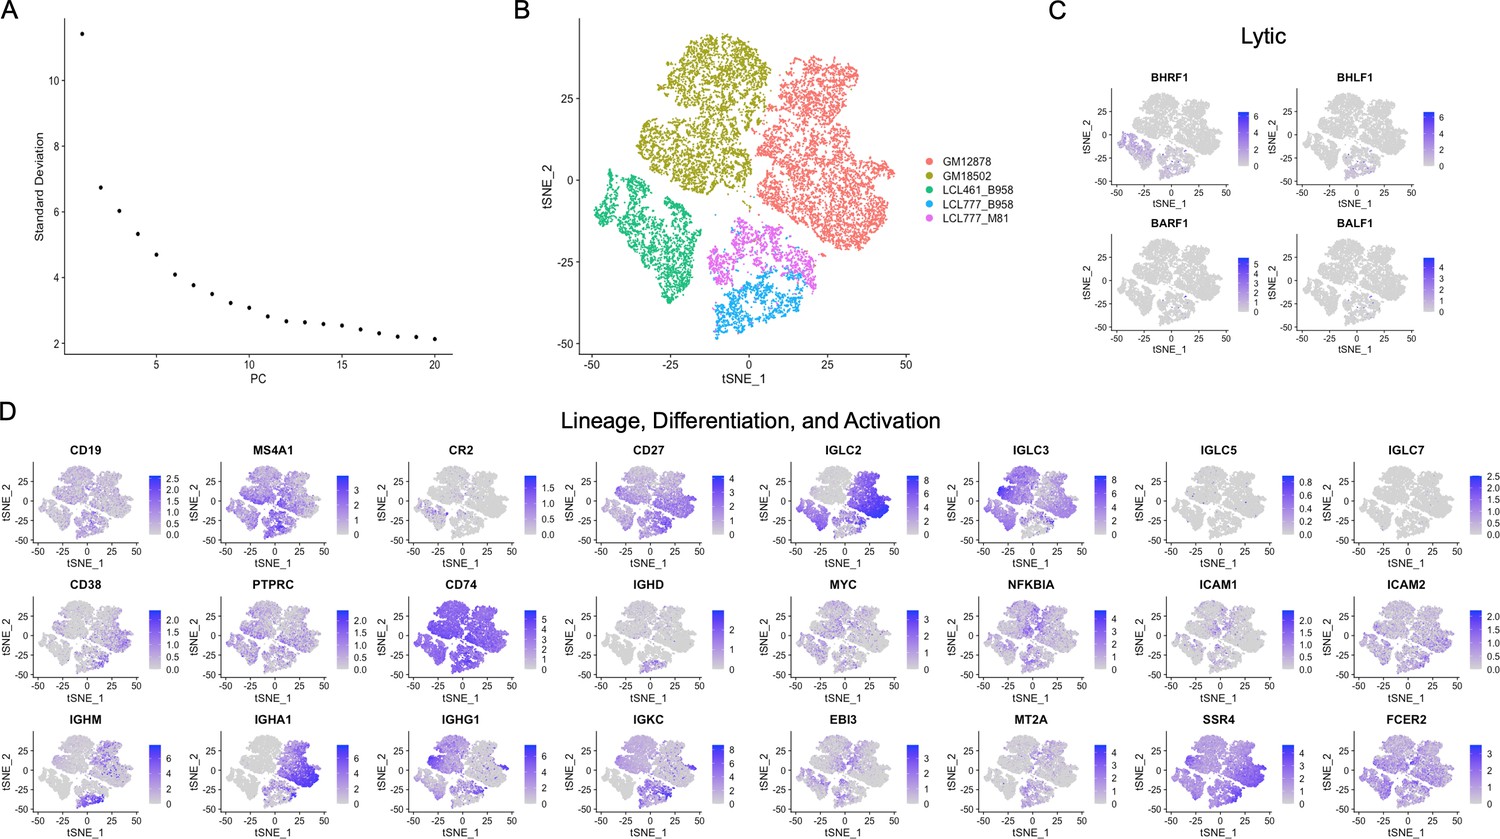
Merged sample analysis.
(A) Elbow plot showing variation captured by the first 20 principal components for the five lymphoblastoid cell line (LCL) merged data sets. (B) t-distributed stochastic neighbor embedding (tSNE) plot of the merged data set. Inter-donor diversity is the predominant source of variance within the merged data set, as evidenced by low-resolution clustering. The two clusters corresponding to samples derived from the same donor (LCL 777) and infected with different viral strains exhibit proximity. (C and D) Expression of lytic genes and other genes of interest in the merged data set. The merged data set indicates hierarchical diversity across LCLs, with similar intra-donor patterns of expression manifesting in clusters distinguished by inter-donor heterogeneity.
Figure 1—figure supplement 6
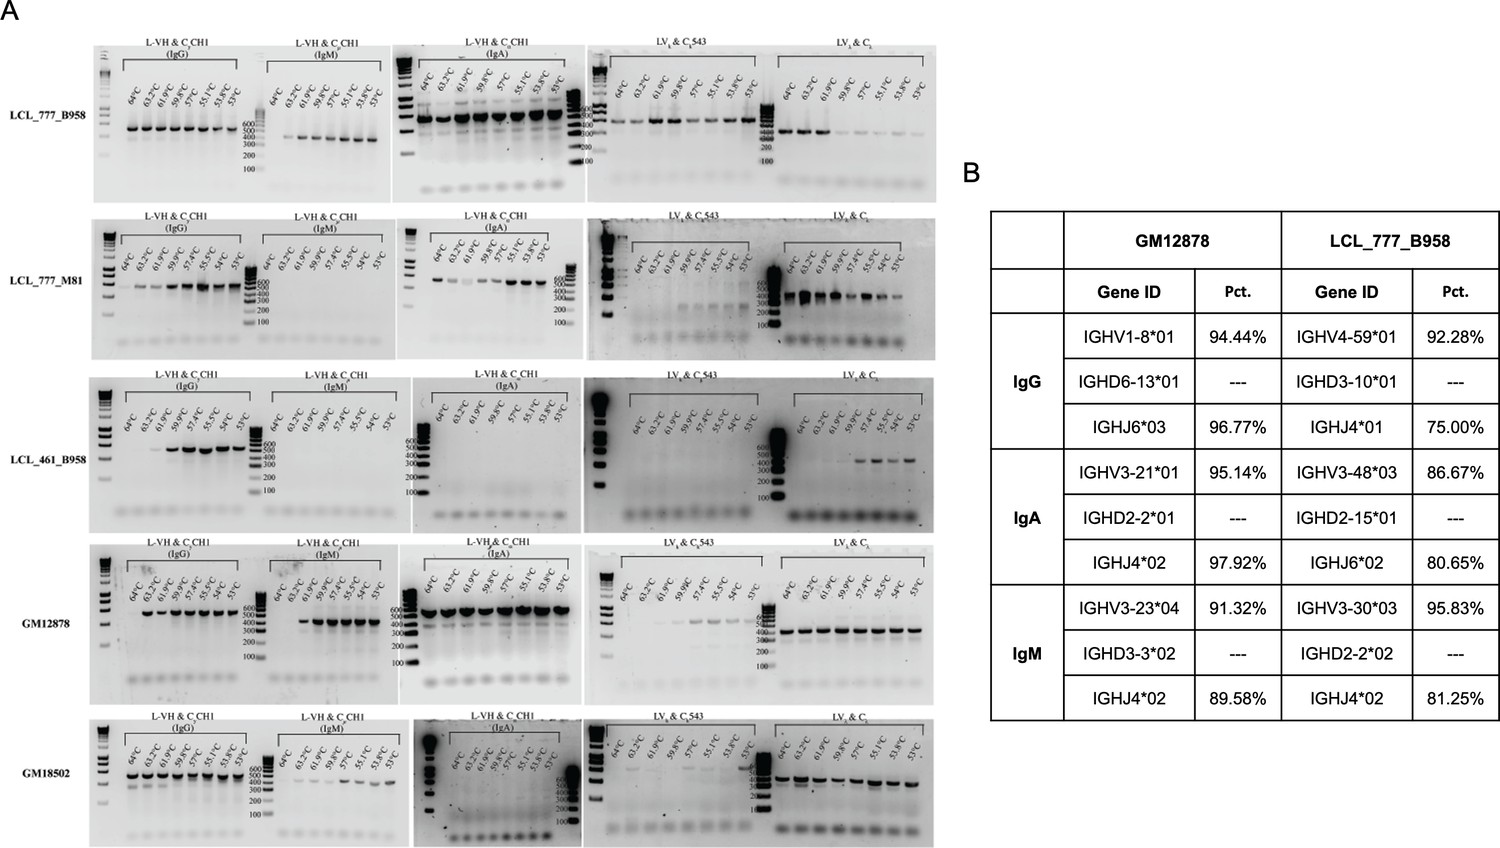
Validation of Ig heavy and light chain (poly)clonality for five lymphoblastoid cell lines (LCLs).
(A) Heavy and light chain isotype targeted PCR products in each of the five LCLs are consistent with the Ig composition captured by single-cell sequencing. (B) IMGT sequence alignment of two LCLs demonstrate that cells expressing a given heavy chain isotype are largely monoclonal.
Figure 1—figure supplement 7
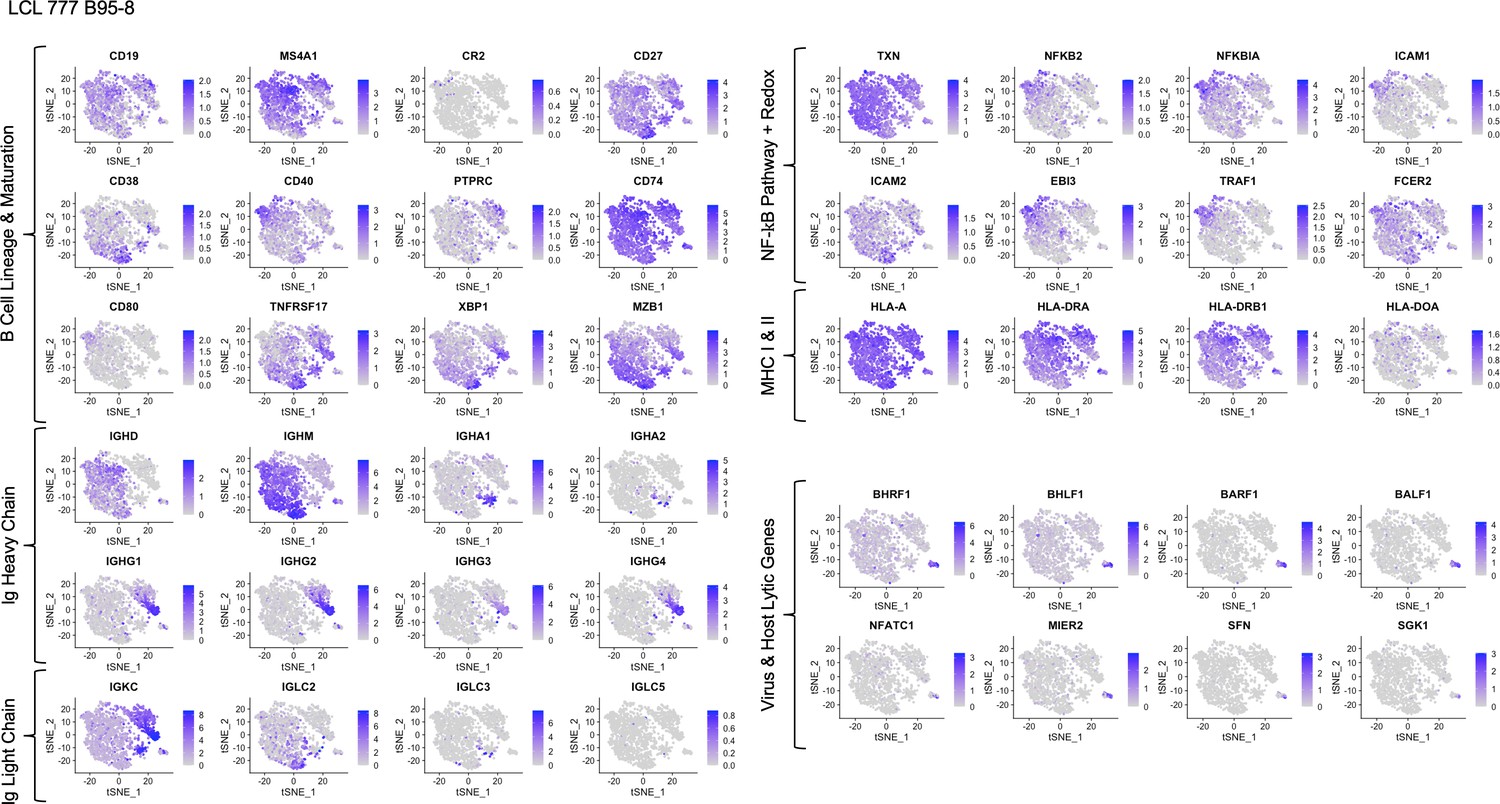
Expression of key gene groups in LCL 777 B95-8.
Figure 1—figure supplement 8
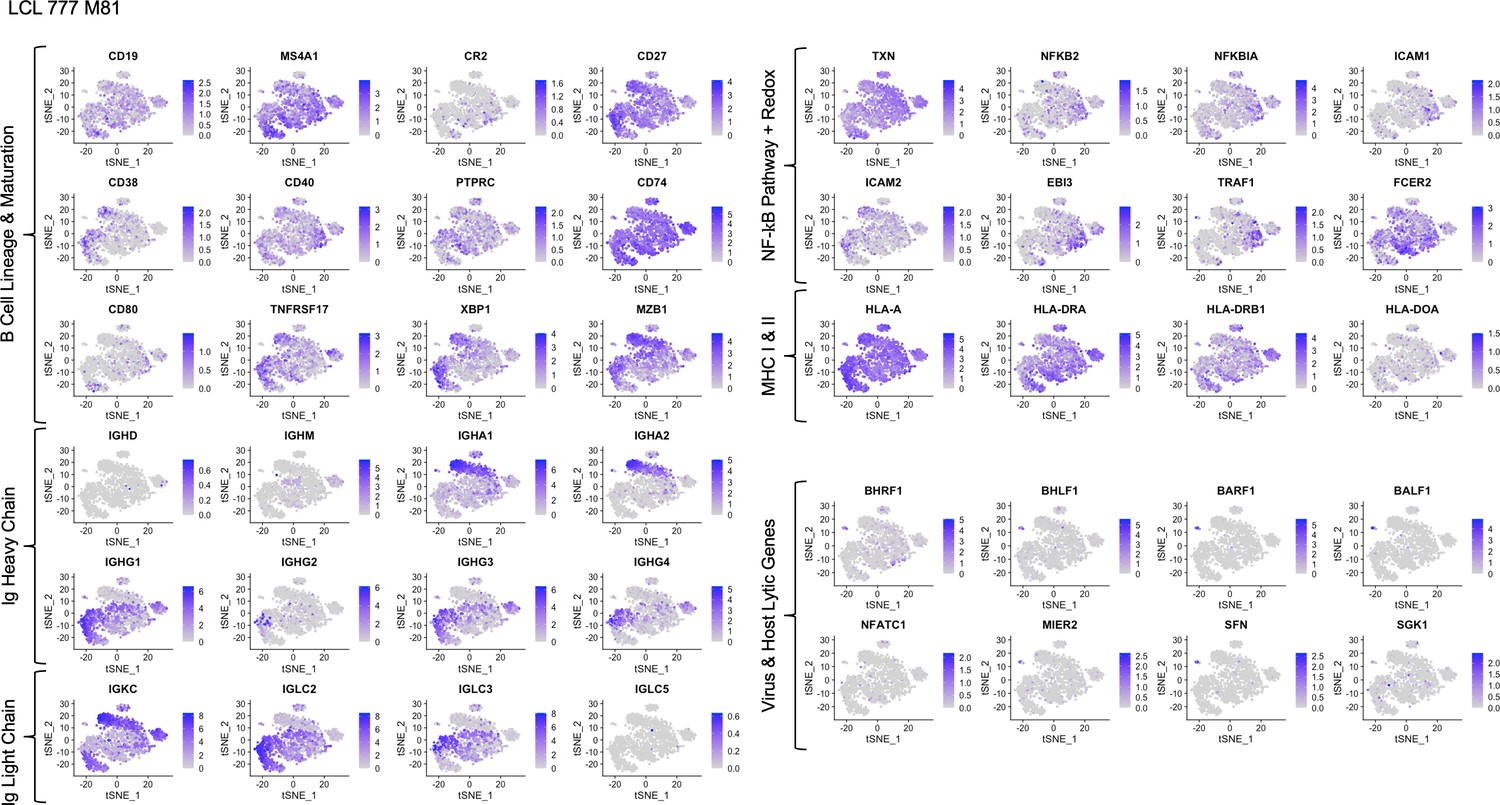
Expression of key gene groups in LCL 777 M81.
Figure 1—figure supplement 9
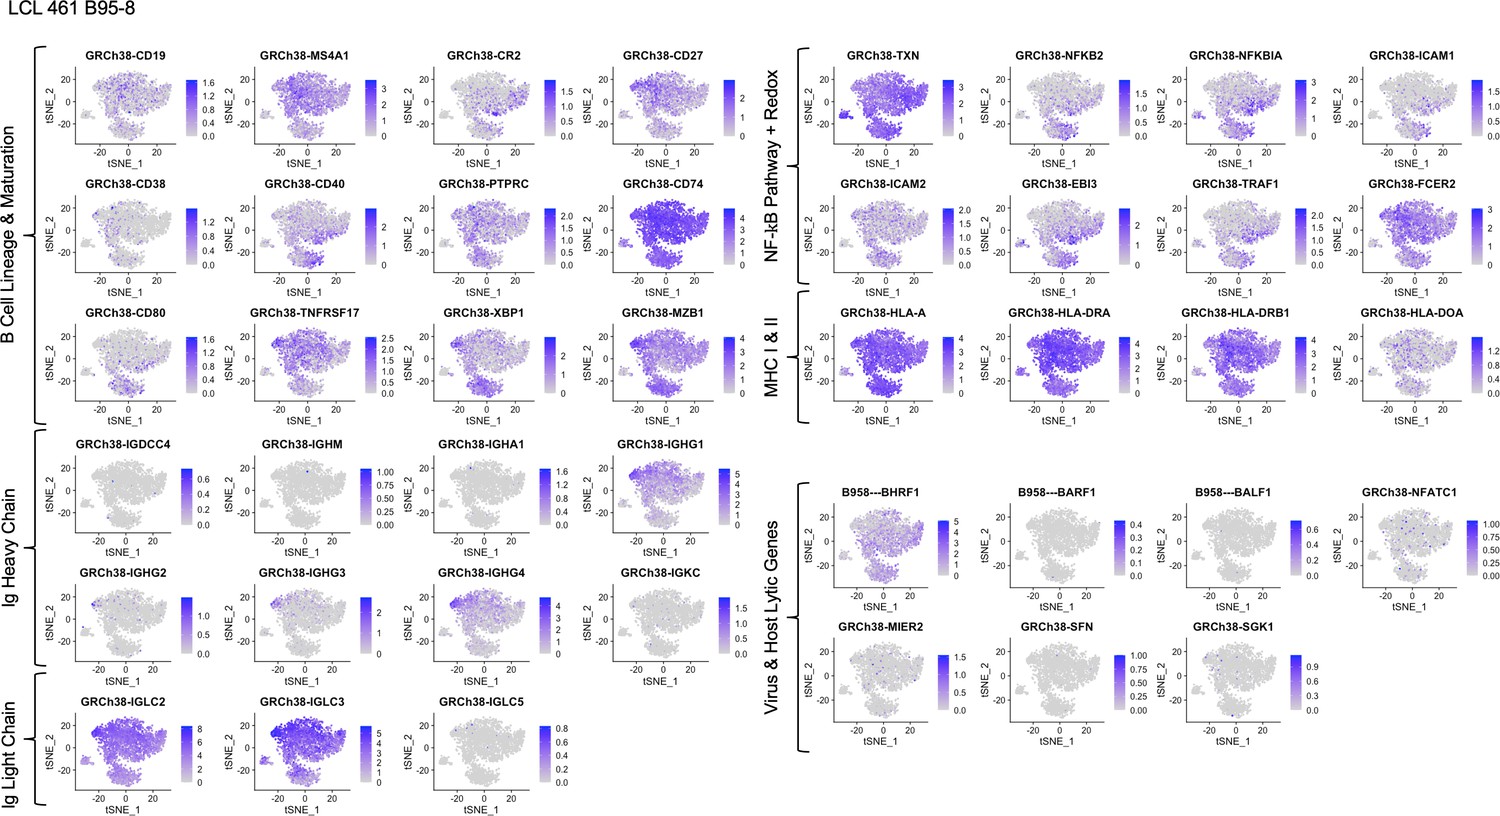
Expression of key gene groups in LCL 461 B95-8.
Figure 1—figure supplement 10
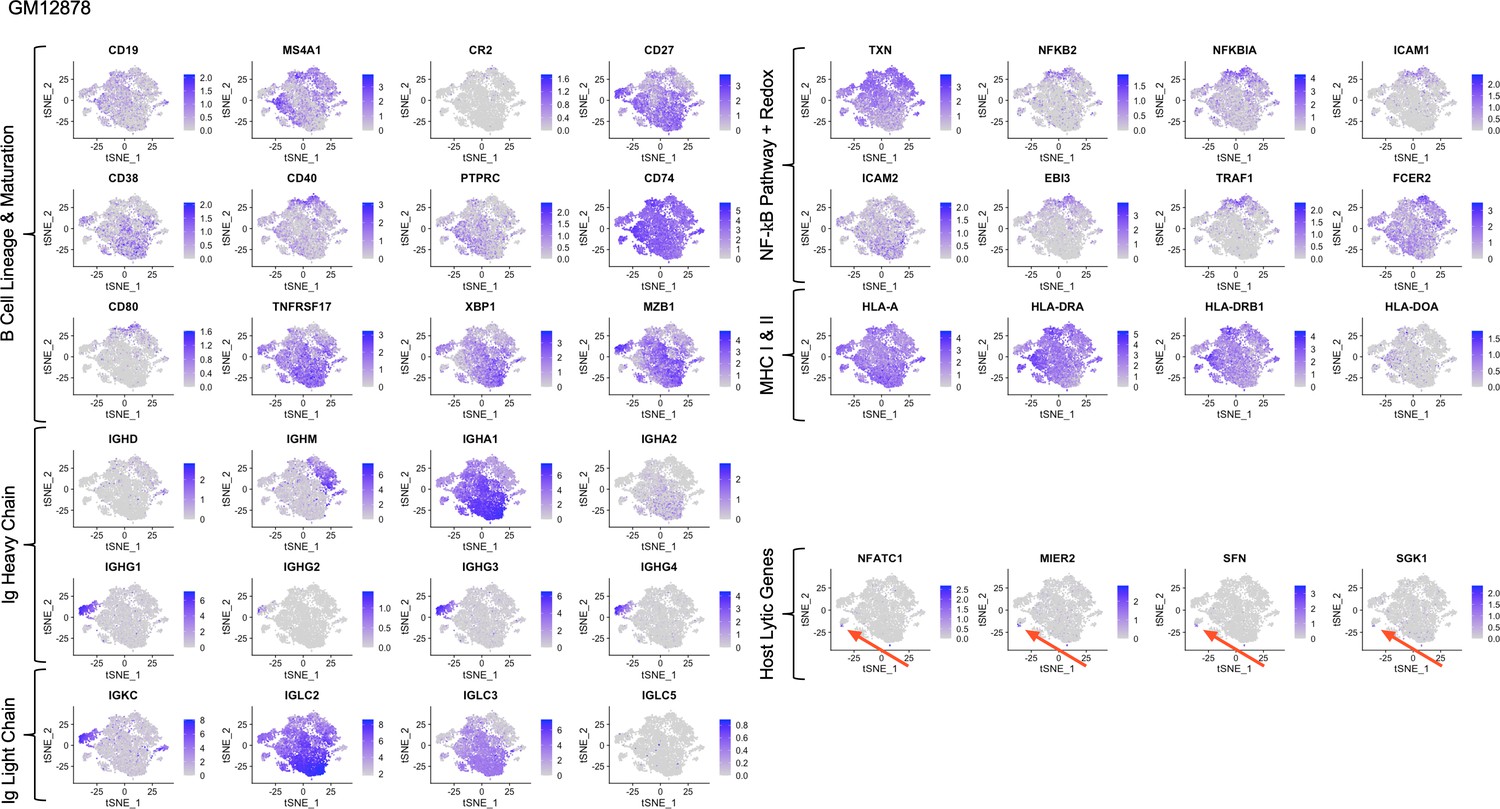
Expression of key gene groups in GM12878.
Figure 1—figure supplement 11
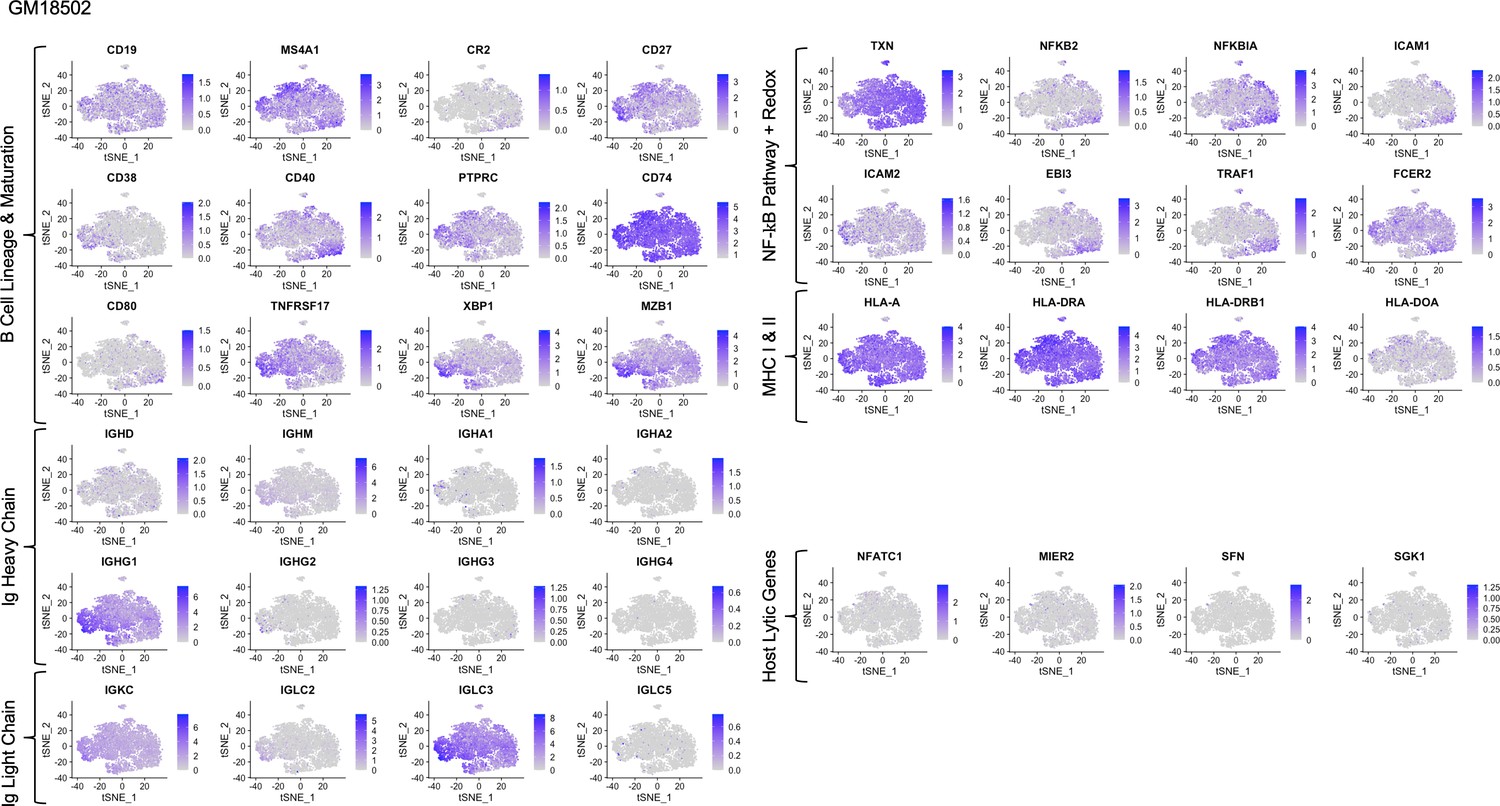
Expression of key gene groups in GM18502.
Figure 1—figure supplement 12
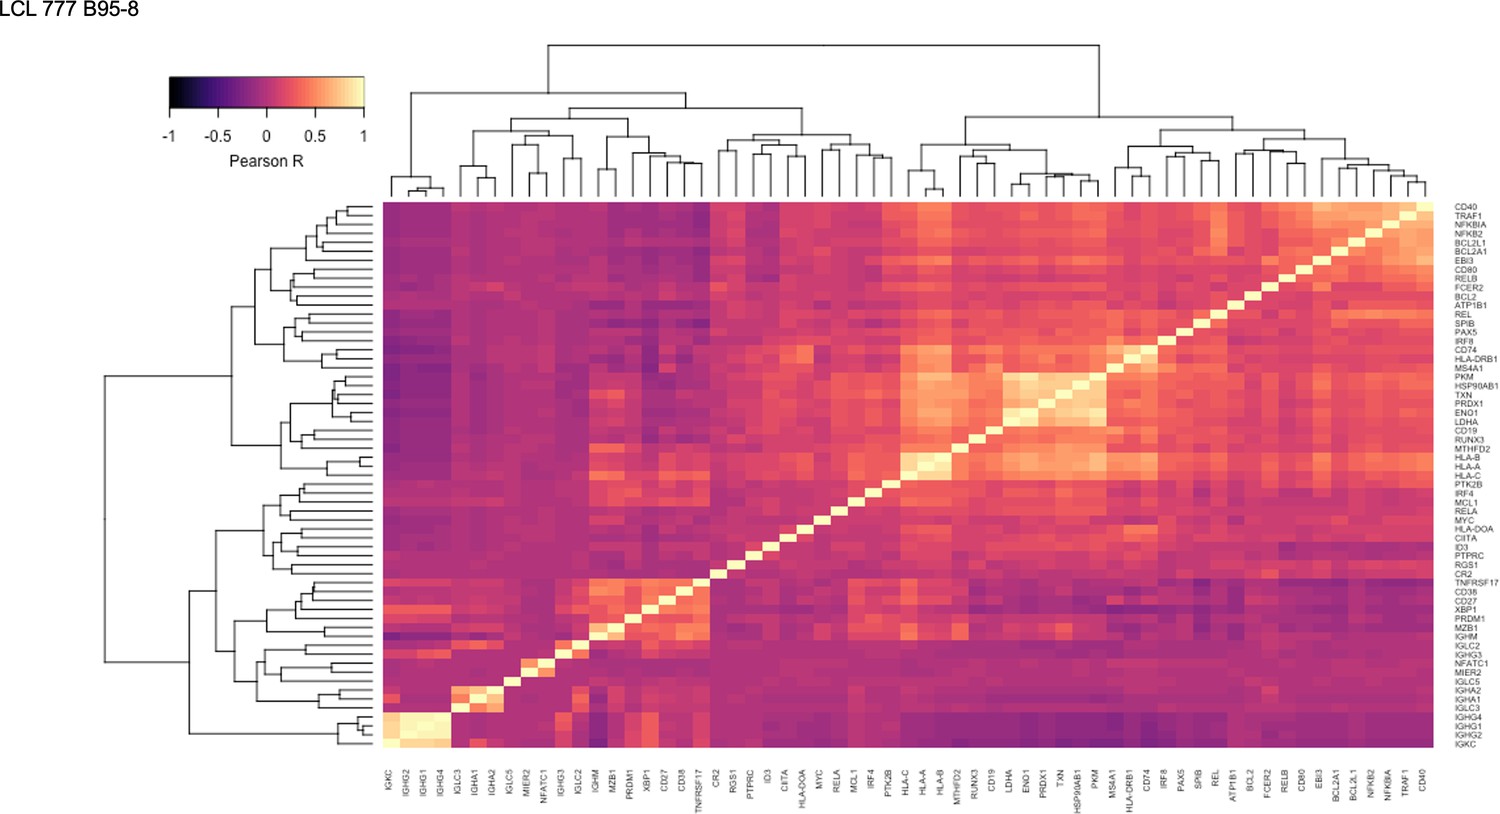
Pairwise Pearson correlation values across key gene groups in LCL 777 B95-8.
Figure 1—figure supplement 13
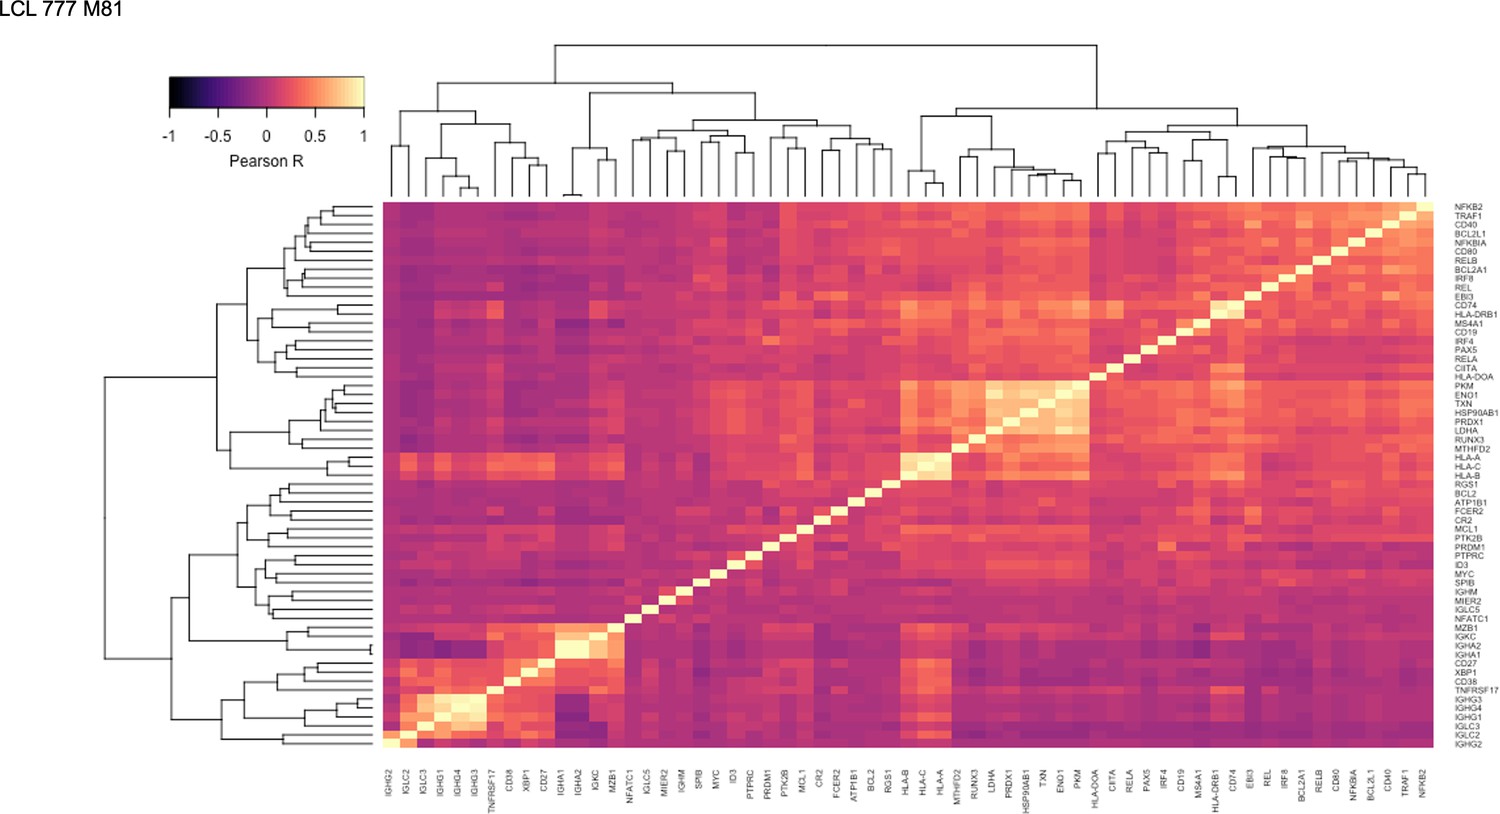
Pairwise Pearson correlation values across key gene groups in LCL 777 M81.
Figure 1—figure supplement 14
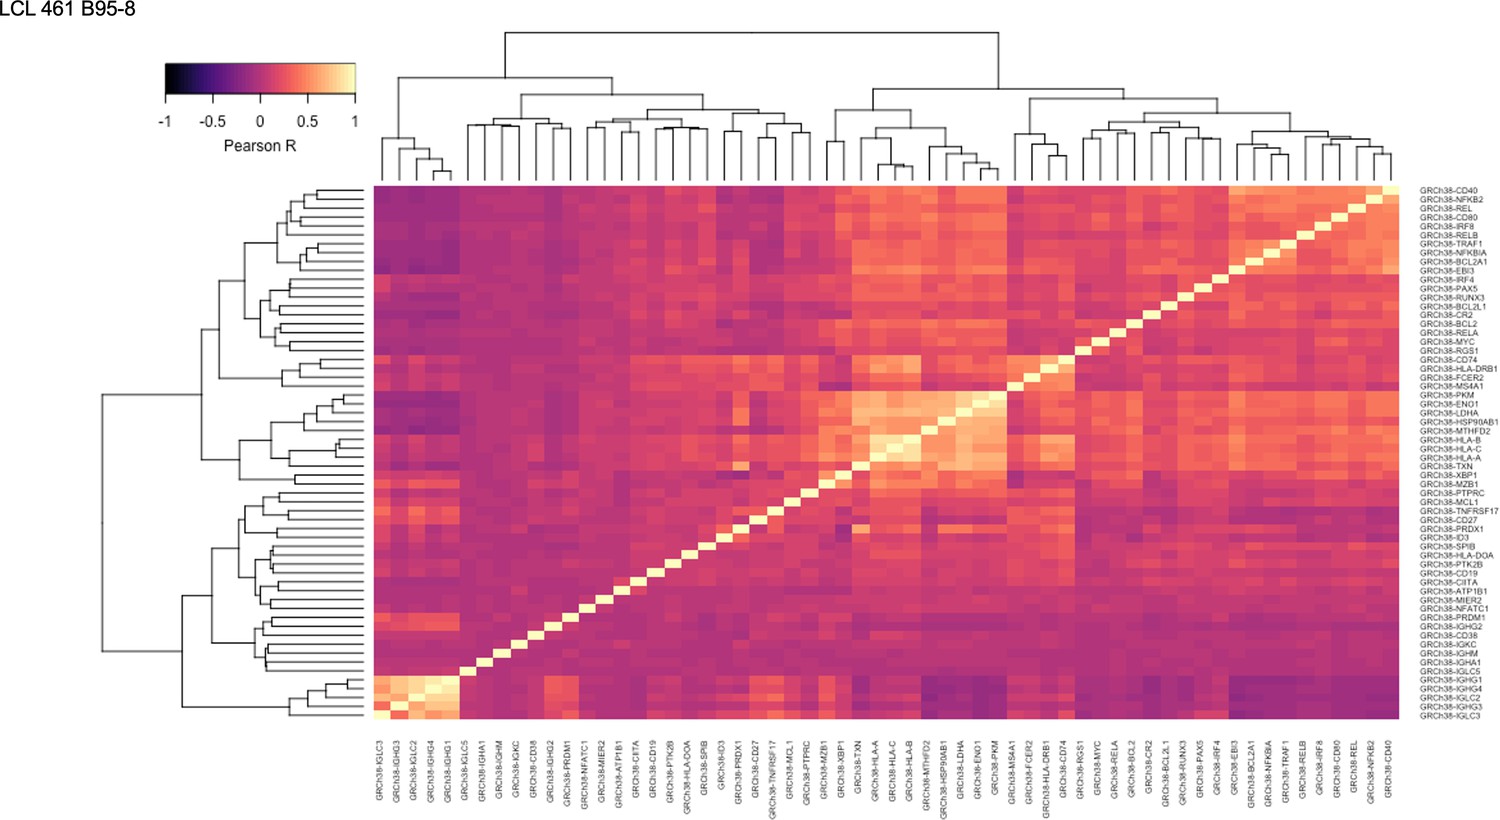
Pairwise Pearson correlation values across key gene groups in LCL 461 B95-8.
Figure 1—figure supplement 15
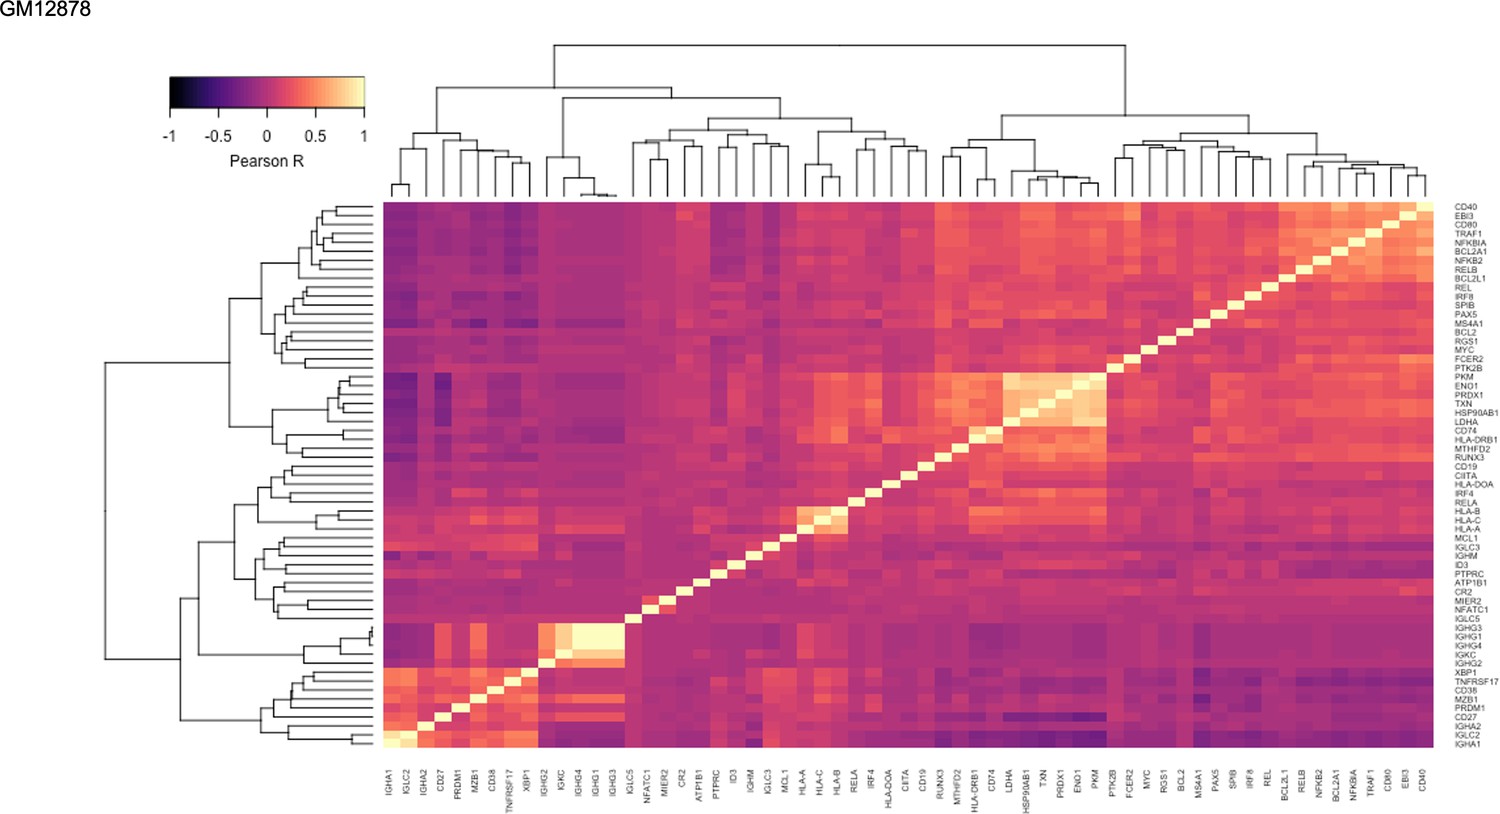
Pairwise Pearson correlation values across key gene groups in GM12878.
Figure 1—figure supplement 16
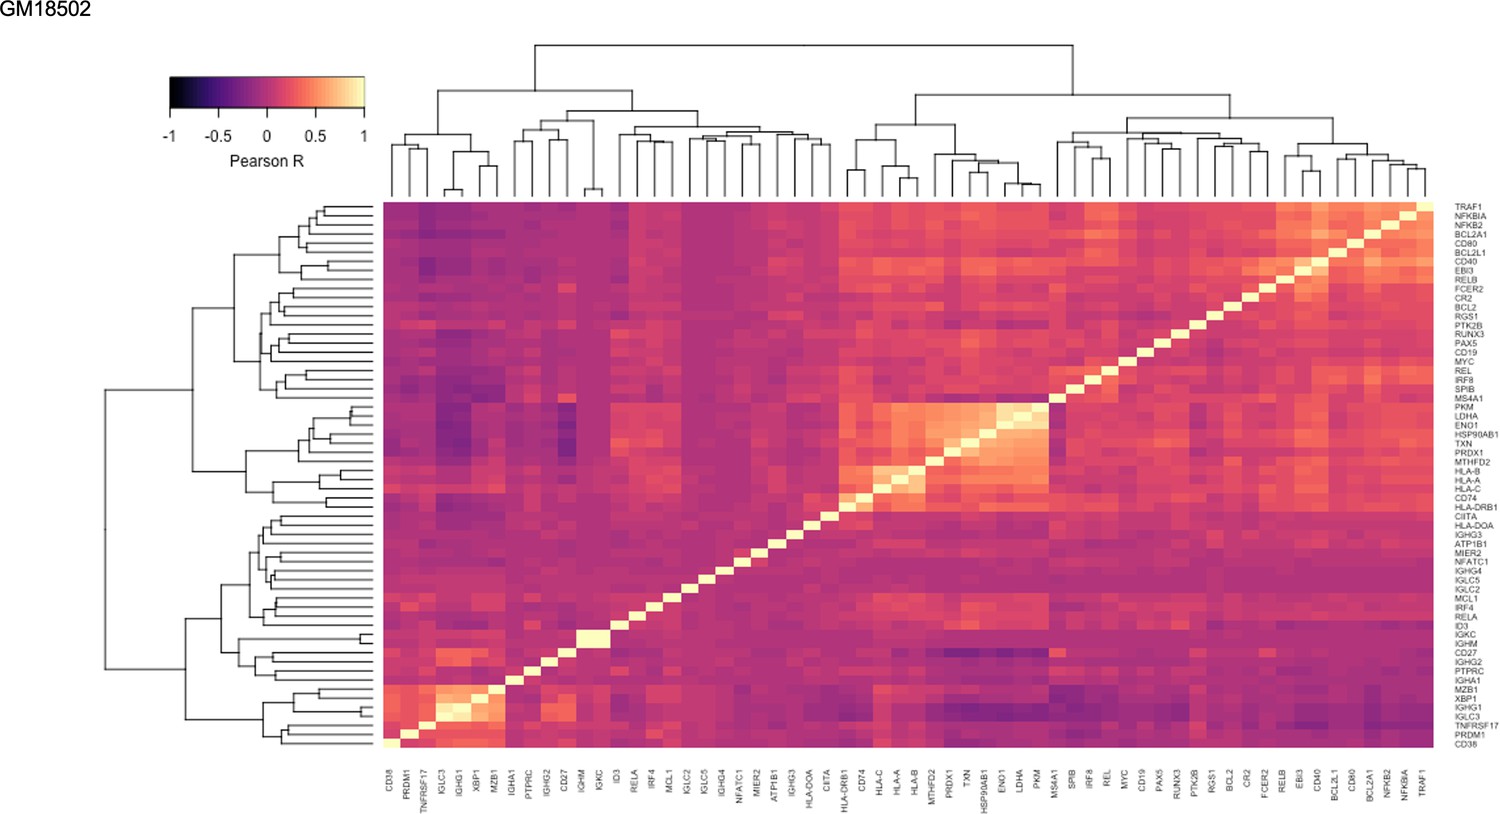
Pairwise Pearson correlation values across key gene groups in GM18502.
Figure 2 with 8 supplements
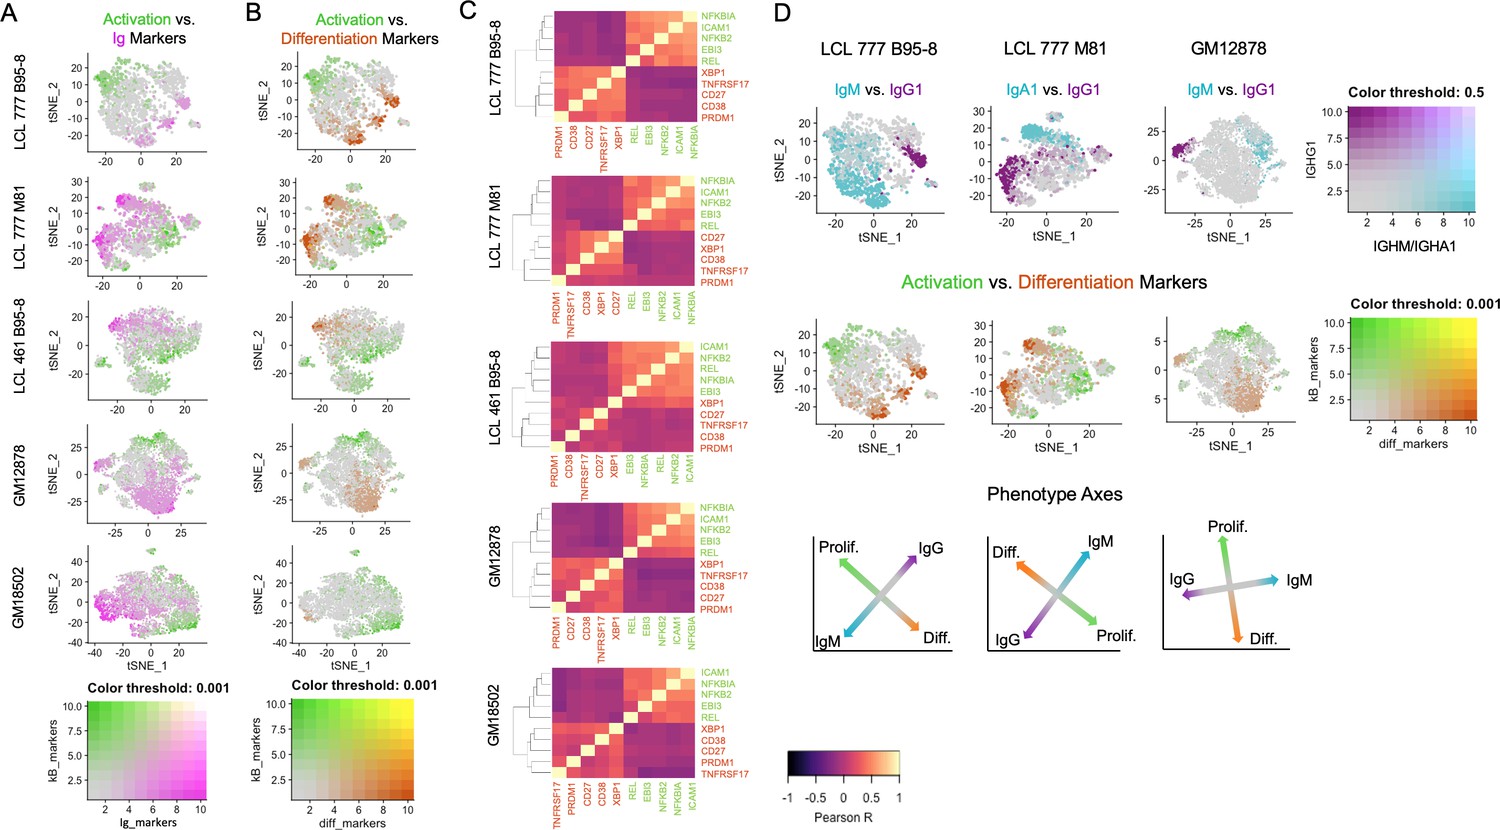
Lymphoblastoid cell lines (LCLs) exhibit anticorrelated expression gradients of activation and differentiation genes.
(A) Inverse expression gradients of immunoglobulin genes (IGHM, IGHA1, and IGHG1) in magenta and NFκB targets (NFKB2, NFKBIA, EBI3, ICAM1, and BCL2A1) and TXN in green. (B) Similar inverse gradients of NFκB targets in green and B cell differentiation markers (TNFRSF17, XBP1, MZB1, CD27, and CD38) in orange. (C) Pearson correlation maps and hierarchical clustering reveal negative correlation of differentiation (orange) and activation (green) gene sets and positive correlations between genes within each set. (D) In LCLs comprising multiple immunoglobulin isotypes, heavy chain class and differentiation/activation gradients constitute orthogonal (independent) axes of phenotypic variance.
Figure 2—figure supplement 1
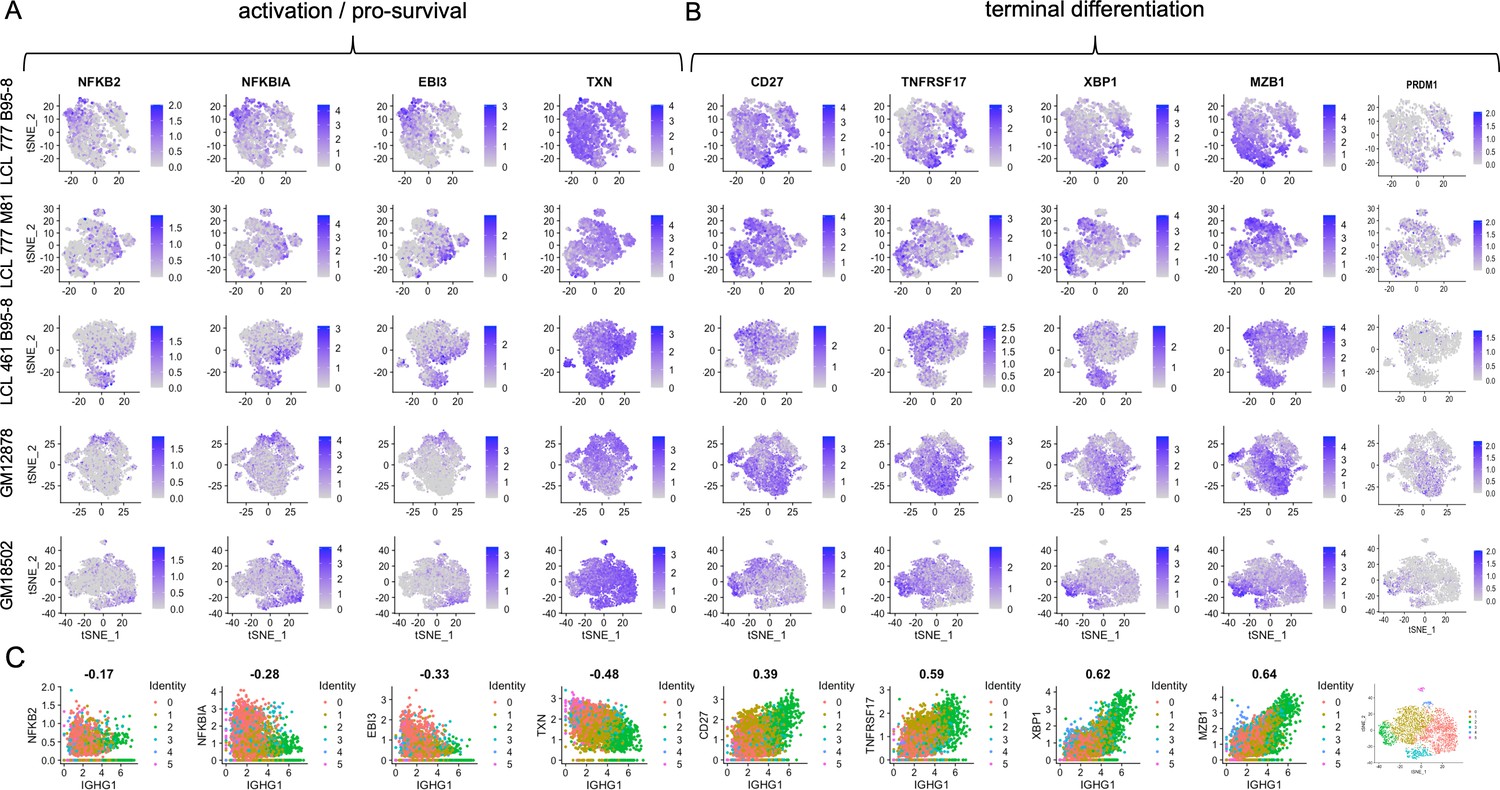
Expression of individual genes within activation and differentiation gene sets.
(A) Expression of genes involved in activation/pro-survival of B cells. (B) Expression of genes involved in B cell differentiation. (C) Correlation of each activation and differentiation gene with IgG1 expression for GM18502 (a sample with a single isotype class).
Figure 2—figure supplement 2
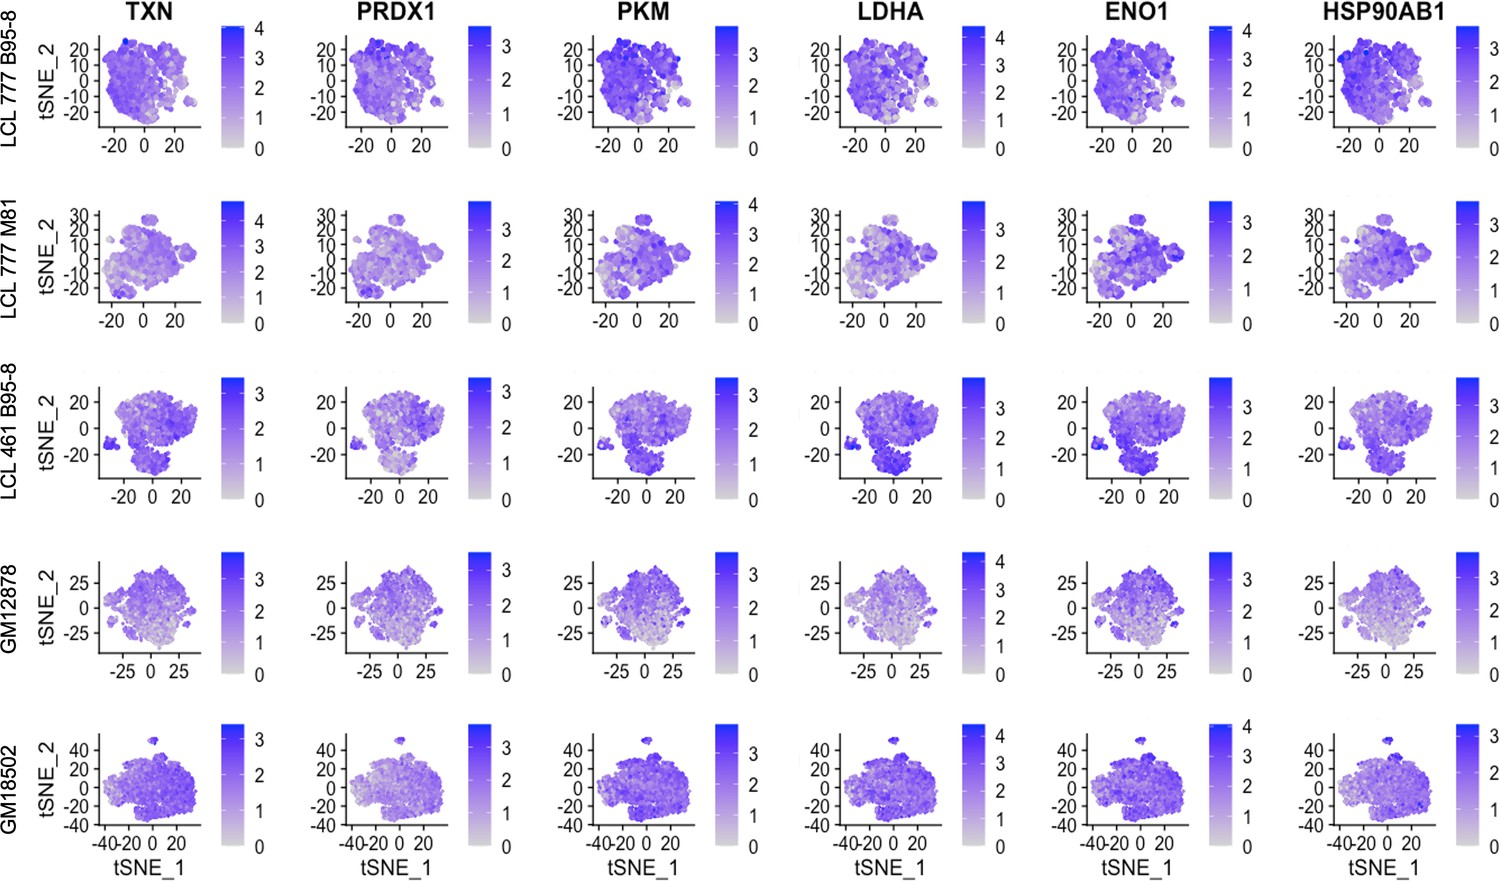
Expression of metabolic and oxidative stress genes.
Figure 2—figure supplement 3
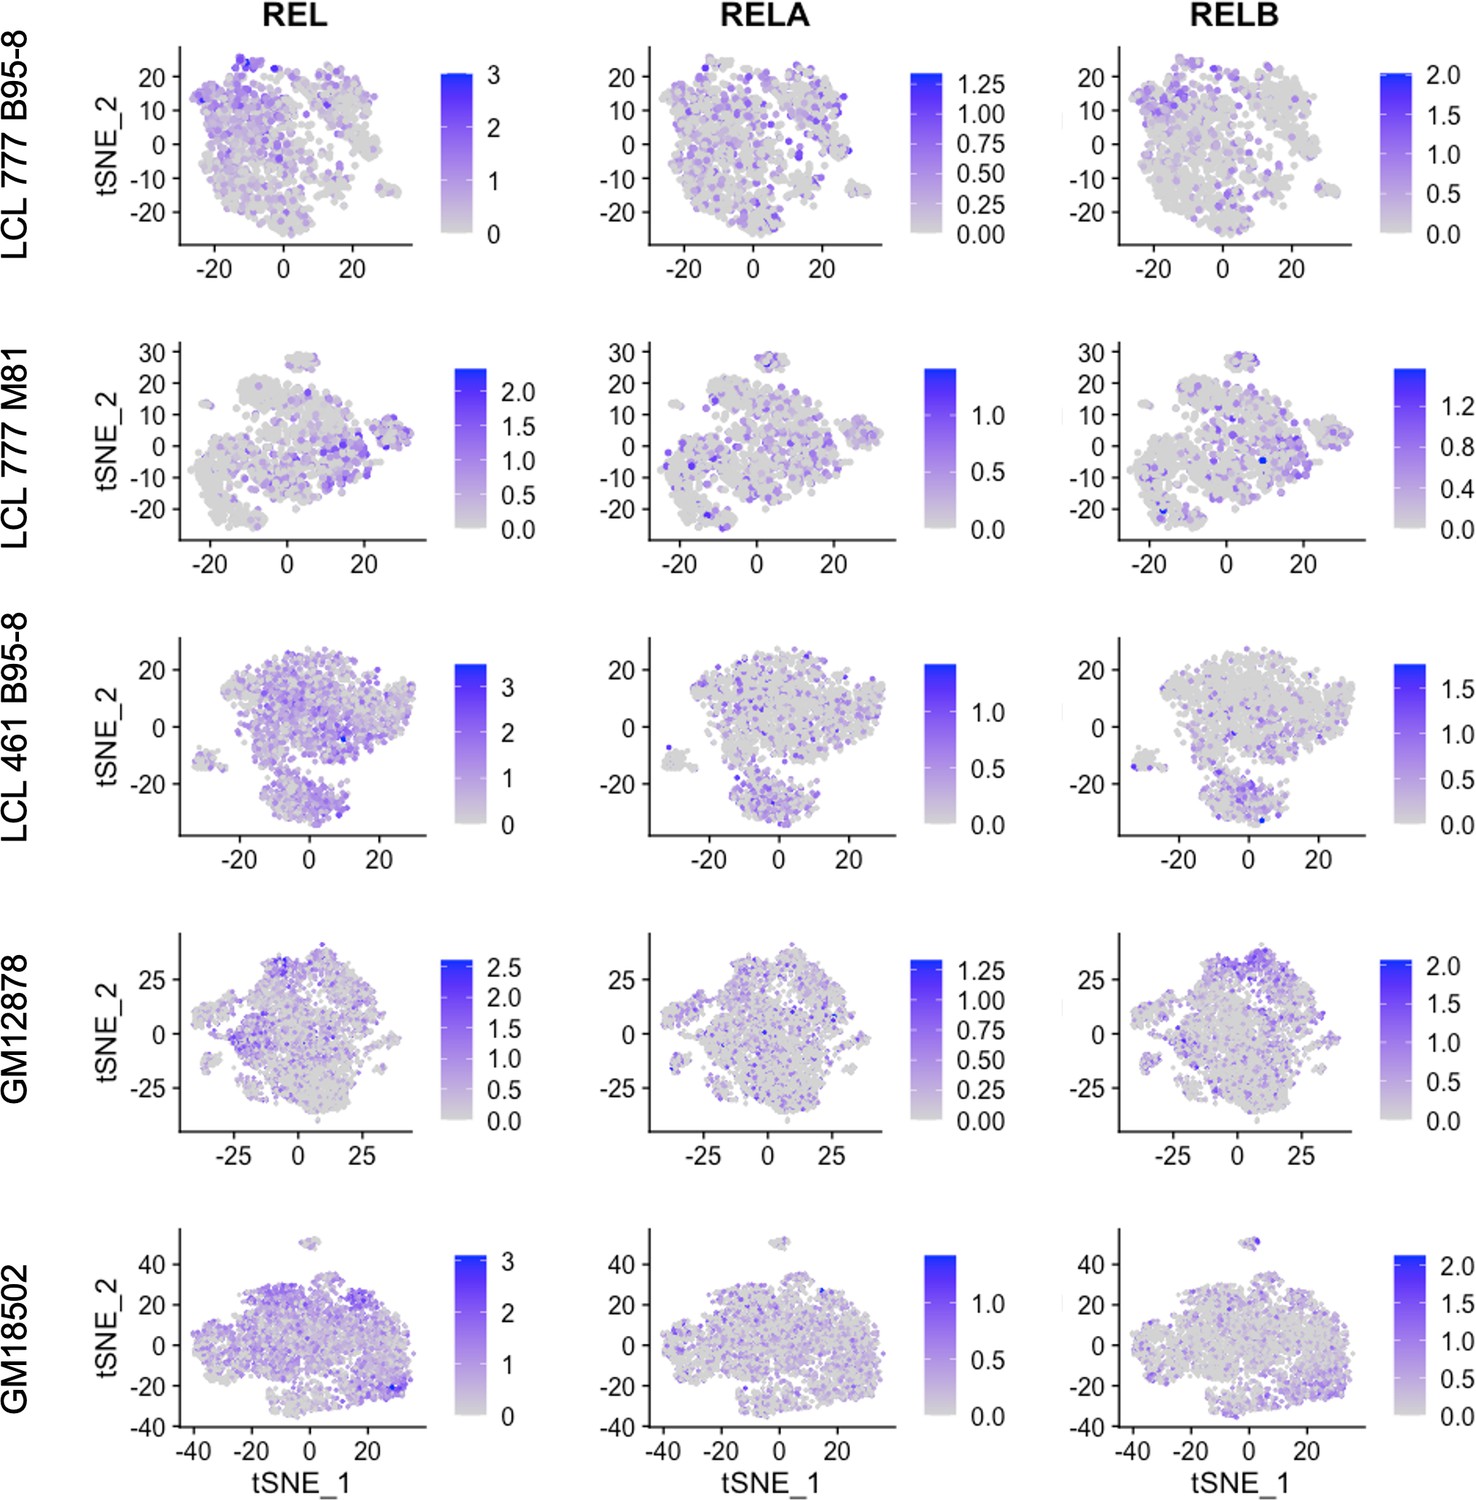
Expression of NF-κB subunits c-REL, RELA, and RELB.
Figure 2—figure supplement 4
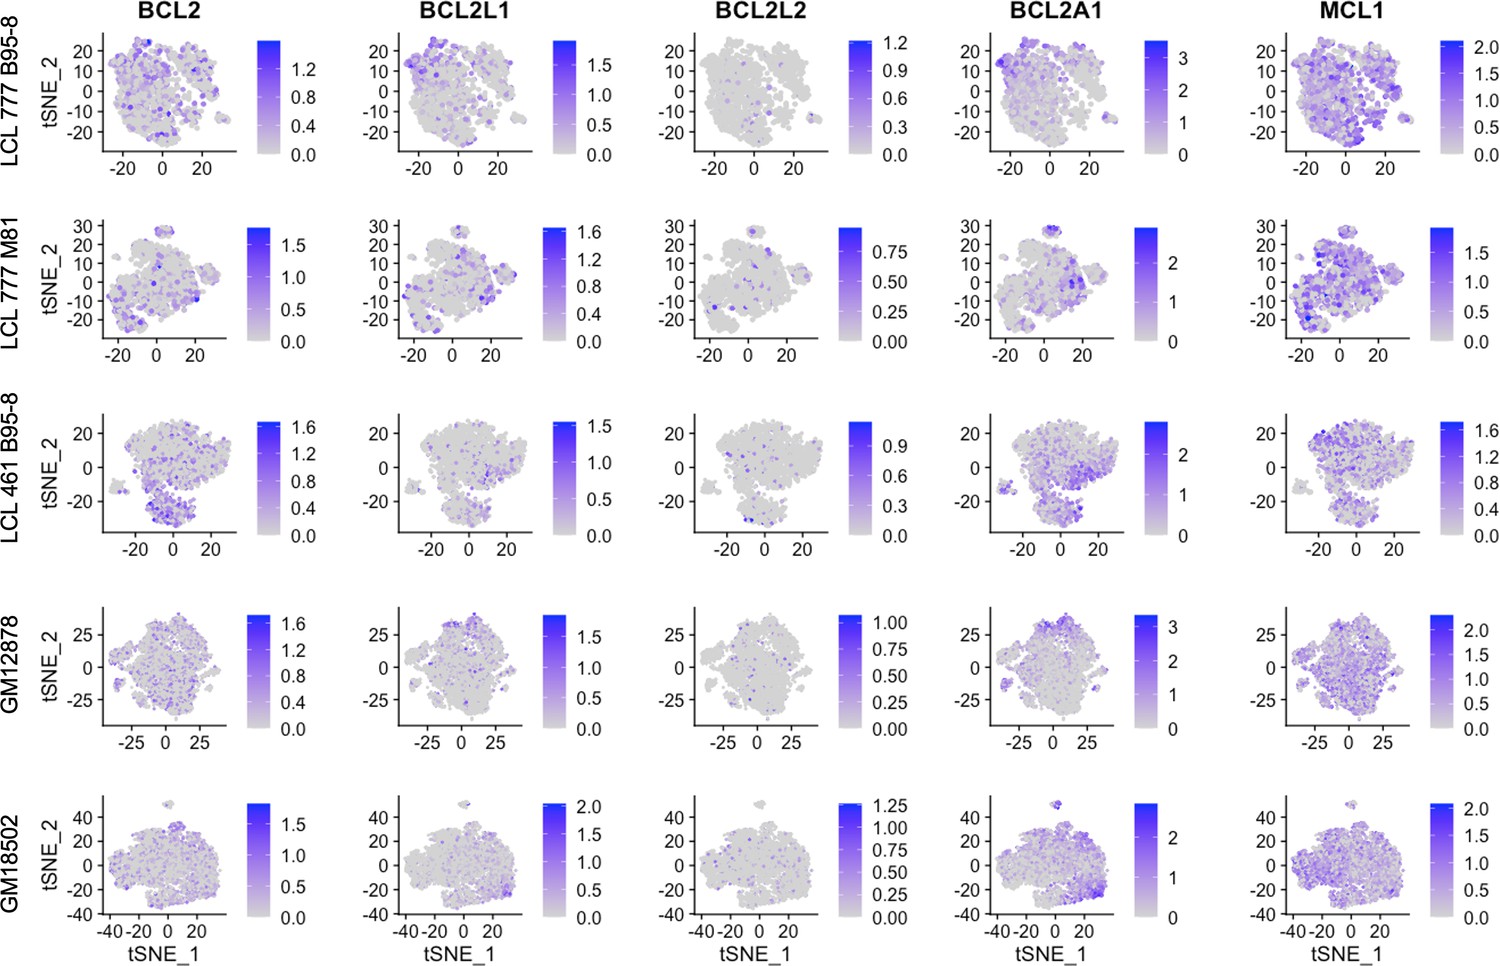
Expression of BCL2 family genes across lymphoblastoid cell line (LCL) samples.
Figure 2—figure supplement 5
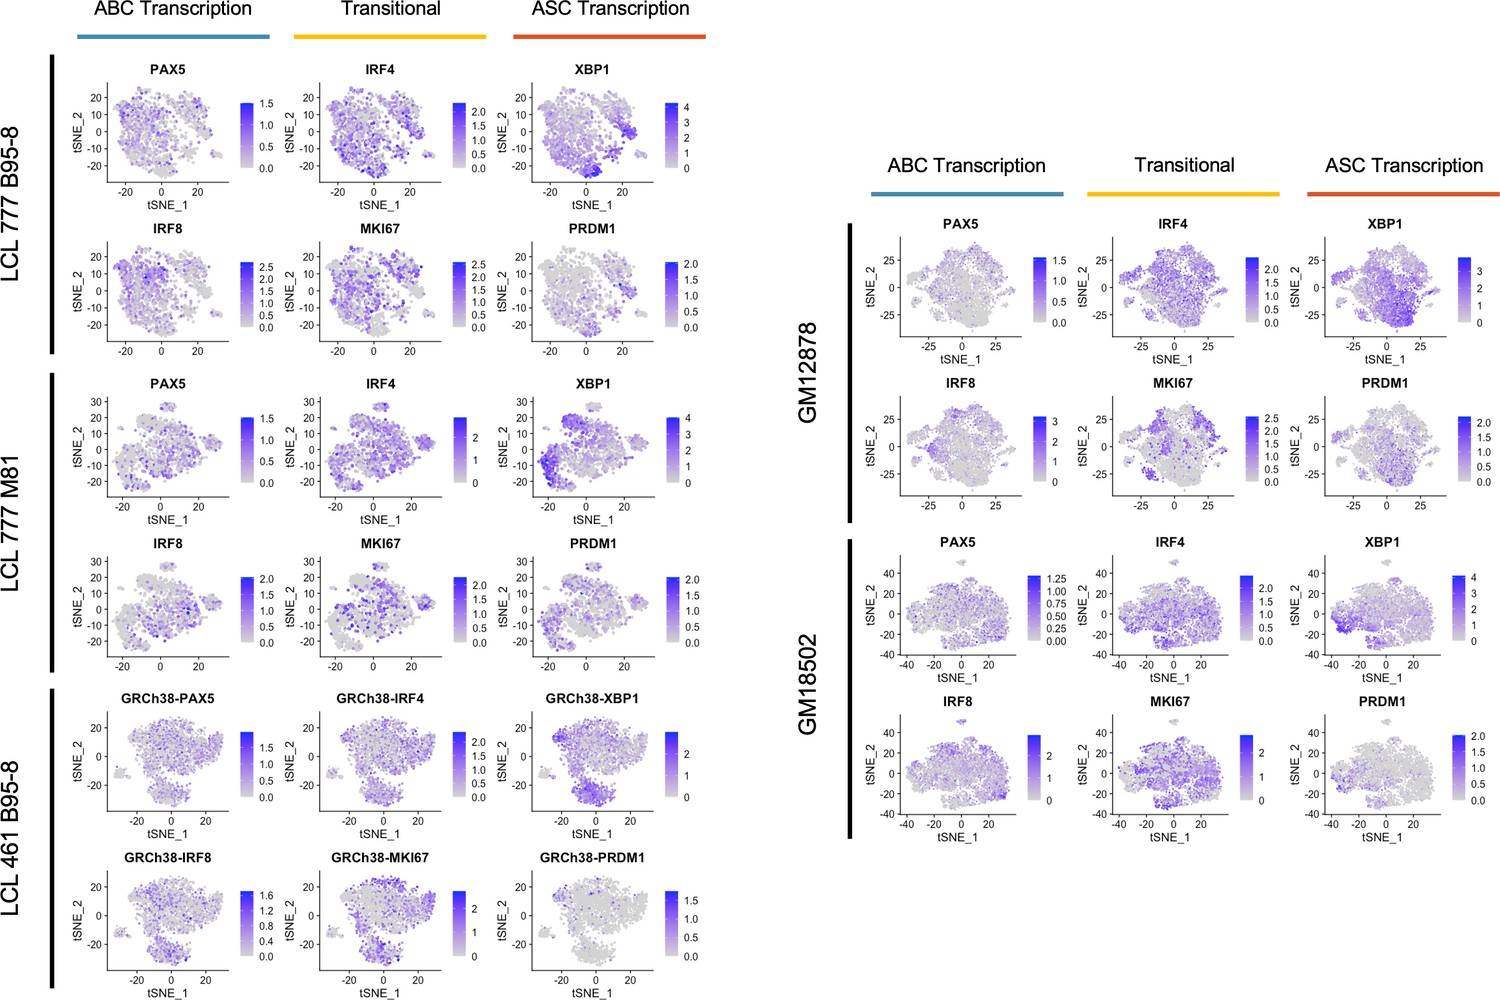
Expression trends in key transcriptional regulators controlling activated B cell (ABC) and antibody-secreting cell (ASC) phenotypes.
Figure 2—figure supplement 6
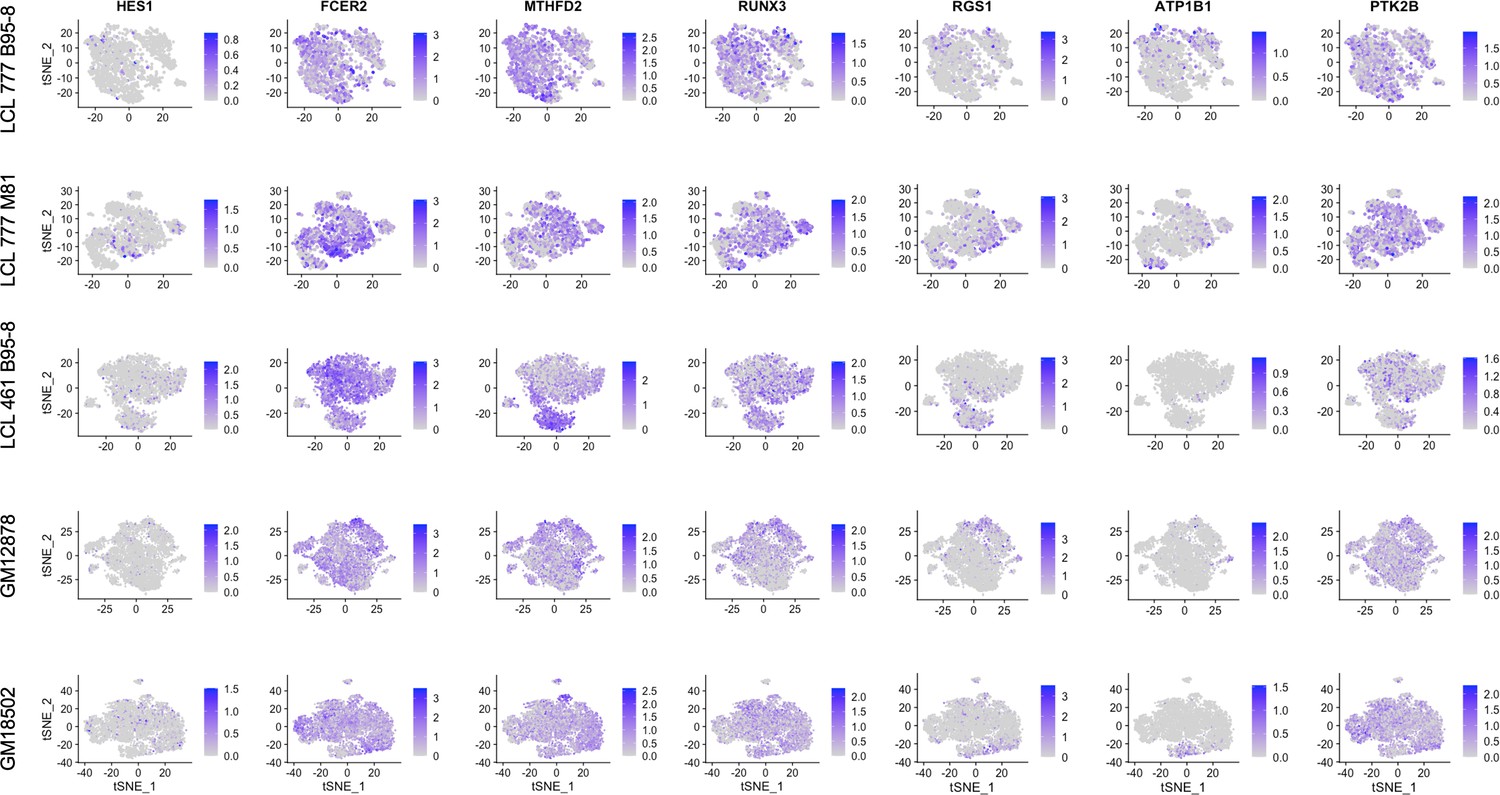
Expression of host targets upregulated by EBNA2.
Figure 2—figure supplement 7
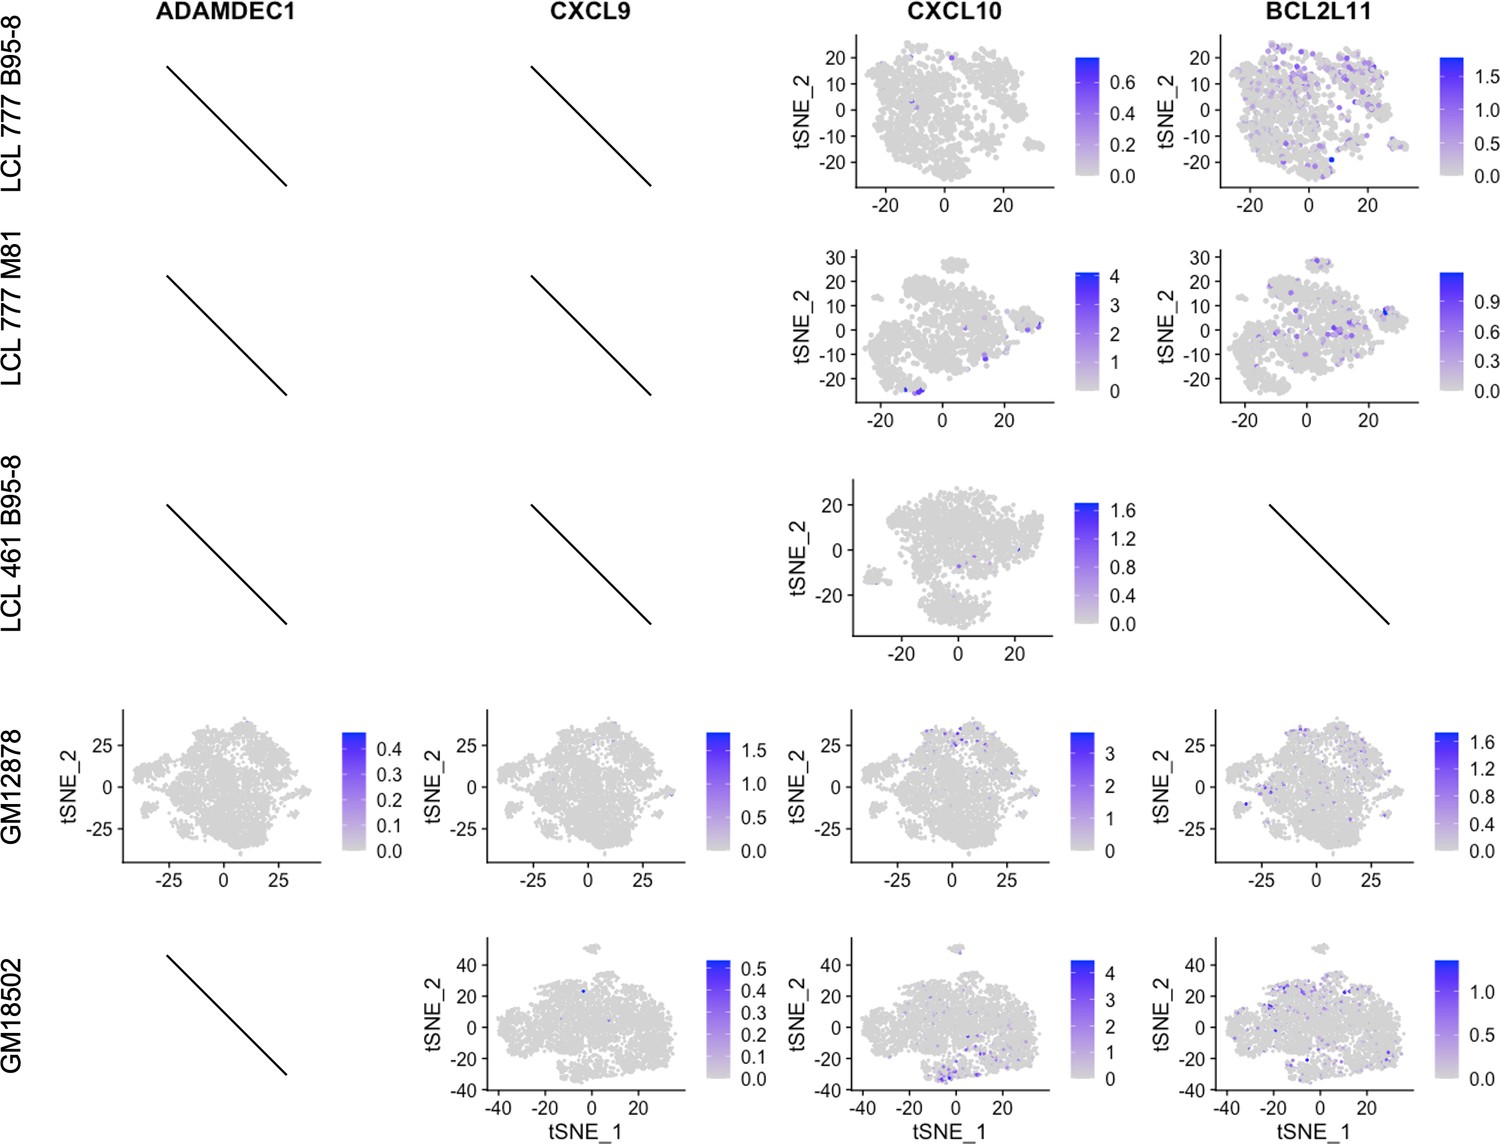
Expression of host targets repressed by EBNA3.
Figure 2—figure supplement 8
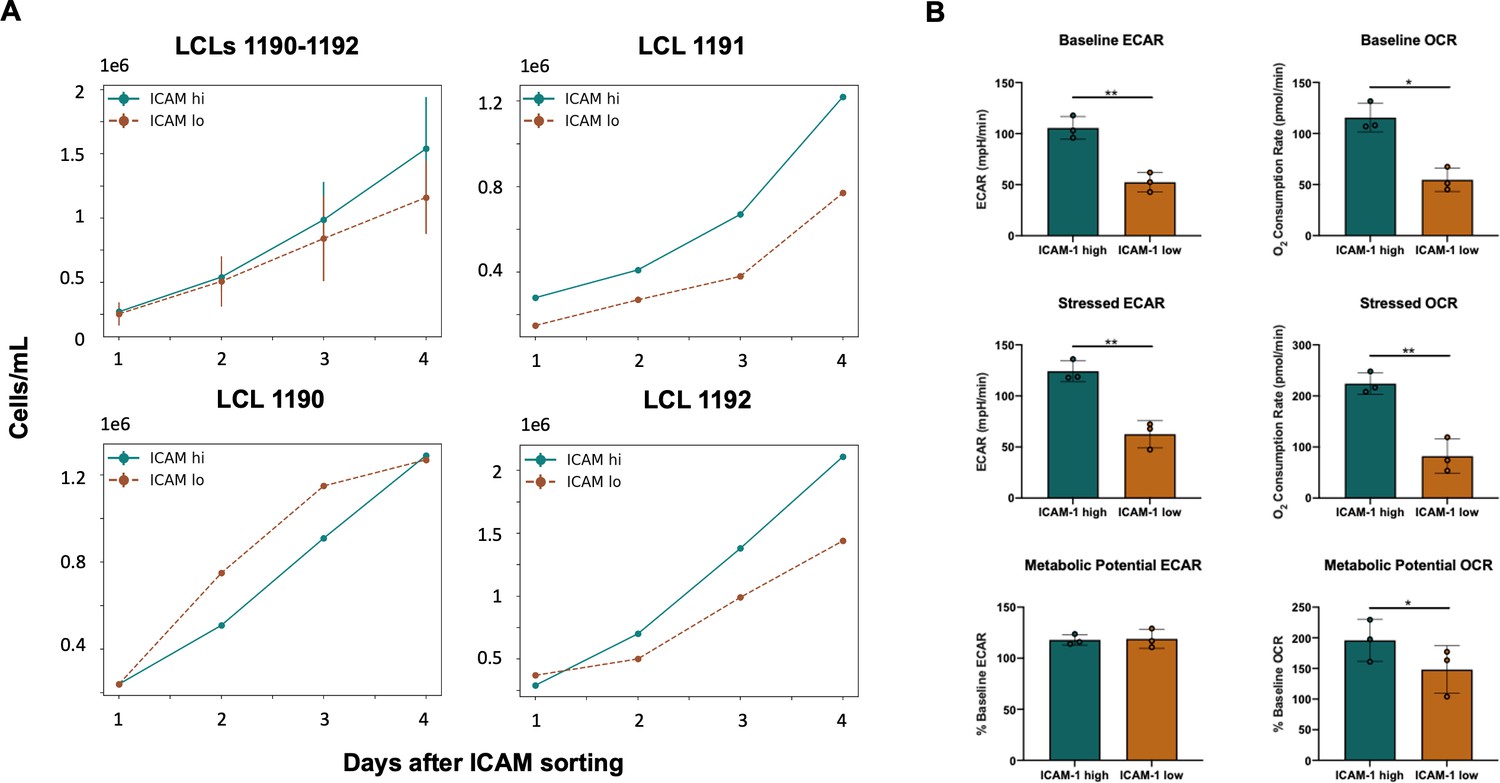
Cell proliferation and metabolic profiling by ICAM expression.
(A) Averaged (top-left panel) and individual lymphoblastoid cell line (LCL) growth rates in sorted ICAM-hi (teal) and ICAM-lo (sienna) fractions. (B) Metabolic profiling of ICAM-hi and ICAM-lo fractions of LCLs.
Figure 3 with 1 supplement
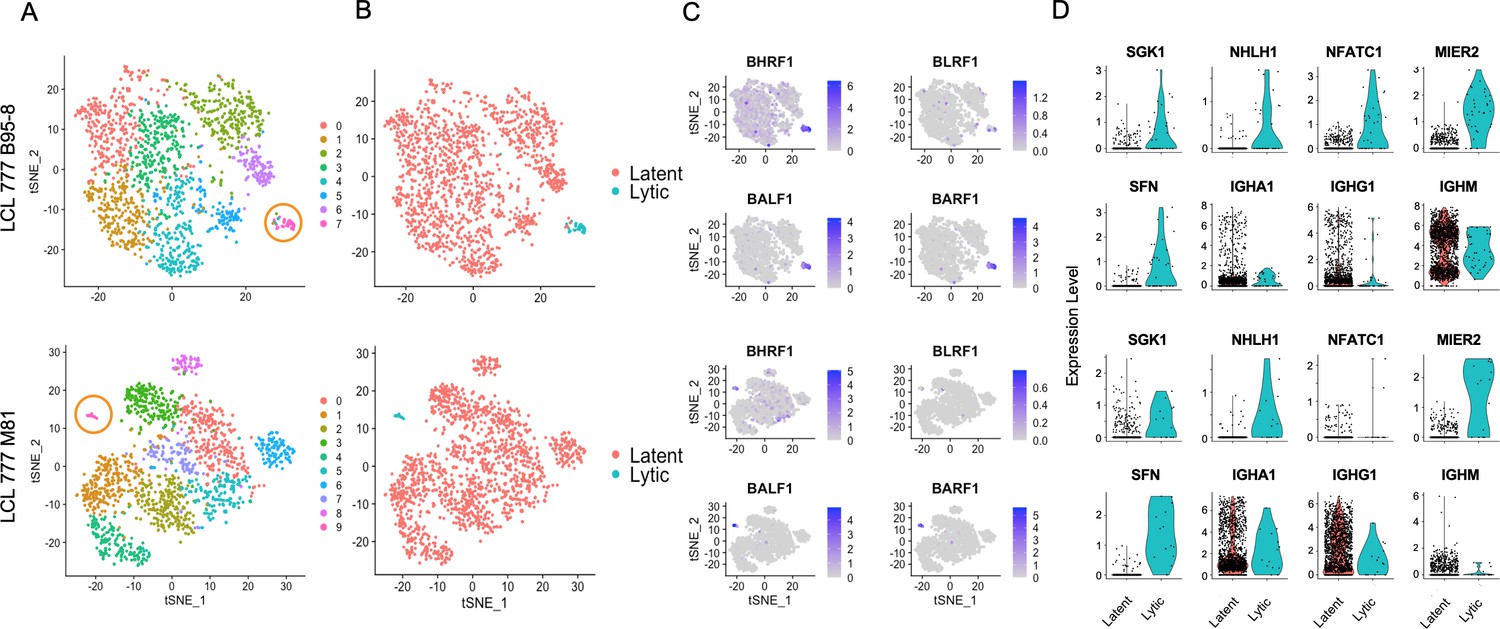
Viral and host gene expression in lytic cell subpopulations.
(A) Clustering of dimensionally reduced data sets for LCL 777 B95-8 and LCL 777 M81. (B) Grouping of cell clusters into latent (red) and lytic (cyan) cells based on viral and host gene expression signatures of principal components. (C) Relative expression of four representative Epstein–Barr virus (EBV) lytic genes (BHRF1, BLRF1, BALF1, and BARF1) is elevated in lytic cell subpopulations. (D) Lytic cell clusters exhibit elevated expression of several host cell genes (SGK1, NHLH1, NFATC1, MIER2, and SFN) relative to latently infected cells. While under-sampled due to subpopulation size, immunoglobulin class frequencies in lytic cells roughly reflect the population-wide frequencies.
Figure 3—figure supplement 1
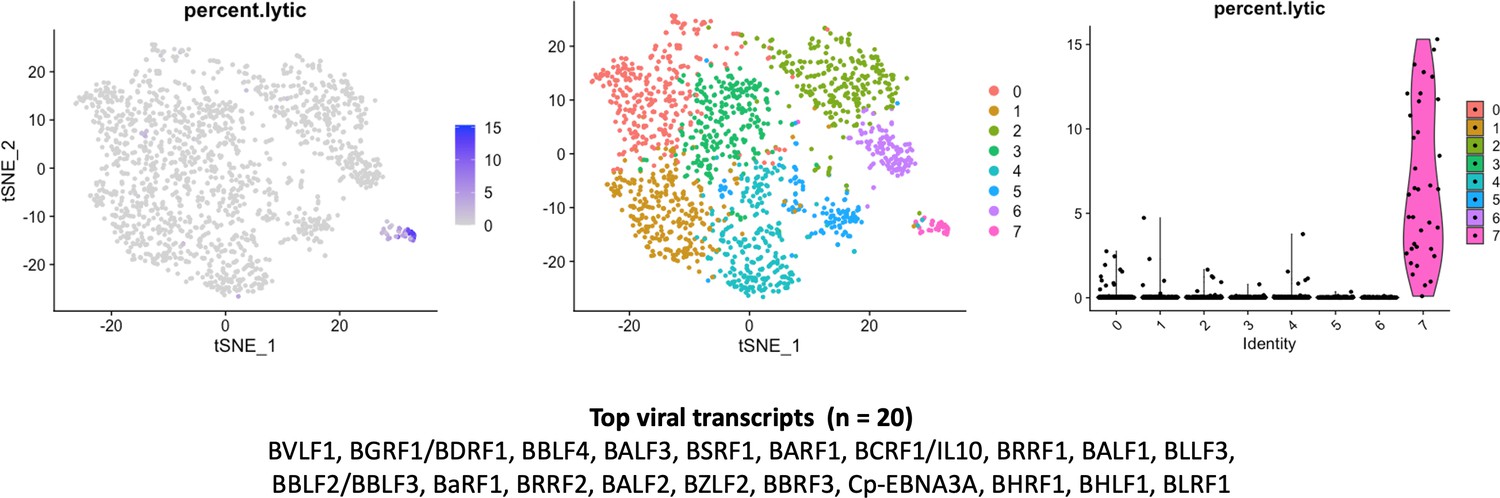
Percentage of viral lytic transcripts relative to total transcripts in LCL_777_B95-8 lytic cell cluster.
Figure 4 with 7 supplements
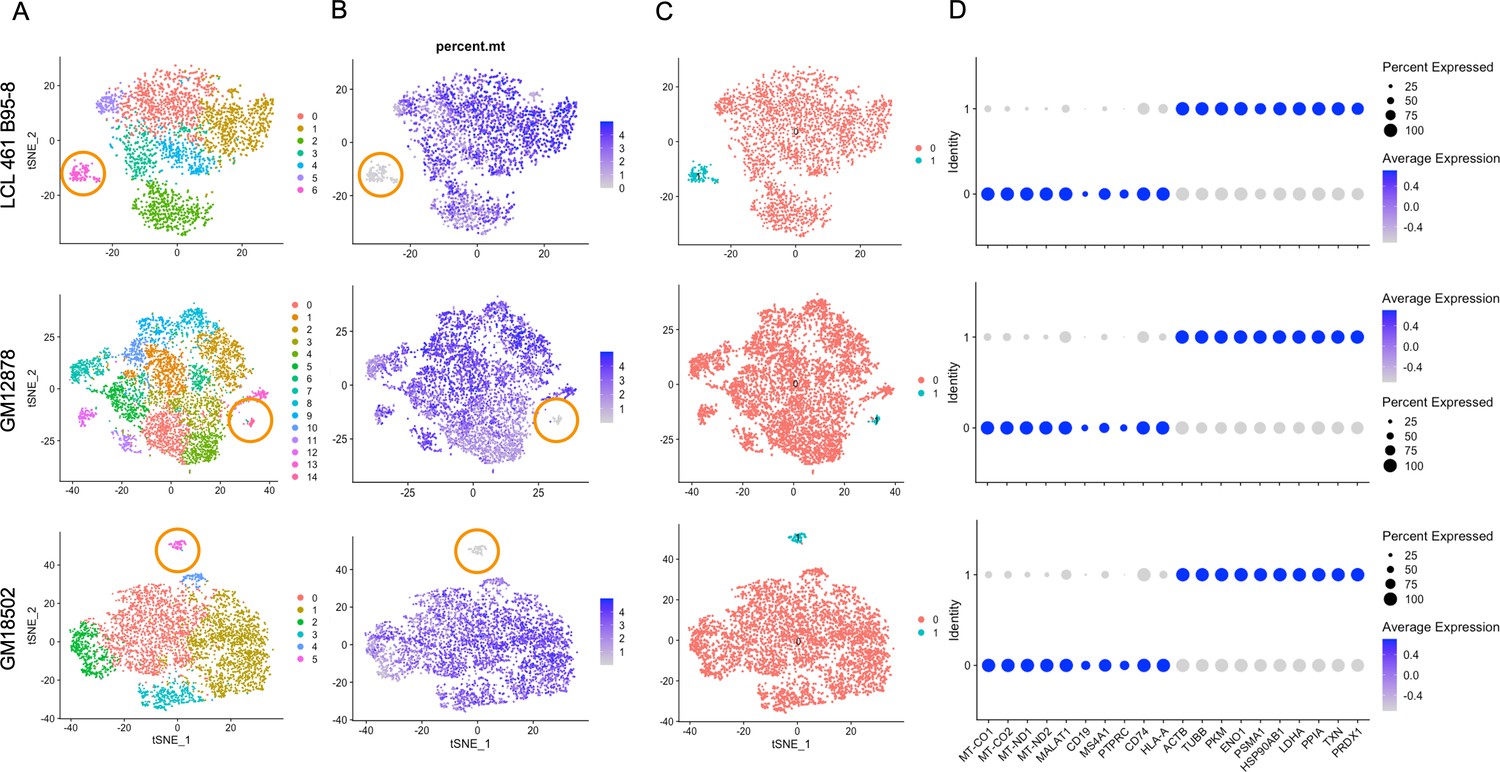
Lymphoblastoid cell line (LCL) subpopulations exhibiting reduced mitochondrial gene expression and elevated metabolic and oxidative stress genes.
(A) Clustering of dimensionally reduced data sets for LCL 461 B95-8, GM12878, and GM18502. (B) Distinct clusters within each of these samples are defined by uncharacteristically low mitochondrial gene expression. (C) Grouping of cell clusters to partition ‘mito-low’ cells (cyan) for differential expression comparison. (D) Mito-low cells exhibit reduced expression of cytochrome oxidase (MT-CO1 and MT-CO2), NADH-ubiquinone oxidoreductase (MT-ND1 and MT-ND2), MALAT1, and numerous lymphoid and B-cell lineage markers (CD19, MS4A1/CD20, PTPRC/CD45, CD74, and HLA-A). Mito-low cells exhibit increased expression of genes associated with cytoskeletal rearrangements (ACTB and TUBB), metabolic stress (PKM, ENO1, and LDHA), protein folding/degradation (HSP90AB1, PSMA1, and PPIA), and oxidative stress (TXN and PRDX1).
Figure 4—figure supplement 1
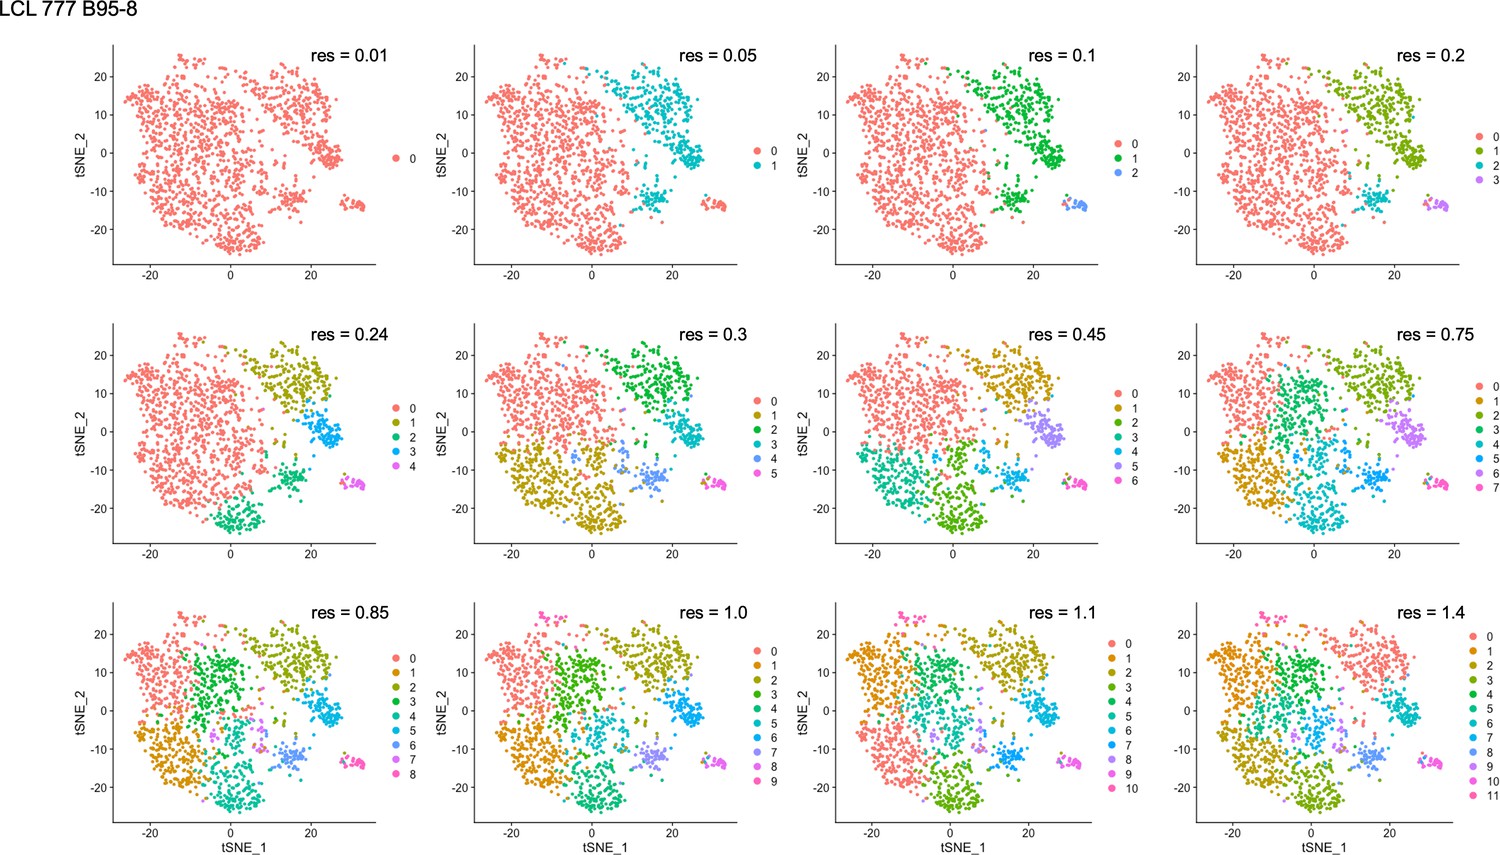
Clustering resolution screens for LCL 777 B95-8.
Figure 4—figure supplement 2
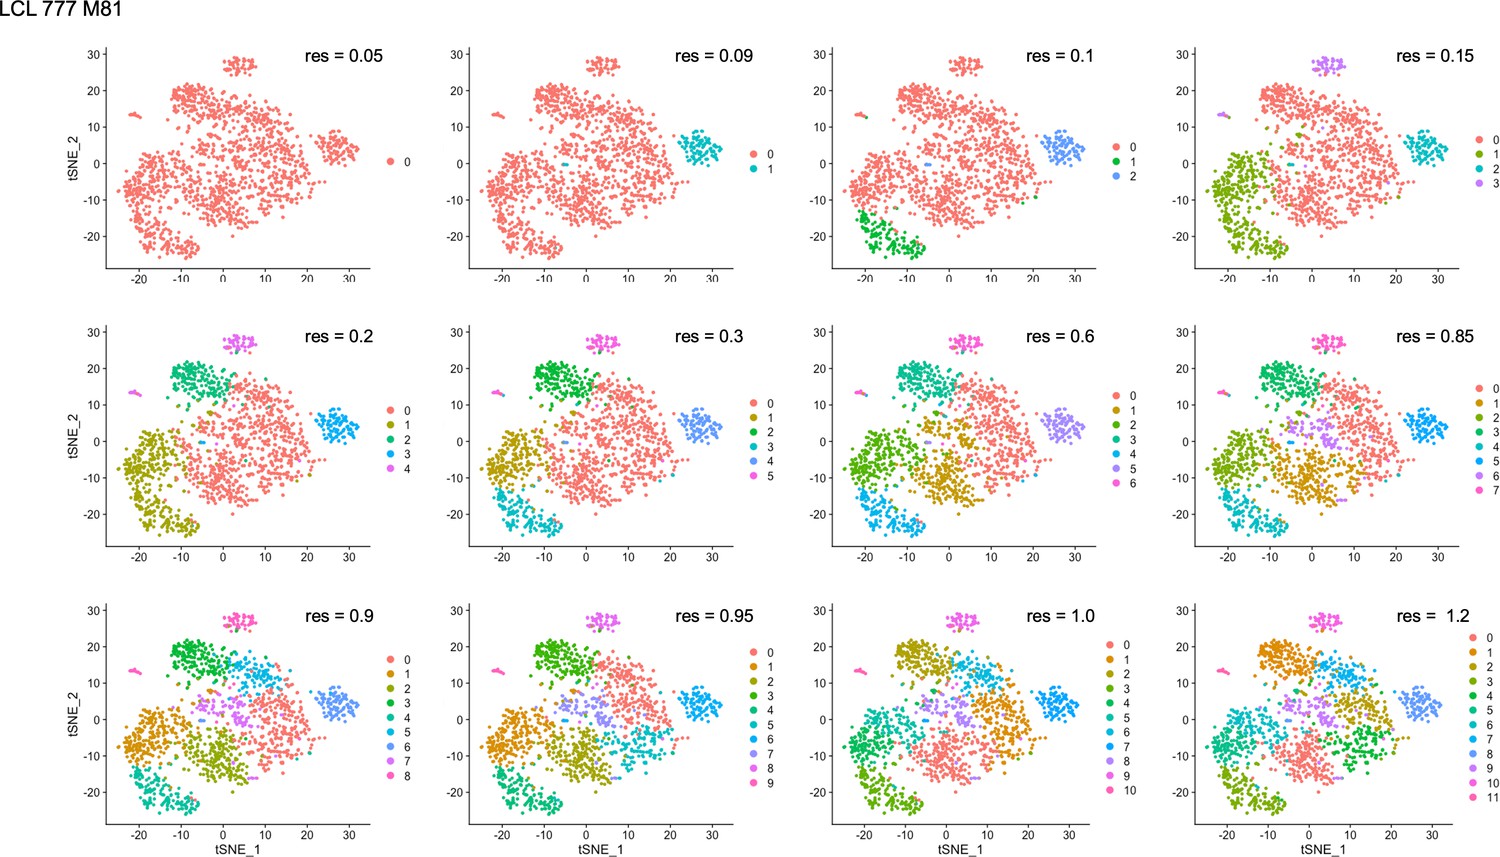
Clustering resolution screens for LCL 777 M81.
Figure 4—figure supplement 3
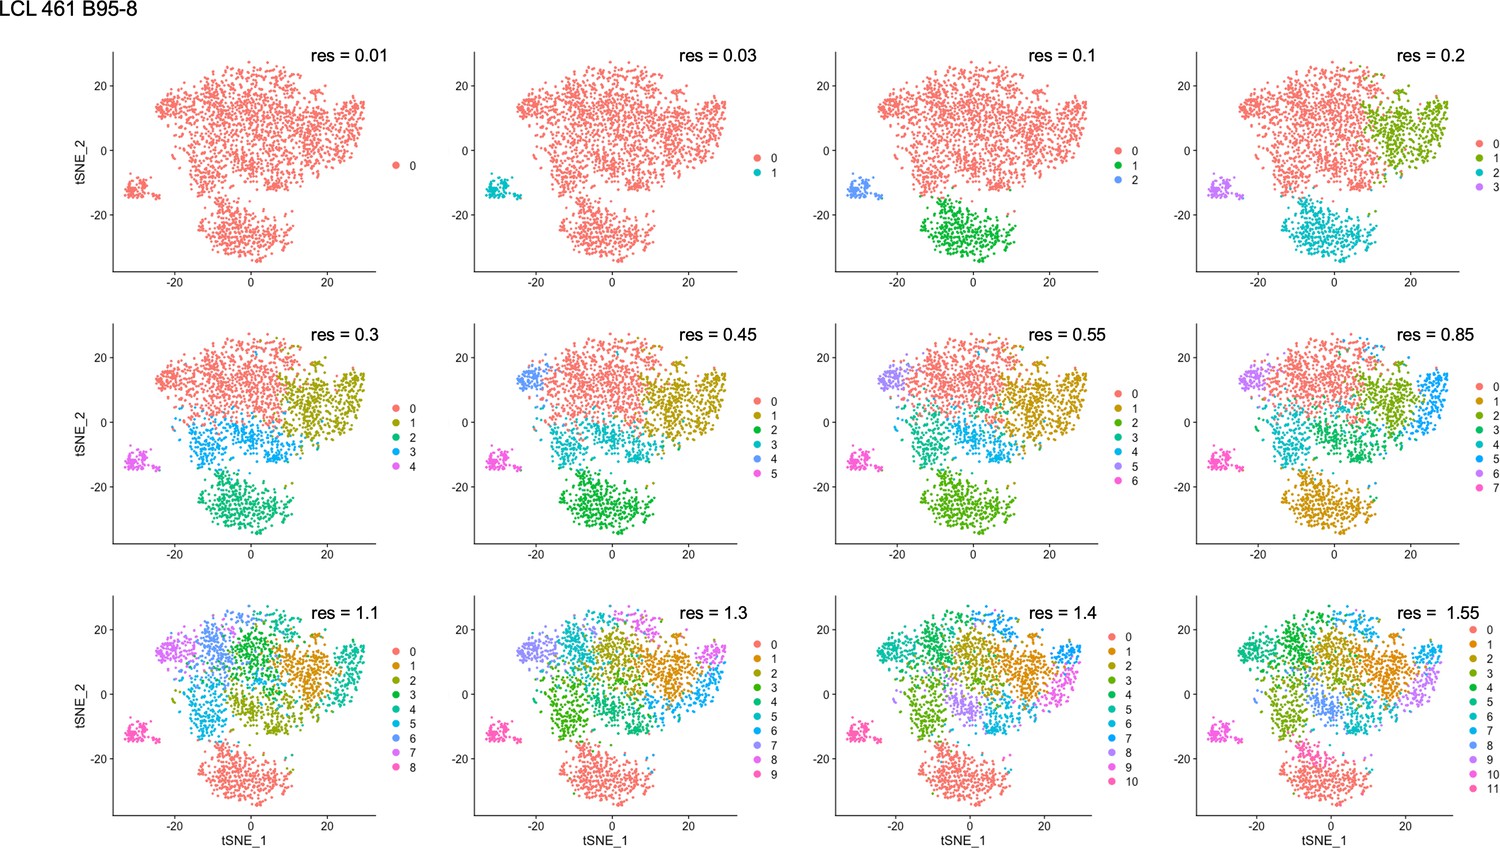
Clustering resolution screens for LCL 461 B95-8.
Figure 4—figure supplement 4
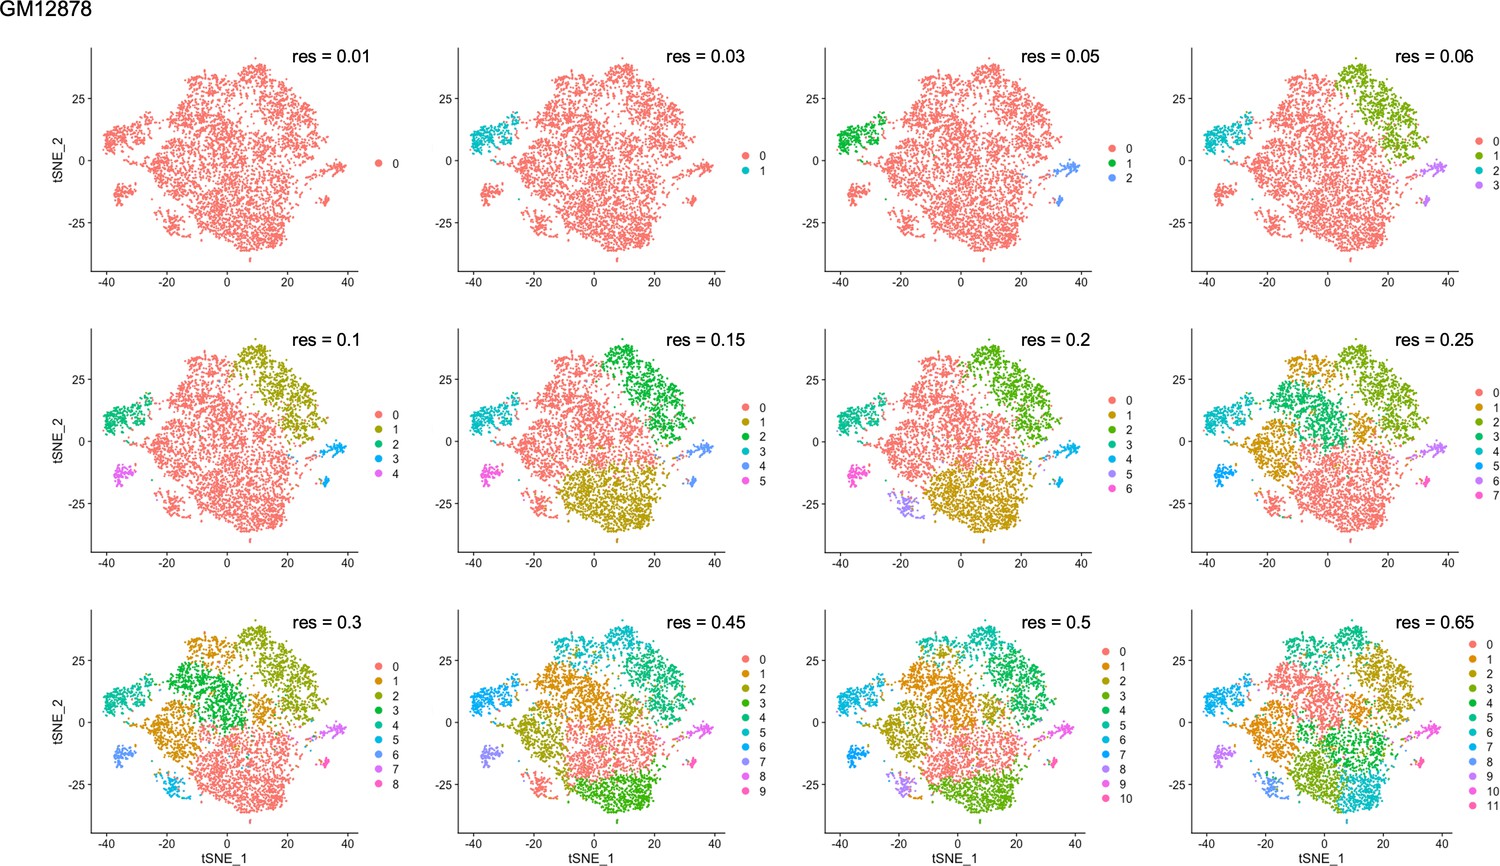
Clustering resolution screens for GM12878.
Figure 4—figure supplement 5
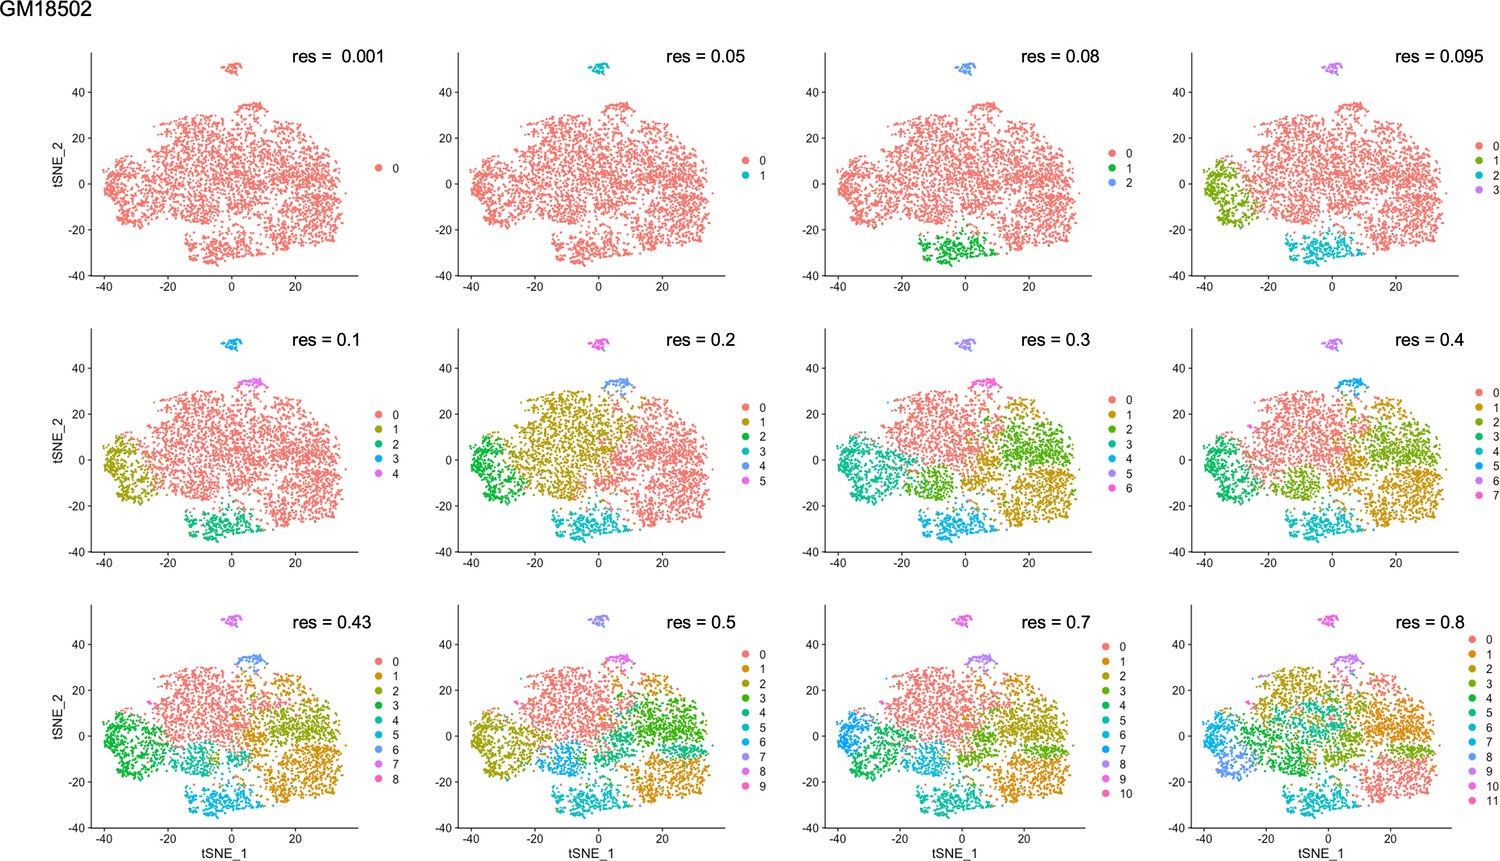
Clustering resolution screens for GM18502.
Figure 4—figure supplement 6
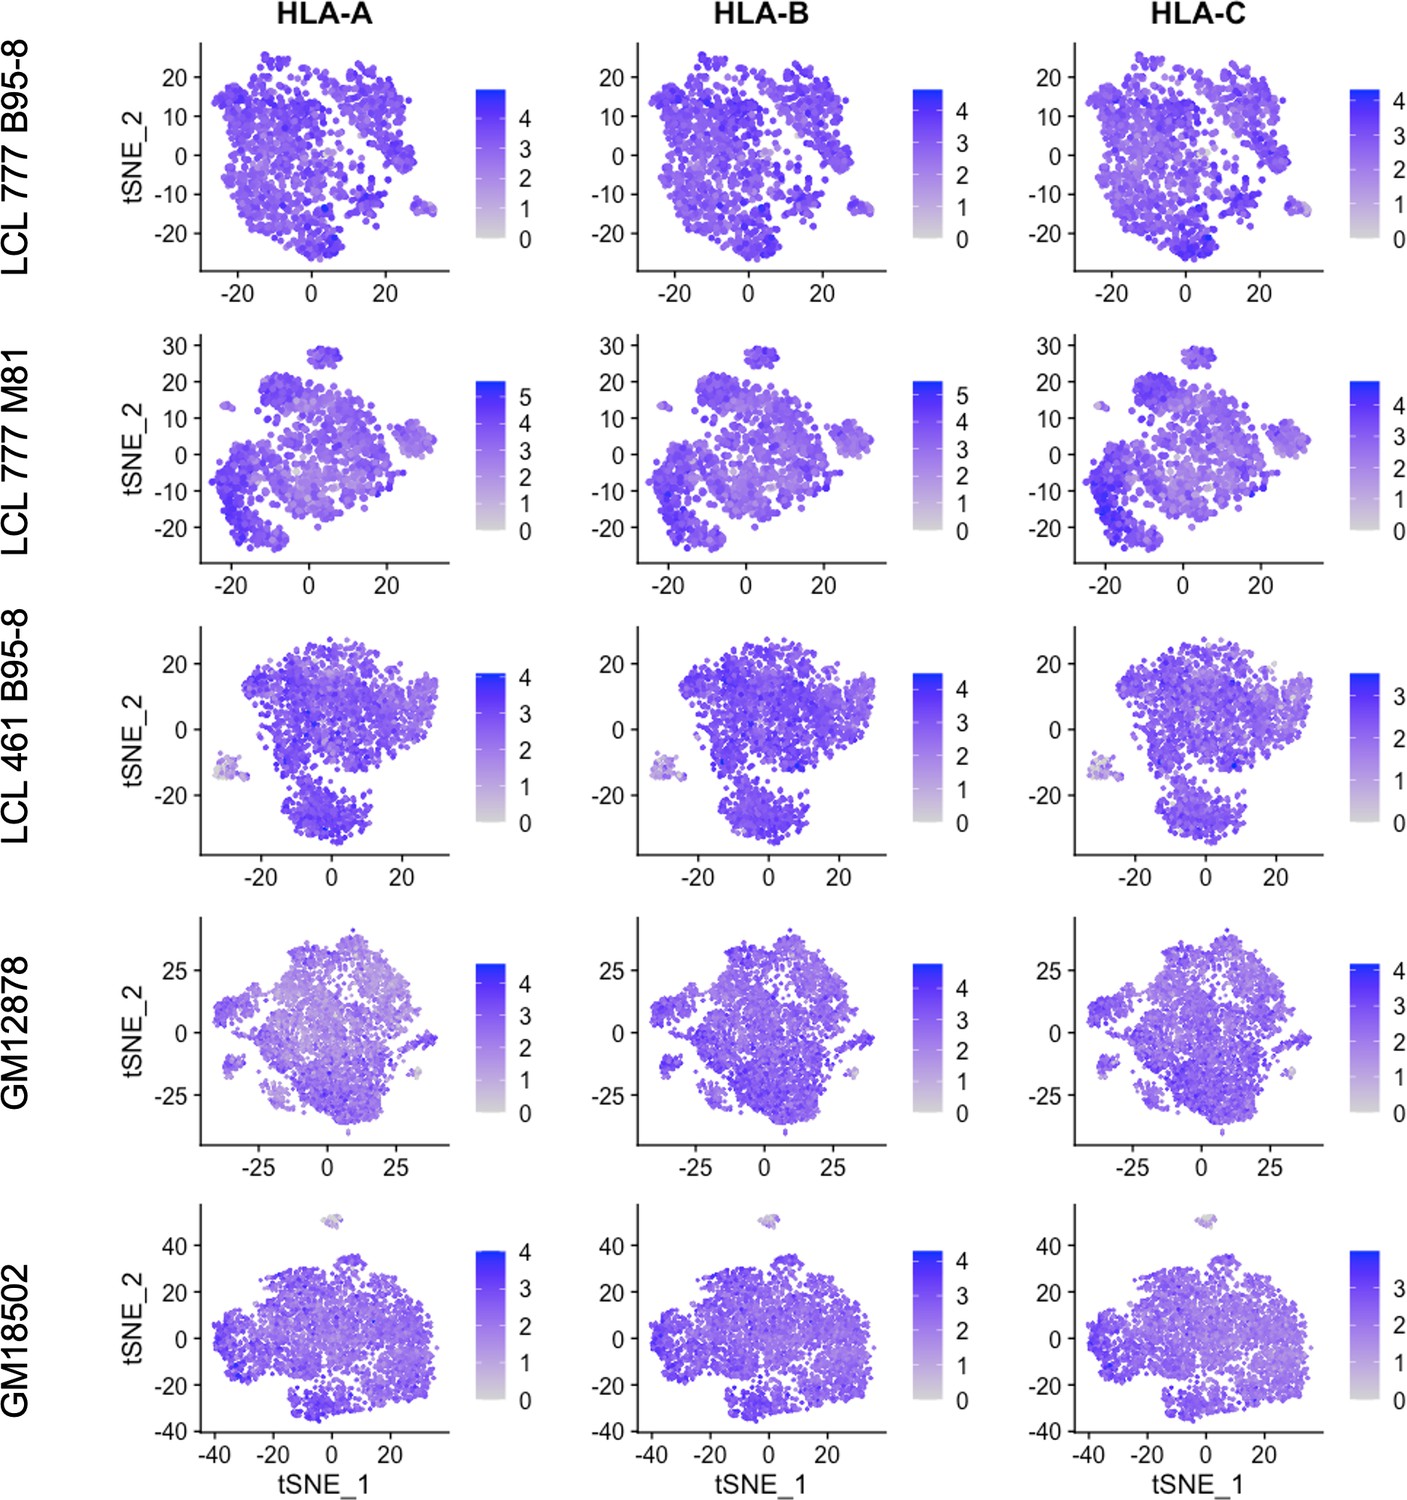
Expression of MHC class I genes HLA-A, HLA-B, and HLA-C.
Figure 4—figure supplement 7
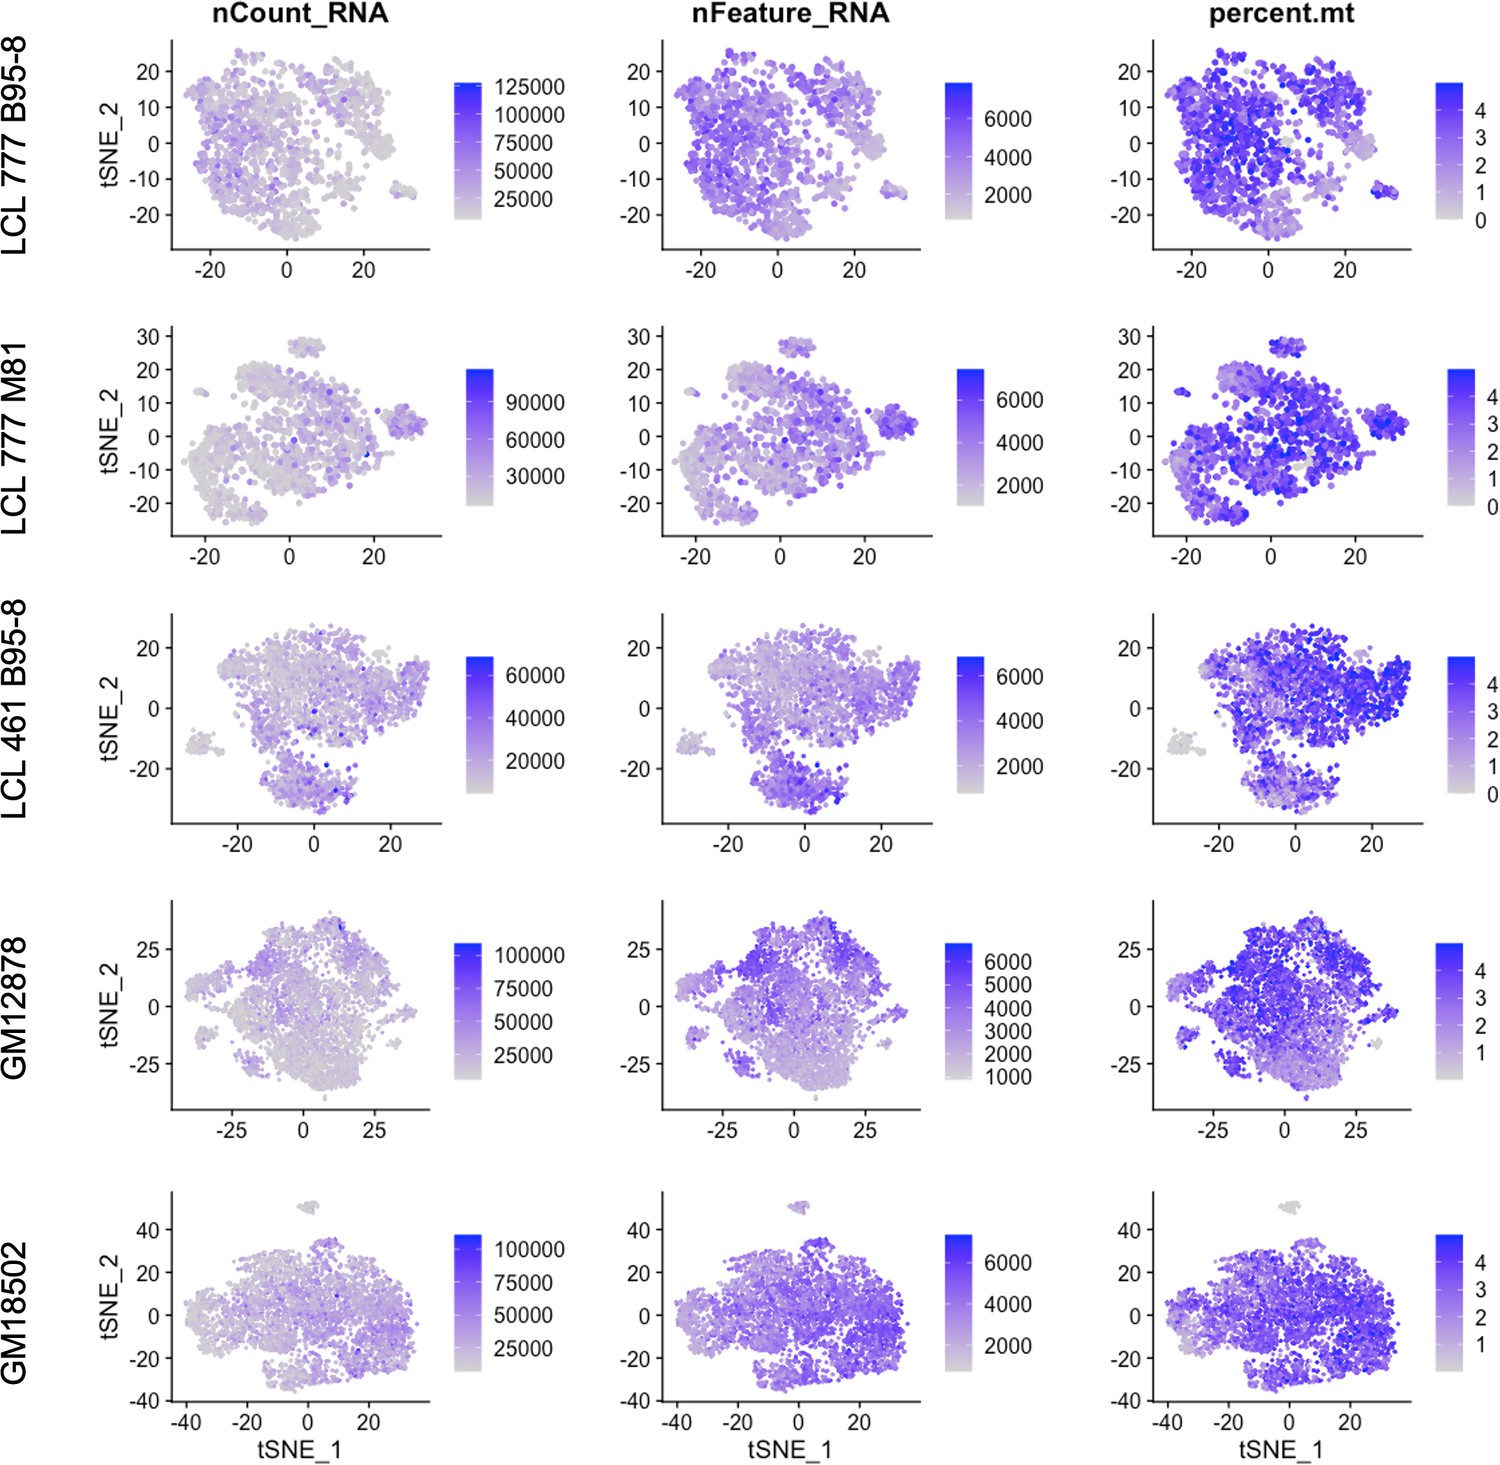
Total RNA counts, unique feature, and mitochondrial percentage distributions across lymphoblastoid cell line (LCL) samples.
Figure 5
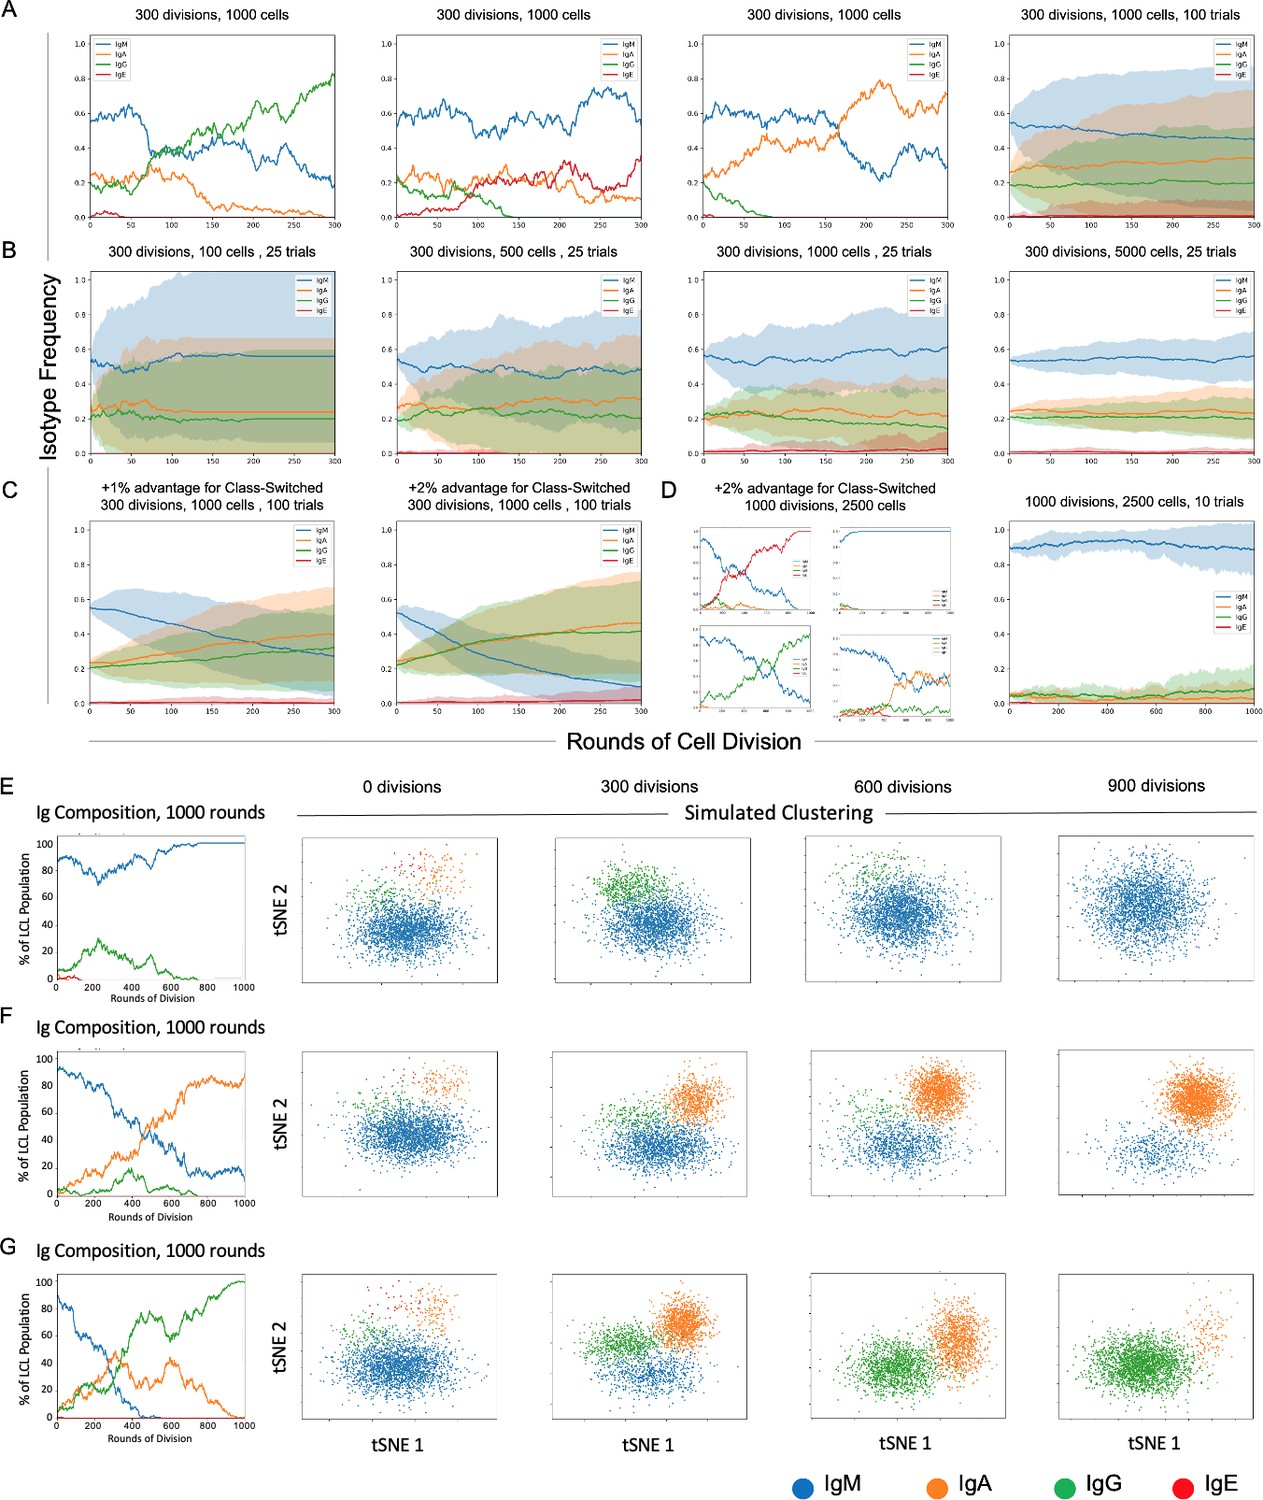
Stochastic simulation of heterogeneous lymphoblastoid cell line (LCL) evolution.
(A) Stochastic immunoglobulin isotype frequency evolution. Three random single-trial simulations initiated from the same starting class frequencies are presented, assuming equal likelihood of proliferation across isotype classes (n = 1000 cells). The last panel shows mean and standard deviation for outcomes from 100 trials simulated from the same parameters. (B) Simulation of a founder effect. Population under-sampling (modeled by comparing results from 25 trials using n = 100, 500, 1000, and 5000 cells, left-to-right panels) increases outcome variance and accelerates convergence to a single isotype. (C) Effect of phenotype-specific fitness advantages. Simulation results are presented for scenarios in which class-switched isotypes (IgA, IgG, and IgE) have a 1% (left panel) or 2% (right panel) fitness advantage over IgM cells. (D) Four random single-trial simulations over long periods of time (1000 division rounds) with a 1% fitness advantage for class-switched cells (left panels) compared to 10 trials over the same period with equal fitness across classes. (E) Single-trial isotype frequency evolution and corresponding simulated clustering (see Materials and methods) in the case of equal proliferation probability. Starting frequencies of IgM, IgA, IgG, and IgE cells are 89%, 5%, 5%, and 1%, respectively. (F) As in E, with a 1% fitness advantage for class-switched cells. (G) As in E, with a 2% advantage for class-switched cells.
Tables
Key resources table
| Reagent type (species) or resource | Designation | Source or reference | Identifiers | Additional information |
|---|---|---|---|---|
| Biological sample (Homo sapiens) | Whole blood | Gulf Coast Regional Blood Center | Multiple donors; sources of PBMCs for LCL_461 and LCL_777 preparation | |
| Cell line (Homo sapiens) | B95-8 Z-HT | This paper; Price et al., 2017 | Stimulated to obtain B95-8 strain (Type 1 EBV) viral supernatants | |
| Cell line (Homo sapiens) | M81 | This paper; Tsai et al., 2013 | Stimulated to obtain M81 strain (Type 2 EBV) viral supernatants | |
| Cell line (Homo sapiens) | LCL_461 | This paper; Price et al., 2017 | Prepared from donor PBMCs | |
| Cell line (Homo sapiens) | LCL_777 | This paper | Prepared from donor PBMCs | |
| Cell line (Homo sapiens) | GM12878 | Coriell Institute | RRID:CVCL_7526 | White female donor |
| Cell line (Homo sapiens) | GM18502 | Coriell Institute | RRID:CVCL_P459 | Yoruba female donor |
| Antibody | Anti-human CD54 (ICAM-1), PE-conjugated (mouse monoclonal) | Biolegend | Cat #353106 | Clone #HA58 |
| Sequence-based reagent | 5’ L-VH 1 | This paper; Tiller et al., 2008 | PCR primers | ACAGGTGCCCACTCCCAGGTGCAG |
| Sequence-based reagent | 5’ L-VH 3 | This paper; Tiller et al., 2008 | PCR primers | AAGGTGTCCAGTGTGATGTGCAG |
| Sequence-based reagent | 5’ L-VH 4/6 | This paper; Tiller et al., 2008 | PCR primers | CCCAGATGGGTCCTGTCCCAGGTGCAG |
| Sequence-based reagent | 5’ L-VH 5 | This paper; Tiller et al., 2008 | PCR primers | CAAGGAGTCTGTTCCGAGGTGCAG |
| Sequence-based reagent | 5’ L-Vκ 1/2 | This paper; Tiller et al., 2008 | PCR primers | ATGAGGATCCCTGCTCAGCTGCTGG |
| Sequence-based reagent | 5’ L-Vκ 3 | This paper; Tiller et al., 2008 | PCR primers | CTCTTCCTCCTGCTACTCTGGCTCCCAG |
| Sequence-based reagent | 5’ L-Vκ 4 | This paper; Tiller et al., 2008 | PCR primers | ATTTCTCTGTTGCTCTGGATCTCTG |
| Sequence-based reagent | 5’ L-Vλ 1 | This paper; Tiller et al., 2008 | PCR primers | GGTCCTGGGCCCAGTCTGTGCTG |
| Sequence-based reagent | 5’ L-Vλ 2 | This paper; Tiller et al., 2008 | PCR primers | GGTCCTGGGCCCAGTCTGCCCTG |
| Sequence-based reagent | 5’ L-Vλ 3 | This paper; Tiller et al., 2008 | PCR primers | GCTCTGTGACCTCCTATGAGCTG |
| Sequence-based reagent | 5’ L-Vλ 4/5 | This paper; Tiller et al., 2008 | PCR primers | GGTCTCTCTCACAGCTTGTGCTG |
| Sequence-based reagent | 5’ L-Vλ 6 | This paper; Tiller et al., 2008 | PCR primers | GTTCTTGGGCCAATTTTATGCTG |
| Sequence-based reagent | 5’ L-Vλ 7 | This paper; Tiller et al., 2008 | PCR primers | GGTCCAATTCTCAGGCTGTGGTG |
| Sequence-based reagent | 5’ L-Vλ 8 | This paper; Tiller et al., 2008 | PCR primers | GAGTGGATTCTCAGACTGTGGTG |
| Sequence-based reagent | 3′ Cγ CH1 (IgG) | This paper; Tiller et al., 2008 | PCR primers | GGAAGGTGTGCACGCCGCTGGTC |
| Sequence-based reagent | 3′ Cμ CH1 (IgM) | This paper; Tiller et al., 2008 | PCR primers | GGGAATTCTCACAGGAGACGA |
| Sequence-based reagent | 3′Cα CH1 (IgA) | This paper; Tiller et al., 2008 | PCR primers | TGGGAAGTTTCTGGCGGTCACG |
| Sequence-based reagent | 3′ Cκ 543 (Kappa Light Chain) | This paper; Tiller et al., 2008 | PCR primers | GTTTCTCGTAGTCTGCTTTGCTCA |
| Sequence-based reagent | 3′ Cλ (Lambda Light Chain) | This paper; Tiller et al., 2008 | PCR primers | CACCAGTGTGGCCTTGTTGGCTTG |
| Commercial assay or kit | SV96 Total RNA Isolation Kit | Promega | Cat #Z3500 | |
| Commercial assay or kit | High-Capacity cDNA Reverse Transcription Kit | Thermo | Cat #4368814 | |
| Commercial assay or kit | Single Cell 3’ Reagent Kit Protocol, v2 chemistry | 10× Genomics | Cat #CG00052 | |
| Commercial assay or kit | iMag Negative Isolation Kit | BD Biosciences | Cat #558007 | CD19+ B cell isolation from PBMCs |
| Software, algorithm | CellRanger | 10× Genomics | v.2.0.0 | |
| Software, algorithm | Seurat (R package) | Satija et al., 2015; Stuart et al., 2019 | v.3.1.5 |
Additional files
-
Source code 1
R code used for UMI count matrix processing, analysis, and figure generation.
- https://cdn.elifesciences.org/articles/62586/elife-62586-code1-v2.zip
-
Source code 2
Python code used for clonal evolution simulations (also available on github at https://github.com/esorelle/ig-evo-sim).
- https://cdn.elifesciences.org/articles/62586/elife-62586-code2-v2.py.zip
-
Transparent reporting form
- https://cdn.elifesciences.org/articles/62586/elife-62586-transrepform-v2.pdf
Download links
A two-part list of links to download the article, or parts of the article, in various formats.
Downloads (link to download the article as PDF)
Open citations (links to open the citations from this article in various online reference manager services)
Cite this article (links to download the citations from this article in formats compatible with various reference manager tools)
Single-cell RNA-seq reveals transcriptomic heterogeneity mediated by host–pathogen dynamics in lymphoblastoid cell lines
eLife 10:e62586.
https://doi.org/10.7554/eLife.62586


