Selfing is the safest sex for Caenorhabditis tropicalis
- Department of Biology and Center for Genomics & Systems Biology, New York University, United States
- Institute de Biologie, École Normale Supérieure, CNRS, Inserm, France
- Department of Molecular Biosciences, Northwestern University, United States
- Department of Biology, Duke University, United States
- Institut de Biologie Valrose, Université Côte d’Azur, CNRS, Inserm, France
- Department of Biology, Eastern Michigan University, United States
Figures
Figure 1
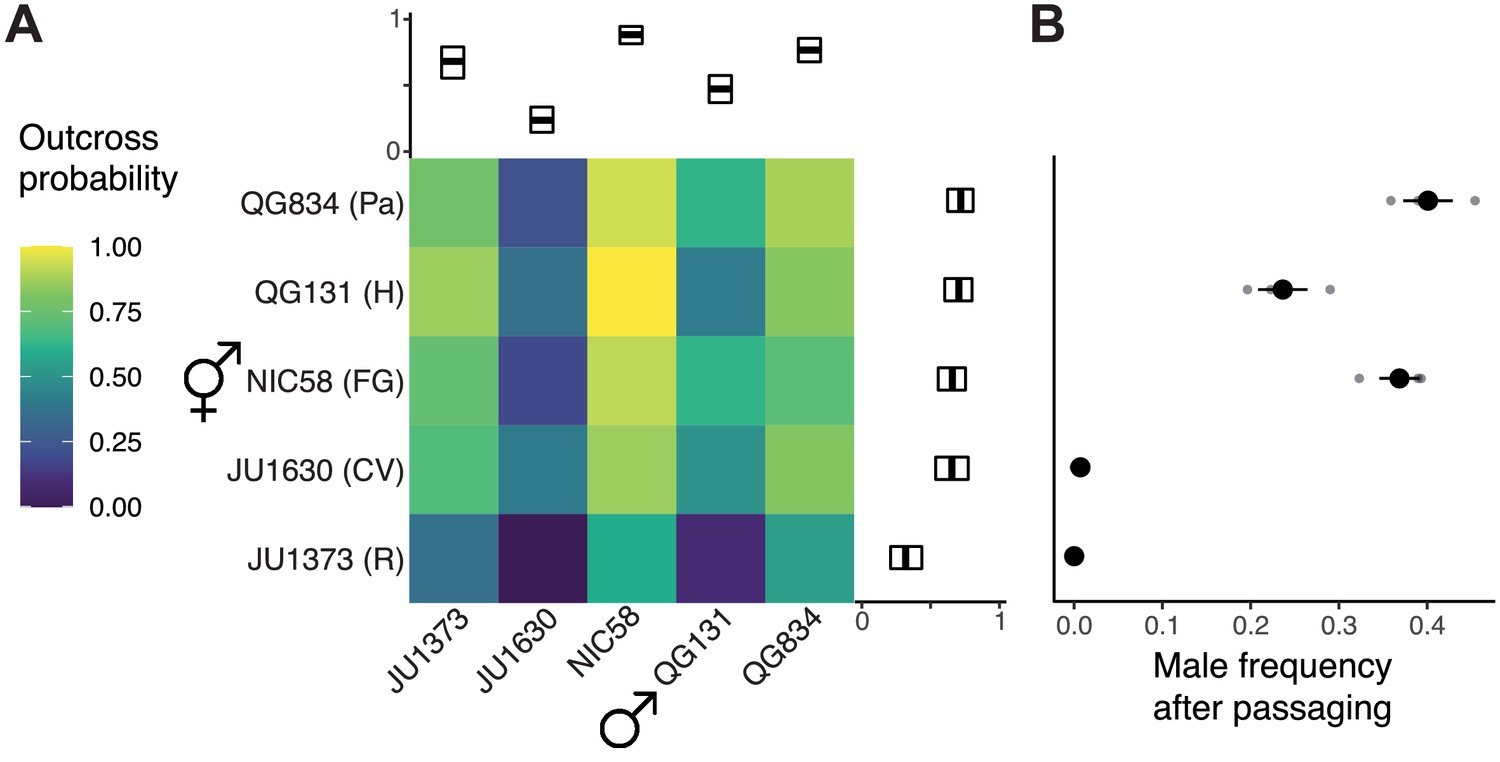
Outcrossing dynamics.
(A) Outcrossing probability in reciprocal crosses. Mating success was scored as a binary trait in 22–34 trials (biological replicates) per cross. Marginal means with bootstrap 99% confidence intervals are shown. (B) Strains vary in their male frequency after 10 generations of passaging at large population size (mean and standard error of three biological replicates). R: Réunion Island, CV: Cape Verde, FG: French Guiana, H: Hawaii, Pa: Panama. Data are in Figure 1—source datas 1 and 2.
-
Figure 1—source data 1
outcrossProbability.tsv.zip; wild isolate outcross probability trials.
- https://cdn.elifesciences.org/articles/62587/elife-62587-fig1-data1-v2.tsv.zip
-
Figure 1—source data 2
malePassaging.tsv.zip; wild isolate passaging male frequency.
- https://cdn.elifesciences.org/articles/62587/elife-62587-fig1-data2-v2.tsv.zip
Figure 2
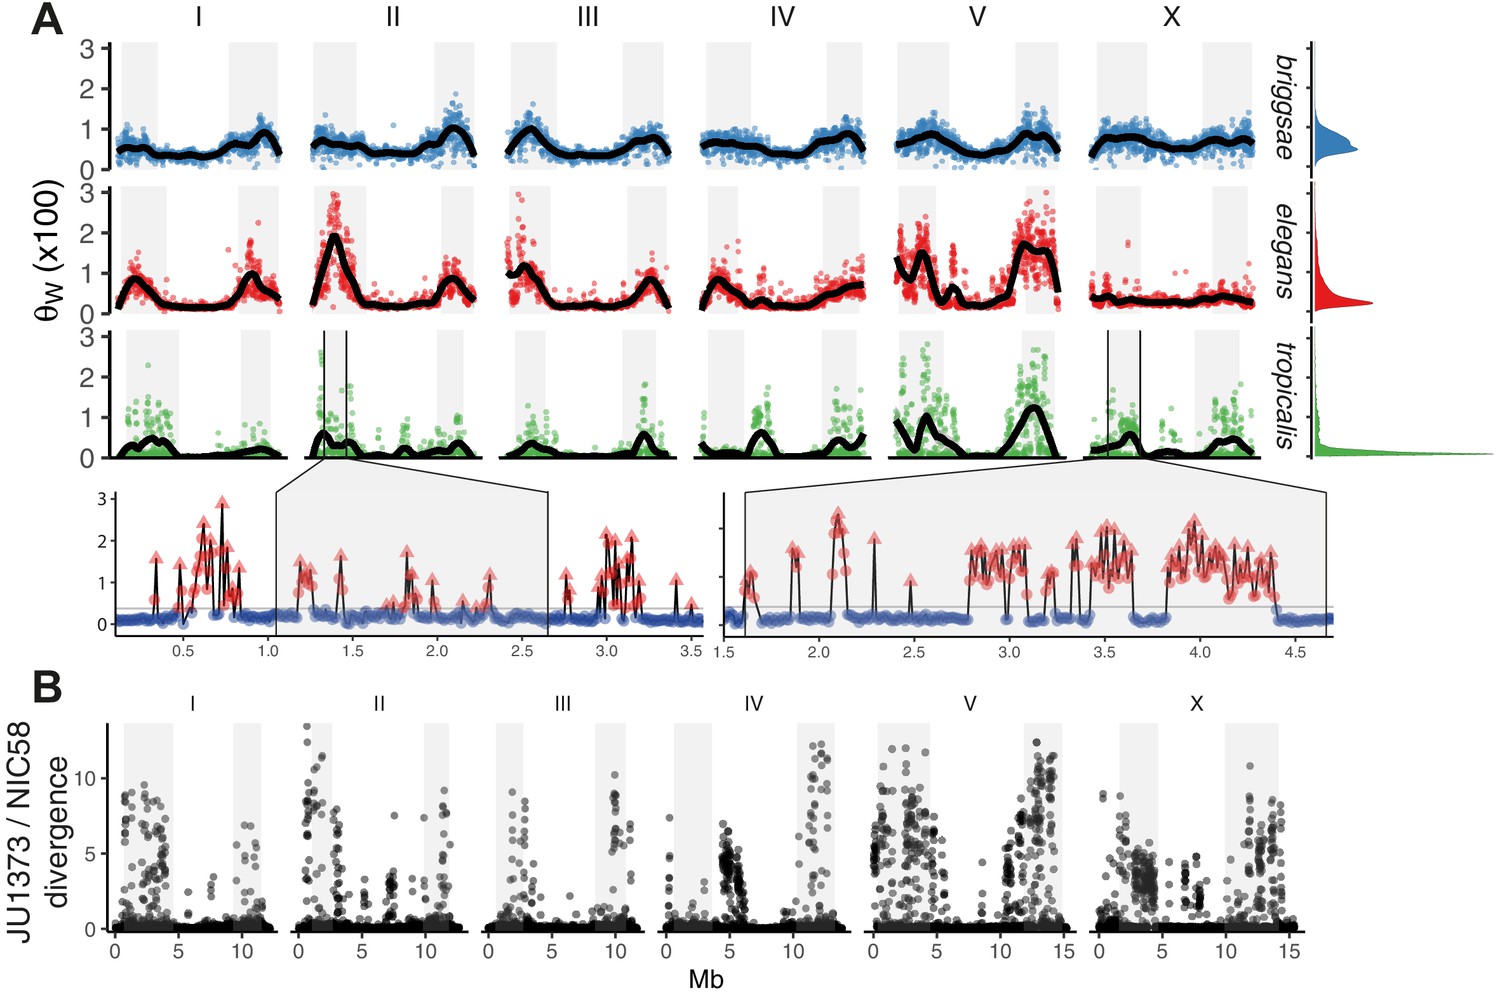
The distribution of genomic diversity in selfing Caenorhabditis species.
(A) Nucleotide diversity across chromosomes based on 24 strains for C. tropicalis, 35 strains for C. briggsae, and 330 isotypes for C. elegans (Watterson’s θ [× 100] in non-overlapping 20 kb windows, physical distance normalized across species and chromosomes). The denominator in Watterson’s estimator uses the mean number of strains with non-missing calls per window rounded to the nearest integer. 12 outliers for C. elegans are outside the plotted range. Differences in heterogeneity across species are apparent from the marginal density plots, and from dispersion around the locally weighted polynomial (LOESS) fit to the data in black. Levels of variation at loci in C. tropicalis centers approach those of arms for chromosomes II, IV, V, and X. Arm recombination rate domains are shaded, and regions on the left arms of chromosome II and the X are magnified below. Here, triangles are local peaks called at 10 kb scale by segmenting divergent regions (red) from background (blue) at the threshold indicated by a gray line (see Materials and methods), the y-axis is as in the main plot, and the x-axis is unnormalized physical distance (Mb). Data are in Figure 2—source data 1. (B) Genetic diversity between JU1373 and NIC58 from genome alignment, shown as single nucleotide variant (SNV) differences (1 - % identity) in 10 kb non-overlapping windows. Data are in Figure 2—source data 2.
-
Figure 2—source data 1
selfer_theta_20 kb.tsv.zip; Binned nucleotide diversity for C. elegans, C. briggsae, and C. tropicalis.
- https://cdn.elifesciences.org/articles/62587/elife-62587-fig2-data1-v2.tsv.zip
-
Figure 2—source data 2
JU1373-NIC58.alignmentCoverage.tsv.zip; JU1373 and NIC58 identity and copy number variation (Minimap2 alignment).
- https://cdn.elifesciences.org/articles/62587/elife-62587-fig2-data2-v2.tsv.zip
Figure 3 with 2 supplements

Population structure.
(A) The distribution of 24 isolates (numbers per locale are shown in the legend; Data in Figure 3—source data 1), colored by groupings in (B), where principal component analysis of nuclear genomic similarity identifies largely discrete populations. (C) Genetic diversity is found mostly, but not entirely, within populations. For three populations with at least two lines (<99% single nucleotide variant [SNV] identity), within population diversity (π) is plotted for each population against between population diversity (Dxy; Nei and Li, 1979; 10 kb scale). Data in B and C are based on Supplementary file 4.
-
Figure 3—source data 1
isolateMetadata.tsv.zip; metadata for C. tropicalis wild isolates.
- https://cdn.elifesciences.org/articles/62587/elife-62587-fig3-data1-v2.tsv.zip
Figure 3—figure supplement 1
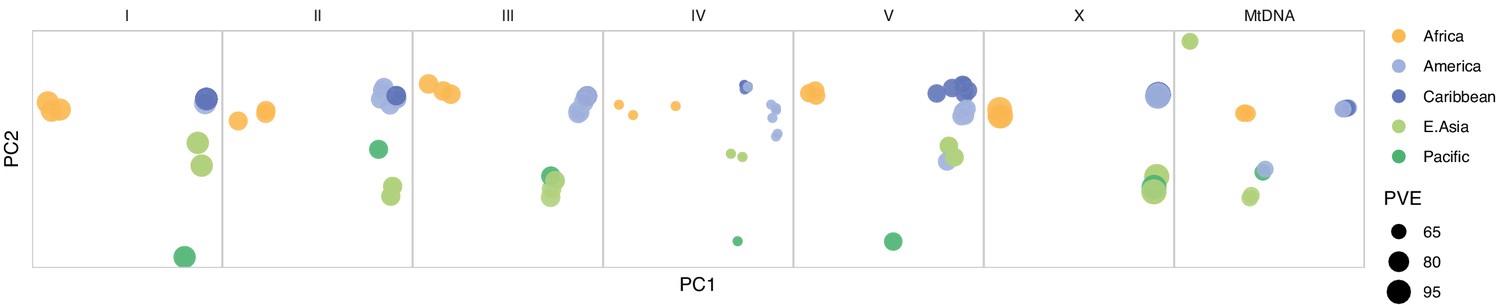
Chromosome and mitochondrial population structure.
Point size for each chromosome/genome panel scales with the percentage of variance explained (PVE) by the first two principal components of single nucleotide variant (SNV) genetic relatedness. Data are based on Figure 3—source data 1.
Figure 3—figure supplement 2
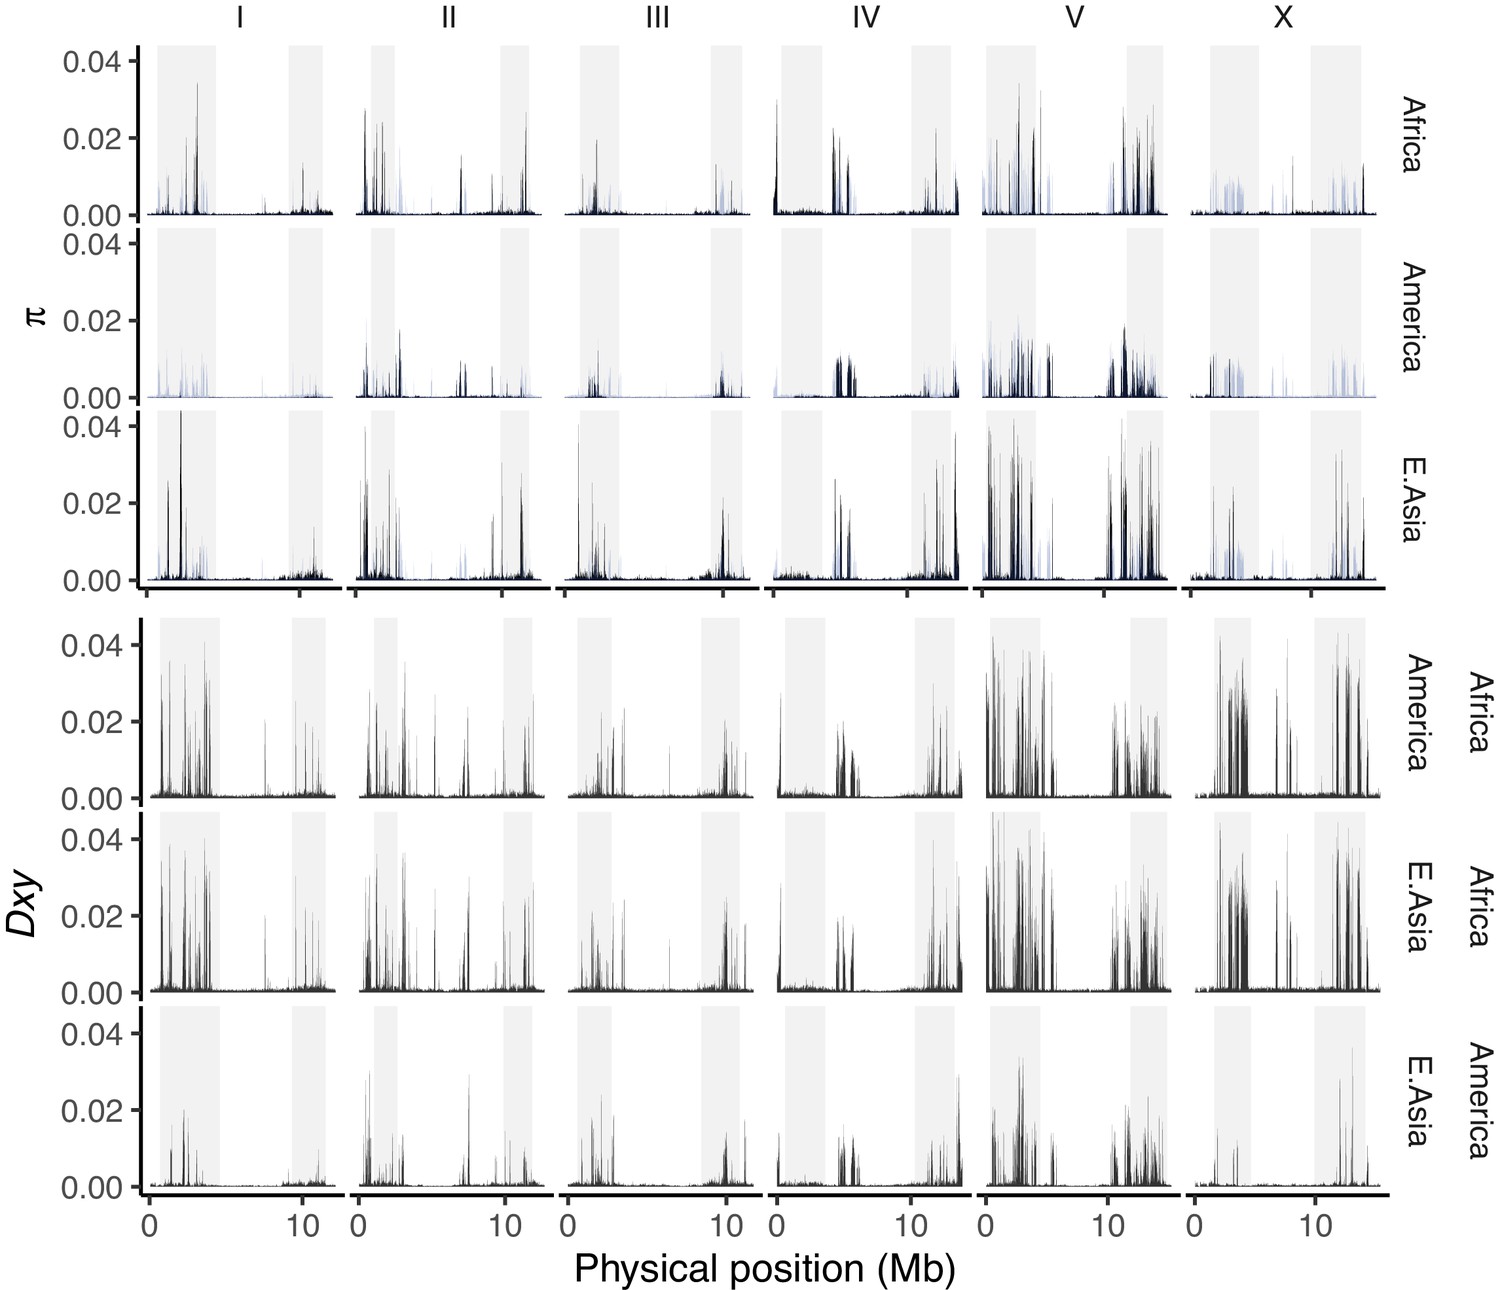
The average number of single nucleotide variant (SNV) differences among all pairwise comparisons within (π; upper, with the global value for all pooled samples plotted in blue across each panel) and between (Nei and Li, 1979; lower) populations (10 kb non-overlapping windows, adjusted for the mean fraction of missing data per window).
We use the major population groupings defined by genome-wide PCA in Figure 3B, where multiple isolates are present (13 from Central and South America, three from Africa, and two from East Asia after filtering to <99% identity). Data are based on Figure 3—source data 1.
Figure 4

Recombinant inbred lines (RILs) vary in their hermaphrodite crossing probability.
(A) Means and 95% bootstrap confidence intervals from binary trials are shown for RILs and their parents. Data are in Figure 4—source data 1. (B) Quantitative trait locus mapping for hermaphrodite crossing probability (genome-wide 0.05 significance threshold from 1000 phenotype permutations shown in gray, n = 118 RILs). Data are based on Supplementary file 1.
-
Figure 4—source data 1
RIL_mating.tsv.zip; RIL outcross probability trials.
- https://cdn.elifesciences.org/articles/62587/elife-62587-fig4-data1-v2.tsv.zip
Figure 5 with 1 supplement
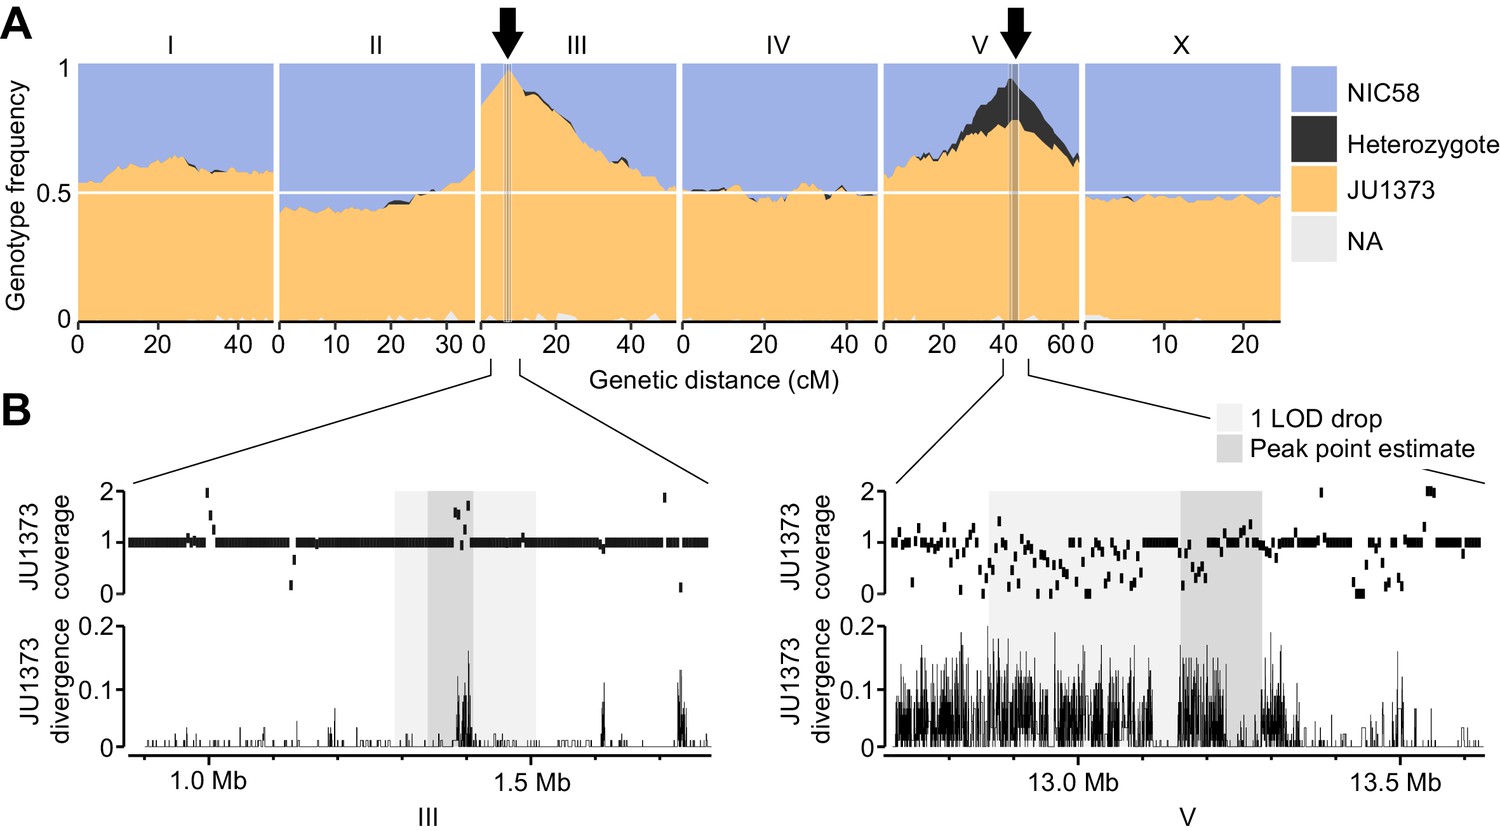
Two genomic regions show strong transmission ratio distortion.
(A) Recombinant inbred line (RIL) genotype frequencies and peaks of transmission ratio distortion (arrows). Shaded areas are 1 LOD drop intervals and peak point estimates. Genome-wide data are based on Supplementary file 1, and multilocus transmission ratio distortion genotype tables are in Figure 5—source data 1. (B) Fold coverage and single nucleotide variant (SNV) divergence of JU1373 relative to NIC58. Fold coverage is in 5 kb windows, divergence is 1-identity in 100 bp windows. Data are based on Figure 2—source data 2.
-
Figure 5—source data 1
RIL_distortion.tsv.zip; genotype tables at transmission ratio distortion peaks on chromosomes I, III, and V.
- https://cdn.elifesciences.org/articles/62587/elife-62587-fig5-data1-v2.tsv.zip
Figure 5—figure supplement 1
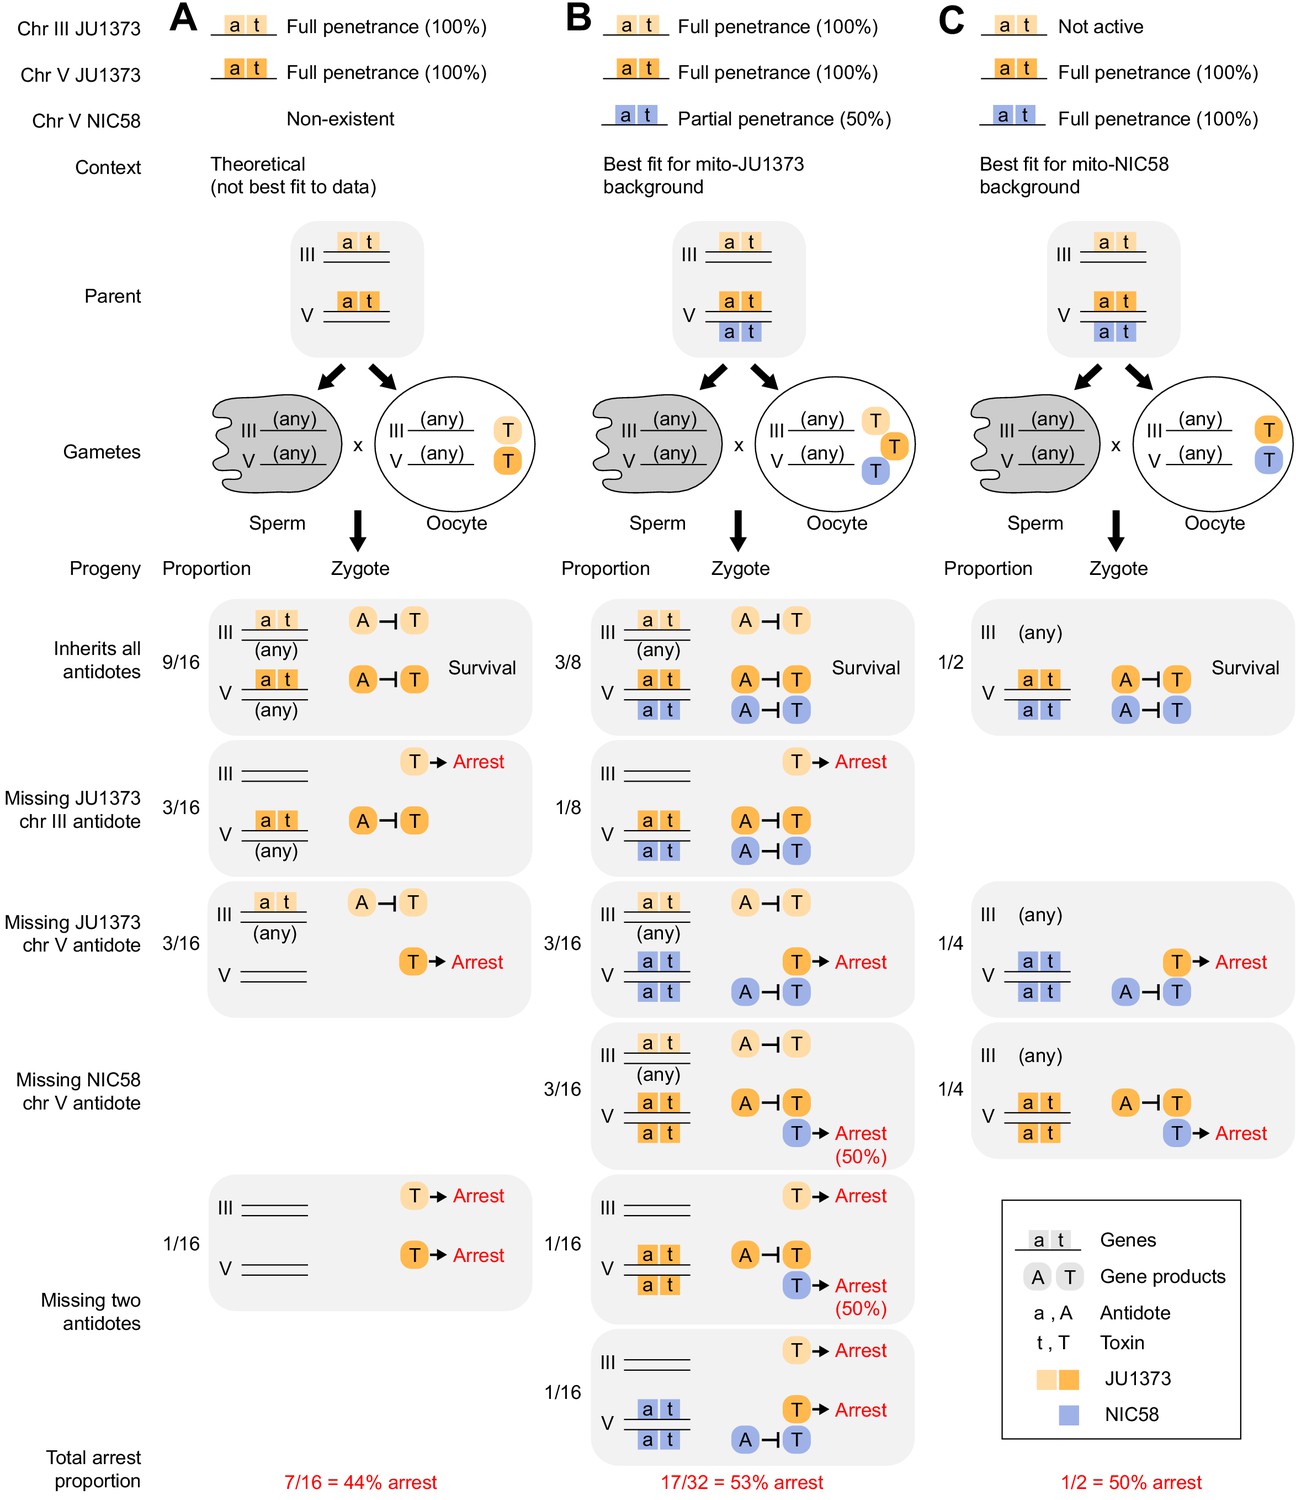
Models of Medea-mediated gene drive and expected F2 arrest proportions.
Each Medea factor is composed of two genes, a maternally expressed toxin and a zygotically expressed antidote. (A) Two JU1373 Medeas, on chromosomes III and V. This model is not the best fit for observed genotype frequencies among wild-type F2 animals. (B) A JU1373 Medea on III and antagonistic Medeas (JU1373 and NIC58) on V. The NIC58 Medea is assumed to be 50% penetrant, but true penetrance likely depends on genetic background. This model is the best fit for observed genotype frequencies among wild-type F2 animals in a mito-JU1373 background. (C) Inactive JU1373 Medea on III and antagonistic Medeas (JU1373 and NIC58) on V. This model is the best fit for observed genotype frequencies among wild-type F2 animals in a mito-NIC58 background.
Figure 6
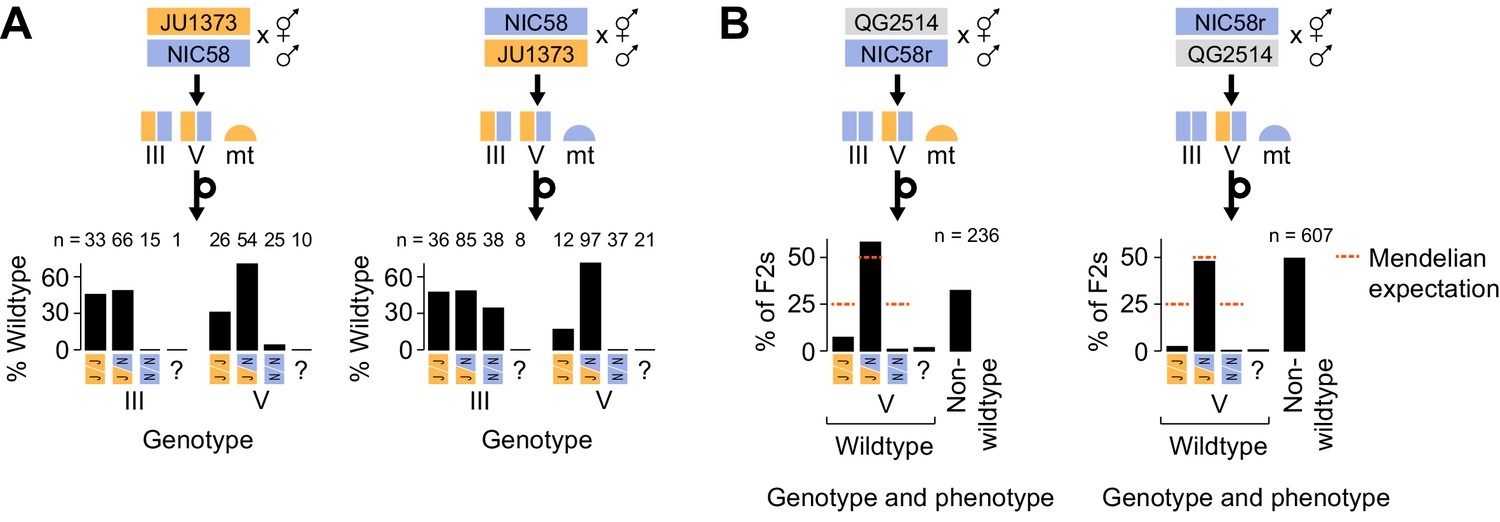
Medea genetics.
(A) Percentage of F2 progeny from reciprocal NIC58 × JU1373 crosses showing wild-type development. Genotypes reflect markers tightly linked to the peaks of transmission ratio distortion on chromosomes III and V. ? = genotyping failure. (B) Genotype and phenotype frequencies among F2 progeny from reciprocal crosses between NIC58 and recombinant inbred line (RIL) QG2514. Only wild-type F2 progeny were genotyped. Data are in Figure 6—source data 1.
-
Figure 6—source data 1
NIC58_JU1373_RIL_crosses.tsv.zip; plate-level cross compatibility data for JU1373, NIC58, and RILs.
- https://cdn.elifesciences.org/articles/62587/elife-62587-fig6-data1-v2.tsv.zip
Figure 7 with 1 supplement

Medea loci act independently and by maternal effect.
(A and B) Percentages of F2 or backcross progeny that reached adulthood within 72 hr of egg laying. Strains beginning with ‘QG’ are recombinant inbred lines (RILs). JU1373d is a Dumpy mutant. NIC58r and QG4249r express a red fluorescent transgene (see Materials and methods ). (A) Crosses testing whether Medea loci act independently. Each point is a cross plate, progeny of a single F1 hermaphrodite, with a median of 34 worms scored per plate. (B) Crosses testing whether Medea loci act via maternal or paternal effect. Maternal- and paternal-effect expectations are under a model that either a maternal- or paternal-effect toxin causes fully penetrant developmental arrest for progeny not inheriting the Medea haplotype. (C) Interpretation of maternal- and paternal-effect crosses. (D) Schematic of Medea activity. Percentages are estimates for the proportion of animals undergoing developmental arrest, compared to heterozygous siblings, derived by comparing observed genotype frequencies among wild-type F2 progeny to Mendelian expectations. This method avoids bias introduced by genotyping failures being more common among arrested versus wild-type animals. Reciprocal crosses used to estimate arrest proportions were NIC58 × JU1373, NIC58 × RIL QG2479 (not shown), and NIC58r × RIL QG2514. NIC58r expresses a red fluorescent transgene (see Materials and methods).
Figure 7—figure supplement 1
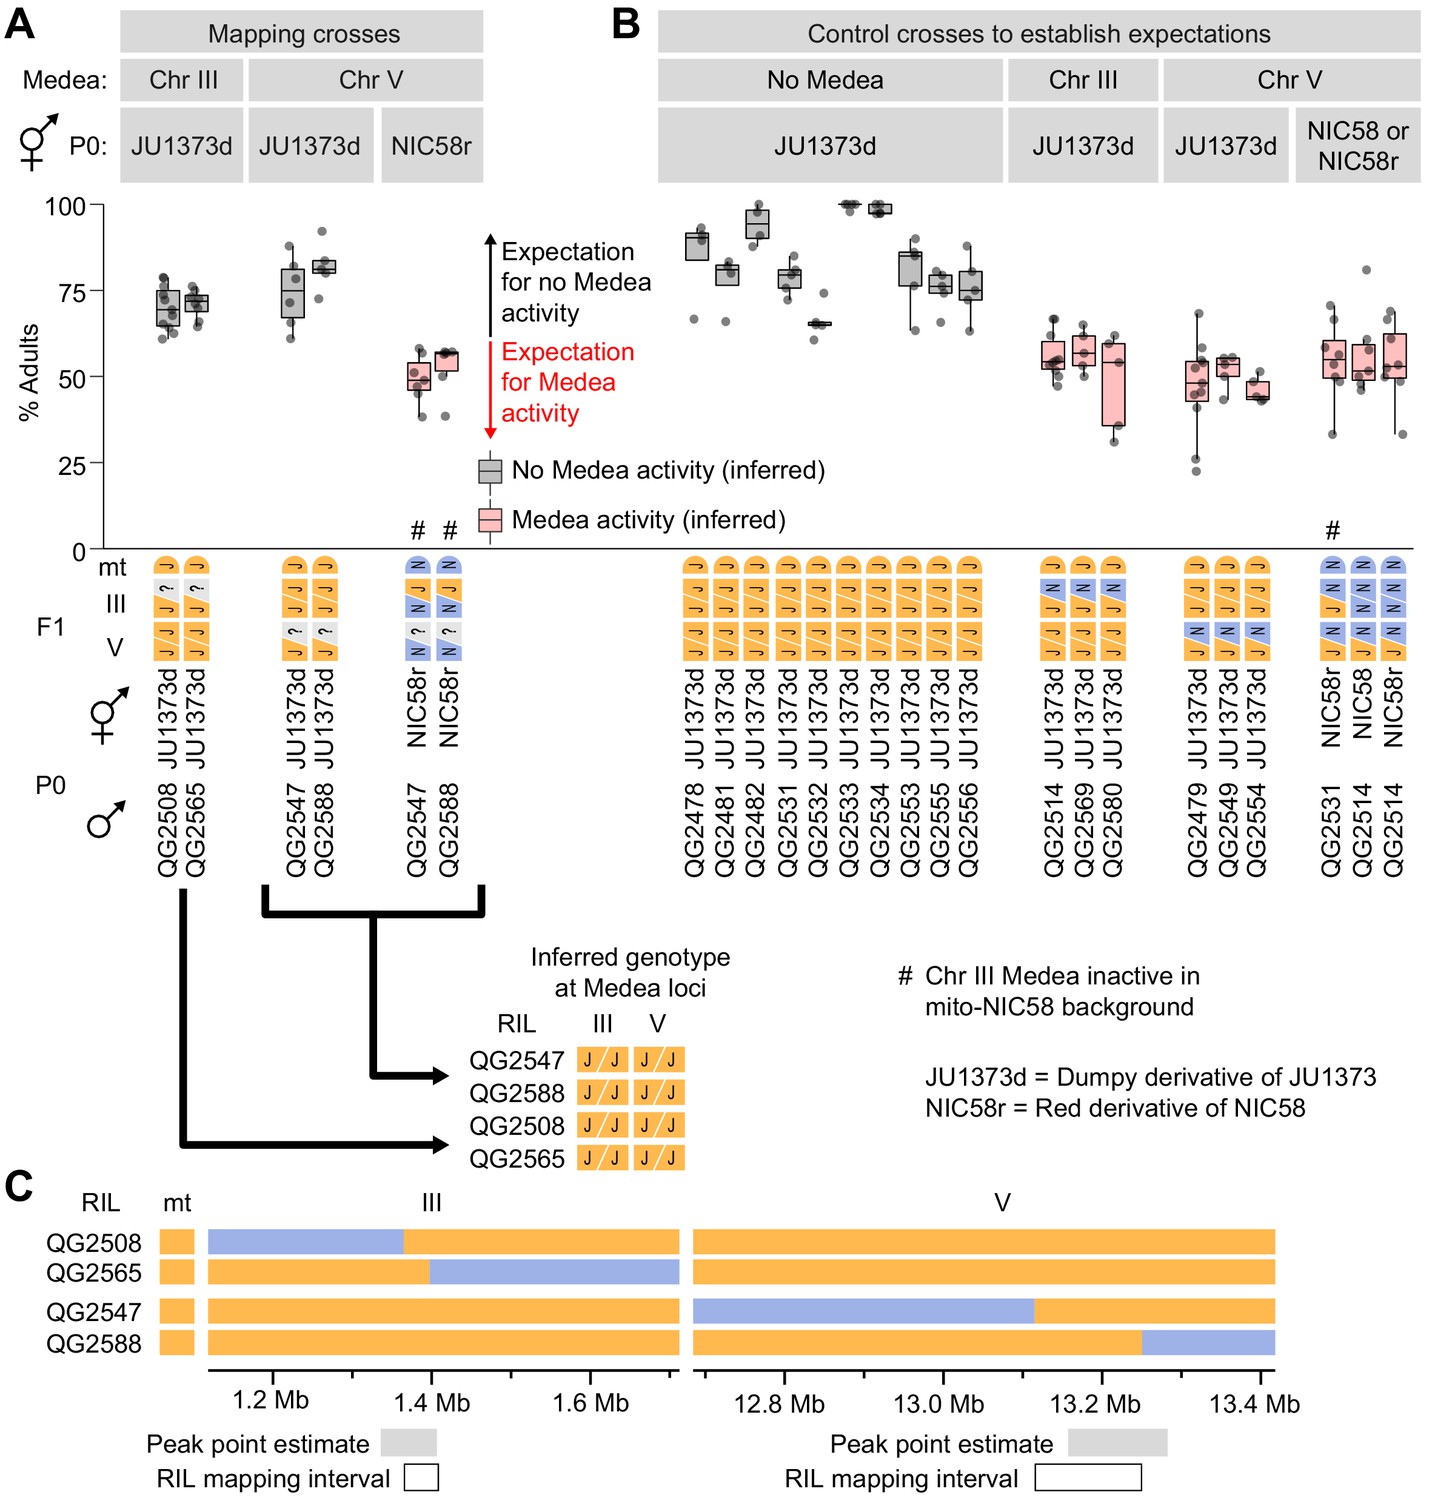
Mapping Medea loci using recombinant inbred lines (RILs).
(A and B) Percentages of F2 progeny that reached adulthood within 72 hr of egg laying. Strains beginning with ‘QG’ are RILs. JU1373d is a Dumpy mutant. NIC58r expresses a red fluorescent transgene (see Materials and methods). (A) Crosses to determine whether RILs with recombination breakpoints near Medea loci exhibit Medea activity in crosses to JU1373d and NIC58r. ? = unknown RIL genotypes at the Medea loci, to be inferred from the results of the crosses. Expectations are based on crosses shown in (B). Some of the data here are duplicated from Figure 7 for ease of comparison. (C) RIL genotypes and intervals to which Medeas were mapped. Peak point intervals are regions of maximum RIL distortion χ2 statistics from Figure 5A.
Figure 8 with 1 supplement

Genomic internals surrounding Medea loci on chromosome III (A) and V (B).
Windows span transmission ratio distortion 1 LOD drop intervals. Rectangles are predicted genes, lines connect homologs. Colors indicate the union of homologs within the interval. Homology relationships to genes outside the intervals are not shown. Data are based on Supplementary file 2 and Supplementary file 6.
Figure 8—figure supplement 1
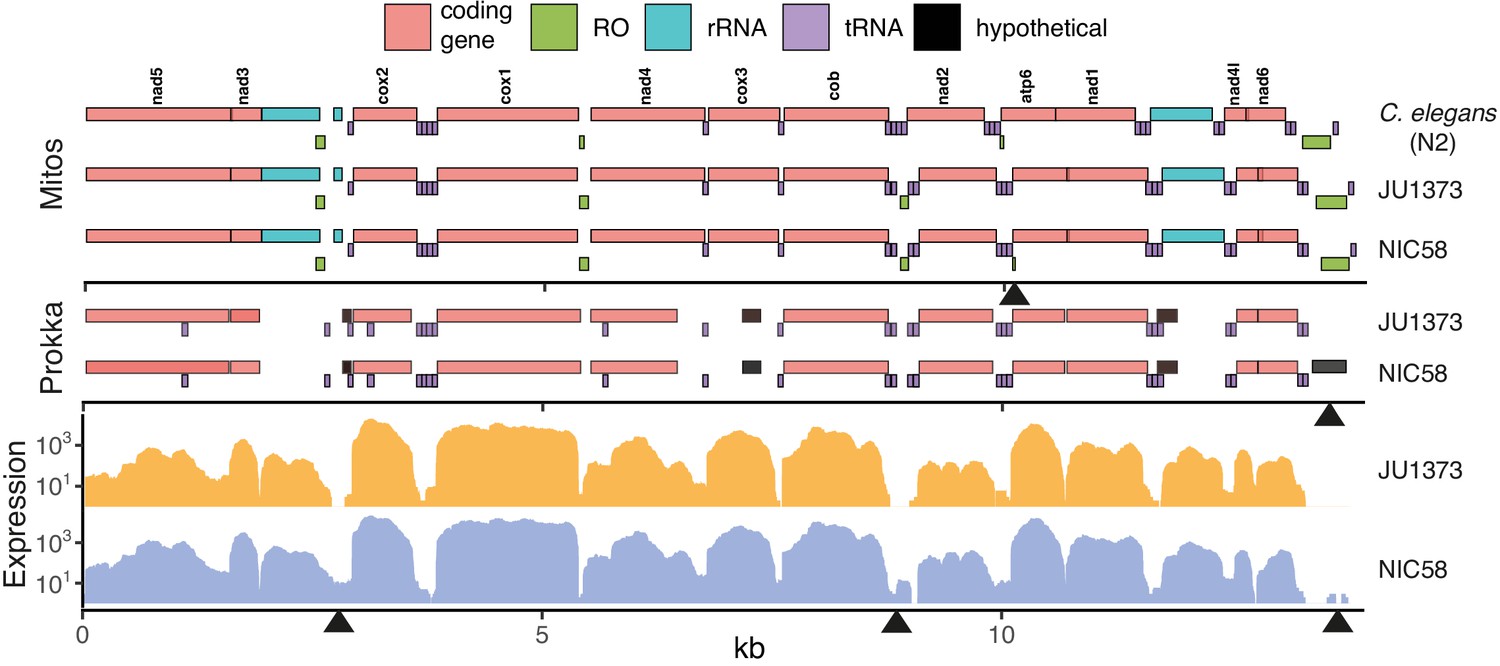
Mitochondrial genomes.
Annotations are shown for two homology-based methods, Mitos (Bernt et al., 2013) and Prokka (Seemann, 2014), over expression from short-read RNAseq data (per base read depth). RO: potential replication origin, including the large D-loop non-coding region at 13.5 kb. Some obvious differences of unknown significance are highlighted with black arrowheads along the three x-axes including (top to bottom, left to right): the presence of a small, low-scoring RO in NIC58 called by Mitos; the presence of a novel open reading frame, called by Prokka, overlapping the D-loop in NIC58 and predicted to encode a 122-amino acid transmembrane protein; and three regions of clear differential expression overlapping a 16S ribosomal RNA fragment, a tRNA and RO cluster, and the D-loop region. Data are based on Supplementary file 2.
Figure 9
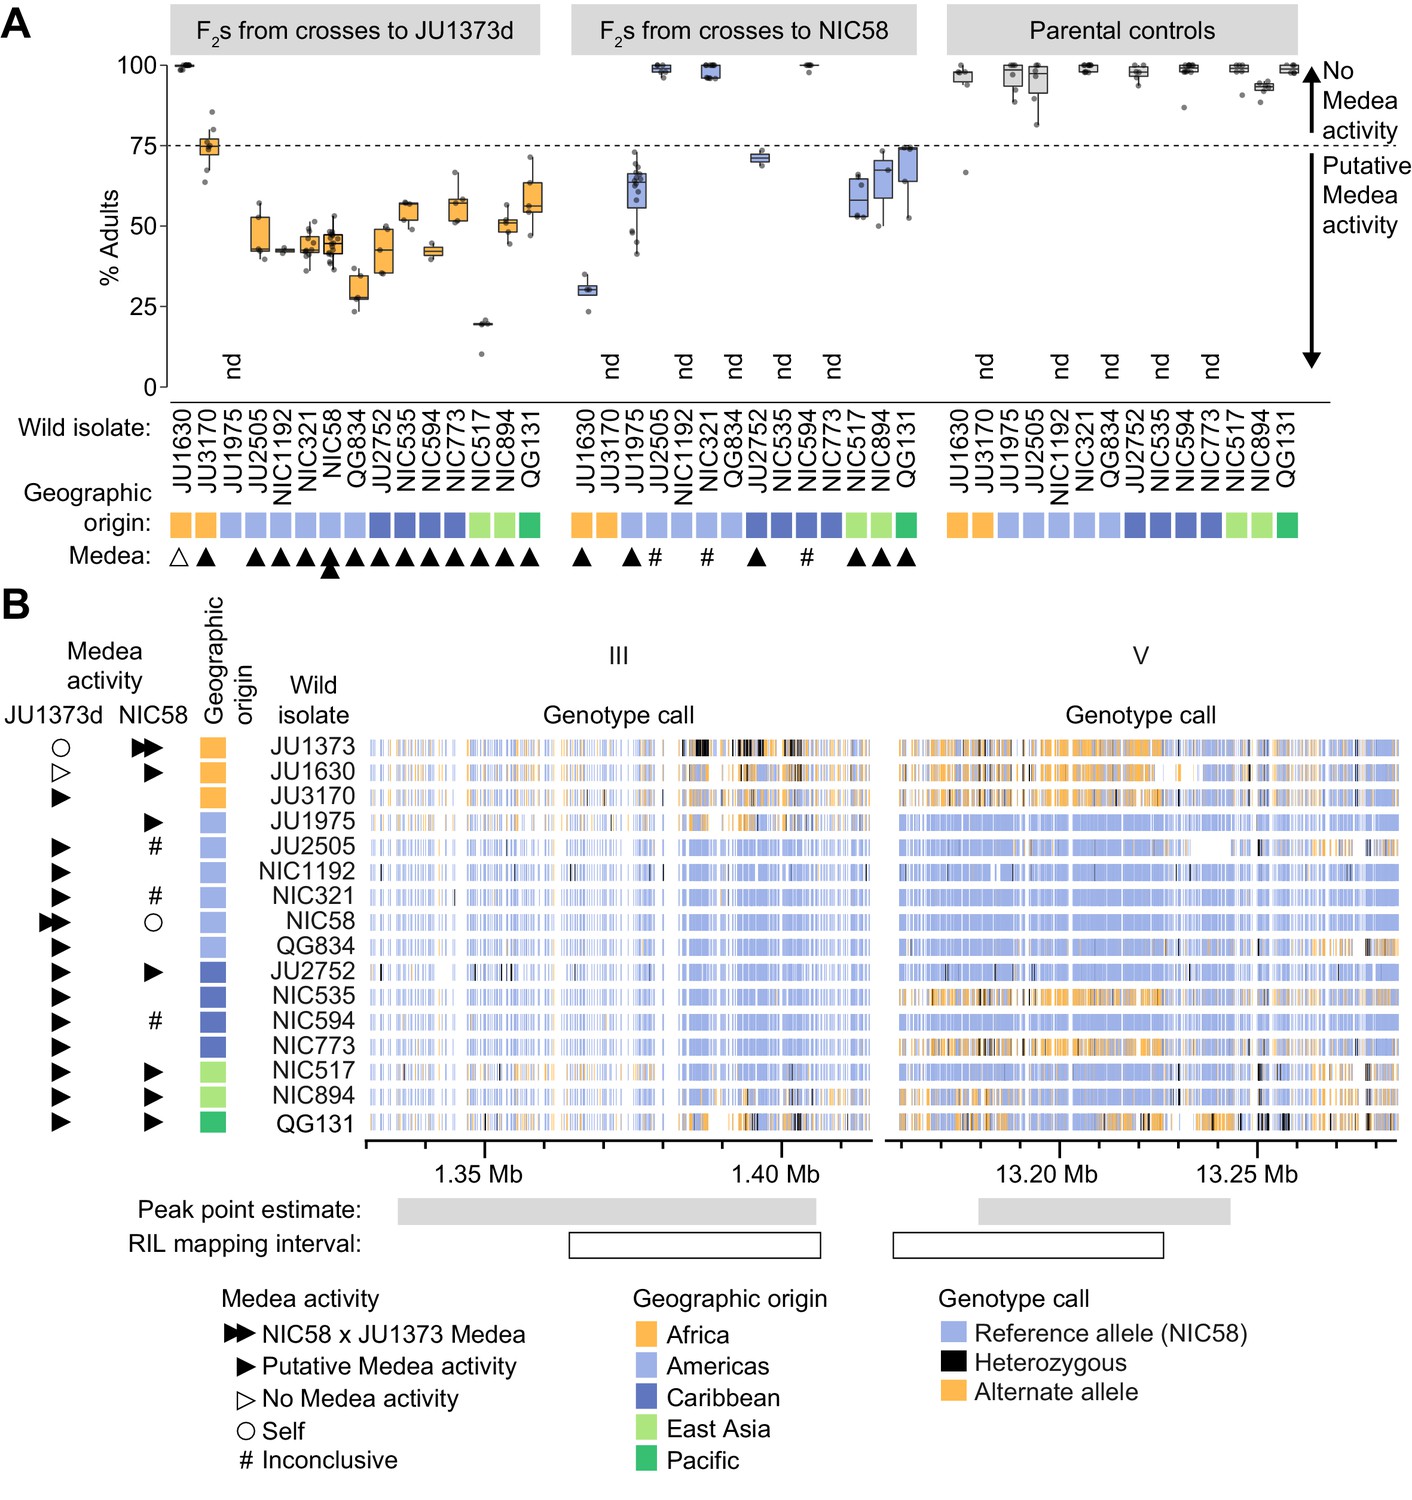
Wild isolate phenotypes and haplotypes.
(A) Percent of F2 progeny reaching adulthood within the normal developmental time (~72 hr), for crosses between wild isolates and a Dumpy derivative of JU1373 (JU1373d) or NIC58. #, inconclusive because we cannot be certain that F1 animals were cross-progeny. nd, not determined. Putative Medea activity is inferred for crosses in which the median percent of F2 animals reaching adulthood was less than ~75%. Each plotted point is a plate (2–16 per cross, median 6), with a median 39 animals scored per plate. Data is in Figure 9—source data 1. (B) Wild isolate single nucleotide variant haplotypes at the Medea loci on chromosomes III and V. Heterozygous calls likely reflect duplication and divergence. Data are based on Supplementary file 4.
-
Figure 9—source data 1
NIC58_JU1373_isolate_crosses.tsv.zip; plate-level cross compatibility data for JU1373, NIC58, and wild isolates.
- https://cdn.elifesciences.org/articles/62587/elife-62587-fig9-data1-v2.tsv.zip
Figure 10 with 2 supplements
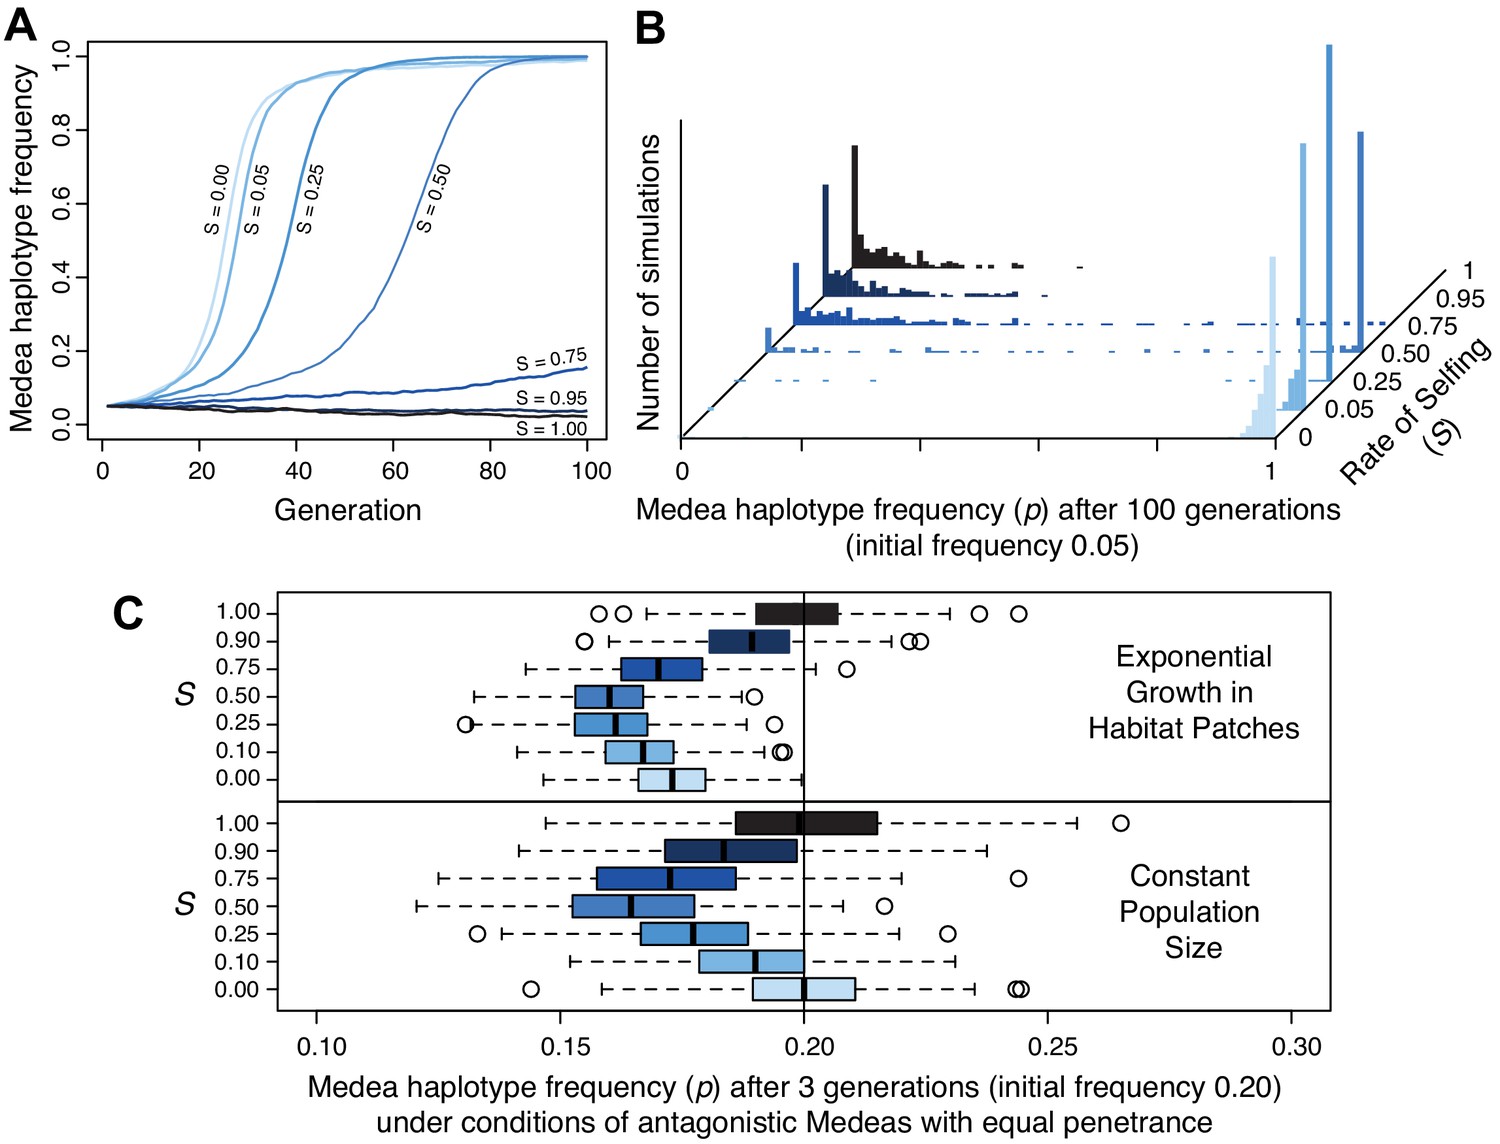
Selfing reduces the efficacy of Medea elements.
(A) Representative allele frequency trajectories of a Medea haplotype under different rates of selfing (S) for 100 generations. Population size is 20,000 in each case, the initial Medea allele frequency is 0.05, penetrance is 0.95, and initial genotype frequencies and sex ratios are those expected at neutral equilibrium given the selfing rate. At selfing rates of 95%, elements fail to increase in frequency during 100 simulated generations. (B) Distribution of Medea allele frequencies after 100 generations in populations of size 1000. Each histogram shows the outcome of 250 simulations with initial Medea allele frequency 0.05. Medea alleles are often lost under high selfing rates. (C) Antagonistic haplotypes induce positive frequency dependent selection when selfing rates are intermediate, when populations undergo exponential growth in ephemeral habitat patches, or both. Each boxplot represents the results of 250 simulations of three generations of evolution with competing Medea haplotypes starting from allele frequency 0.2 and 0.8, with initial population size 1000. In the patchy environment, those 1000 individuals are distributed among 250 separate patches, and population growth is unbounded within each. Source code is available from github.
Figure 10—figure supplement 1
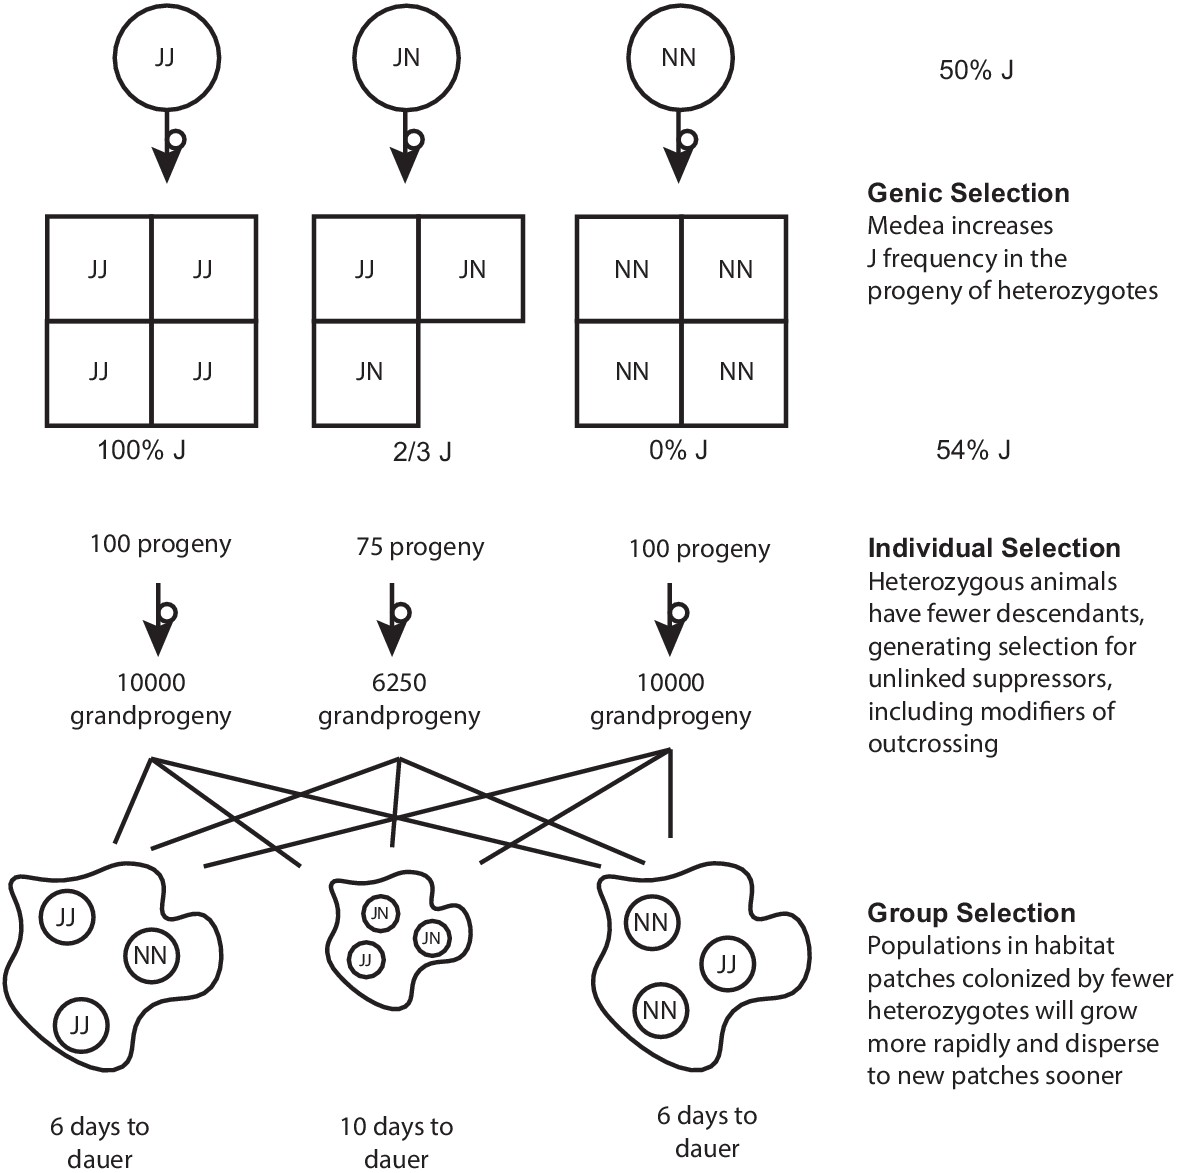
In a single-Medea scenario, genic and group selection affect the frequencies of haplotypes, and Medea-induced deaths generate individual-level selection for suppression.
Figure 10—figure supplement 2
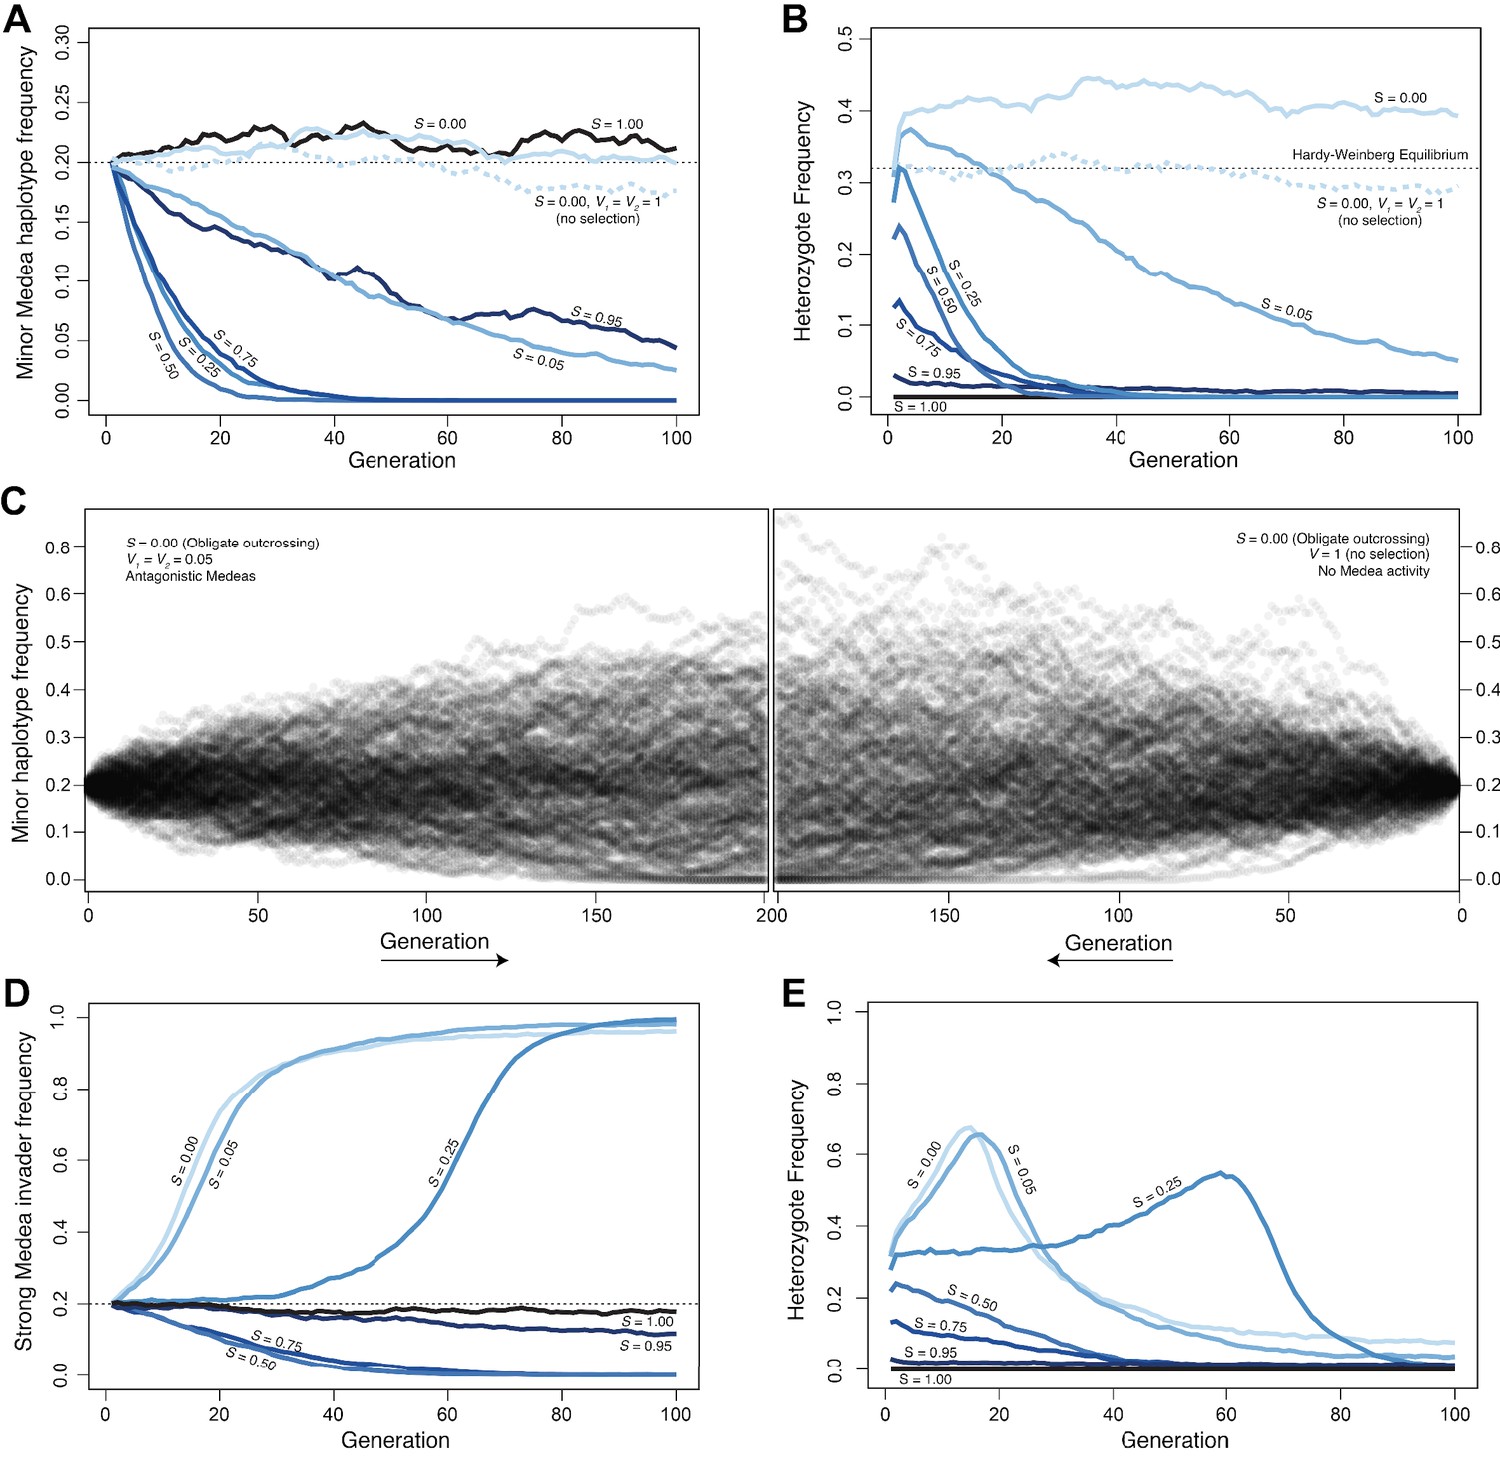
Antagonistic Medeas are subject to drift, genic selection, or positive frequency-dependent selection, depending on the selfing rate.
A–C show simulations of antagonistic Medea elements with equal penetrance (0.95), D and E show antagonistic elements with unequal penetrances. (A) At a locus with two haplotypes, each containing Medea elements, allele frequencies change over time as a function of selfing rate (S). At intermediate selfing rates, positive frequency-dependent selection acts to remove the rarer haplotype from the population. This effect is explained by the disproportionate impact of segregation in heterozygous selfers on the rarer haplotype. Heterozygous selfers kill each haplotype in equal proportions (¼ of progeny are homozygous for each haplotype), while outcrossers kill each as a function of their population frequency; the result is that the rare allele suffers more from heterozygote selfing. Intermediate levels of outcrossing result in the highest frequency of heterozygous selfer and so the most efficient selection against the rare allele. Under complete selfing (S = 1), there are no heterozygotes and Medeas have no effect. Under obligate outcrossing, the haplotypes are subject to drift and show similar dynamics to obligate selfers or outcrossers without Medeas. The pattern in obligate outcrossers reflects the maternal-zygotic interaction character of the Medeas. While the Medeas kill homozygotes, generating overdominance and heterozygote excess, this occurs only in heterozygous mothers. The fitness cost to these mothers represents underdominance, favoring homozygotes, and the over- and under-dominance balance each other. This figure shows the results of representative simulations with fixed population size of 20,000 breeding individuals, initial frequencies 0.2 and 0.8, and 95% penetrance of each of the two Medeas. (B). Heterozygote frequencies (from the simulations shown in A) vary over the simulations. Obligate outcrossers maintain substantially elevated heterozygote frequencies. (C) Surprisingly, despite the strong selection against homozygotes and the elevated frequency of heterozygotes in obligate outcrossers, allele frequencies evolve with drift-like dynamics. Results of 200 simulations are shown, each with a fixed population size of 1000 breeding individuals and initial minor allele frequency of 0.2. The left panel illustrates the spread of allele frequencies across simulations in the case of antagonistic Medeas, and the right shows the results with no Medeas. In both cases, frequencies drift and some populations lose the lower-frequency allele. After 200 generations, the allele frequency variances are not different between the two cases (Levene’s test, p=0.13). (D) When a strong Medea element (penetrance 0.95) invades a population carrying a weaker Medea (penetrance 0.6), its ability to displace the weak Medea depends on the selfing rate (S). At low selfing rates, genic selection favoring the strong Medea drives it to high frequency. At intermediate and high selfing rates, positive frequency-dependent selection favors the weaker resident Medea, and the strong haplotype is removed from the population. The figure shows the results of representative simulations with fixed population size of 20,000 breeding individuals, initial frequencies 0.2 and 0.8, and penetrances chosen to represent those of the C. tropicalis JU1373 haplotype (0.95) and NIC58 haplotype (0.6). (E) Heterozygote frequencies (from the simulations in D) evolve, with heterozygosities transiently elevated above 0.5 during sweeps. Source code is available from github.
Additional files
-
Supplementary file 1
NIC58_rqtlCross.rda.zip; R/qtl cross object containing the NIC58 genetic map and associated recombinant inbred line (RIL) genotypes.
- https://cdn.elifesciences.org/articles/62587/elife-62587-supp1-v2.rda.zip
-
Supplementary file 2
tropicalisGenomes.zip; archive containing nuclear and mitochondrial genomes and annotations for NIC58 and JU1373.
- https://cdn.elifesciences.org/articles/62587/elife-62587-supp2-v2.zip
-
Supplementary file 3
rawVariantCalls.zip; archive containing unfiltered variant calls for nuclear and mitochondrial genomes.
- https://cdn.elifesciences.org/articles/62587/elife-62587-supp3-v2.zip
-
Supplementary file 4
filteredVariantCalls.zip; archive containing hard-filtered variant calls for the nuclear genome.
- https://cdn.elifesciences.org/articles/62587/elife-62587-supp4-v2.zip
-
Supplementary file 5
processedVariantCalls.zip; archive containing hard-filtered variant calls for nuclear and mitochondrial genomes with no missing data.
- https://cdn.elifesciences.org/articles/62587/elife-62587-supp5-v2.zip
-
Supplementary file 6
caeno_orthogroups.tsv.zip; ortholog groupings for Caenorhabditis species.
- https://cdn.elifesciences.org/articles/62587/elife-62587-supp6-v2.tsv.zip
-
Transparent reporting form
- https://cdn.elifesciences.org/articles/62587/elife-62587-transrepform-v2.docx
Download links
A two-part list of links to download the article, or parts of the article, in various formats.
Downloads (link to download the article as PDF)
Open citations (links to open the citations from this article in various online reference manager services)
Cite this article (links to download the citations from this article in formats compatible with various reference manager tools)
Selfing is the safest sex for Caenorhabditis tropicalis
eLife 10:e62587.
https://doi.org/10.7554/eLife.62587


