miR-125-chinmo pathway regulates dietary restriction-dependent enhancement of lifespan in Drosophila
- RNA Biology Laboratory, Regional Centre for Biotechnology, India
- Buck Institute for Research on Aging, United States
- Translational Health Science and Technology Institute, India
- Department of Biology, Indiana University, United States
Figures
Figure 1 with 2 supplements
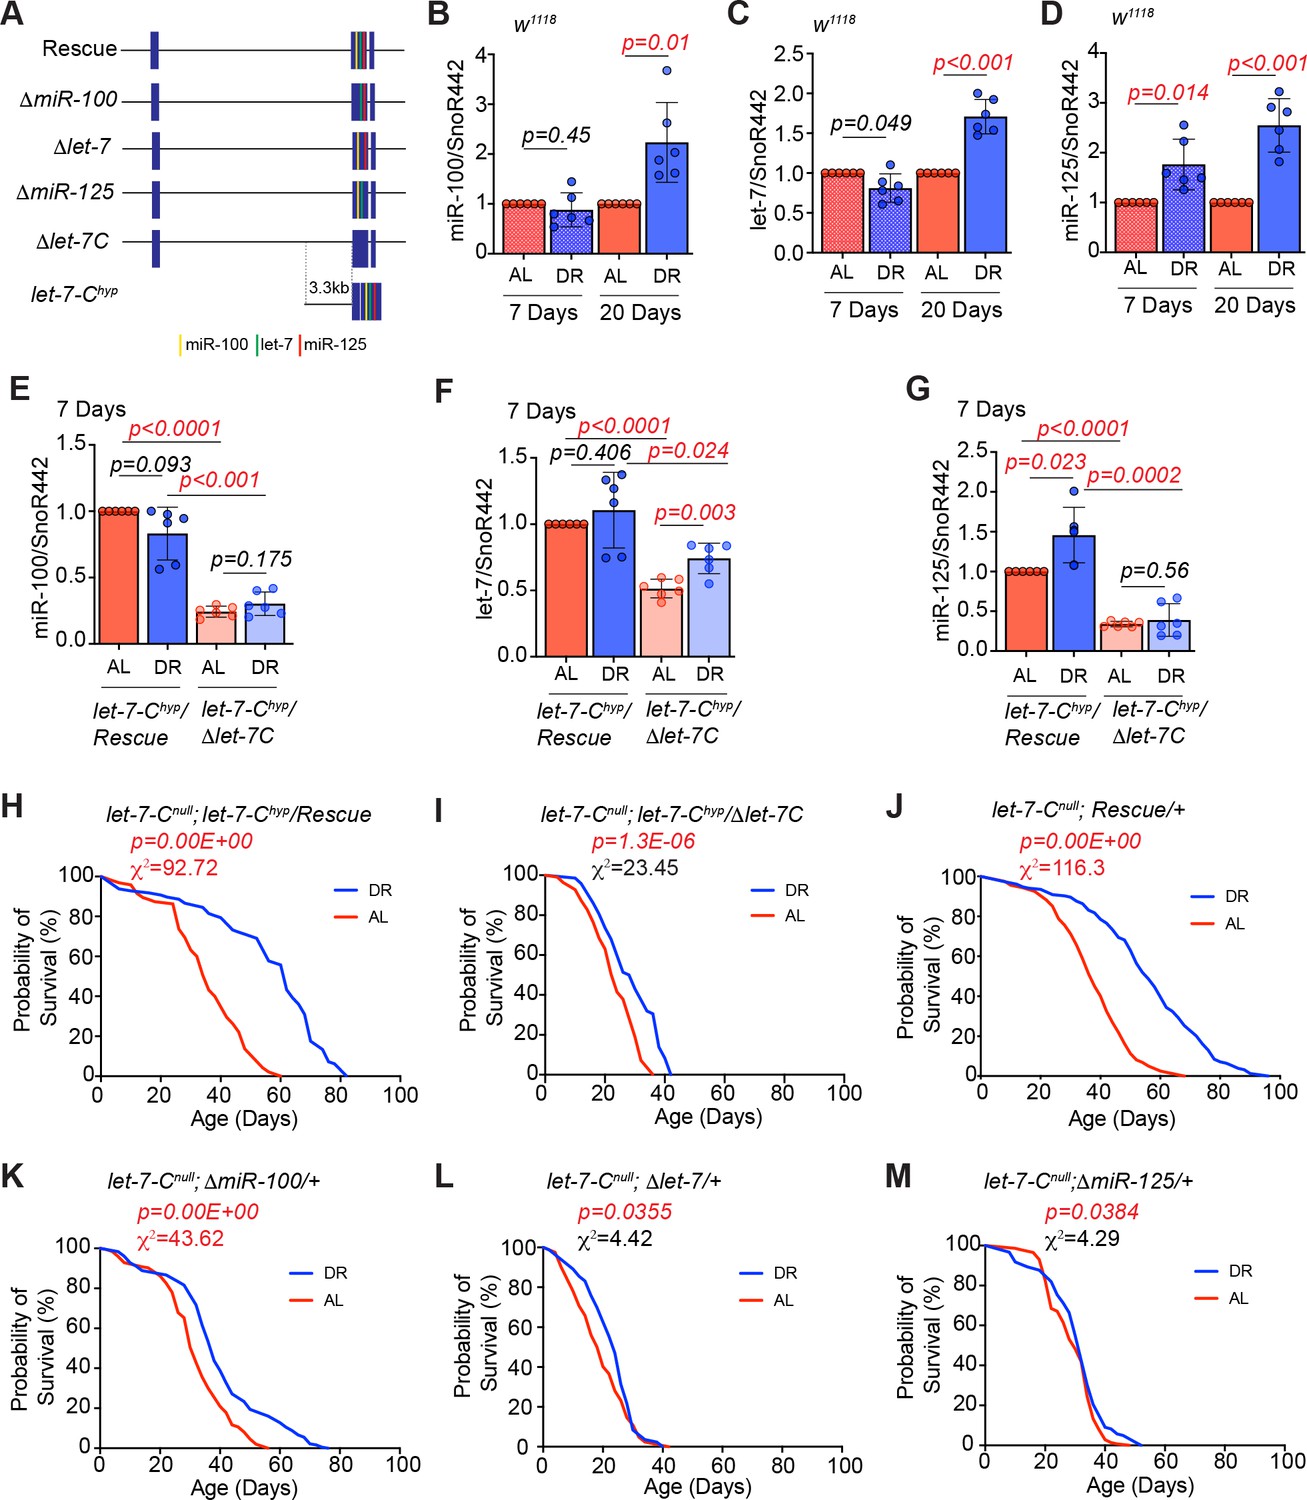
let-7 and miR-125 are required for DR-dependent enhancement of lifespan.
(A) Schematic of the let-7-Complex (let-7-C) rescuing transgenes. The Drosophila let-7-Complex (let-7-C) locus is located on chromosome two and encodes a 2435 nucleotide long primary transcript that is processed into three evolutionary conserved miRNAs: miR-100, let-7 and miR-125. The let-7-C rescuing transgene includes a 17983 base-pair genomic fragment containing the let-7-C locus. The ΔmiR-100, Δlet-7, and ΔmiR-125 are derivatives of the let-7-C transgenes that lack the mature miR-100, let-7, and miR-125 sequences, respectively. The let-7-C hypomorph (let-7-Chyp) encodes the let-7-Complex cDNA driven by a 3.3 kb promoter fragment in a transheterozygous let-7-C null mutant background (let-7-CKO2/let-7-CGKI). The let-7-Chyp/Rescue line encodes a single copy of the let-7-Chyp and a single copy of the let-7-C wild-type transgene. The let-7-Chyp/Δlet-7-C line encodes a single copy of the let-7-Chyp and a single copy of the ~18 kb let-7-C that lacks the mature miR-100, let-7 and miR-125 sequences. The let-7-Cnull rescue line encodes a single copy of the ~18 kb let-7-C transgene in a let-7-C null mutant. (B-D) Quantitative RT-PCR of miR-100 (B), let-7 (C) and miR-125 (D) in wild-type (w1118) flies that were fed Ad libitum (AL) (pink pattern and pink solid bar) or DR diet (blue pattern and blue solid bar) for 7 days or 20 days. The levels of miR-100, let-7 and miR-125 increase upon 20d exposure to DR, while a significant increase in miR-125 is detected upon 7d of DR. Expression levels were normalized to SnoR442. Values are mean ± SD, n = 6. (E-G) Let-7-C hyp/Δlet-7-C flies express significantly reduced levels of miR-100, let-7, and miR-125 as compared to Let-7-C hyp rescue flies that were fed AL or DR diets for 7 days. For expression analysis of the rescue and mutant lines that were fed AL or DR diet for 20 days, please refer to Figure 1—figure supplement 2B-D. (H) The let-7-Chyp/Rescue flies show a significant increase in lifespan upon dietary restriction ( blue line; n = 97) as compared to let-7-Chyp/Rescue flies that were fed an ‘ad libitum’ diet ( red line; n = 95). (I) The let-7-Chyp mutants (AL, red line; n = 111 and DR, blue line; n = 72) display a reduced DR-dependent increase in lifespan compared to the rescue line. (J-M) Compared to the let-7-Cnull rescue flies (J) and ΔmiR-100 (K) flies, Δlet-7 (L) and ΔmiR-125 (M) flies displayed a significantly dampened DR-dependent lifespan extension upon DR (blue line) when compared to flies that were fed an AL diet (red line). For statistical comparison of survival curves, p values and Χ2 values were calculated with log rank test. Genotypes of strains used in this figure (B-D) w1118; (E-G, H) let-7-Cnull; let-7-Chyp/Rescue: w1118; let-7-CGKI/let-7-CKO2, P{neoFRT}40A; P{w+, let-7-Cp3.3kb::cDNA} / {v+, let-7-C}attP2; (E-G, I) let-7-Chyp//Δlet-7-C: w1118; let-7-CGKI/let-7-CKO2, P{neoFRT}40A; P{w+, let-7-Cp3.3kb::cDNA} / {v+, let-7-C Δlet-7-C miRNAs}attP2; (J) let-7-Cnull; Rescue/+: w1118; let-7-CGKI/let-7-CKO2, P{neoFRT}40A; {v+, let-7-C} attP2 /+; (K) let-7-Cnull; ΔmiR-100/+: w1118; let-7-CGKI/let-7-CKO2, P{neoFRT}40A; {v+, let-7-C ΔmiR-100} attP2 / +; (L) let-7-Cnull; Δlet-7: w1118; let-7-CGKI/let-7-CKO2, P{neoFRT}40A; {v+, let-7-C Δlet-7} attP2 / +; (M) let-7-Cnull; ΔmiR-125: w1118; let-7-CGKI/let-7-CKO2, P{neoFRT}40A; {v+, let-7-C ΔmiR-125} attP2 / +.
-
Figure 1—source data 1
Lifespan analysis of let-7-Complexhyp, let-7-Complexhyp rescue, let-7-Complexnull rescue, ΔmiR-100, Δlet-7, and ΔmiR-125 mutant lines.
- https://cdn.elifesciences.org/articles/62621/elife-62621-fig1-data1-v2.docx
-
Figure 1—source data 2
Survival proportions for strains used in Figure 1.
- https://cdn.elifesciences.org/articles/62621/elife-62621-fig1-data2-v2.xlsx
Figure 1—figure supplement 1
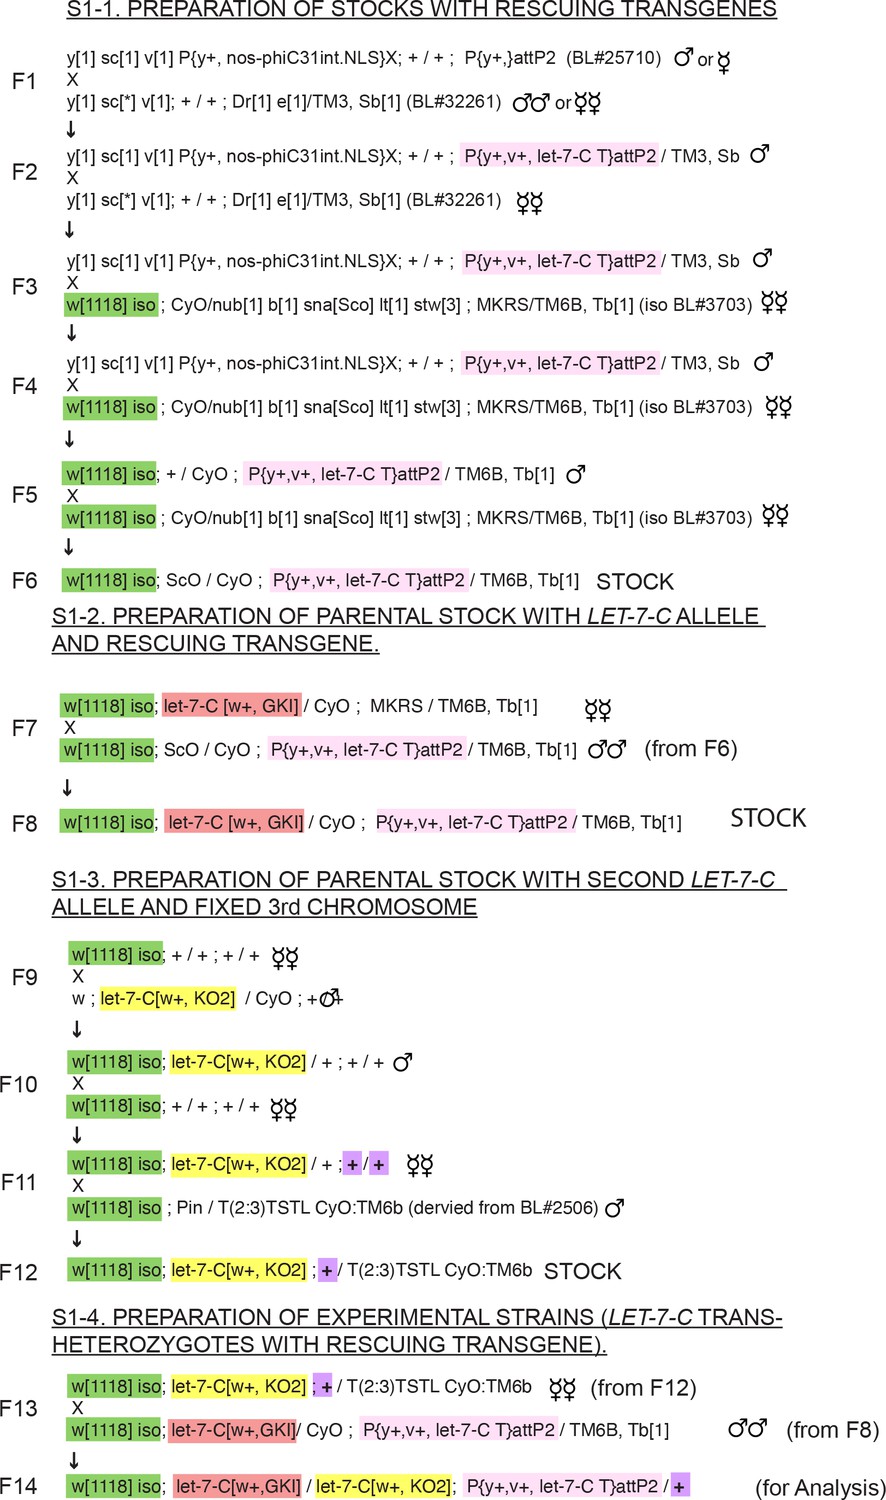
Scheme for generation of experimental strains used in Figures 1 and 2.
This analysis compared flies that were generated using a scheme that ensured that they had identical genetic backgrounds. Flies that were analyzed (F14) were trans-heterozygous for two different let-7-C null alleles (dark pink and yellow), ensuring that phenotypes were not due to recessive mutations on either let-7-C mutant chromosome. In addition, third chromosomes that contained differing rescuing transgenes (light pink) were derived in parallel from the same population of flies. Finally, all flies had a common X-chromosome (green), derived from an isogenized stock. (S1-1) All rescuing transgenes, including the wildtype rescuing transgene as well as let-7 and miR-125 deleted versions, were injected into embryos from the same population of BL#25710. Resulting progeny were backcrossed twice to BL#32261 in order to select and balance vermillion+ transformants (F1 and F2). Single transformants were subsequently backcrossed to an isogenized version of BL#3703 three times (F3-F5) in order to make balanced stocks with isogenized X chromosomes (F6). (S1-2) Stocks with differing rescuing transgenes were crossed to the same population of a stock that contained the let-7-CKO2 chromosome, an isogenized X chromosome, and two 3rd chromosome balancers. The let-7-CKO2 stock used in F7 was generated in a similar fashion as the rescuing transgenes stocks, by backcrossing three times to an isogenized version of BL#3703. Resulting stocks (F8) had common X (green), 2nd (yellow) and 3rd (light pink) chromosomes and were used in F13 to generate the experimental strains. (S1-3) A second let-7-C allele, let-7-CGKI, was prepared by outcrossing twice to an isogenized stock, and then crossed to an isogenized stock containing a T (2:3) Cyo-TM6b compound chromosome. The let-7-C allele was selected based on mini-white, and the T (2:3) Cyo-TM6b balancer was selected based on the dominant Humoral marker. The resulting stock with a fixed second and third chromosome was amplified and used as the source for all virgins in the crosses that yielded the flies for analysis. (S1-4). Flies for analysis were generated by crossing virgins of the stock generated in F12 with males of stocks generated in F8 that harbored differing rescuing transgenes. For generation of the let-7-Chyp rescue and mutant line the let-7-Chyp transgenic was combined with let-7-CKO2 stock in the step S1-3. The remaining steps were similar to the scheme described.
Figure 1—figure supplement 2
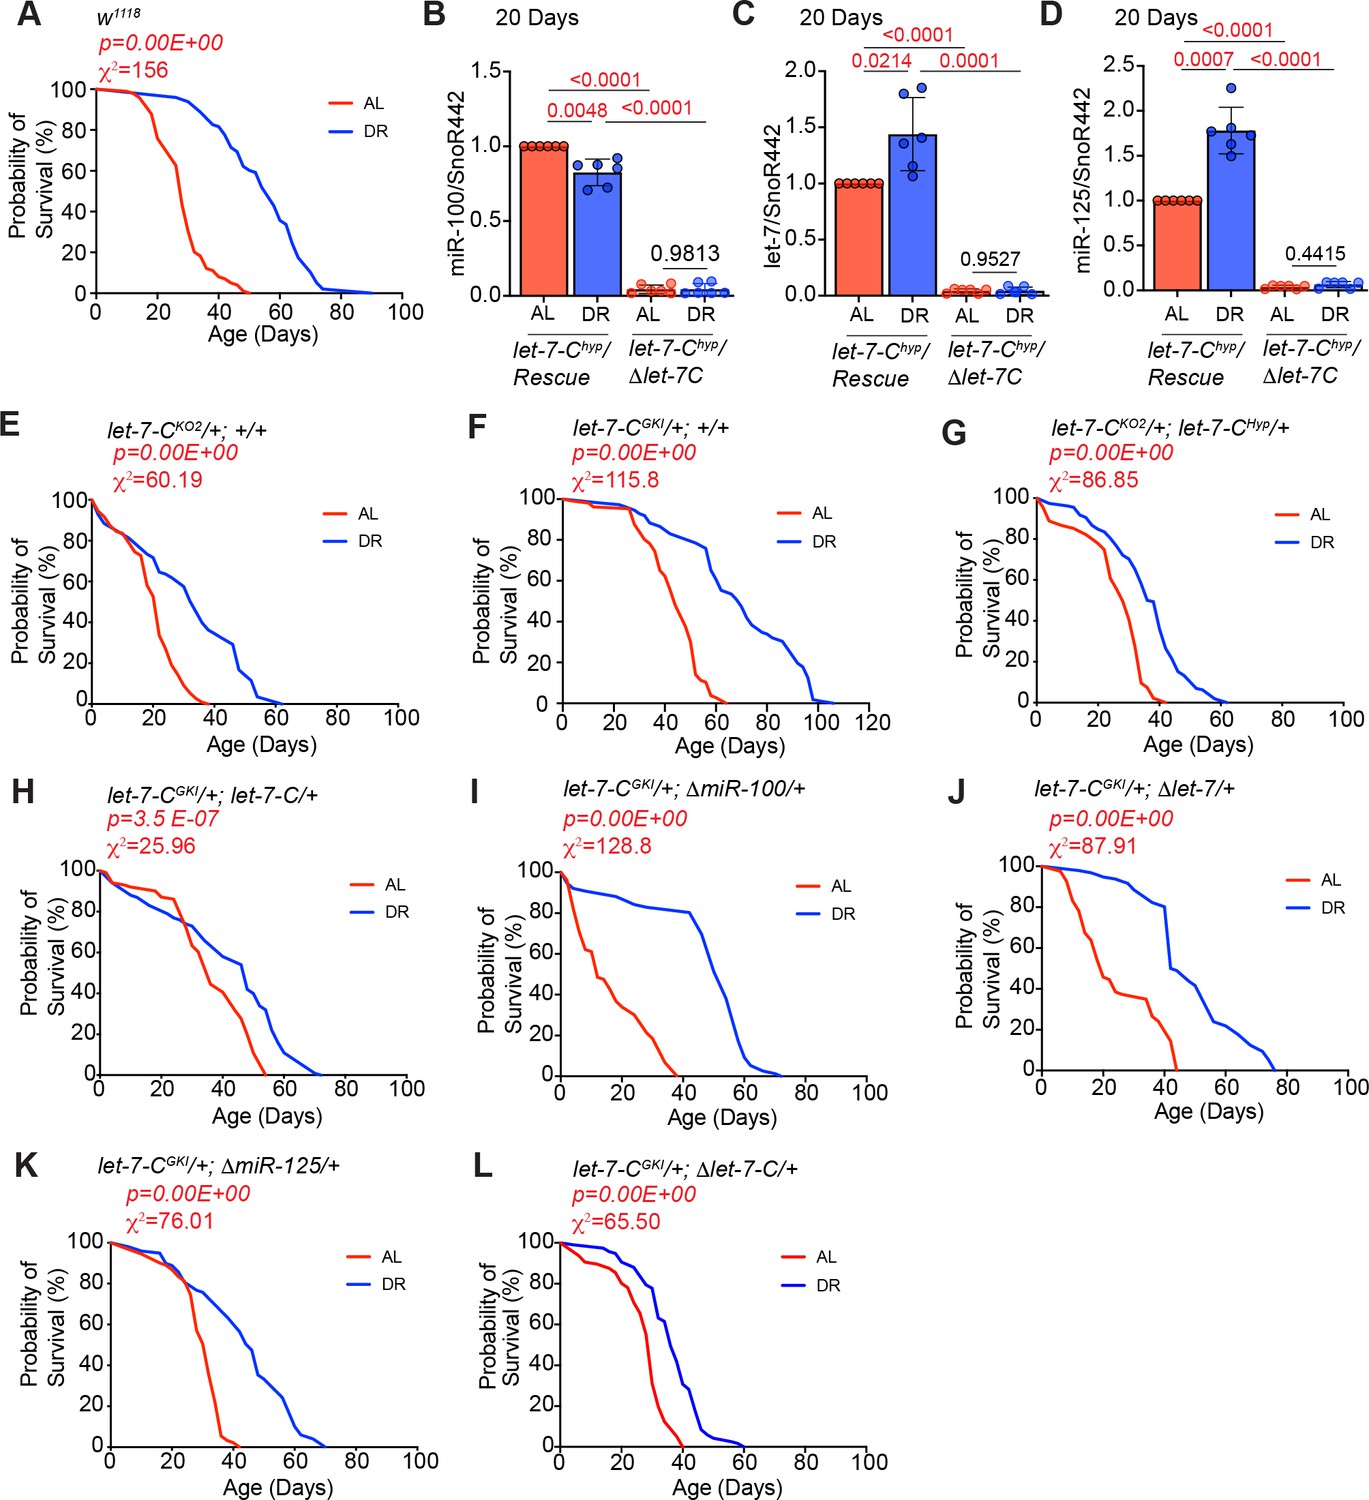
Lifespan analysis controls and expression analysis of strains used in Figure 1.
(A) w1118 flies show a significant increase in lifespan upon DR (blue line; n = 98; median lifespan = 58) as compared to w1118 flies that were fed an ‘ad libitum’ diet (red line; n = 99; median lifespan = 28). (B–D) Quantitative RT-PCR of miR-100 (B), let-7 (C) and miR-125 (D) in let-7-C hyp/Δlet-7-C and let-7-Chyp/Rescue flies that were fed AL or DR diet for 20 days. Let-7-C hyp/Δlet-7-C flies express dramatically reduced levels of miR-100, let-7, and miR-125 as compared to Let-7-C hyp rescue flies that are fed AL or DR diets for 7 days. Expression levels were normalized to SnoR442. Values are mean ± SD, n = 6. (E–M) Lifespan analysis to examine the effect of genetic background of strains used in Figure 1. Crosses were established between w1118 flies, and the background strains and the progeny were sorted into two groups (AL and DR). (E) Let-7-CKO2/+; +/+ flies live significantly longer on DR diet (AL, red line, n = 110, median lifespan = 22; DR, blue line, n = 113, median lifespan = 34). (F) Let-7-CGKI/+; +/+ flies live significantly longer on DR diet (AL, red line, n = 106, median lifespan = 44; DR, blue line, n = 112, median lifespan = 70). (G) Let-7-CKO2/+; let-7-Chyp/+ flies live significantly longer on DR diet (AL, red line, n = 139, median lifespan = 28; DR, blue line, n = 160, median lifespan = 40). (H) Let-7-CGKI/+; let-7-C/+ flies live significantly longer on DR diet (AL, red line, n = 102, median lifespan = 36; DR, blue line, n = 100, median lifespan = 48). (I) Let-7-CGKI/+; ΔmiR-100/+ flies live significantly longer on DR diet (AL, red line, n = 103, median lifespan = 12; DR, blue line, n = 79, median lifespan = 50). (J) Let-7-CGKI/+; Δlet-7/+ flies live significantly longer on DR diet (AL, red line, n = 83, median lifespan = 20; DR, blue line, n = 96, median lifespan = 43). (K) Let-7-CGKI/+; ΔmiR-125/+ flies live significantly longer on DR diet (AL, red line, n = 91, median lifespan = 32; DR, blue line, n = 100, median lifespan = 46). (M) Let-7-CGKI/+; Δlet-7-C/+ flies live significantly longer on DR diet (AL, red line, n = 96, median lifespan = 30; DR, blue line, n = 117, median lifespan = 36). For statistical comparison of survival curves, p values and Χ2 values were calculated with log rank test. Genotypes of strains used in this figure (A) w1118; (B-D) Let-7-Cnull; let-7-Chyp/Rescue: w1118; let-7-CGKI/let-7-CKO2, P{neoFRT}40A; P{w+, let-7-Cp3.3kb::cDNA} / {v+, let-7-C}attP2; (B-D) Let-7-Chyp//Δlet-7-C: w1118; let-7-CGKI/let-7-CKO2, P{neoFRT}40A; P{w+, let-7-Cp3.3kb::cDNA} / {v+, let-7-C Δlet-7-C miRNAs}attP2; (E) Let-7-CKO2/+; +/+: w1118; let-7-CKO2, P{neoFRT}40A/+; +/+; (F) let-7-CKO2/+; +/+: w1118; let-7-CGKI/+; +/+; (G) Let-7-CKO2/+; let-7-Chyp/+: w1118; let-7-CKO2, P{neoFRT}40A/+; P{w+, let-7-Cp3.3kb::cDNA}/+; (H) let-7-CGKI/+; let-7-C/+: w1118; let-7-CGKI/+; {v+, let-7-C}attP2/+; (I) let-7-CGKI/+; ΔmiR-100/+: w1118; let-7-CGKI/+; {v+, let-7-C ΔmiR-100} attP2 /+; (J) Let-7-CGKI/+; Δlet-7/+: w1118; let-7-CGKI/+;{v+, let-7-C Δlet-7} attP2 /+; (K) Let-7-CGKI/+; ΔmiR-125/+: w1118; let-7-CGKI/+; {v+, let-7-C ΔmiR-125} attP2 / +; (L) let-7-CGKI/+; Δlet-7-C/+: w1118; let-7-CGKI/+;{v+, let-7-C Δlet-7-C} attP2 /+.
-
Figure 1—figure supplement 2—source data 1
Lifespan analysis of let-7-Complexhyp, let-7-Complexhyp rescue, let-7-Complexnull rescue, ΔmiR-100, Δlet-7, and ΔmiR-125 mutant lines.
- https://cdn.elifesciences.org/articles/62621/elife-62621-fig1-figsupp2-data1-v2.docx
-
Figure 1—figure supplement 2—source data 2
Survival proportions for strains used in Figure 1.
- https://cdn.elifesciences.org/articles/62621/elife-62621-fig1-figsupp2-data2-v2.xlsx
Figure 2 with 1 supplement

Reducing chinmo (ΔmiR-125, chinmoRNAi and ΔmiR-125, chinmo1) levels in miR-125 mutants suppresses the loss of DR-mediated increase in lifespan extension and decrease in triglyceride levels.
(A) Schematic representing post-transcriptional repression of chinmo mRNA by let-7 and miR-125 adapted from our previously published study (Chawla et al., 2016). chinmo mRNA 3’untranslated region (3’UTR) encodes multiple binding sites for let-7 and miR-125 miRNAs and is differentially regulated by let-7 and miR-125. Let-7 is the predominant repressor of chinmo during development and miR-125 silences chinmo in the adult stage. (B) Loss of miR-125 leads to derepression of chinmo in the adult brain and a concomitant increase in Chinmo signal in the adult fat tissue (Compare top two left panels with top two right panels). Confocal images of dissected tissues (brain and fat body) from adult let-7-C null rescue and miR-125 mutant flies that were fed ad libitum (AL) or nutrient restricted (DR) diet for 5 days. (C, D) Rescue, UAS chinmoRNAi flies and ΔmiR-125, UAS chinmoRNAi flies show a 25% increase in median lifespan upon DR ( blue line) (Rescue, UAS chinmoRNAi, χ2 = 37.35; ΔmiR-125, UAS chinmoRNAi, χ2 = 57.71). (E-F) Rescue, chinmo1 flies display a 20% increase in median lifespan upon DR (blue line) and ΔmiR-125, chinmo1 flies display a 41% increase in DR-dependent increase in median lifespan (compare red and blue curves) (Rescue, chinmo1 χ2 = 29.63; ΔmiR-125, chinmo1 χ2 = 102.5). For statistical comparison of survival curves, p values and χ2 were calculated with log rank test. (G) Quantitation of triglyceride (TAG) stored levels in Rescue line, ΔmiR-125 line, Rescue, UAS chinmoRNAi line, ΔmiR-125, UAS chinmoRNAi line, Rescue, chinmo1 line and ΔmiR-125, chinmo1 line, AL (Red bars) and DR (Blue bars) fed 20-day-old flies. The bars represent mean ± SD, n = 6, p value was calculated with unpaired t-test with Welch’s correction. p Values are indicated in the graph. The TAG values were normalized to protein levels. The ΔmiR-125 flies display significantly lower stored triglycerides compared to the genetically identical rescue line in both AL and DR diets. Reducing chinmo levels by RNAi or by reducing a copy of chinmo led to an increase in TAG levels upon DR. Consistent with the survival analysis, the increase in TAG levels in ΔmiR-125, chinmo1 flies TAG was similar to the increase in rescue flies (p value=0.6343), indicating that reducing a copy of chinmo was sufficient to rescue the TAG levels and the rescue was better than what was obtained with knockdown of chinmo by RNAi in cells that express miR-125. (H, I) Fat bodies/abdomens of female flies were dissected and stained for the content and diameter of lipid droplet (LD) (red are lipid droplets stained with Nile red and blue is Dapi). Scale bar, 25 μm. (I) Quantitation of lipid droplet (LD) diameter in (H). Quantitation of 15 largest LDs in five samples per condition. Error bars represent mean ± SD and p values are indicated in the figure. The reduction in lipid droplet size in ΔmiR-125 mutants that are fed an AL and DR diet is rescued by reducing the dosage of chinmo in ΔmiR-125, chinmo1 and not by chinmoRNAi. Genotypes of strains used in this figure: (B, G-I) let-7-Cnull; Rescue/+: w1118; let-7-CGKI/let-7-CKO2, P{neoFRT}40A; {v+, let-7-C} attP2 /+; (B, G-I) let-7-Cnull; ΔmiR-125: w1118; let-7-CGKI/let-7-CKO2, P{neoFRT}40A; {v+, let-7-C ΔmiR-125} attP2 / +; (C, G-I) let-CGKI/KO2; Rescue, chinmoRNAi: w1118; let-7-CGKI/let-7-CKO2, P{neoFRT}40A; {v+, let-7-C} attP2/P{w+, UAS-chinmoRNAi 148}VK00033; (D, G-I) let-CGKI/KO2; ΔmiR-125, chinmoRNAi: w1118; let-7-CGKI/let-7-CKO2, P{neoFRT}40A; {v+, let-7-C ΔmiR-125} attP2/P{w+, UAS-chinmoRNAi 148}VK00033; (E, G-I) let-7-CGKI/chinmo1let-7-CKO2; Rescue/+: w1118; let-7-CGKI/chinmo1, let-7-CKO2, P{neoFRT}40A; {v+, let-7-C} attP2 /+; (F, G-I) let-7-CGKI/chinmo1,let-7-CKO2; ΔmiR-125/+: w1118; let-7-CGKI/chinmo1, let-7-CKO2, P{neoFRT}40A; {v+, let-7-C ΔmiR-125} attP2 / +.
-
Figure 2—source data 1
Lifespan analysis of rescue, chinmoRNAi and ΔmiR-125, chinmoRNAi strains.
- https://cdn.elifesciences.org/articles/62621/elife-62621-fig2-data1-v2.docx
-
Figure 2—source data 2
Lifespan analysis of rescue, chinmo1 and ΔmiR-125, chinmo1 strains.
- https://cdn.elifesciences.org/articles/62621/elife-62621-fig2-data2-v2.docx
-
Figure 2—source data 3
Survival proportions for strains used in Figure 2.
- https://cdn.elifesciences.org/articles/62621/elife-62621-fig2-data3-v2.xlsx
Figure 2—figure supplement 1
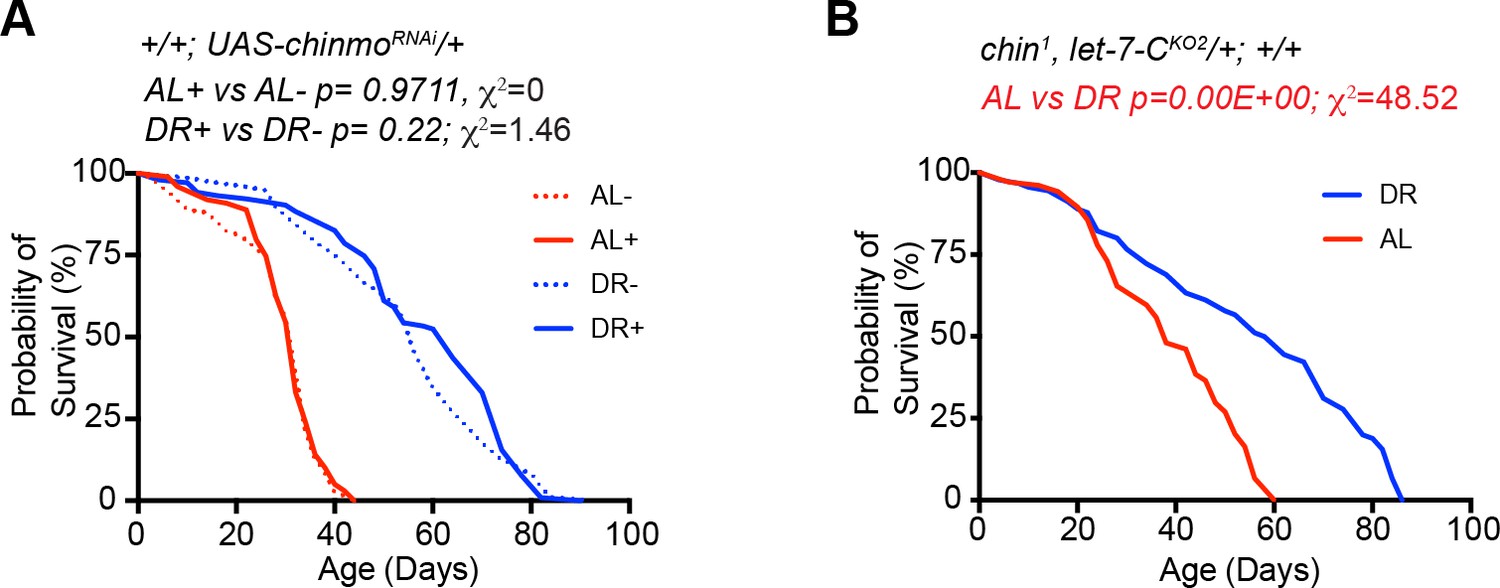
Effect of genetic background and/or RU-486 in UAS chinmoRNAi/+ and chinmo1/+ strains used for analysis in Figure 2.
(A) UAS chinmoRNAi/+ flies show a significant increase in lifespan upon DR (DR+, blue dotted line; n = 103; median lifespan = 64 d; DR-, blue solid line; n = 96; median lifespan = 56 d) as compared to UAS chinmoRNAi/+ flies that were fed an ‘ad libitum’ diet (AL+, red dotted line; n = 99; median lifespan = 32 d; AL-, red solid line; n = 108; median lifespan = 32 d). RU-486 does not significantly change the lifespan of UAS chinmoRNAi/+ flies in AL or DR (p values and , χ2 values are indicated in the figure panel). (B) chinmo1, let-7-CKO2/+ flies show a significant increase in lifespan upon DR (DR, blue line; n = 90; median lifespan = 58) as compared to chinmo1, let-7-CKO2/+ flies that were fed and AL diet (red line; n = 104; median lifespan = 38 d). For statistical comparison of survival curves, p values and χ2 were calculated with log rank test. Genotypes of strains used in this figure: (A) UAS chinmoRNAi/+: w1118; +/+; P {w+, UAS-chinmoRNAi 148} VK00033/+; (B) chinmo1, let-7-CKO2/+: w1118; chinmo1, let-7-CKO2, P{neoFRT}40A/+; +/+.
-
Figure 2—figure supplement 1—source data 1
Lifespan analysis of flies encoding a single copy of the UAS chinmoRNAi transgene and a strain that is heterozygous for let-7-C and chinmo.
- https://cdn.elifesciences.org/articles/62621/elife-62621-fig2-figsupp1-data1-v2.docx
-
Figure 2—figure supplement 1—source data 2
Survival proportions for strains used in Figure 2—figure supplement 1.
- https://cdn.elifesciences.org/articles/62621/elife-62621-fig2-figsupp1-data2-v2.xlsx
Figure 3 with 1 supplement
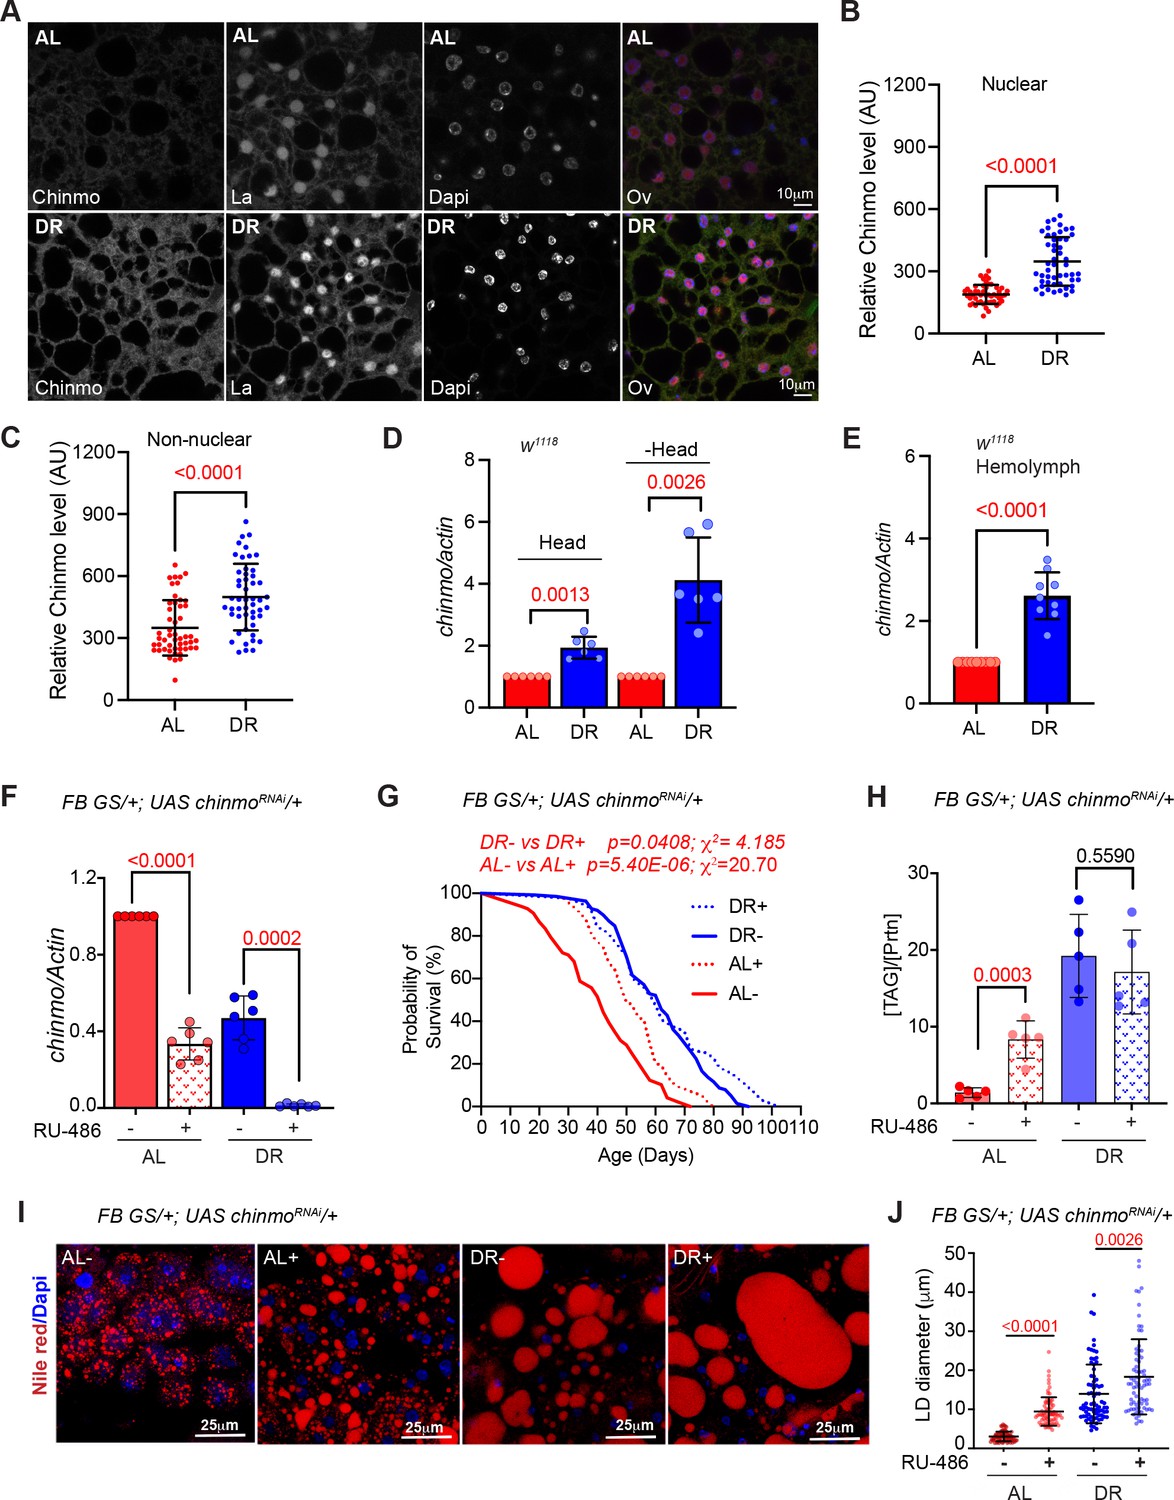
Chinmo is nutrient-dependent downstream effector of the DR-pathway.
(A) Chinmo protein levels increase in adult fat tissue of w1118 flies that were fed a DR diet for 10 days. Confocal images of dissected fat body from adult w1118 flies that were fed an AL or DR diet for 10 days. Immunostaining was performed with anti-Chinmo, anti-La (nuclear protein), and Dapi. Scale bar, 10 μm. (B, C) Quantitation of Chinmo protein levels in adult fat tissue nuclear and peripheral (non-nuclear) regions as determined by measuring pixel intensity in 10 cells in five samples per condition. Error bars represent mean ± SD and p values were calculated by unpaired t test with Welch’s correction. (D) DR induces expression of chinmo in w1118 flies. RT-PCR quantitation of chinmo mRNA in head and decapitated body tissue (-Head) of w1118 flies that were fed an AL or DR diet for 10 days. (E) DR increases circulating levels of chinmo mRNA in w1118 flies. RT-PCR quantitation of chinmo mRNA in the hemolymph of w1118 flies that were fed an AL or DR diet for 10 days. (F-J) Reducing chinmo levels in the adult fat body increases lifespan and enhances TAG levels under AL conditions. (F) A transgene expressing a short hairpin to knockdown chinmo was expressed in the adult fat body using the steroid (RU-486) inducible gene switch Gal4 driver. Quantitative RT-PCR of chinmo from abdominal fat tissue of FB GS >UAS chinmoRNAi flies in presence of RU-486 (bars with red and blue pattern) or in absence of RU-486 (bars with solid red and blue color) in flies that were fed Ad libitum (AL) (red) or DR diet (blue) for 10 days. Expression levels were normalized to Actin. Values are mean ± SD, n = 6. p Values are indicated in the graph and were calculated by unpaired t test with Welch’s correction. (G) Knockdown of chinmo in the adult fat tissue resulted in a 16% increase in the median lifespan of flies that were fed an AL diet (compare red solid line with the red dotted line) (Figure 3—source data 1A–B has details of experimental repeat). For statistical comparison of survival curves, p values and χ2 were calculated with log rank test. (H) Quantitation of triglyceride (TAG) stored levels in AL-RU-486 (Solid red bars), AL + RU-486 (Red pattern bars), DR-RU-486 (Solid blue bars) and DR +RU-486 (Blue pattern bars) fed 20-day-old FB GS >UAS chinmoRNAi flies. The bars represent mean ± SD, n = 5, p value was calculated with two tailed t-test. Significance levels: ***p<0.001. (I) Fat bodies of FB GS >UAS chinmoRNAi female flies were dissected and stained for the content and diameter of lipid droplet (LD) (red are lipid droplets stained with Nile red and blue is Dapi). Scale bar, 25 μm. (J) Quantitation of lipid droplet (LD) diameter in (I). Quantitation of 15 largest LDs in five samples per condition. Error bars represent mean ± SD and p values are indicated in the graph and were calculated by using unpaired t test with Welch’s correction. Genotypes of strains used in this figure: (A-E) w1118; (F-J) FB GS/+; UAS chinmoRNAi/+; w1118; P{w[+mW.hs]=Switch1}106/+; P{w+, UAS-chinmoRNAi 148}VK00033/+.
-
Figure 3—source data 1
Lifespan analysis of FBGS >UAS chinmoRNAi strain.
- https://cdn.elifesciences.org/articles/62621/elife-62621-fig3-data1-v2.docx
-
Figure 3—source data 2
Survival proportions of lifespan curves of FBGS >UAS chinmoRNAi strain.
- https://cdn.elifesciences.org/articles/62621/elife-62621-fig3-data2-v2.xlsx
Figure 3—figure supplement 1
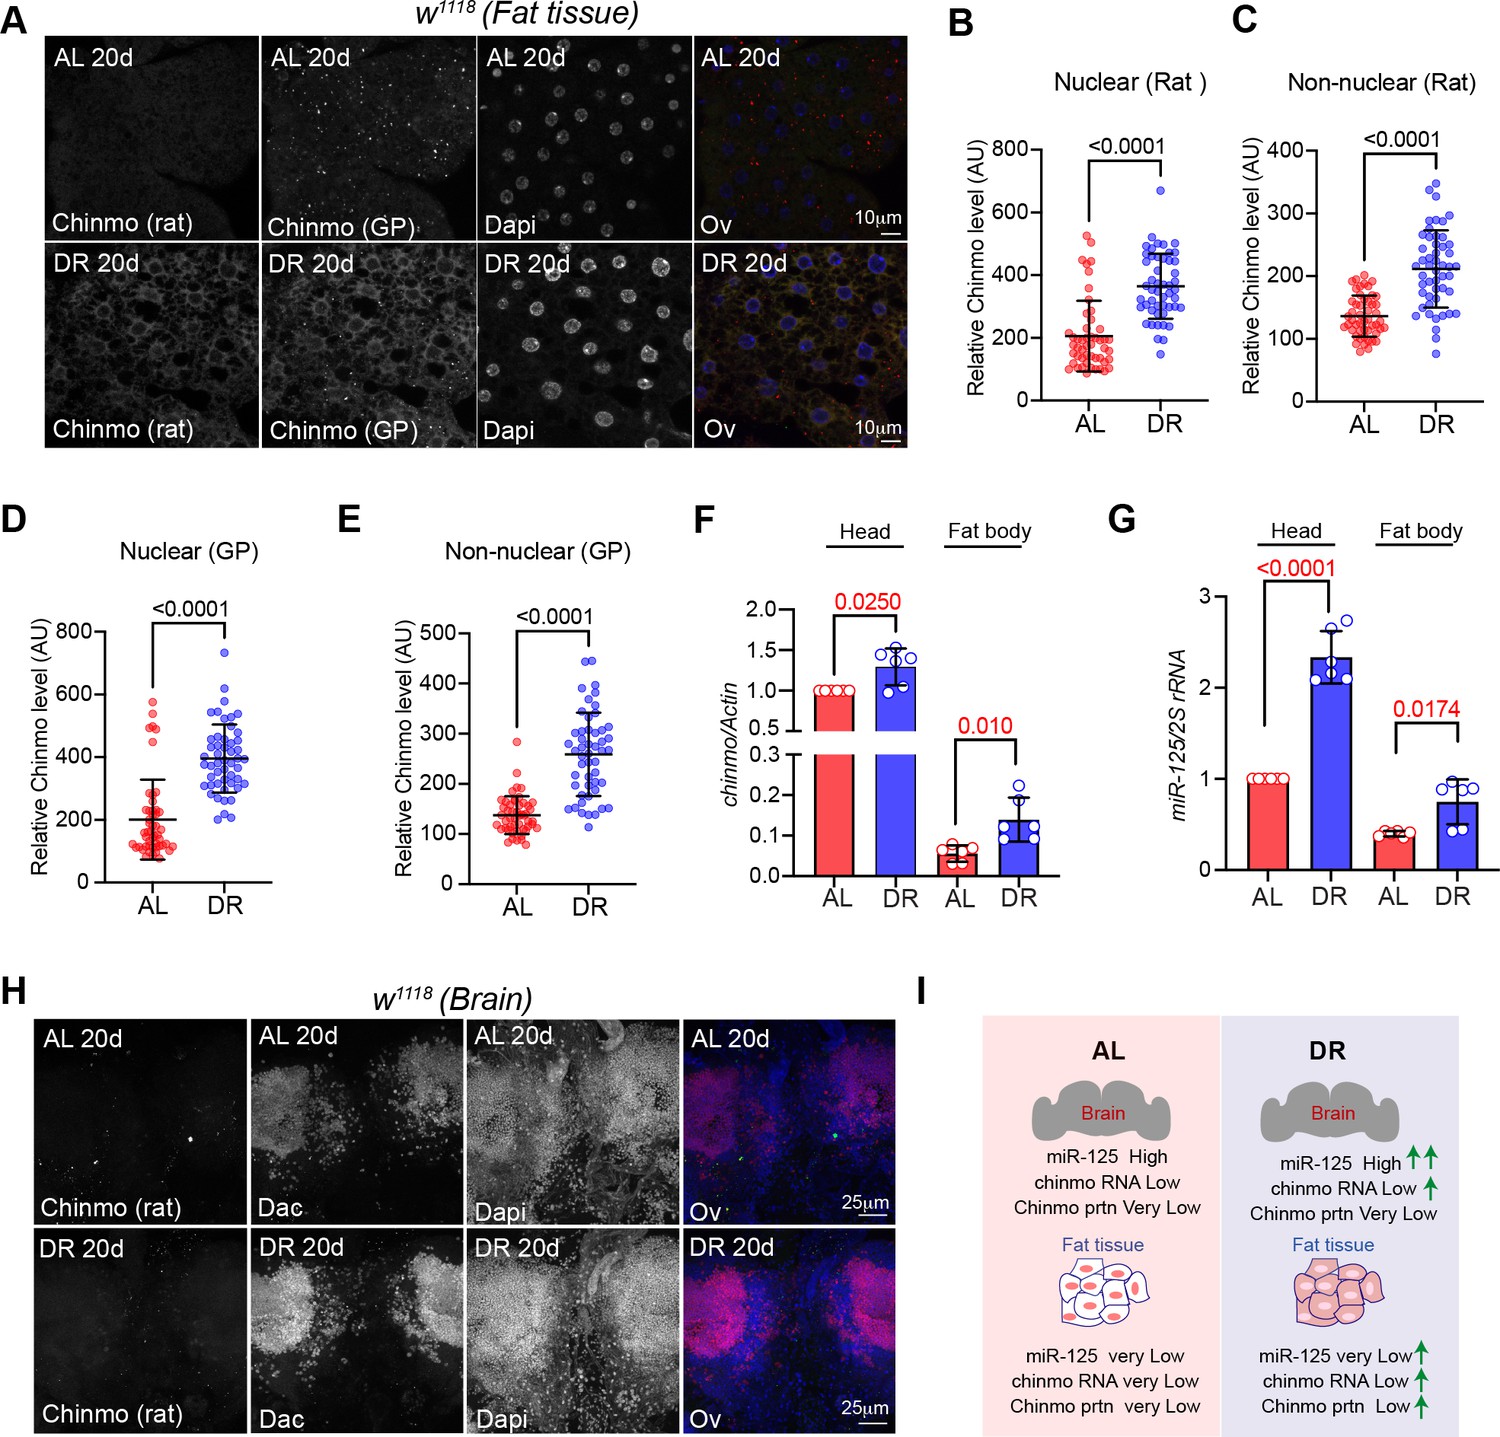
Nutrient-dependent regulation of Chinmo in the adult fat tissue.
(A) Chinmo protein levels increase in adult fat tissue of w1118 flies that were fed a DR diet for 20 days. Confocal images of dissected fat body from adult w1118 flies that were fed an AL or DR diet for 20 days. Immunostaining was performed with Rat anti-Chinmo, Guinea pig anti-Chinmo, and Dapi. Scale bar, 10 μm. (B, C) Quantitation of Chinmo protein levels detected by the rat anti-Chinmo antibody in adult fat tissue nuclear and peripheral (non-nuclear) regions as determined by measuring pixel intensity in 10 cells in five samples per condition. Error bars represent mean ± SD and p values were calculated by unpaired t test with Welch’s correction. (D, E) Quantitation of Chinmo protein levels detected by the Guinea pig anti-Chinmo antibody in adult fat tissue nuclear and peripheral (non-nuclear) regions as determined by measuring pixel intensity in 10 cells in five samples per condition. Error bars represent mean ± SD and p values were calculated by unpaired t test with Welch’s correction. (F) DR induces expression of chinmo more significantly in adult fat tissue compared to adult head tissue. RT-PCR quantitation of chinmo mRNA in head and dissected fat tissue of w1118 flies that were fed an AL or DR diet for 20 days. (G) In contrast, DR induces miR-125 levels more significantly in adult head tissue as compared to fat tissue. (H) Chinmo protein is not detectable in w1118 adult brains due to post-transcriptional silencing by miR-125. Confocal images of dissected brain from adult w1118 flies that were fed an AL or DR diet for 20 days. Immunostaining was performed with Rat anti-Chinmo, mouse anti-Dacshund and Dapi. Scale bar, 25 μm. (I) Schematic showing the differential tissue-specific regulation of chinmo in adult brain and fat tissue. miR-125 silences chinmo in the adult brain. DR induces miR-125 and chinmo levels in the adult brain and consequentially, chinmo continues to be post-transcriptionally repressed in this tissue under DR conditions. In the fat tissue, DR leads to an increase in chinmo mRNA and protein levels. Genotype of strain used in this figure: (A-H) w1118.
Figure 4 with 2 supplements
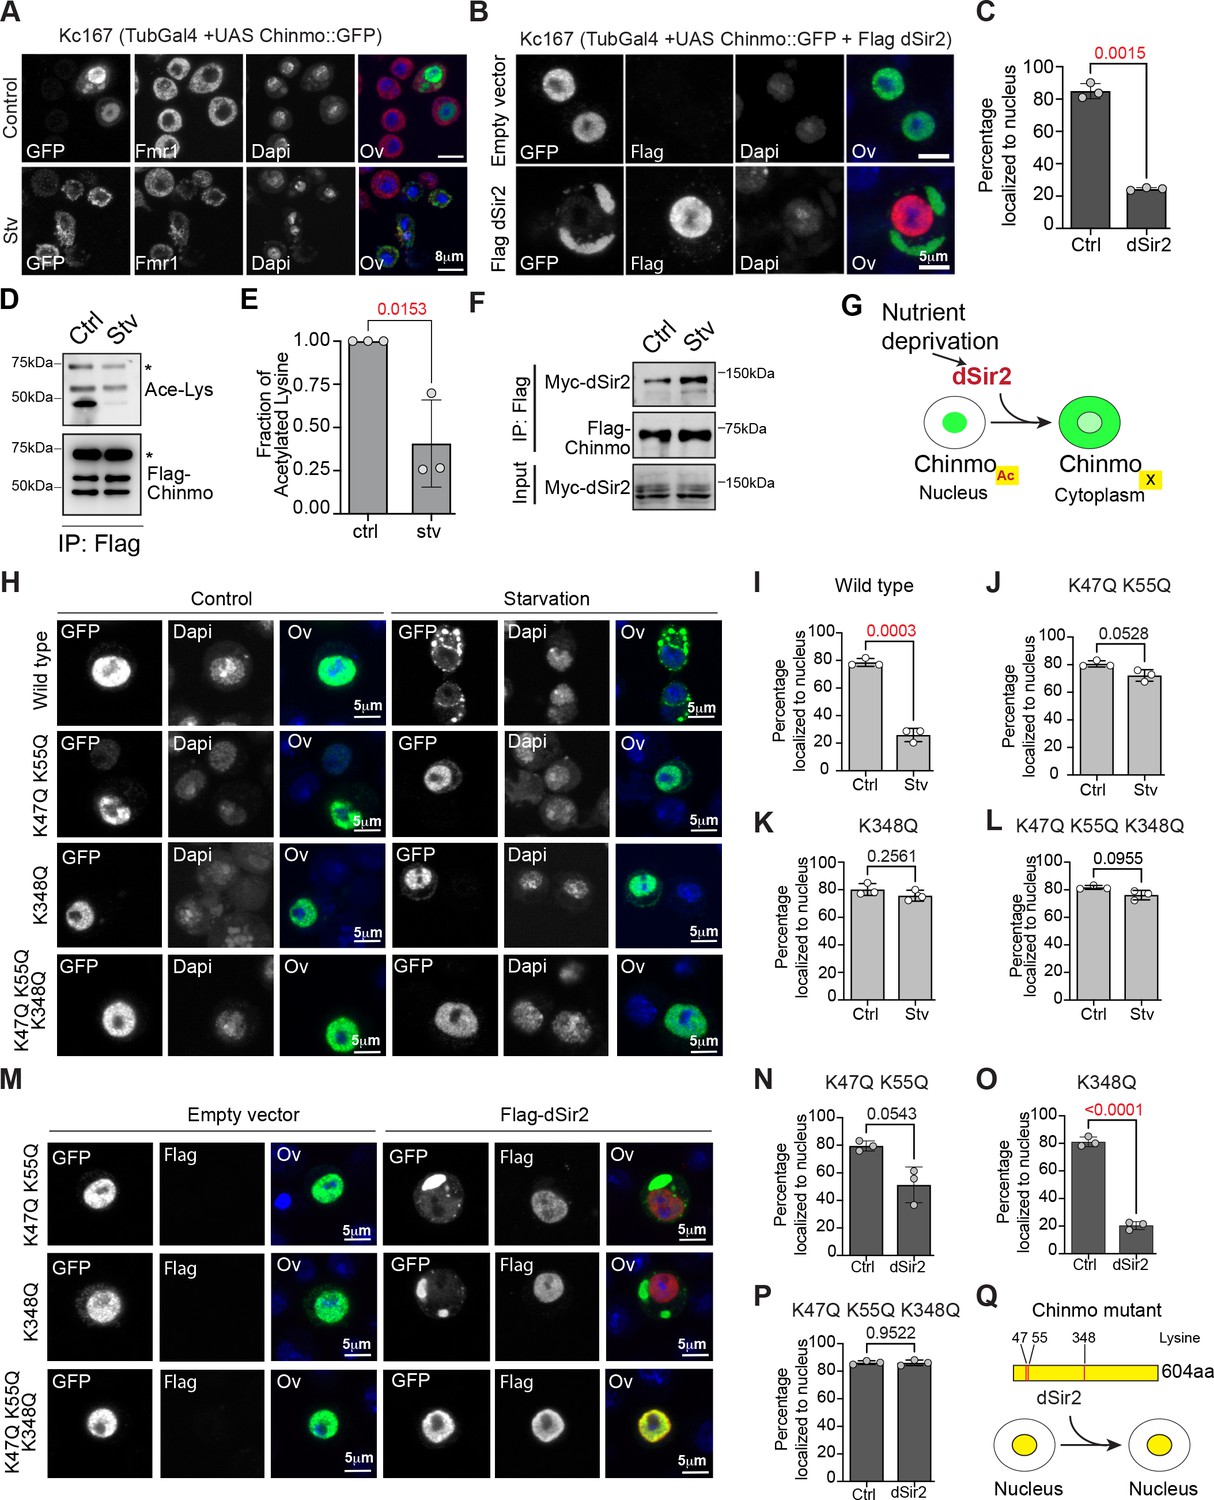
Export of Chinmo from the nucleus is dependent on deacetylation of Chinmo by dSir2.
(A) Chinmo redistributes to the cytoplasm upon cell starvation. Kc167 cells were transfected with Tubulin Gal4 and UAS-GFP::Chinmo constructs and redistribution of Chinmo in fed (upper panel) and starved (lower panel) cells was examined by immunostaining with GFP antibody (Chinmo), Fmr1 (cytoplasmic marker) and Dapi (blue). Chinmo is predominantly localized to the nucleus in the fed state and redistributes to the cytoplasm in starved Kc167 cells. (B, C) Localization of GFP::Chinmo in cells overexpressing Flag dSir2 under fed/control (Ctrl) conditions. Kc167 cells were transfected with Tubulin Gal4 and UAS-Chinmo:: GFP and dSir2 pAFW constructs and redistribution of Chinmo was examined by immunostaining cells with GFP (Chinmo), Flag (dSir2), and Dapi. Overexpression of dSir2 led to redistribution of Chinmo to the cytoplasm under fed conditions. (C) Bar graph showing quantitation of the percentage of cells in which Chinmo::GFP was localized to the nucleus in cells transfected with either empty vector or dSir2 expressing plasmid. A total of 100 cells were quantitated in a minimum of three independent experiments. (D, E) Acetylation of Flag-Chinmo in fed (Ctrl) and Starvation (Stv) conditions. Acetylation of Flag-Chinmo was detected by immunoprecipitation with a Flag antibody followed by western blot analysis with an anti-acetyl-lysine antibody. Three bands of Chinmo were detected in the Flag immunoprecipitates reproducibly with the top-most band corresponding to the expected size of the full-length protein. (E) Bar graph showing the fraction of acetylated lysine in full-length Flag-Chinmo (indicated by * in panel D) under Ctrl and Stv conditions, determined by three independent immunoprecipitation experiments. (F) Co-immunoprecipitation of Myc-dSir2 with Flag-Chinmo under control and starvation conditions. Flag antibody was used for immunoprecipitation of Flag-Chinmo followed by western blot analysis with Myc antibody to detect dSir2 in the immunoprecipitates. (G) Schematic representing the nutrient-dependent Chinmo relocalization by dSir2. (H-L) K47, K55, and K348 are the main acetylation sites of Chinmo. The GPS-PAIL online prediction tool was used to identify potential Lysine residues in Chinmo that were acetylated. For table with all predicted acetylation Lysine residues please refer to Figure 4—figure supplement 1A. Kc167 cells were transfected with Tubulin Gal4 and GFP-tagged Chinmo wild type or each of the mutants in which the lysine (K) residues were mutated to Glutamine (Q) and the nuclear-cytoplasmic distribution of the tagged Chinmo proteins was examined under fed and starvation conditions by immunostaining with GFP(Chinmo) and Dapi. Scale bars represent 5 µm. (H-I) Majority of the wild-type GFP: : Chinmo protein redistributes to the cytoplasm upon starvation. (H, J-L) K47Q, K55Q double mutant, K348Q single mutant and K47Q, K55Q, K348Q triple mutant predominantly localize to the nucleus even upon starvation. (M-P) The K47Q, K55Q double mutant and K348Q single mutant show significant redistribution of Chinmo in the cytoplasm upon overexpression of dSir2. However, combining the three mutations in K47Q, K55Q, K348Q triple mutant abrogates the cytoplasmic export of Chinmo upon dSir2 overexpression. (Q) Schematic indicating the three lysine residues that are required for dSir2-mediated redistribution of Chinmo to the cytoplasm. The statistical results in all the bar graphs (C, E, I-P) are shown as mean ± SD (n = 3). p Values are calculated using unpaired t-test with Welch’s correction and indicated in each of the graphs.
-
Figure 4—source data 1
Uncropped western blots with relevant bands labeled for Figure 4D–F.
- https://cdn.elifesciences.org/articles/62621/elife-62621-fig4-data1-v2.docx
-
Figure 4—source data 2
Original image files of the unedited for western blots in Figure 4D.
- https://cdn.elifesciences.org/articles/62621/elife-62621-fig4-data2-v2.zip
-
Figure 4—source data 3
Original image files of the unedited for western blots in Figure 4E.
- https://cdn.elifesciences.org/articles/62621/elife-62621-fig4-data3-v2.zip
-
Figure 4—source data 4
Original image files of the unedited for western blots in Figure 4F.
- https://cdn.elifesciences.org/articles/62621/elife-62621-fig4-data4-v2.zip
-
Figure 4—source data 5
Morphology and fluorescence microscopy of Kc167 cells used in Figure 4.
- https://cdn.elifesciences.org/articles/62621/elife-62621-fig4-data5-v2.docx
Figure 4—figure supplement 1
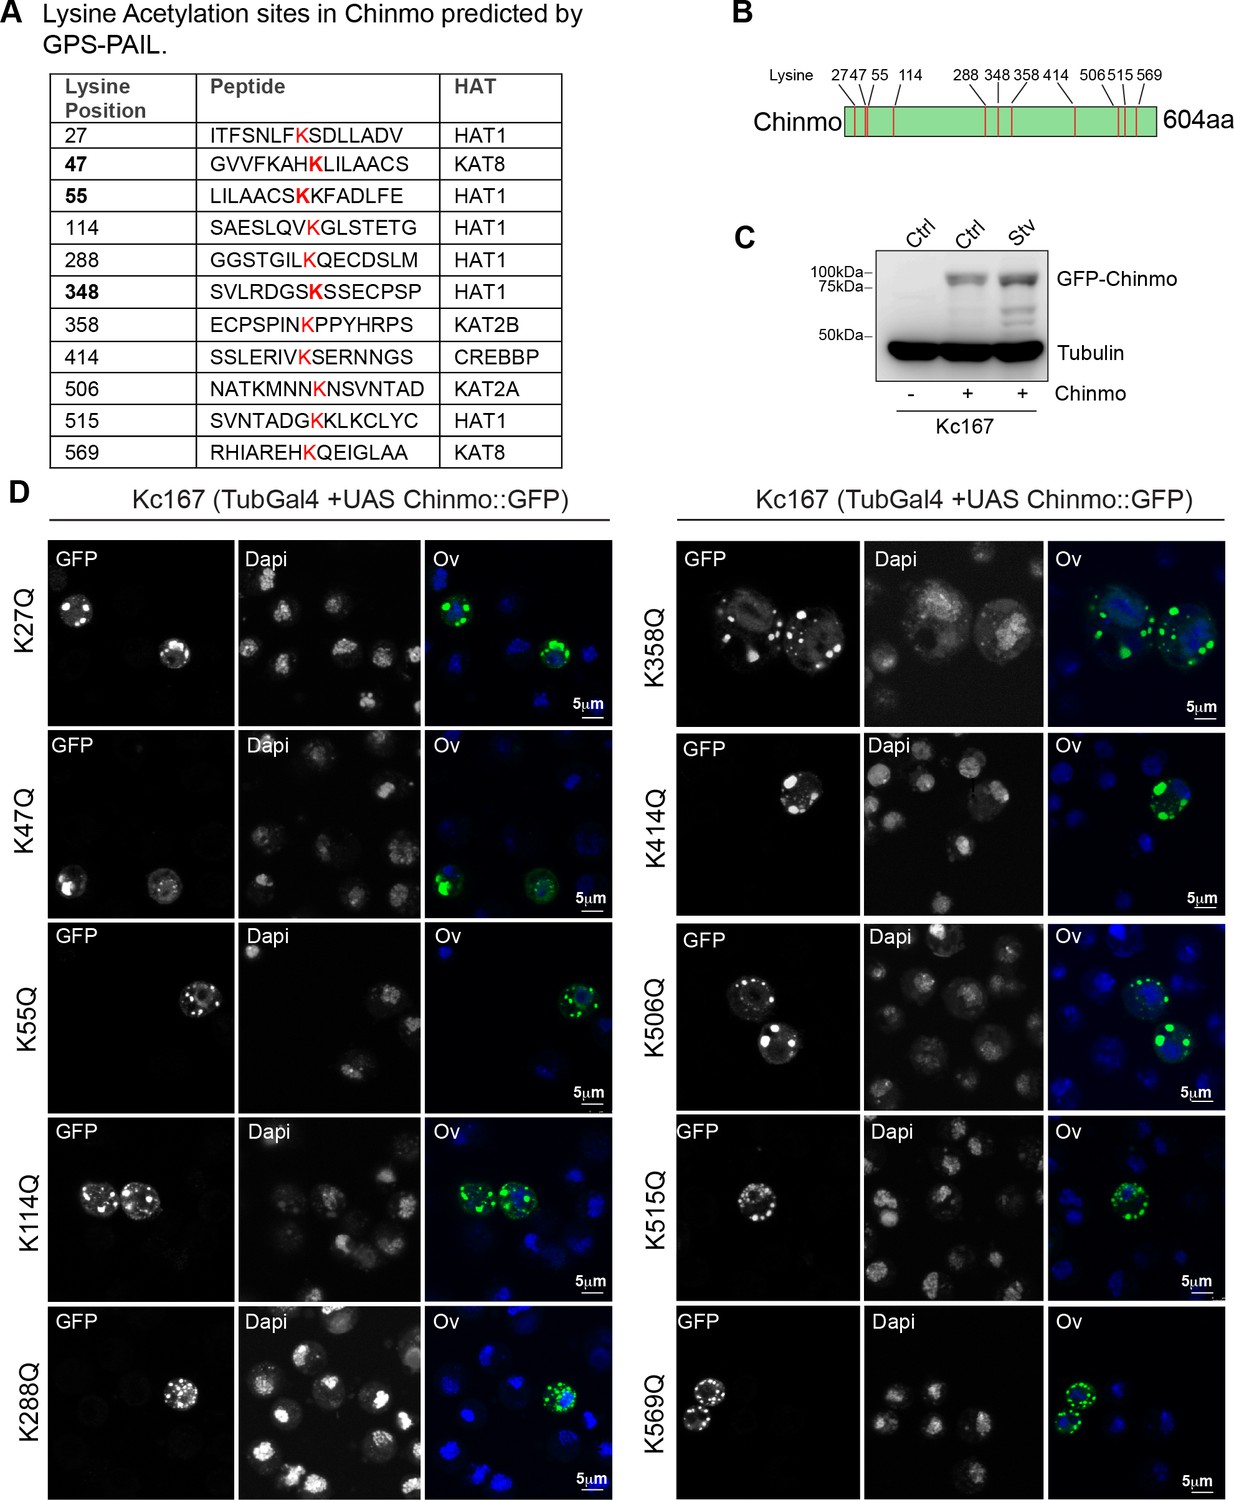
Evaluation of predicted acetylated lysine residues in Chinmo.
(A) Table indicating potential Lysine residues in Chinmo that are sites for acetylation based on the GPS-PAIL online prediction tool. GPS-PAIL was run with all stringency options and there were very few sites obtained at the stringent (0) or medium (2) cut-offs. All the Lysine residues that were predicted at low cut-off are represented in (A). (B) Schematic representation of the Chinmo protein with predicted Lysines that may undergo Acetylation/deacetylation-mediated regulation. (C) Western blot analysis to confirm expression of GFP-tagged Chinmo in Kc167 cells transfected with Tubulin Gal4 plasmid and either empty vector (pUASTattB) in fed conditions (Ctrl) or UAS GFP Chinmo in fed (Ctrl) and starvation conditions (Stv). (D) All Lysine (K) residues that were predicted to be acetylated were mutated to Glutamine (Q). The UAS-GFP Chinmo mutant constructs were transfected into Kc167 cells together with Tubulin GAL4 and the nucleo-cytoplasmic distribution of the protein was examined after immunostaining of fixed cells exposed to fed (Ctrl) or 10 hr starvation. (D) Majority of single mutants analyzed (K27Q, K47Q, K55Q, K114Q, K288Q, K358Q, K414Q, K506Q, K515Q, and K569Q) redistributed to the cytoplasm upon 10 hr starvation. K348Q and K47QK55Q double mutant and K47QK55QK348Q triple mutant predominantly localized to the nucleus even upon starvation (Figure 4H–L). Scale bars represent 5 µm.
-
Figure 4—figure supplement 1—source data 1
Uncropped western blots with relevant bands labeled for Figure 4—figure supplement 1C.
- https://cdn.elifesciences.org/articles/62621/elife-62621-fig4-figsupp1-data1-v2.docx
-
Figure 4—figure supplement 1—source data 2
Original image files of the unedited for western blots in Figure 4—figure supplement 1C.
- https://cdn.elifesciences.org/articles/62621/elife-62621-fig4-figsupp1-data2-v2.zip
Figure 4—figure supplement 2
Chinmo protein and mRNA are upregulated in adult and larval fat tissue upon starvation.
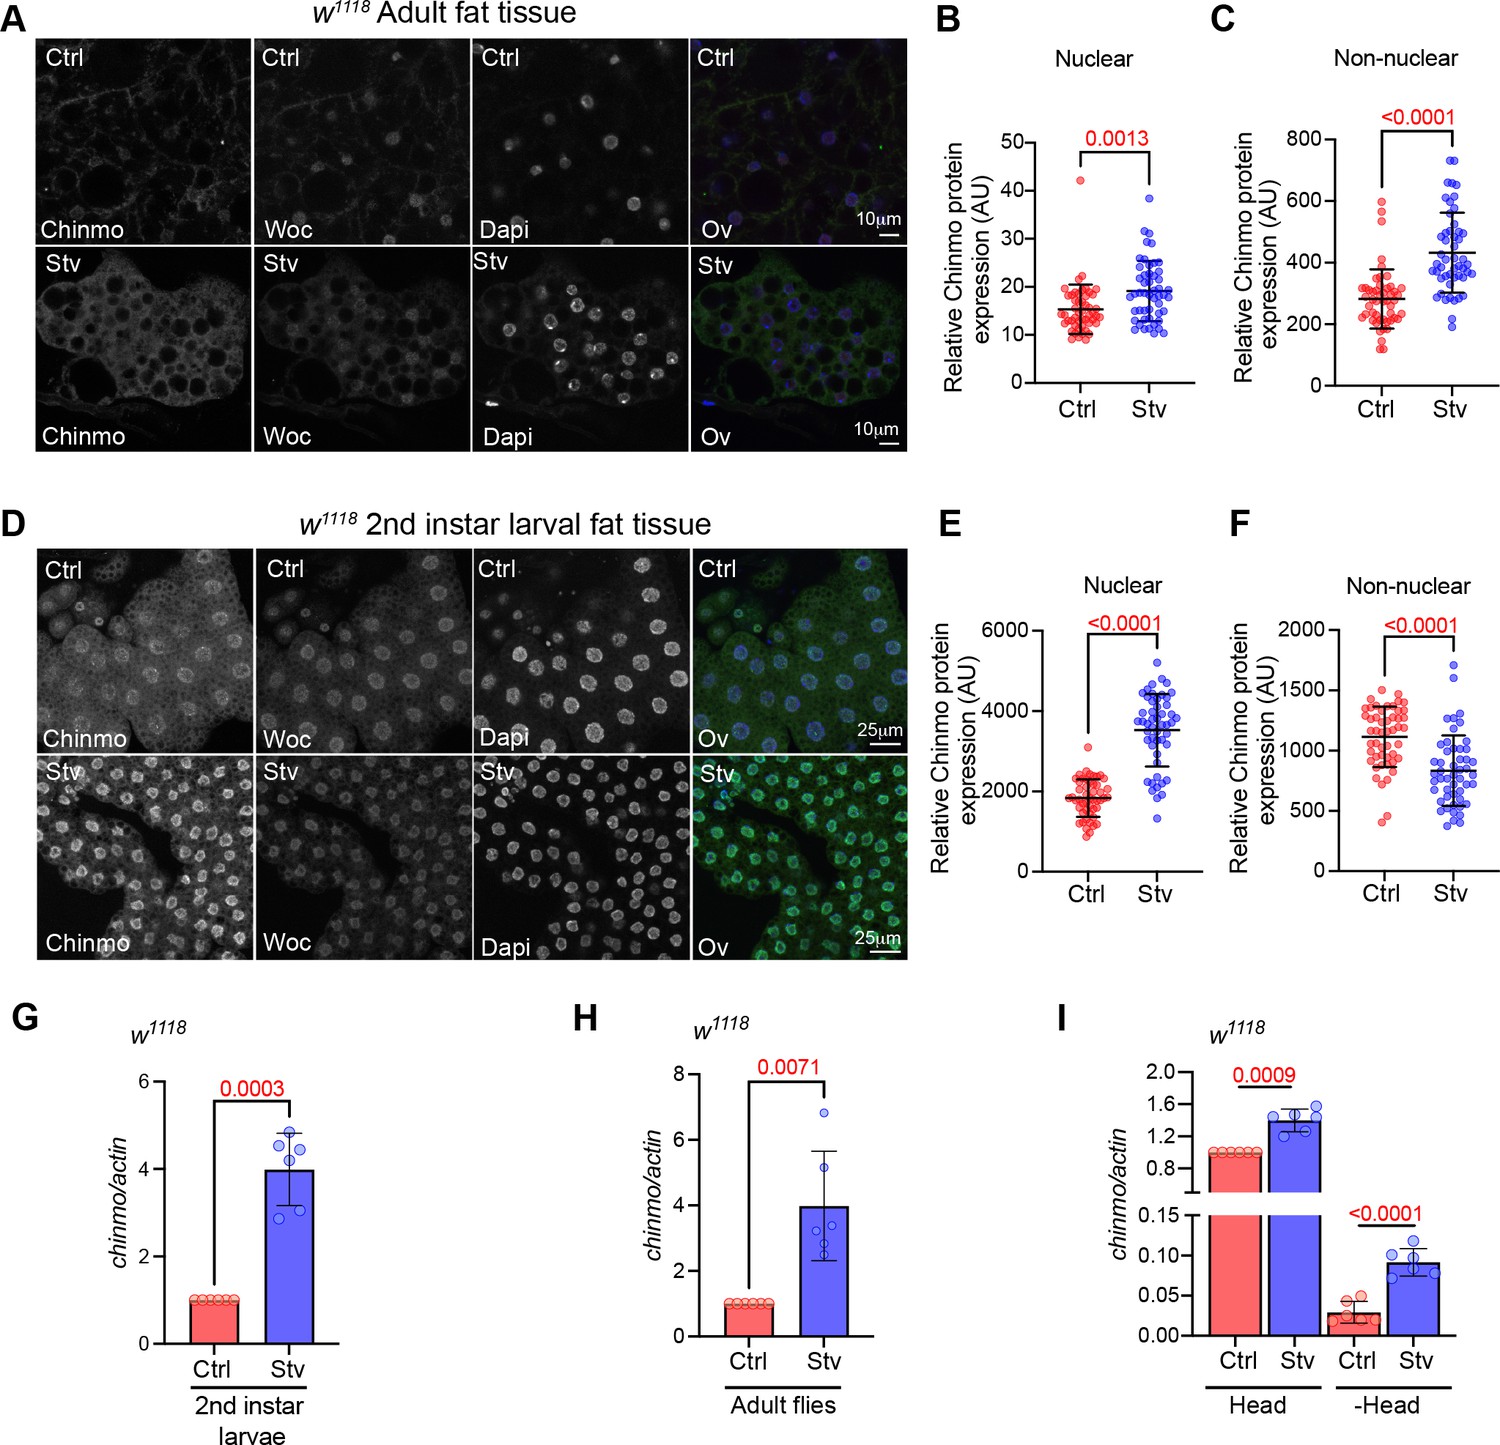
(A) Chinmo protein levels increase in adult fat tissue of w1118 flies that were exposed to starvation for 2 days. Confocal images of dissected fat body from adult w1118 flies that were exposed to normal diet or starvation for 2 days. Immunostaining was performed with anti-Chinmo, anti-Woc (nuclear protein) and Dapi. Scale bar, 10 μm. (B, C) Quantitation of Chinmo protein levels in adult fat tissue nuclear and peripheral (non-nuclear) regions as determined by measuring pixel intensity in 10 cells in five samples per condition. Chinmo levels increase in the nuclear and periphery regions upon starvation. Error bars represent mean ± SD and p values were calculated by unpaired t test with Welch’s correction. (D) Chinmo protein levels increase in larval fat tissue upon 16 hr of starvation. Confocal images of dissected fat body from w1118 2nd instar larvae that were exposed to normal diet or starvation for 16 hr. (E, F) Quantitation of Chinmo protein levels in larval fat tissue nuclear and peripheral (non-nuclear) regions as determined by measuring pixel intensity in 10 cells in five samples per condition. Chinmo levels increase in the nuclear but not periphery regions upon starvation. Error bars represent mean ± SD and p values were calculated by unpaired t test with Welch’s correction. (G-H) Chinmo mRNA levels increase upon starvation. RT-PCR quantitation of fold change in chinmo mRNA levels in w1118 2nd instar larvae (G), adult whole flies (H) that were fed a Ctrl/normal food (Red bars) or exposed to starvation (Blue bars) for 2 days. (I) The DR-dependent increase in chinmo is higher in peripheral tissues (decapitated body tissue) as compared to the head tissue. RT-PCR quantitation of chinmo mRNA in head and decapitated body tissue of w1118 flies that were fed a normal diet or exposed to starvation for 2 days. Genotypes of strains used in this figure: (A-I) w1118.
Figure 5 with 1 supplement
Chinmo co-fractionates with exosomal proteins upon nutrient deprivation.
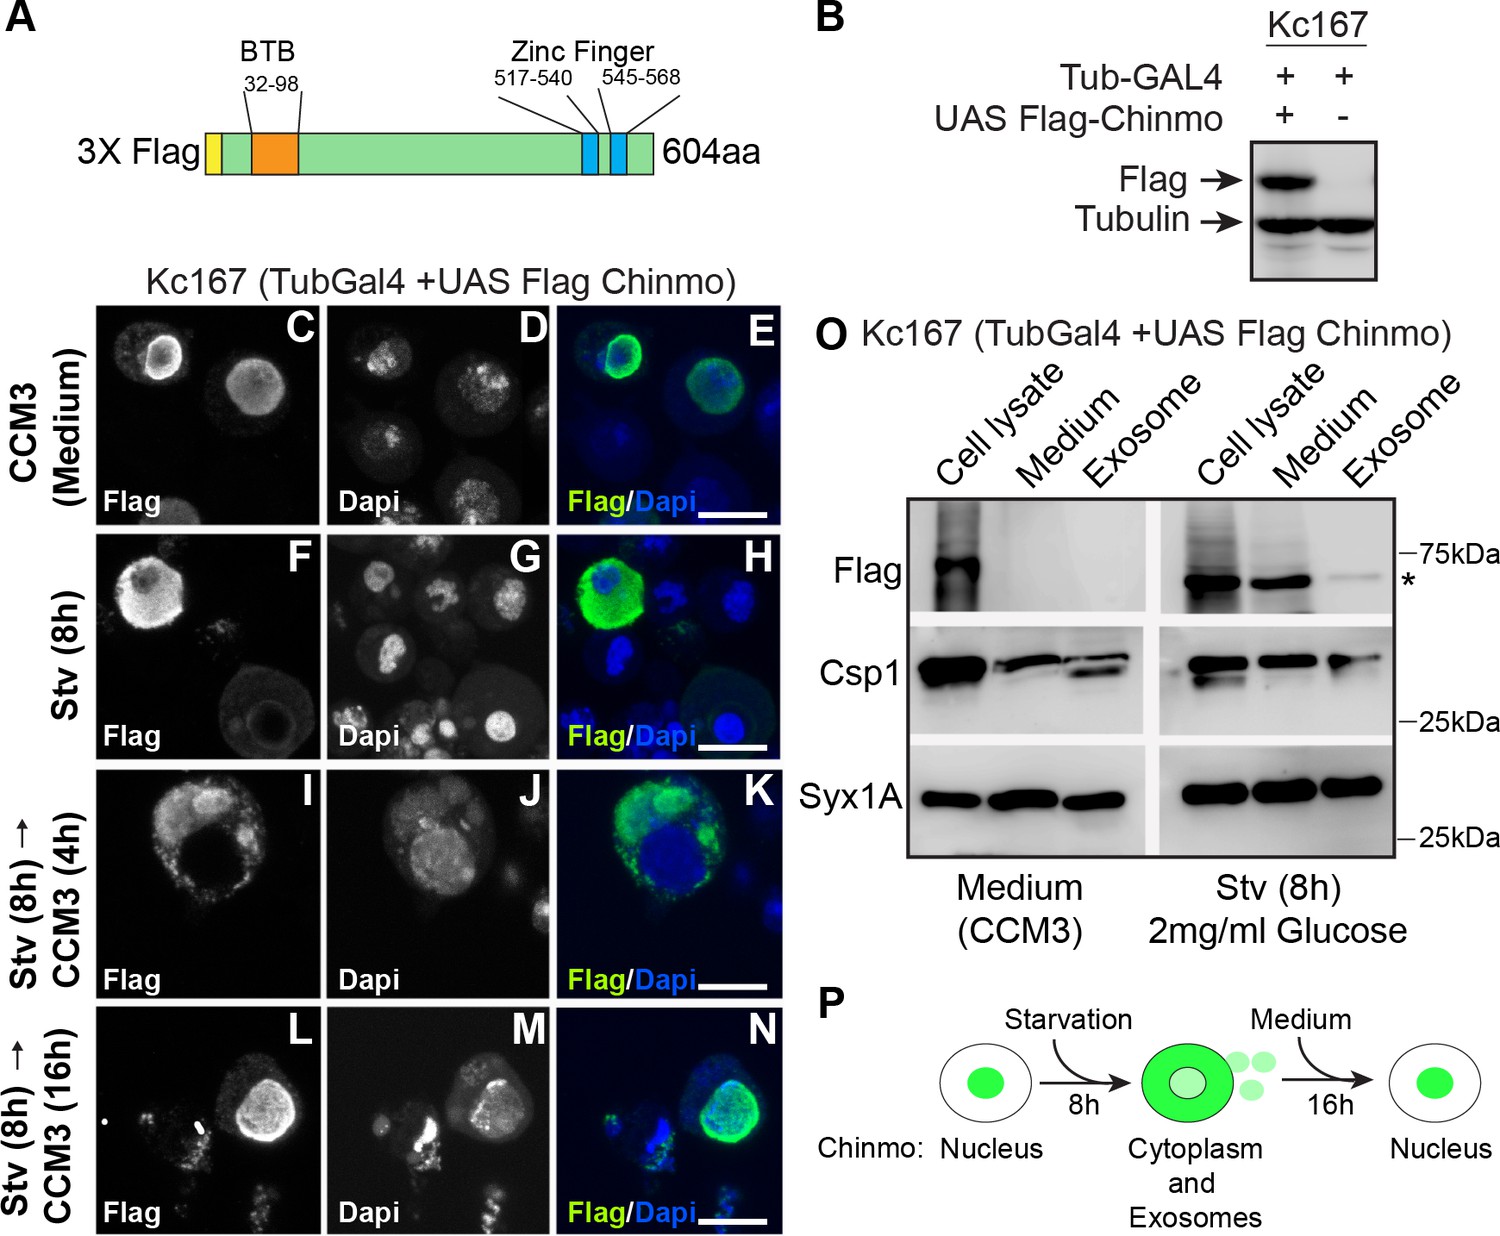
(A) Schematic of the 3X Flag-Chinmo protein indicating the BTB and Zinc finger domains. (B) Western blot analysis to confirm expression of Flag-tagged Chinmo in Kc167 cells transfected with Tubulin Gal4 plasmid and either empty vector (pUASTattB) or UAS Flag Chinmo. (C-N) Kc167 cells were transfected with Tubulin Gal4 and Flag Chinmo and distribution of Chinmo was examined in fixed cells after immunostaining with Flag and Dapi. Chinmo is predominantly localized to the nucleus in the fed state (C-E) and redistributes to cytoplasm when Kc167 cells are starved for 8 hr (F-H). (I-N) Chinmo distribution in Kc167 starved cells that are shifted to medium (CCM3) for 4 hr (I-K) and 16 hr (L-N). Chinmo translocates to the nucleus when cells are shifted from starvation to nutrient-rich conditions for 16 hr. Confocal images were acquired at ×100 magnification. Scale bars represent 8 μm. (O) Western blot analysis of cell lysate, concentrated culture medium and purified exosomes from Kc167 cells. Kc167 cells were transfected with Tubulin Gal4 and Flag Chinmo and 72 hr post-transfection cells were divided into flasks with either medium (CCM3) or 2 mg/ml glucose (PBS) for 8 hr. The medium from both conditions was collected and concentrated using Amicon centrifugal columns. Exosomes were purified from concentrated medium by gel exclusion chromatography. The exosomal fraction, concentrated medium and, cell lysate were analyzed by western blotting with Flag (Flag Chinmo), Csp 1 (exosome marker), and Syntaxin 1A (exosome marker) antibodies. Flag Chinmo was detected in exosomes and concentrated medium of Kc167 cells that were starved for 8 hr (Asterisk symbol). (P) Schematic representing dynamic redistribution of Chinmo in Kc167 cells exposed to starvation for 8 hr followed by a shift to medium for 16 hr.
-
Figure 5—source data 1
Uncropped western blots with relevant bands labeled for Figure 5B and O.
- https://cdn.elifesciences.org/articles/62621/elife-62621-fig5-data1-v2.docx
-
Figure 5—source data 2
Original image files of the unedited western blots in Figure 5B and O.
- https://cdn.elifesciences.org/articles/62621/elife-62621-fig5-data2-v2.zip
Figure 5—figure supplement 1
Elution of vesicles using gel filtration columns.
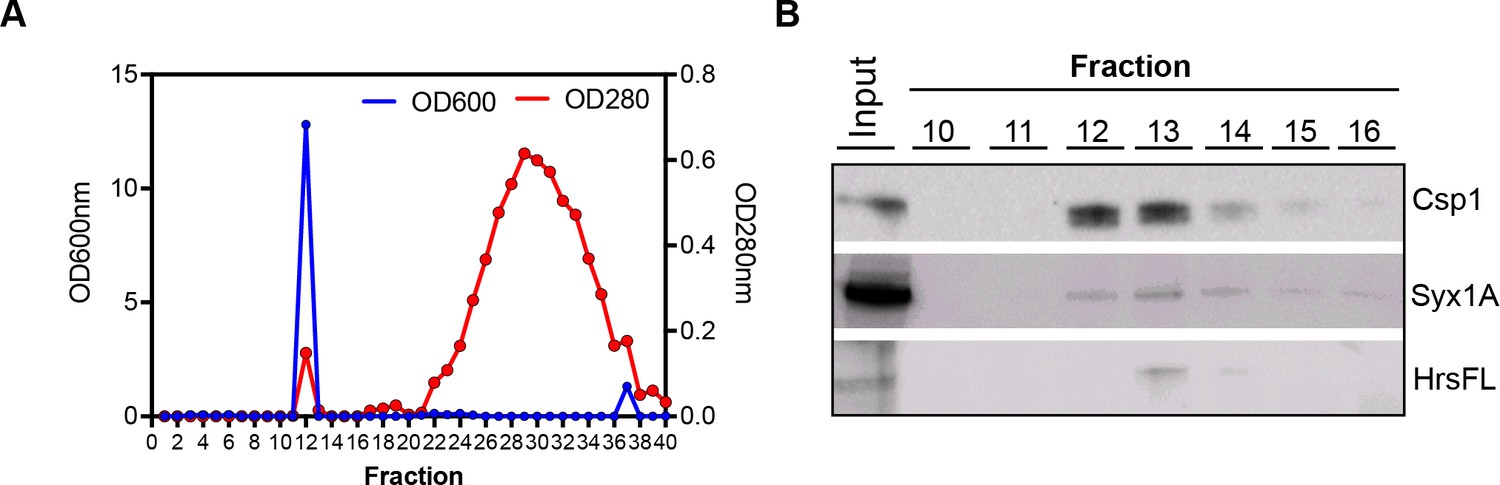
(A) Elution profile with 100 µl of concentrated Kc167 cell culture medium loaded. OD600nm (blue line) and OD280nm (red line) was measured in each of the collected fractions. The elution of vesicles peaked at 200 µl after void volume (1000 µl) when 100 µl were collected. The protein fraction eluted in much later fractions (~1000 µl) after the void volume. (B) Western blot analysis of fractions collected (A) with antibodies to exosomal proteins cysteine string protein (CSP), syntaxin 1A (Syx1A) and hepatocyte growth factor regulated tyrosine kinase substrate (Hrs).
-
Figure 5—figure supplement 1—source data 1
Uncropped western blots with relevant bands labeled for Figure 5—figure supplement 1B.
- https://cdn.elifesciences.org/articles/62621/elife-62621-fig5-figsupp1-data1-v2.docx
-
Figure 5—figure supplement 1—source data 2
Original image files of the unedited western blots in Figure 5—figure supplement 1B.
- https://cdn.elifesciences.org/articles/62621/elife-62621-fig5-figsupp1-data2-v2.zip
Figure 6 with 3 supplements
Ectopic expression of chinmo in adult neurons and fat body mimics miR-125 mutant DR phenotype.
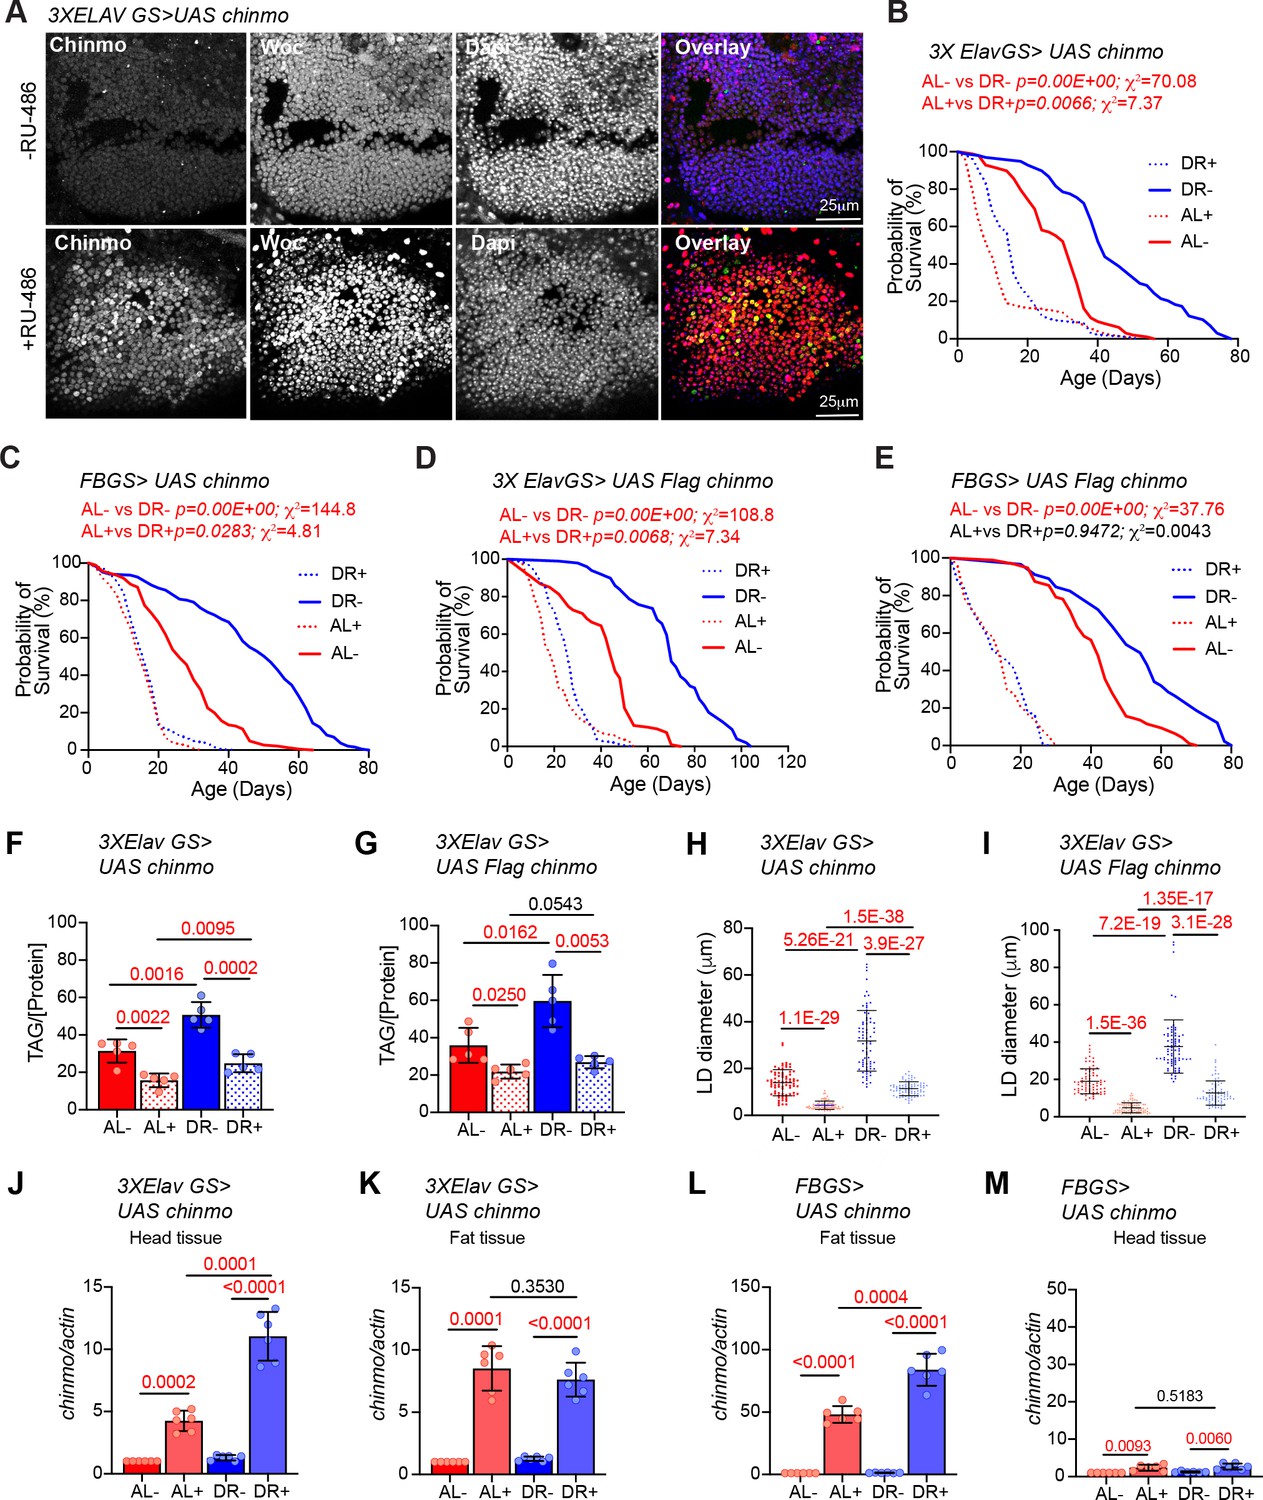
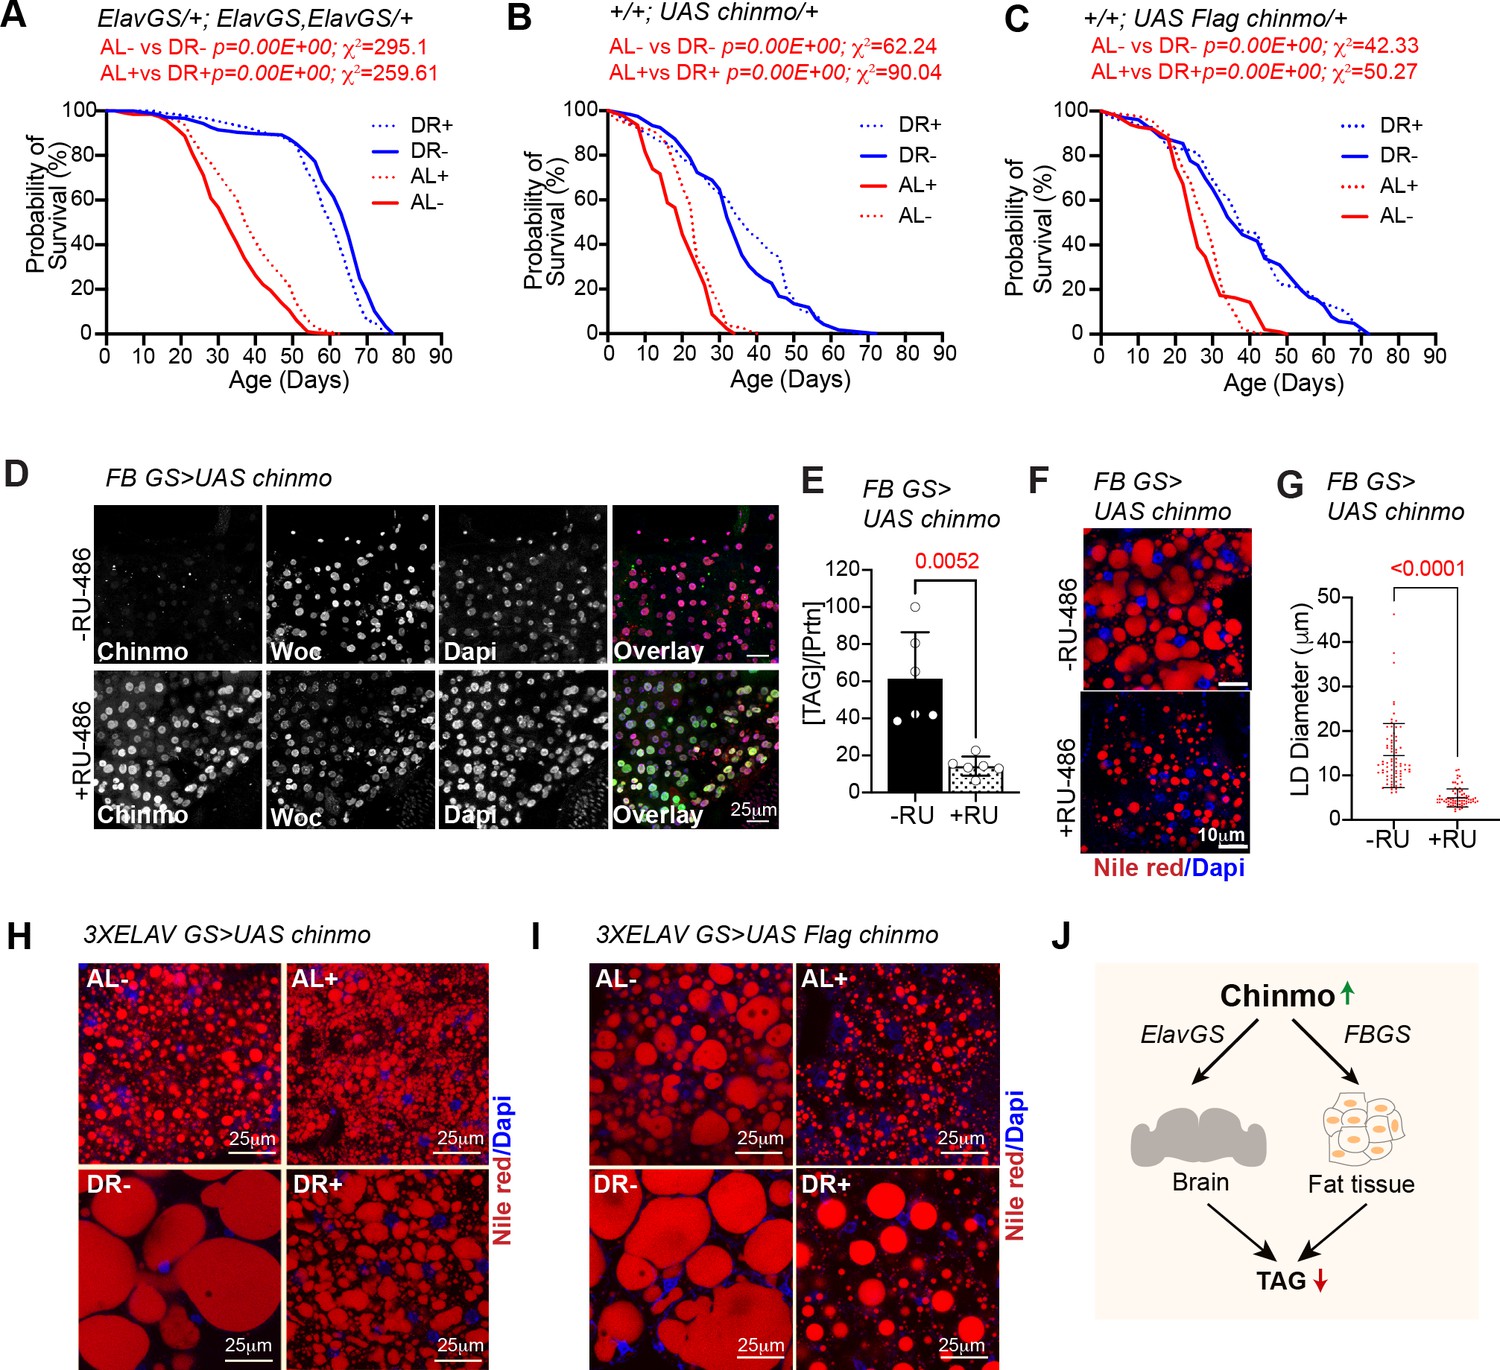
UAS chinmo was expressed in adult neurons and adult fat tissue using the steroid (RU-486) inducible gene switch Gal4 drivers. (A) Female flies that were fed an RU-486 supplemented diet for 5 days displayed increased levels of Chinmo in neuronal cells, as detected by Chinmo. Woc (nuclear marker) and Dapi staining of dissected adult fly brains. (B, D) 3X ElavGS >UAS chinmo (B) or 3X ElavGS >UAS Flag chinmo (D) flies that were not fed RU-486 show a significant increase in lifespan upon DR (DR, blue line) as compared to 3X ELavGS >UAS chinmo (B) or 3X ElavGS >UAS Flag chinmo (D) flies that were fed an ad libitum (AL) diet (red line)(3X ElavGS >UAS chinmo: AL-, n = 98; median lifespan = 32 d; DR-, n = 99; median lifespan = 42; 3X ElavGS >UAS Flag-chinmo: AL-, n = 107; median lifespan = 44 d; DR-, n = 99; median lifespan = 70 d). RU-486 fed 3X ElavGS >UAS chinmo flies or 3X ElavGS >UAS Flag-chinmo display a significantly dampened DR-dependent increase in lifespan (blue and red dotted lines) (3X ElavGS >UAS chinmo: AL+, n = 100; median lifespan = 10 d; DR+, n = 95; median lifespan = 16 d; 3X ElavGS >UAS Flag-chinmo: AL+, n = 137; median lifespan = 18 d; DR+, n = 100; median lifespan = 26 d). (C, E) FB GS >UAS chinmo or FB GS >UAS Flag-chinmo flies that were fed RU-486 displayed a stronger DR phenotype relative to 3X ElavGS >UAS Chinmo or 3X ElavGS >UAS Flag chinmo (blue and red dotted lines)(FB GS >UAS chinmo: AL-, n = 186; median lifespan = 26 d; DR-, n = 187; median lifespan = 52 d; AL+, n = 213; median lifespan = 16 d; DR+, n = 209; median lifespan = 16 d; FB GS >UAS Flag-chinmo: AL-, n = 96; median lifespan = 42; DR-, n = 91; median lifespan = 54; AL+, n = 83; median lifespan = 14 d; DR+, n = 73; median lifespan = 14 d) (Compare p values and Χ2 in panels B/D with C/E) compared to the flies that were fed the Ethanol (blue and red solid lines). For statistical comparison of survival curves, p values and Χ2 were calculated with log rank test. (F, G) Quantitation of triglyceride (TAG) stored levels in AL-RU-486 (Solid red bars), AL + RU-486 (Red dotted bars), DR-RU-486 (Solid blue bars) and DR +RU-486 (Dotted blue bars) fed 20d old (F) 3XElavGS > UAS chinmo or (G) 3XElavGS > UAS Flag-chinmo flies. Increasing Chinmo levels in adult neurons is sufficient to lead to a significant reduction in the systemic triglyceride levels under both AL and DR conditions. This decrease mimics the decrease in TAG levels observed in miR-125 mutants. The bars represent mean ± SD, n = 5, p value was calculated with unpaired two tailed t-test with Welch’s correction. (H, I) Fat bodies/abdomens of female flies were dissected and stained for the content and diameter of lipid droplet (LD) (red are lipid droplets stained with Nile red and blue is Dapi). For representative confocal images, please refer to Figure 6—figure supplement 1H–I. Quantitation of lipid droplet (LD) diameter in 3XElavGS > UAS chinmo (H) and 3XElavGS > UAS Flag-chinmo (I). A significant reduction is seen in lipid droplet size in the abdominal fat tissue when Chinmo is expressed in adult neurons. Quantitation of 15 largest LDs in five samples per condition. Error bars represent mean ± SD. (J–K) 3X ElavGS >UAS chinmo flies express increased levels of chinmo mRNA in both head and fat tissue. (L–M) FBGS >UAS chinmo flies predominantly express chinmo mRNA in the adult fat tissue. (J–M) Quantitative RT-PCR of RNA extracted from dissected tissues (head and fat body) of 3XElavGS > UAS chinmo (J, K) and FBGS >UAS chinmo (L, M) flies that were fed an AL (Red and pink bars) and DR (Dark Blue and Light blue bars) under uninduced (Red and Dark blue bars) and steroid induced (Pink and Light blue bar) conditions. Expression levels were normalized to Actin5c. Values are mean ± SD, n = 6. p Values were calculated using unpaired t test with Welch’s correction. Genotypes of strains used in this figure: (A, B, F, H, J-M) 3X ElavGS >UAS chinmo: P{elav-Switch.O}GS −1A / +; P{elav-Switch.O}GS-3A, P{elav-Switch.O} GSG301/P{w+, UAS-chin::SV40}/+; (D, G,I) 3X ElavGS >UAS Flag chinmo: P{elav-Switch.O}GS −1A / +; P{elav-Switch.O}GS-3A,P{elav-Switch.O} GSG301/P{w+, UAS Flag-chin::SV40} attP2 / +; (C) FBGS >UAS chinmo: w1118; P {w [+mW.hs]=Switch1}106/+; P{w+, UAS-chin::SV40}/+; (E) FBGS >UAS Flag-chinmo: w1118; P{w[+mW.hs]=Switch1} 106/+; P{w+, UAS Flag-chin::SV40} attP2 / +.
-
Figure 6—source data 1
Lifespan analysis of strains used in Figure 6.
- https://cdn.elifesciences.org/articles/62621/elife-62621-fig6-data1-v2.docx
-
Figure 6—source data 2
Survival proportions of lifespan curves of strains used in Figure 6B–E.
- https://cdn.elifesciences.org/articles/62621/elife-62621-fig6-data2-v2.xlsx
Figure 6—figure supplement 1
Lifespan and molecular analysis of strains used in Figure 6.
(A–C) Effect of diet and RU-486 on lifespan of 3X ElavGS X w1118 (A), UAS chinmo X w1118 (B) and UAS Flag chinmo X w1118 (C) flies. (A) Crosses were established between 3X ElavGS and w1118 and the progeny was sorted into four groups (AL-, DR-, AL+ and DR+). Median lifespan in: AL- is 33 days; AL + is 40 days: DR- is 65 days and DR +is 61 days. (B) Crosses were established between UAS chinmo and w1118 and the progeny was sorted into four groups (AL-, DR-, AL+ and DR+). Median lifespan in: AL- is 24 days; AL + is 20 days: DR- is 34 days and DR +is 38 days. (C) Crosses were established between UAS Flag chinmo and w1118 and the progeny was sorted into four groups (AL-, DR-, AL+ and DR+). Median lifespan in: AL- is 26 days; AL + is 30 days: DR- is 38 days and DR +is 38 days. For statistical comparison of survival curves, p values and Χ2 were calculated with log rank test. (D) Over expression of chinmo in the adult fat tissue reduces TAG levels. UAS chinmo was expressed in adult fat body using the drug (RU-486)-inducible gene switch Gal4 driver. Female flies that were fed an RU-486 supplemented diet for 5 days displayed increased levels of Chinmo in fat body cells, as detected by Chinmo, Woc (nuclear marker), and Dapi staining of dissected fat body. (E) Quantitation of stored triglyceride (TAG) levels in -RU-486 and +RU-486 fed 20d old FBGS >UAS chinmo flies. (F) Fat bodies/abdomens of female flies were dissected and stained for the content and diameter of lipid droplet (LD) (red are lipid droplets stained with Nile red and blue is Dapi). Scale bar, 25 μm. (G) Quantitation of lipid droplet (LD) diameter in (F). Quantitation of 15 largest LDs in five samples per condition. Error bars represent mean ± SD. (H, I) Representative nile red images of fat bodies of (H) ElavGS >UAS chinmo and (I) ElavGS >UAS Flag chinmo adult female flies stained with Nile red and Dapi. (J) Schematic displaying systemic reduction in TAG levels by ectopic expression of Chinmo using ElavGS or FBGS Gal4 drivers. Genotypes of strains used in this figure: (A) ElavGS/+; ElavGS, ElavGS/+: P{elav-Switch.O}GS −1A / +; P{elav-Switch.O}GS-3A, P{elav-Switch.O} GSG301/+; (B) +/+; UAS chinmo/+: w1118; +/+; P{w+, UAS-chin::SV40}/+; (C)+/+; UAS Flag chinmo/+: w1118; +/+; P{w+, UAS-Flag chin::SV40} attP2 /+; (D-G) FBGS >UAS chinmo: w1118; P{w[+mW.hs]=Switch1}106/+; P{w+, UAS-chin::SV40}/+; (H) 3XElavGS > UAS chinmo: P{elav-Switch.O}GS-1A/ +; P{elav-Switch.O}GS-3A, P{elav-Switch.O} GSG301/P{w+, UAS-chin::SV40}/+; (I) 3XElavGS > UAS Flag chinmo: P{elav-Switch.O}GS −1A / +; P{elav-Switch.O}GS-3A,P{elav-Switch.O} GSG301/P{w+, UAS-Flag chin::SV40} attP2 / +.
-
Figure 6—figure supplement 1—source data 1
Lifespan analysis of strains used in Figure 6—figure supplement 1A–C.
- https://cdn.elifesciences.org/articles/62621/elife-62621-fig6-figsupp1-data1-v2.docx
Figure 6—figure supplement 2
Non-autonomous expression of Chinmo in abdominal fat tissue of 3XElavGS > UAS Chinmo flies.
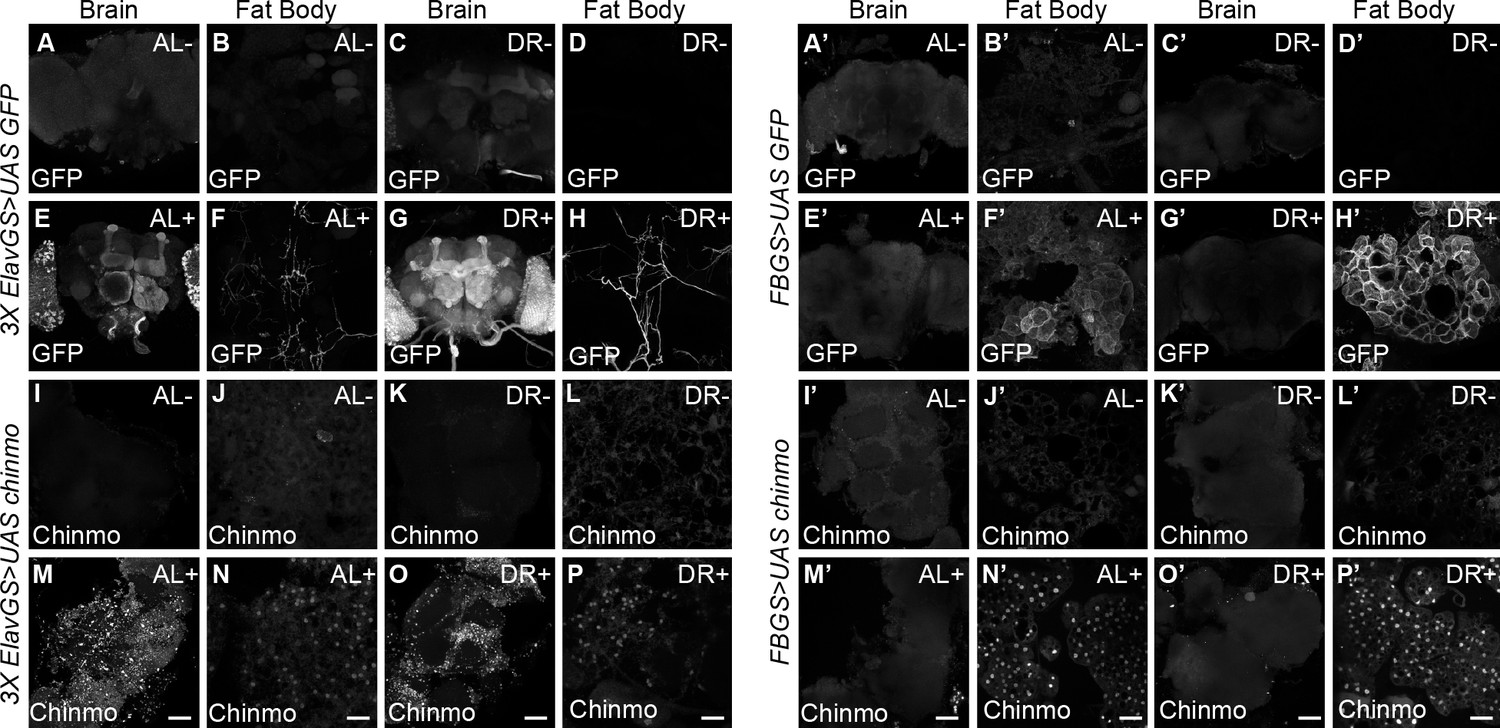
(A–H and A’–H’) To verify specificity of the gene switch GAL4 drivers, UAS GFP was expressed in a steroid-inducible manner with 3X Elav-GS (A-H) or FB-GS (A’-H’). Confocal images of dissected Drosophila adult brain and fat body from fruit flies that were fed an AL diet (A, B, E, F, A’, B’, E’, F’) or DR diet (C, D, G, H, C’, D’, G’, H’) under uninduced (A-D, A’-D’) and steroid-induced (E-H, E’-H’) conditions. 3x ElavGS >UAS GFP flies that were fed RU-486 for 5 days displayed increased levels of Chinmo in the brain and neurons innervating the adult fat tissue as detected by GFP staining of dissected brains and fat body (E, F, G, H) compared to flies that were not fed RU-486 (A, B, C, D). In contrast, 3x ElavGS >UAS chinmo flies that were fed RU-486 for 5 days displayed increased levels of Chinmo in the adult fat tissue (N, P), in addition to the adult brain (M, O) compared to flies that were not fed RU-486 (I-L) FB GS >UAS GFP and FB GS >UAS chinmo flies that were fed RU-486 for 5 days displayed increased levels of GFP (F’, H’) and Chinmo in the fat tissue (N’, P’), respectively. Scale bar, 50 μm. Genotypes of strains used in this figure: (A-H) 3x ElavGS >UAS GFP: P{elav-Switch.O}GS-1A/P{y[+t7.7] w[+mC]=10XUAS-IVS-myr::GFP}attP40; P{elav-Switch.O}GS-3A, P{elav-Switch.O}GSG301 /+; (I-P) 3x ElavGS >UAS chinmo: P{elav-Switch.O}GS-1A / +; P{elav-Switch.O}GS-3A,P{elav-Switch.O}GSG301/P{w+,UAS-chin::SV40}/+; (A’-H’) FBGS >UASGFP:w1118; P{w[+mW.hs]=Switch1} 106/P{y[+t7.7] w[+mC]=10XUAS-IVS-myr::GFP}attP40; +/+: (I’-P’) FB GS >UAS chinmo: w1118; P {w [+mW.hs]=Switch1}106/+; P{w+, UAS-chin::SV40}/+.
Figure 6—figure supplement 3
Non-autonomous expression of Chinmo in abdominal fat tissue of 3XElavGS > UAS Flag chinmo flies.
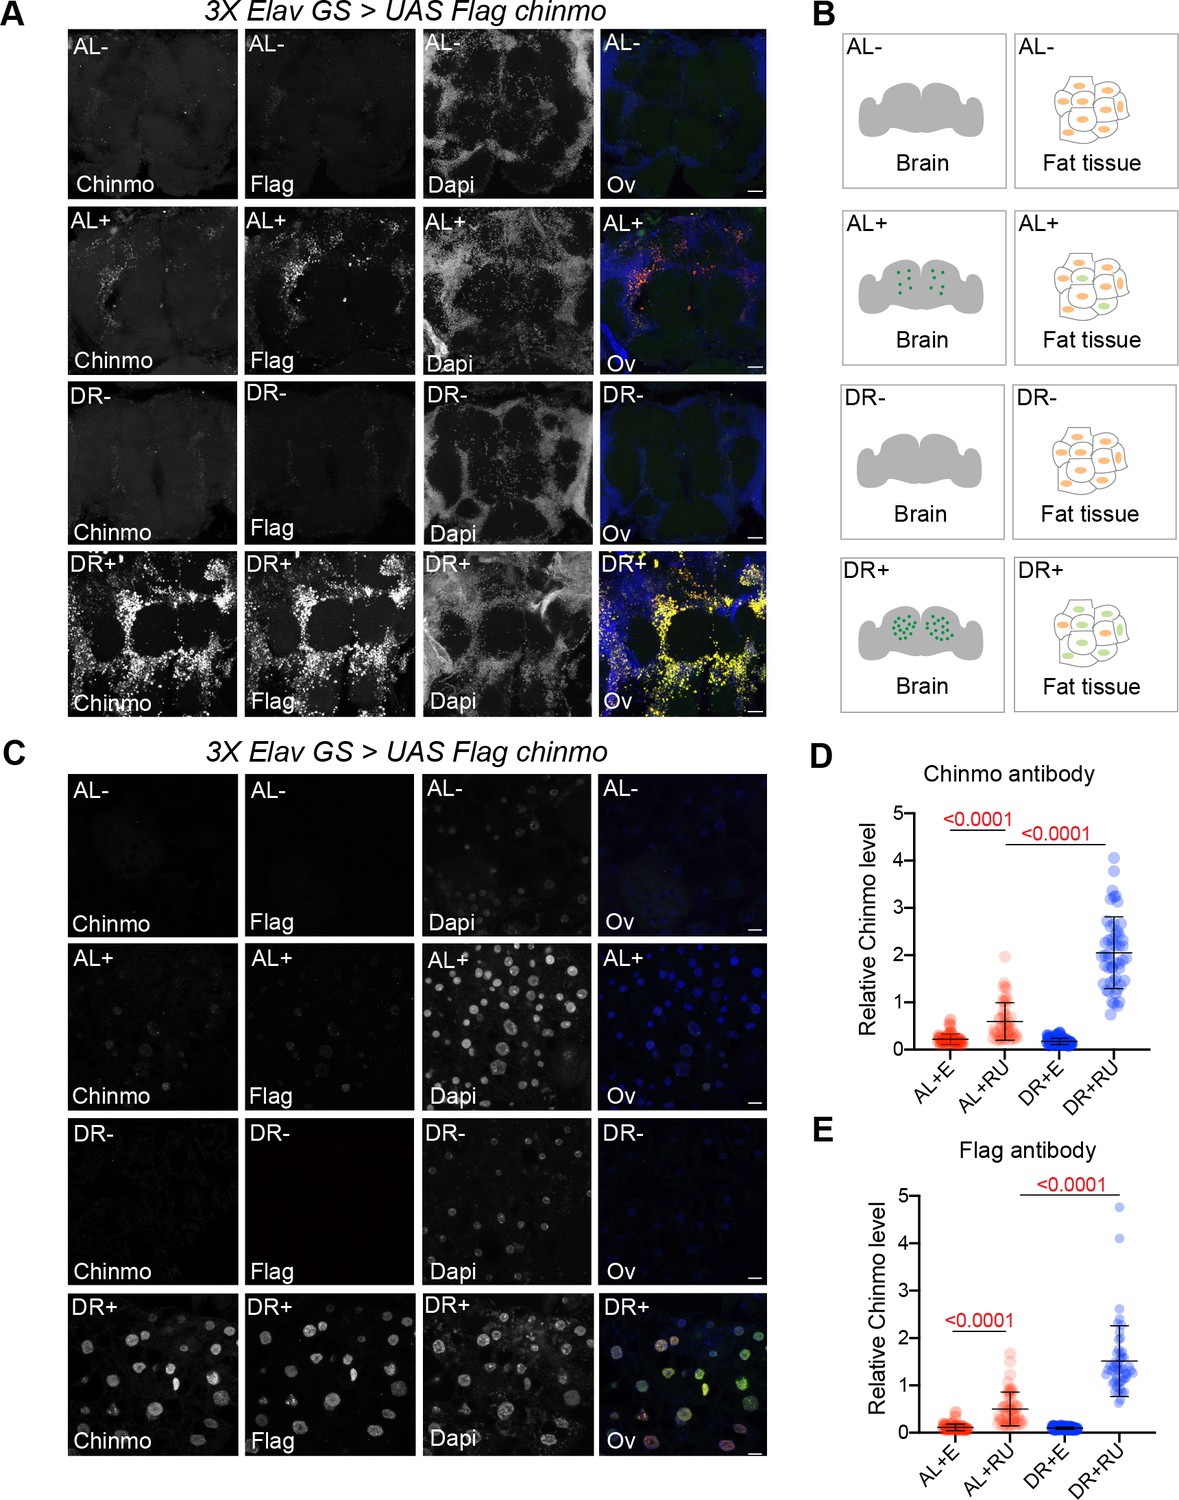
(A) Confocal images of dissected Drosophila adult brain from fruit flies that were fed an AL diet (top two panels) or DR (bottom two panels) diet under uninduced (AL-, DR-) and steroid-induced (AL+, DR+) conditions. 3x ElavGS >UAS Flag chinmo flies that were fed RU-486 for 10 days displayed increased levels of Chinmo in the brain tissue as detected by anti-flag and anti-chinmo staining of dissected brains compared to flies that were not fed RU-486. (B, C) 3x ElavGS >UAS chinmo flies that were fed RU-486 for 10 days also displayed increased levels of Chinmo in the adult fat tissue (AL+, DR+), in addition to the adult brain compared to flies that were not fed RU-486 (AL-, DR-). Scale bar, 25 μm. (D, E) Quantitation of Chinmo protein levels as detected by staining with anti-Flag and anti-chinmo antibody in adult fat tissue nuclei as determined by measuring pixel intensity in 10 cells in five samples per condition. Error bars represent mean ± SD and p values were calculated by unpaired t test with Welch’s correction. Genotypes of strains used in this figure: (A-E) 3x ElavGS >UAS Flag chinmo: P{elav-Switch.O}GS −1A / +; P{elav-Switch.O}GS-3A, P{elav-Switch.O} GSG301/P{w+, UAS-Flag chin::SV40} attP2/+.
Figure 7 with 3 supplements

Ectopic expression of chinmo in adult neurons represses transcription of genes involved in fat metabolic processes.
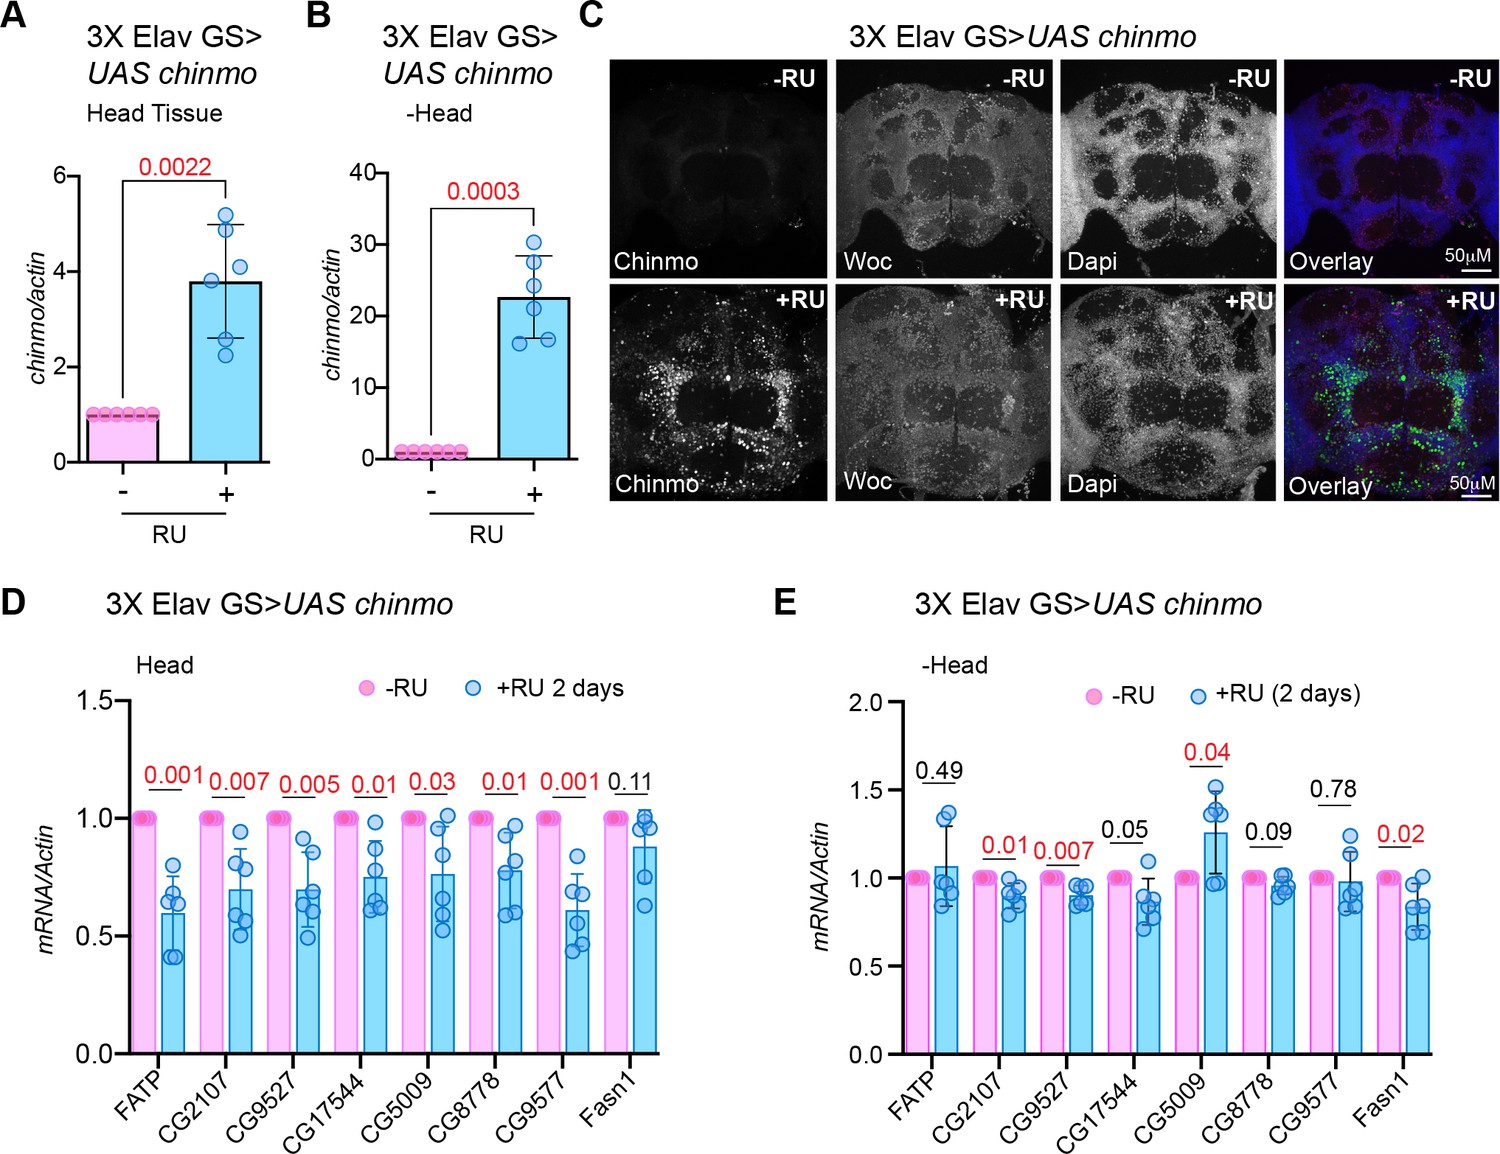
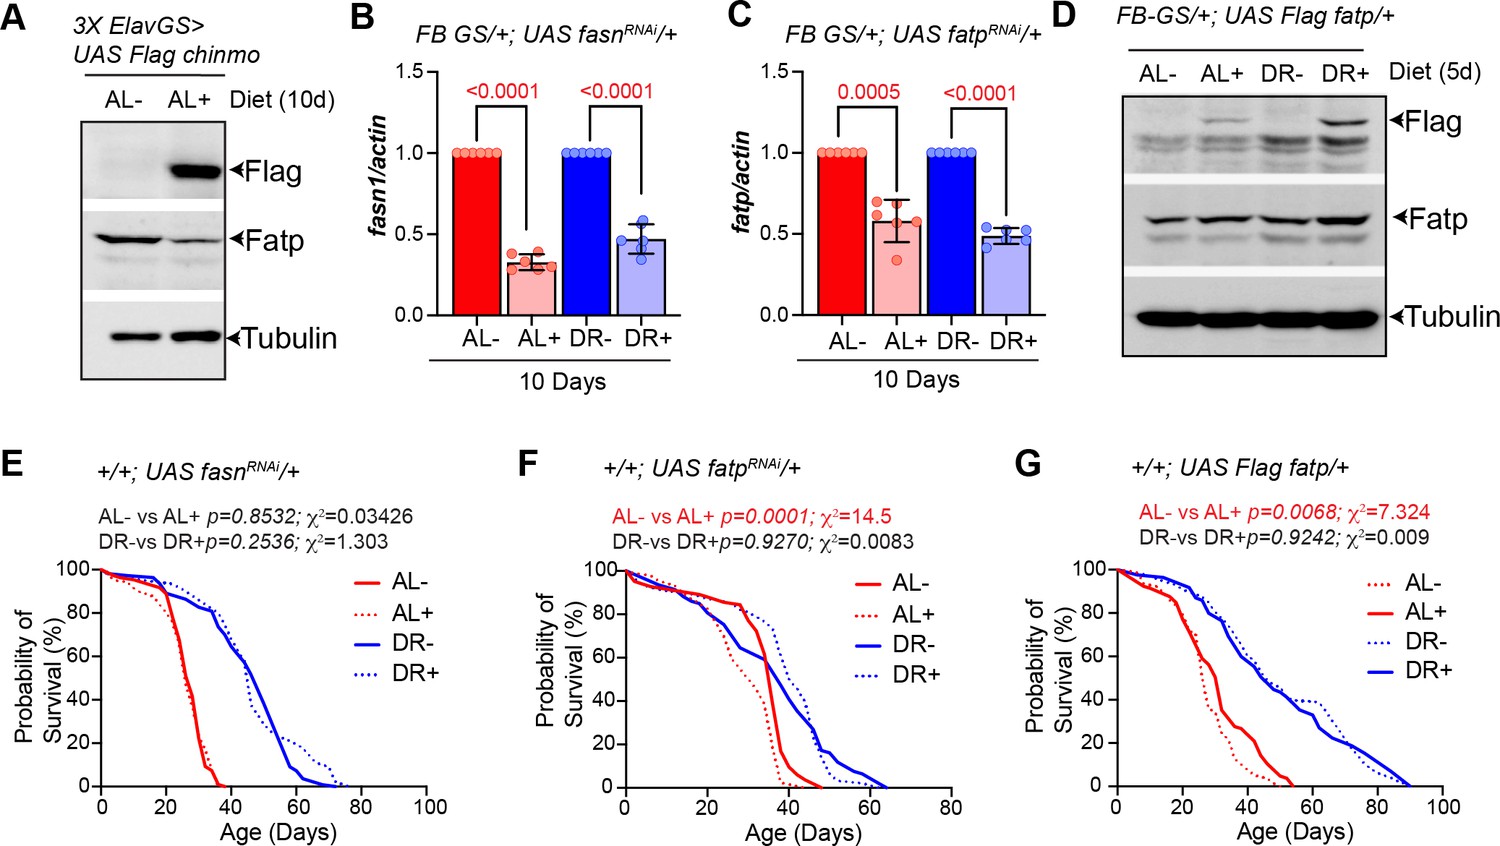
(A) Quantitation of chinmo mRNA levels in RNA extracted from 3X ElavGS >UAS chinmo flies that were fed a solvent (light blue bars) or RU-486 (pink bars) diet for 5 and 10 days. (B, C) Quantitation of chinmo mRNA levels in RNA extracted from head tissue (B) and decapitated body tissue (C) of 3X ElavGS >UAS chinmo flies that were fed ethanol (blue bar) or RU-486 (pink bar) diet for 10 days. Expression levels were normalized to Actin5c. Values are mean ± SD, n = 3. (D) Venn diagram of 1175 proteins identified across the two groups (-RU-486 and +RU-486) and 91% were common between the two groups. (E) Volcano plot illustrating significantly differentially abundant proteins. Forty proteins were found to be differentially expressed by using a cutoff on p value ≤ 0.05 and log2FC ≥ 1 (7 upregulated) and ≤−1.0 (33 downregulated) proteins. (F) Twenty-five most significant biological processes that are downregulated upon overexpression of chinmo in adult neurons. See Figure 7—figure supplement 2 for upregulated biological processes. (G, H) Overexpression of chinmo in the adult nervous system downregulates genes involved in fat metabolism. RT-PCR quantitation of fold- change in mRNA levels of genes (F) involved in fat metabolism in the head tissue (G) and decapitated body tissue (H) of 3X ElavGS >UAS chinmo flies that were fed the solvent/ethanol (light blue bars) or RU-486 (pink bars) diet for 10 days. (I) Knockdown of fasn1 in the adult fat body reduces lifespan more significantly in flies that are fed an AL (compare red solid and dotted lines) compared to flies that are fed a DR diet (compare blue solid and blue dotted lines) conditions (See Figure 7—source data 1 for p values and median and maximum lifespan for additional experimental replicate). (J) Knockdown of fatp in the adult fat body reduces lifespan under DR (compare blue solid and blue dotted lines) conditions (See Figure 7—source data 2 for p values and median and maximum lifespan for additional experimental replicate). (K) Overexpression of Flag FATP increases lifespan in flies that are fed a DR diet (Compare blue dotted line with blue solid line) more significantly than flies that are fed an AL diet (See Figure 7—source data 3 for p values and median and maximum lifespan for additional experimental replicate). For statistical comparison of survival curves, p values and χ2 were calculated with log-rank test. Genotypes of strains used in this figure: (A-H) 3X ElavGS >UAS chinmo: P{elav-Switch.O}GS −1A / +; P{elav-Switch.O}GS-3A, P{elav-Switch.O} GSG301/P{w+, UAS-chin::SV40}/+; (I) FB GS/+; UAS fasn1RNAi/+: w1118; P{w[+mW.hs]=Switch1}106/+; P{y[+t7.7] v[+t1.8]=TRiP.HMS01524}attP2/+; (J) FB GS/+; UAS fatpRNAi/+:w[1118]; P{w[+mW.hs]=Switch1}106/+; P{y[+t7.7] v[+t1.8]=TRiP.HMC04206}attP2/+; (K) FB GS/+; UAS Flag fatp/+: w[1118]; P{w[+mW.hs]=Switch1}106/+;P{w+, UAS-Flag fatp} attP2/+.
-
Figure 7—source data 1
Lifespan analysis of FBGS >UAS fasn1RNAi and +/+; UAS fasn1RNAi strains.
- https://cdn.elifesciences.org/articles/62621/elife-62621-fig7-data1-v2.docx
-
Figure 7—source data 2
Lifespan analysis of FBGS >UAS fatpRNAi and +/+; UAS fatpRNAi strains.
- https://cdn.elifesciences.org/articles/62621/elife-62621-fig7-data2-v2.docx
-
Figure 7—source data 3
Lifespan analysis of FBGS >UAS Flag fatp and +/+; UAS Flag fatp strains.
- https://cdn.elifesciences.org/articles/62621/elife-62621-fig7-data3-v2.docx
-
Figure 7—source data 4
Survival proportions of lifespan curves of strains used in Figure 7I–K.
- https://cdn.elifesciences.org/articles/62621/elife-62621-fig7-data4-v2.xlsx
-
Figure 7—source data 5
Upregulated biological processes from proteomic analysis in Figure 7D–F.
- https://cdn.elifesciences.org/articles/62621/elife-62621-fig7-data5-v2.xlsx
-
Figure 7—source data 6
Downregulated biological processes from proteomic analysis in Figure 7D–F.
- https://cdn.elifesciences.org/articles/62621/elife-62621-fig7-data6-v2.xlsx
Figure 7—figure supplement 1
Overexpression of chinmo in adult neurons represses transcription of genes involved in fat metabolic processes in the brain within 2 days of induction.
(A, B) Quantitation of chinmo mRNA levels in RNA extracted from head and decapitated body tissue of 3X ElavGS >UAS chinmo flies that were fed a solvent (light blue bars) or RU-486 (pink bars) diet for 2 days. (C) Female flies that were fed an RU-486 supplemented diet for 2 days displayed increased levels of Chinmo in neuronal cells, as detected by Chinmo, Woc (nuclear marker), and Dapi staining of dissected adult fly brains. (D, E) Overexpression of chinmo in the adult nervous system downregulates genes involved in fat metabolism. RT-PCR Quantitation of fold change in mRNA levels of genes involved in fat metabolism in the head tissue (D) and decapitated body tissue (E) of 3X ElavGS >UAS chinmo flies that were fed a solvent (light blue bars) or RU-486 (pink bars) diet for 2 days. (D) Induction of Chinmo for 2 days was sufficient to lead a statistically significant reduction of seven of the eight genes analyzed in the head tissue. (E) 3 out of 8 genes analyzed also displayed a statistically significant albeit lower reduction in the decapitated body tissue. Expression levels were normalized to Actin5c. Values are mean ± SD, n ≥ 3. p Values were calculated by using unpaired t test with Welch’s correction. Genotypes of strains used in this figure: (A-E) 3XElavGS > UAS chinmo: P{elav-Switch.O}GS −1A / +; P{elav-Switch.O}GS-3A, P{elav-Switch.O} GSG301/P {w+, UAS-chin::SV40}/+.
Figure 7—figure supplement 2
Over expression of chinmo in adult neurons upregulates cytoplasmic processes.
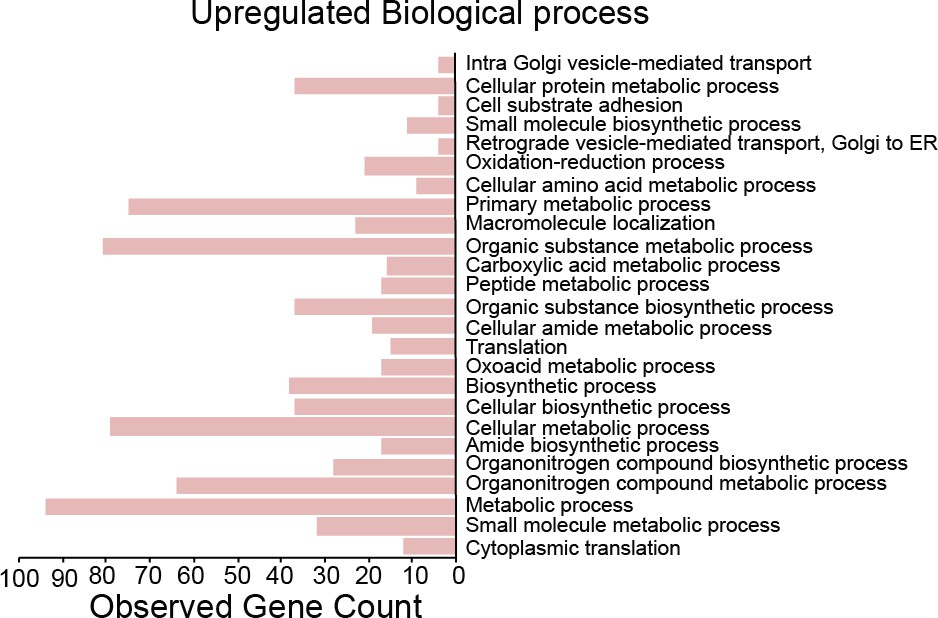
Twenty-five most significant biological processes that are upregulated upon overexpression of chinmo in adult neurons.
Figure 7—figure supplement 3
Molecular and survival analysis of strains utilized in Figure 7.
(A) Overexpression of flag Chinmo in the adult brain neurons leads to a reduction in Fatp protein. Western blot analysis of adult fly lysates from 3X ElavGS >UAS Flag chinmo flies that were fed an AL diet in presence (+AL) or absence (AL-) of RU-486. The whole fly cell lysates were analyzed by western blotting with Flag (Flag Chinmo), Fatp and Tubulin (normalization control) antibodies. Fatp levels reduced upon overexpression of Flag chinmo. (B) Quantitative RT-PCR of fasn1 from abdominal tissue of FB GS >UAS fasn1RNAi flies in presence of RU-486 (light red and light blue) or in absence of RU-486 (bars with solid red and blue color) flies that were fed Ad libitum (AL) (red) or DR diet (blue) for 10 days. Expression levels were normalized to Actin. Values are mean ± SD, n = 6. (C) Quantitative RT-PCR of fatp from abdominal tissue of FB GS >UAS fatpRNAi flies in presence of RU-486 (light red and light blue) or in absence of RU-486 (bars with solid red and blue color) flies that were fed Ad libitum (AL) (red) or DR diet (blue) for 10 days. Expression levels were normalized to Actin. Values are mean ± SD, n = 6. Fatp is more significantly knocked down under DR conditions. (D) Western blot of whole fly lysates from FB GS/+; UAS Flag fatp/+flies that were fed an AL and DR diet in presence (AL+, DR+) and absence (-AL, -DR) of RU-486. The whole fly cell lysates were analyzed by western blotting with Flag (Flag Fatp), Fatp, and Tubulin (normalization control) antibodies. Flag Fatp was detected in AL + and DR +lysates. (E-G) Effect of RU-486 on the lifespan of UAS fasnRNAi, UAS fatpRNAi, and UAS Flag fatp flies. (E) Crosses were established between UAS fasnRNAi and w1118 and the progeny was sorted into four groups (AL-, DR-, AL +, and DR+). Median lifespan in: AL- is 28 days; AL + is 26 days: DR- is 50 days and DR +is 46 days. (F) Crosses were established between UAS fatpRNAi and w1118 and the progeny was sorted into four groups (AL-, DR-, AL +, and DR+). Median lifespan in: AL- is 36 days; AL + is 32 days: DR- is 38 days and DR +is 42 days. (G) Crosses were established between UAS Flag fatp and w1118 and the progeny was sorted into four groups (AL-, DR-, AL + and DR+). Median lifespan in: AL- is 26 days; AL + is 32 days: DR- is 46 days and DR +is 48 days. For statistical comparison of survival curves, p values and Χ2 were calculated with log-rank test. Genotypes of strains used in this figure: (A) 3X ElavGS >UAS Flag chinmo: P{elav-Switch.O}GS −1A / +; P{elav-Switch.O}GS-3A, P{elav-Switch.O} GSG301/P{w+, UAS-chin::SV40}/+; (B) FBGS /+;UASfasnRNAi/+: w1118; P{w [+mW.hs]=Switch1}106/+;P{y[+t7.7]v[+t1.8]=TRiP.HMS01524}attP2/+;(C) FBGS/+;UASfatpRNAi/+:w[1118];P{w[+mW.hs]=Switch1}106/+;P{y[+t7.7]v[+t1.8]=TRiP.HMC04206}attP2/+; (D) FBGS/+; UAS Flag fatp/+; w[1118]; P{w [+mW.hs]=Switch1}106/+;P{w+,UAS-Flag fatp}attP2/+; (E) UASfasn1RNAi/+: w1118; +/+; P {y[+t7.7]v [+t1.8]=TRiP. HMS01524} attP2/+; (F) UAS fatpRNAi/+:w1118;+/+;P{y[+t7.7]v[+t1.8]=TRiP. HMC04206} attP2/+; (G) UAS Flag fatp/+: w1118;+/+; P{w+, UAS-Flag fatp} attP2 / +.
-
Figure 7—figure supplement 3—source data 1
Uncropped western blots with relevant bands labeled for Figure 7—figure supplement 3A and D.
- https://cdn.elifesciences.org/articles/62621/elife-62621-fig7-figsupp3-data1-v2.docx
-
Figure 7—figure supplement 3—source data 2
Original image files of the unedited for western blots in Figure 7—figure supplement 3A.
- https://cdn.elifesciences.org/articles/62621/elife-62621-fig7-figsupp3-data2-v2.zip
-
Figure 7—figure supplement 3—source data 3
Original image files of the unedited for western blots in Figure 7—figure supplement 3D.
- https://cdn.elifesciences.org/articles/62621/elife-62621-fig7-figsupp3-data3-v2.zip
-
Figure 7—figure supplement 3—source data 4
Survival proportions of lifespan curves of strains used in Figure 7—figure supplement 3E–G.
- https://cdn.elifesciences.org/articles/62621/elife-62621-fig7-figsupp3-data4-v2.xlsx
Figure 8 with 1 supplement
Overexpression of human primary miR-125b-1 in the adult fat tissue promotes longevity and increases TAG levels under both AL and DR conditions.
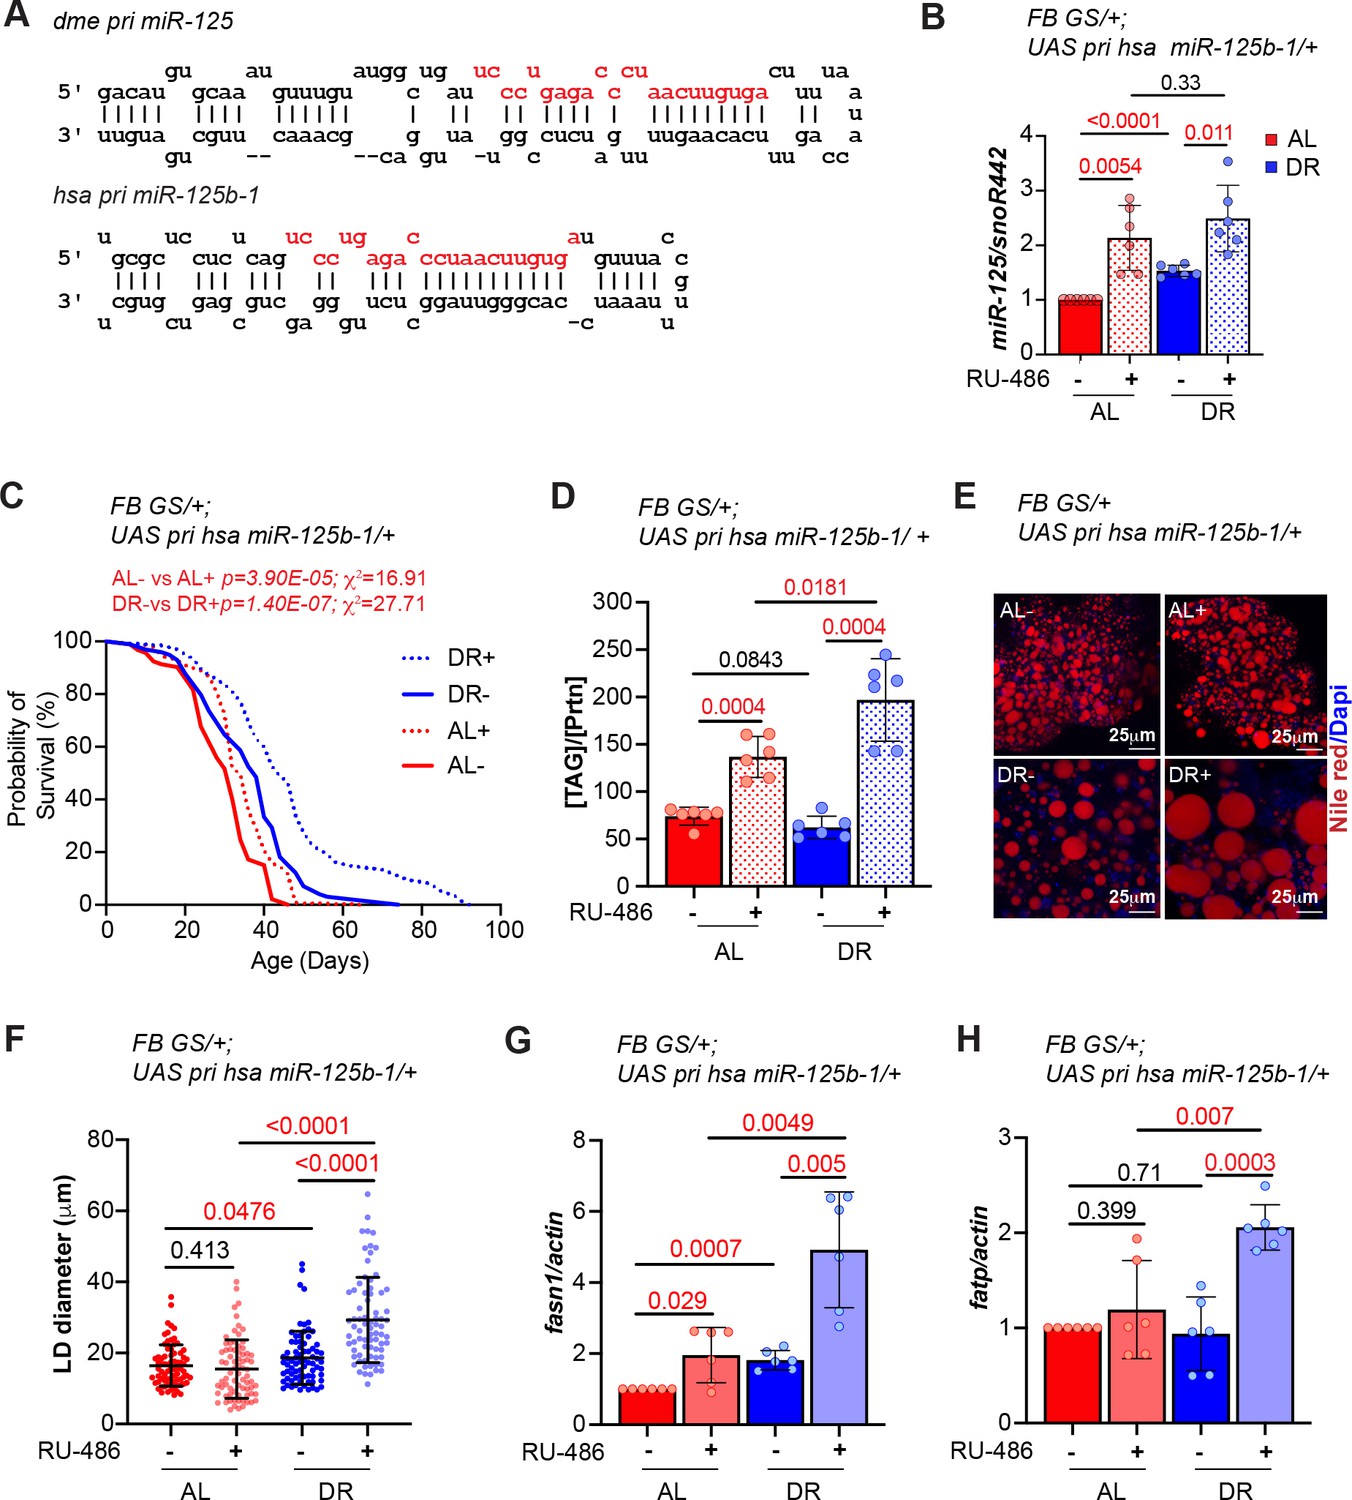
(A) Schematic of Drosophila melanogaster primary miR-125 (pri miR-125) transcript and the Homo sapiens primary miR-125b-1 (pri hsa miR-125b-1) indicating that the processed miRNA sequence in fruit flies and humans is identical. (B) Quantitative RT-PCR of miR-125 from abdominal tissue of FB GS >UAS chinmo flies in presence of RU-486 (bars with red and blue pattern) or in absence of RU-486 (bars with solid red and blue color) in flies that were fed Ad libitum (AL) (red) or DR diet (blue) for 20 days. Expression levels were normalized to SnoR442. Values are mean ± SD, n = 6. (C) Overexpression of hsa pri miR-125 increases lifespan in flies that are fed an AL or DR diet (Compare red and blue dotted lines with red and blue solid line) (See Figure 8—source data 1A–B for number of flies and median and maximum lifespan). The p values and Χ2 values indicate that the increase in lifespan is greater under DR conditions. (D) FB GS >UAS hsa pri miR-125b-1 flies store increased levels of triglycerides (TAG) when fed an AL or DR diet. Quantitation of TAG stored levels in -RU-486 and +RU-486 fed 20 d old FBGS >UAS hsa pri miR-125b-1 flies. (E) Fat bodies/abdomens of female flies were dissected and stained for the content and diameter of lipid droplet (LD) (red are lipid droplets stained with Nile red and blue is Dapi). Scale bar, 25 μm. (F) Quantitation of lipid droplet (LD) diameter in (E). Quantitation of 15 largest LDs in five samples per condition. Error bars represent ± SD. (G, H) Overexpression of hsa pri miR-125 upregulates fasn1 but not fatp under AL conditions. RT-PCR quantitation of mRNA levels of fasn1 (G) and fatp (H) in the fat tissue of FB GS >UAS hsa pri mir-125 flies that were fed an AL (red and pink bars) or DR diet (dark blue and light blue) under uninduced (red and dark blue bars) and induced (pink and light blue bars) conditions for 20 days. Expression levels were normalized to Actin5c. Values are mean ± SD, n ≥ 6. Genotypes of strains used in this figure: (B-H) FBGS/+; UAS has pri miR-125b-1: w1118; P{w[+mW.hs]=Switch1}106/+; P{v+, UAS-hsa miR-125b-1} VK00033/+.
-
Figure 8—source data 1
Lifespan analysis of FBGS >UAS hsa pri miR-125b-1 strain.
- https://cdn.elifesciences.org/articles/62621/elife-62621-fig8-data1-v2.docx
-
Figure 8—source data 2
Survival proportions of lifespan curves of strains used in Figure 8C.
- https://cdn.elifesciences.org/articles/62621/elife-62621-fig8-data2-v2.xlsx
Figure 8—figure supplement 1
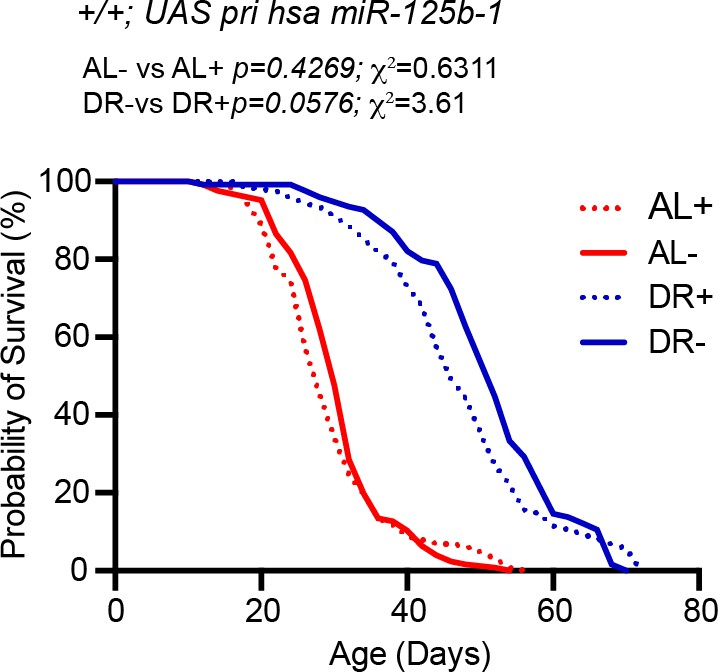
Effect of RU on lifespan of UAS pri hsa miR-125b-1>w1118 flies.
To test if RU486 affects lifespan of flies expressing the UAS pri hsa miR-125b-1 transgene. Median lifespan in: AL- is 30 days; AL + is 28 days: DR- is 52 days and DR +is 46 days. Please refer to Figure 8—figure supplement 1—source data 1 for the second replicate of this experiment. Genotype of strain used in this Figure: +/+; UAS pri has miR-125b-1: w1118; +/+; P{v+, UAS-hsa miR-125b-1} VK00033/+.
-
Figure 8—figure supplement 1—source data 1
Lifespan analysis of UAS has pri miR-125b-1/+ strain.
- https://cdn.elifesciences.org/articles/62621/elife-62621-fig8-figsupp1-data1-v2.docx
-
Figure 8—figure supplement 1—source data 2
Survival proportions of lifespan curve of strain used in Figure 8—figure supplement 1.
- https://cdn.elifesciences.org/articles/62621/elife-62621-fig8-figsupp1-data2-v2.xlsx
Figure 9
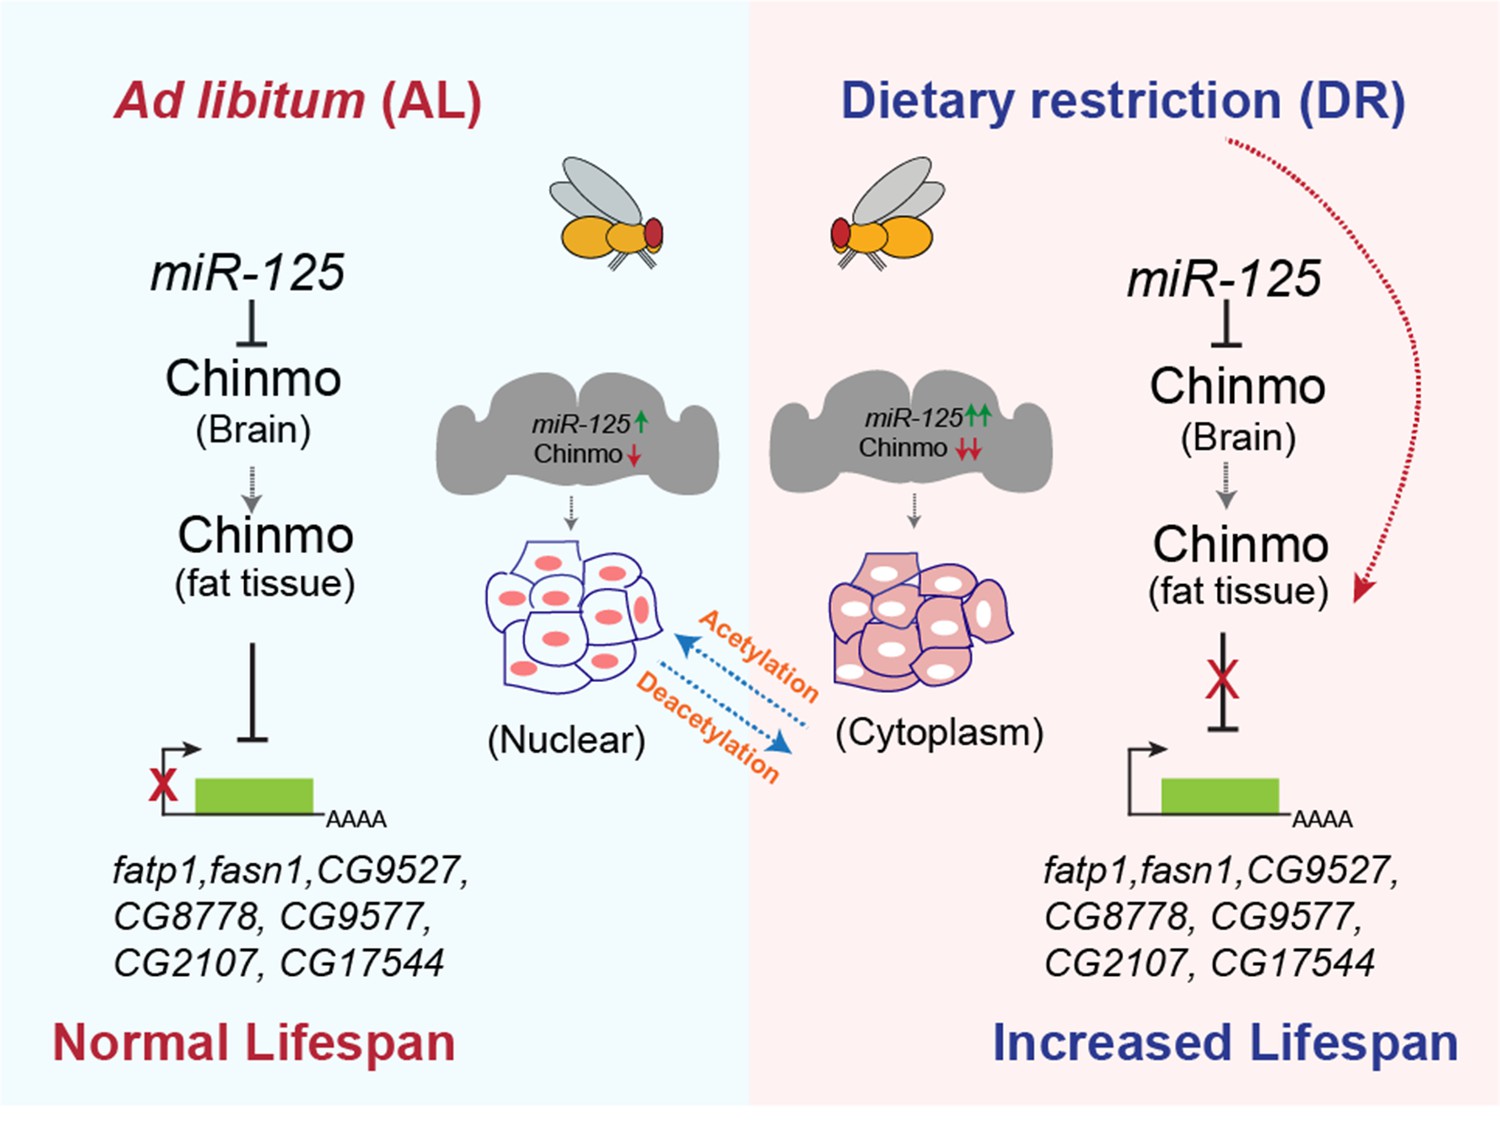
miR-125 regulates DR-dependent lifespan extension by post-transcriptionally silencing chinmo.
Proposed model summarizing the mechanism by which miR-125 and chinmo regulate lifespan extension by DR. miR-125 targets chinmo mRNA in the brain under AL and DR conditions. In the adult fat tissue, Chinmo transcriptionally represses genes involved in fat metabolism. DR-mediated cytoplasmic relocalization of Chinmo in the fat tissue relieves transcriptional repression of genes involved in fat metabolism, thus increasing lifespan.
Author response image 1
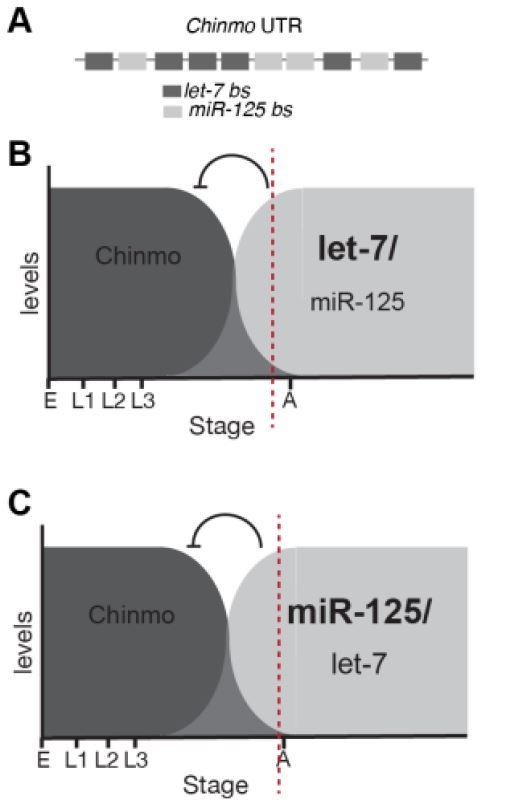
Chinmo is silenced by let-7 and miR-125 in a biphasic manner.
(A) Schematic of a 1.4kb Chinmo 3’UTR fragment indicating number and arrangement of let-7 and miR-125 binding sites. (B) Chinmo derepression is significantly higher in let-7 mutant brains dissected from staged pupae (24h and 96h after puparium formation)(red dashed lines indicates the stage at which let-7 represses chinmo) (C) Chinmo is predominantly regulated by miR-125 in adult flies as the degree of depression of chinmo in ΔmiR-125 flies is more widespread and higher in miR-125 mutants than in Δlet-7 adult fly brains (Day-3 after eclosion)(red dashed lines indicates late pupal stage).
Author response image 2
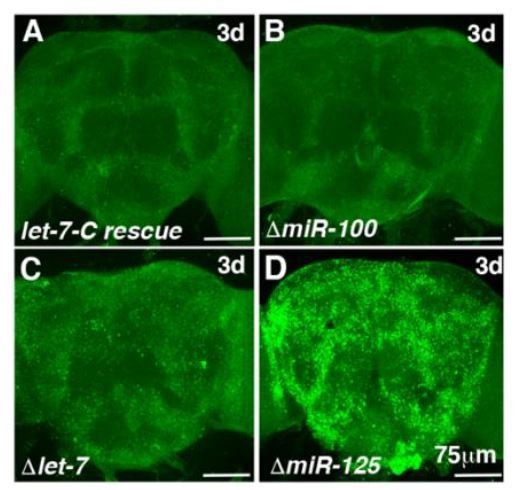
miR-125 is the predominant miRNA that silences chinmo in adult flies.
(A-D) Confocal images of 3d adult brains immunostained for Chinmo (green). No Chinmo expression was detected in brains of flies harboring either the wild type of the ΔmiR-100 transgene (panels A and B). The level of Chinmo expression in ΔmiR-125 mutants is much higher than in Δlet-7 mutant adult flies (compare panels C and D).
Tables
Key resources table
| Reagent type (species) or resource | Designation | Source or reference | Identifiers | Additional information |
|---|---|---|---|---|
| Antibody | Anti-GFP(chicken) | Thermo Fisher Scientific | A10262, RRID:AB_2534023 | 1:2500/1:1000 |
| Antibody | Anti-Flag(mouse) | Sigma-Aldrich | F-1804, RRID:AB_262044 | 1: 2500 |
| Antibody | Anti-Fatp(rabbit) | Gift from B. Mollereau Dourlen et al., 2012 | 1:200 | |
| Antibody | Anti-acetyl lysine | Cell Signaling | #9441; RRID:AB_331805 | 1:750 |
| Antibody | Anti-chinmo (rat) | Gift from Nick Sokol (Wu et al., 2012) | 1:1000 | |
| Antibody | Anti-Woc(rabbit) | Gift from Maurizio Gatti (Raffa et al., 2005) | 1:1000 | |
| Antibody | Anti-La(rabbit) | Gift from S.L. Wolin (Yoo and Wolin, 1994) | 1:1000 | |
| Antibody | Anti-tubulin(mouse) | Sigma-Aldrich | T9026, RRID:AB_477593 | 1:4000 |
| Antibody | Anti-dCsp1(mouse) | DSHB | DSHB Cat# ab49, RRID:AB_2307340 | 1:1000 |
| Antibody | Anti-Syntaxin 1A (mouse) | DSHB | DSHB Cat# 8C3, RRID:AB_528484 | 1:500 |
| Antibody | Anti-HrsFL(Guinea Pig) | Gift from Hugo Bellen | 1:2000 | |
| Antibody | Anti-mouse HRP | Jackson Immuno Research, Laboratories, Inc | 115-035-003, RRID:AB_10015289 | 1: 2500 |
| Antibody | Anti-chicken HRP | Sigma-Aldrich | A9046, RRID:AB_258432 | 1: 2500 |
| Antibody | Anti-Rabbit HRP | Jackson Immuno Research, Laboratories, Inc | 111-035-003, RRID:AB_2313567 | 1: 2500 |
| Antibody | Alexa Fluor 488 Affinipure Donkey anti-chicken IgY | Jackson Immuno Research, Laboratories, Inc | 703-545-155, RRID:AB_2340375 | 1:1000 |
| Antibody | Alexa Fluor 488 Affinipure Donkey anti-Rat IgG | Jackson Immuno Research, Laboratories, Inc | 712-545-153, RRID:AB_2340684 | 1:1000 |
| Antibody | Alexa Fluor 488 Affinipure Donkey anti-Mouse IgG | Jackson Immuno Research, Laboratories, Inc | 712-545-151; RRID:AB_2340846 | 1:1000 |
| Antibody | Goat-anti-Rabbit IgG, Alexa Fluor 568 | Thermo Fisher Scientific | A-11036, RRID:AB_10563566 | 1:1000 |
| Antibody | Alexa Fluor 568 Goat-anti-Mouse IgG | Thermo Fisher Scientific | A-11031, RRID:AB_144696 | 1:1000 |
| Chemical compound, drug | Nile Red | Sigma-Aldrich | 72485 | 1:250 |
| Other | Normal goat serum | Jackson Immuno Research, Laboratories, Inc | 005-000-121, RRID:AB_2336990 | |
| Chemical compound, drug | Deacetylase inhibitor cocktail | ApexBio | K1017 | 1:100 |
| Chemical compound, drug | Phospho Safe Extraction reagent | Merck | 71296 | |
| Other | Anti-Flag M2-Affinity gel | Sigma-Aldrich | A2220, RRID:AB_10063035 | Resin |
| Peptide, recombinant protein | Flag peptide | Sigma-Aldrich | F4799 | |
| Chemical compound, drug | SYBR Premix Ex Taq | Takara Bio | RR420A | |
| Commercial assay or kit | Taqman Fast advanced mix | Thermo Fisher Scientific | 4444557 | |
| Sequence-based reagent | Taqman microRNA assay for miR-100 | Thermo Fisher Scientific | Assay ID 000287 | |
| Sequence-based reagent | Taqman probes for let-7–5 p | Thermo Fisher Scientific | Assay ID 000332 | |
| Sequence-based reagent | Taqman probes for miR-125–5 p | Thermo Fisher Scientific | Assay ID 000449 | |
| Sequence-based reagent | Taqman probes for Sno446 | Thermo Fisher Scientific | Assay ID 001742 | |
| Sequence-based reagent | Taqman probes for 2S rRNA | ThermFisher Scientific | Assay ID 001766 | |
| Other | HyClone CCM3 cell culture media | Cytiva | SH30061.01 | |
| Chemical compound,drug | RNAiso Plus | Takara Bio | 9109 | |
| Chemical compound, drug | Phenol: Chloroform | Sigma-Aldrich | P1944 | |
| Transfection construct | Lipofectamine 3000 Transfection Reagent | Thermo Fisher Scientific | L3000015 | |
| Other | DNAse I (RNAse-free) | New England BioLabs, Inc | NEB Catalog #: M0303 | Enzyme |
| Commercial assay or kit | Triglyceride reagent | Sigma-Aldrich | T2449 | |
| Commercial assay or kit | Free Glycerol reagent | Sigma-Aldrich | F6428 | |
| Recombinant DNA reagent | TopoXL cloning kit | Thermo Fisher Scientific | K804010 | |
| Commercial assay or kit | High-Capacity Reverse Transcription assay kit | Thermo Fisher Scientific | 4368814 | |
| Other | SUPERase In RNAse Inhibitor | Thermo Fisher Scientific | AM2696 | RNAase inhibitor |
| Other | dNTP set 100 mM solutions | Thermo Fisher Scientific | R0181 | dNTPs |
| Other | Superscript IV Reverse Transcriptase | Thermo Fisher Scientific | 18090050 | Enzyme |
| Other | Phusion High-Fidelity DNA Polymerase | New England BioLabs, Inc | NEB Catalog# M0530S | Enzyme |
| Recombinant DNA reagent | Quick Ligation Kit | New England BioLabs, Inc | NEB Catalog# M2200L | |
| Genetic reagent (D. melanogaster) | w1118 | Bloomington Drosophila Stock Centre | ||
| Genetic reagent (D. melanogaster) | let-7-CGKI | Sokol et al., 2008 | ||
| Genetic reagent (D. melanogaster) | let-7-CKO2 | Wu et al., 2012 | ||
| Genetic reagent (D. melanogaster) | chinmo1 | Zhu et al., 2006 | ||
| Genetic reagent (D. melanogaster) | P{w+, UAS-Chin::SV40} | Chawla et al., 2016 | ||
| Genetic reagent (D. melanogaster) | P{w+, UAS-chinmoRNAi 148} VK00033 | Chawla et al., 2016 | ||
| Genetic reagent (D. melanogaster) | P{w+, UAS-hsa miR-125b-1} VK00033 | |||
| Genetic reagent (D. melanogaster) | P{v+, let-7-C ΔmiR-100}attP2 | Chawla et al., 2016 | ||
| Genetic reagent (D. melanogaster) | P{v+, let-7-C Δlet-7}attP2 | Chawla et al., 2016 | ||
| Genetic reagent (D. melanogaster) | P{v+, let-7-CΔmiR-125}attP2 | Chawla et al., 2016 | ||
| Genetic reagent (D. melanogaster) | P{w+, let-7-Cp3.3kb::cDNA}VK00033 | Chawla and Sokol, 2012 | ||
| Genetic reagent (D. melanogaster) | 3XelavGS | Kind gift from Scott Pletcher | ||
| Genetic reagent (D. melanogaster) | P{w+, UAS-FASN1RNAi-1}attP2 | Bloomington Stock 35775 | ||
| Genetic reagent (D. melanogaster) | P{w+, UAS-FATPRNAi}attP2 | Bloomington Stock 55919 | ||
| Genetic reagent (D. melanogaster) | P{w+, UAS-Flag FATP::SV40} | This study (Chawla Lab) | G. Chawla (Regional Centre for Biotechnology) | |
| Genetic reagent (D. melanogaster) | P{w+, UAS-Flag Chinmo::SV40} | This study (Chawla Lab) | G. Chawla (Regional Centre for Biotechnology) | |
| Genetic reagent (D. melanogaster) | FB-GS | Bloomington Stock 8151 | ||
| Genetic reagent (D. melanogaster) | 5966 (Gut specific GS) | Kind gift from David Walker | ||
| Genetic reagent (D. melanogaster) | Da GS | Kind gift from David Walker | ||
| Genetic reagent (D. melanogaster) | UAS GFP | Bloomington Stock 32198 | ||
| Sequence-based reagent | Primers for RT-PCRs and cloning, see Supplementary file 2 | This study (Chawla Lab) | G. Chawla (Regional Centre for Biotechnology) | |
| Recombinant DNA reagent | UAS Flag Chinmo plasmid | This study (Chawla Lab) | G. Chawla (Regional Centre for Biotechnology) | |
| Recombinant DNA reagent | UAS GFP Chinmo plasmid | This study (Chawla Lab) | G. Chawla (Regional Centre for Biotechnology) | |
| Software, algorithm | OASIS | Han et al., 2016 | https://sbi.postech.ac.kr/oasis/ | |
| Software, algorithm | GraphPad Prism | GraphPad | RRID:SCR_000306 | |
| Software, algorithm | GPS-PAIL 2 | Deng et al., 2016, Li et al., 2006 | http://pail.biocuckoo.org |
Additional files
-
Supplementary file 1
Genotypes used in the study.
- https://cdn.elifesciences.org/articles/62621/elife-62621-supp1-v2.docx
-
Supplementary file 2
Primers used in the study.
- https://cdn.elifesciences.org/articles/62621/elife-62621-supp2-v2.docx
-
Supplementary file 3
Downregulated biological process.
- https://cdn.elifesciences.org/articles/62621/elife-62621-supp3-v2.xlsx
-
Supplementary file 4
Upregulated biological process.
- https://cdn.elifesciences.org/articles/62621/elife-62621-supp4-v2.xlsx
-
Transparent reporting form
- https://cdn.elifesciences.org/articles/62621/elife-62621-transrepform-v2.docx
Download links
A two-part list of links to download the article, or parts of the article, in various formats.
Downloads (link to download the article as PDF)
Open citations (links to open the citations from this article in various online reference manager services)
Cite this article (links to download the citations from this article in formats compatible with various reference manager tools)
miR-125-chinmo pathway regulates dietary restriction-dependent enhancement of lifespan in Drosophila
eLife 10:e62621.
https://doi.org/10.7554/eLife.62621


