Metformin alleviates stress-induced cellular senescence of aging human adipose stromal cells and the ensuing adipocyte dysfunction
- Sorbonne Université, Inserm UMR_S 938, Centre de Recherche Saint-Antoine (CRSA), RHU CARMMA, Institute of Cardiometabolism and Nutrition (ICAN), France
- University Paris-Est Créteil, INSERM, IMRB, France
- CNRS, INSERM UMRS_1124, Faculté des sciences fondamentales et biomédicales, Université de Paris, France
- AP-HP, Tenon Hospital, Department of Plastic Surgery, France
- AP-HP, Saint-Antoine Hospital, Department of Endocrinology, PRISIS, France
Figures
Figure 1
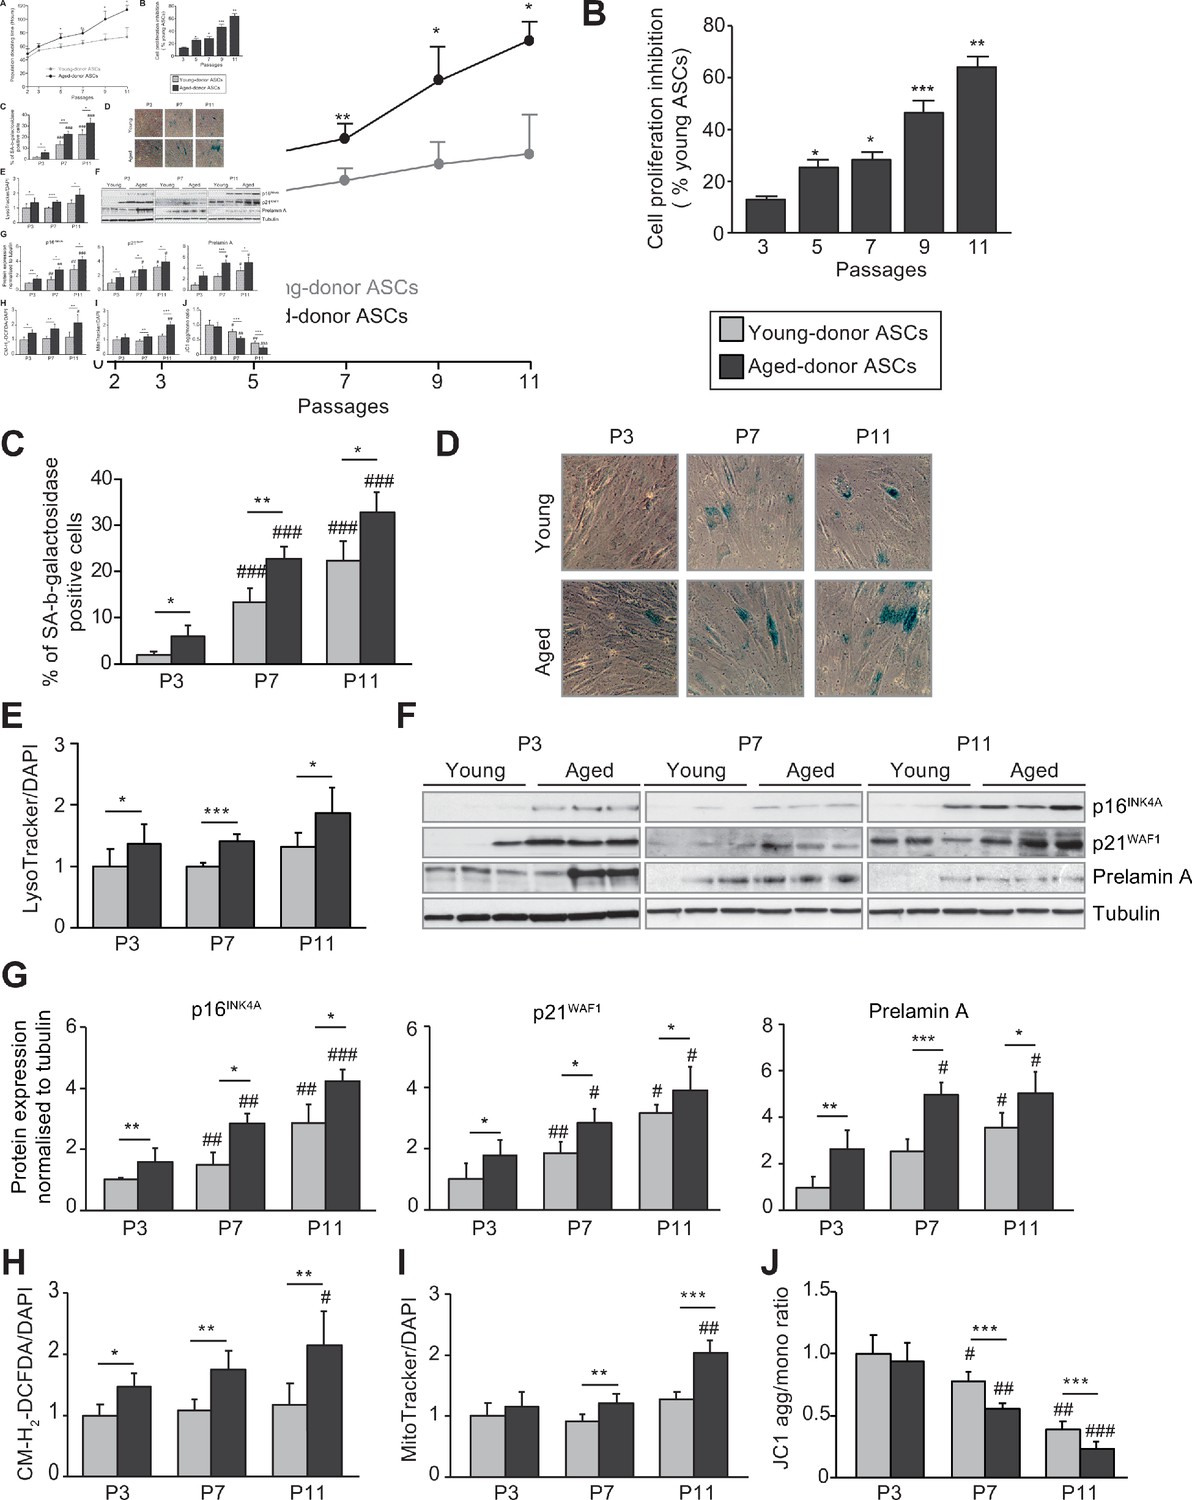
In vivo and in vitro aging are differently associated with senescence, oxidative stress, and mitochondrial dysfunction in cultured adipose-derived stromal cells (ASCs).
After isolation from the abdominal subcutaneous adipose tissue (SCAT) of young (gray circles or bars) and aged (black circles or bars) donors, ASCs were cultured from passages (P) 3–11. (A). Calculation of the mean ± standard error of the mean (SEM) population doubling time (PDT) is described in the Materials and methods section. Times were determined at the indicated passage (n = 9, in triplicate). (B) The % inhibition of cell proliferation was calculated for aged-donor ASCs by determining the increase in total cell number that occurred after 7 days, compared to young-donor ASCs. (C) Senescence was evaluated in terms of senescence-associated (SA)-β-galactosidase activity and expressed as the proportion (in %) of SA-β-galactosidase-positive cells at pH 6 in aged-donor ASCs vs. young-donor ASCs at the same passage (at P3, P7, and P11). (D) Representative micrographs of SA-β-galactosidase-positive cells. (E) Lysosomal accumulation (normalized against 4′,6-diamidino-2-phenylindole dihydrochloride [DAPI]) was assessed with the Lysotracker fluorescence probe and expressed as the fluorescence ratio for aged-donor ASCs vs. young-donor ASCs at P3. (F) Whole-cell lysates of aged-donor and young-donor ASCs at P3, P7, and P11 were analyzed by immunoblotting. Representative immunoblots of the cell cycle arrest markers p16INK4A and p21WAF1, prelamin A, and tubulin (the loading control) from three donors in each group are shown. (G) Quantification of western blot was normalized to young-donor ASCs at P3. (H) Reactive oxygen species production (normalized against DAPI) was assessed by the oxidation of CM-H2DCFDA and expressed as a ratio relative to young-donor ASCs at P3. (I) Mitochondrial mass (normalized against DAPI) was evaluated with Mitotracker Red-Probe and expressed as a ratio relative to young-donor ASCs at P3. (J) The cationic dye JC1 was used to evaluate the mitochondrial membrane potential. The results are expressed as the ratio of aggregate/monomer fluorescence. Results are quoted as the mean ± SEM. *p < 0.05, **p < 0.01, ***p < 0.001 for aged- vs. young-donor ASCs, #p < 0.05, ##p < 0.01, ###p < 0.001 vs. young- or aged-donor ASCs at P3. All experiments were performed in triplicate with ASCs isolated from four different donors in each group.
-
Figure 1—source data 1
SA-ß-galactosidase activity at P3.
- https://cdn.elifesciences.org/articles/62635/elife-62635-fig1-data1-v2.zip
-
Figure 1—source data 2
SA-ß-galactosidase activity at P7.
- https://cdn.elifesciences.org/articles/62635/elife-62635-fig1-data2-v2.zip
-
Figure 1—source data 3
SA-ß-galactosidase activity at P11.
- https://cdn.elifesciences.org/articles/62635/elife-62635-fig1-data3-v2.zip
-
Figure 1—source data 4
Analysis by western blot of senescence markers p16 p21 and prelamin A.
- https://cdn.elifesciences.org/articles/62635/elife-62635-fig1-data4-v2.zip
Figure 2
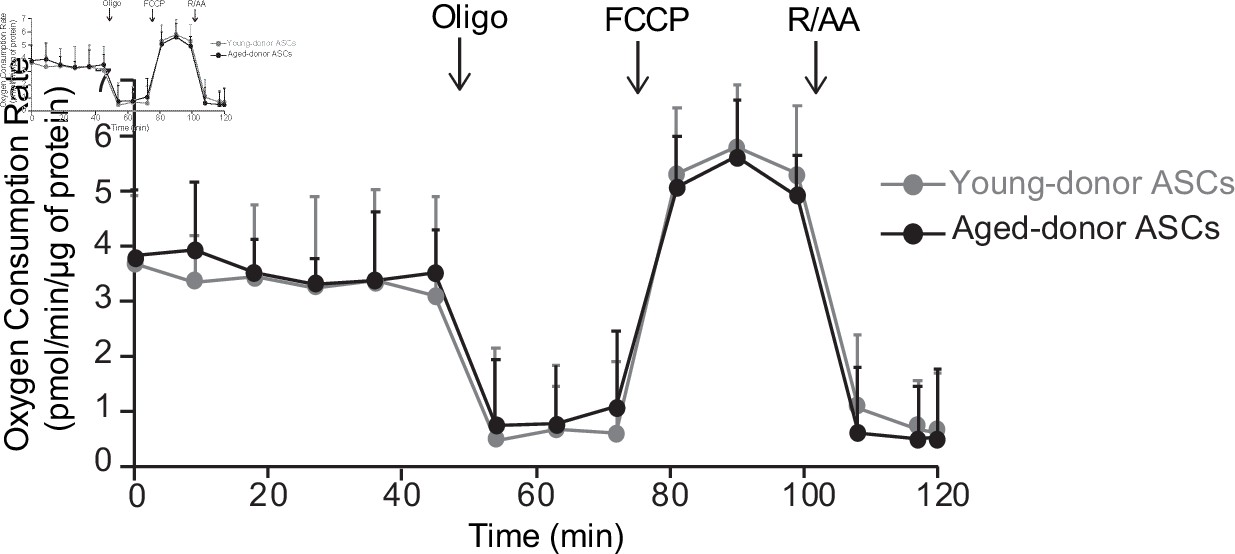
The oxygen consumption rate of young-donor or aged-donor adipose-derived stromal cells (ASCs) is not different at early passage.
Cellular respiration was assessed by the measurement of the oxygen consumption rate (OCR) in young-donor (gray circles) and aged-donor ASCs (black circles) at P3 using Seahorse. OCR was measured at baseline and after sequential addition of oligomycin (oligo: inhibitor of ATP synthase), carbonyl cyanide 4-trifluoromethoxyphenylhydrazone (FCCP: uncoupling agent), and rotenone/antimycin A (R/AA, inhibitors of the respiratory chain complexes I and III). Results are quoted as the mean ± standard error of the mean (SEM). The experiment was performed in triplicate with ASCs isolated from three different donors in each group.
Figure 3
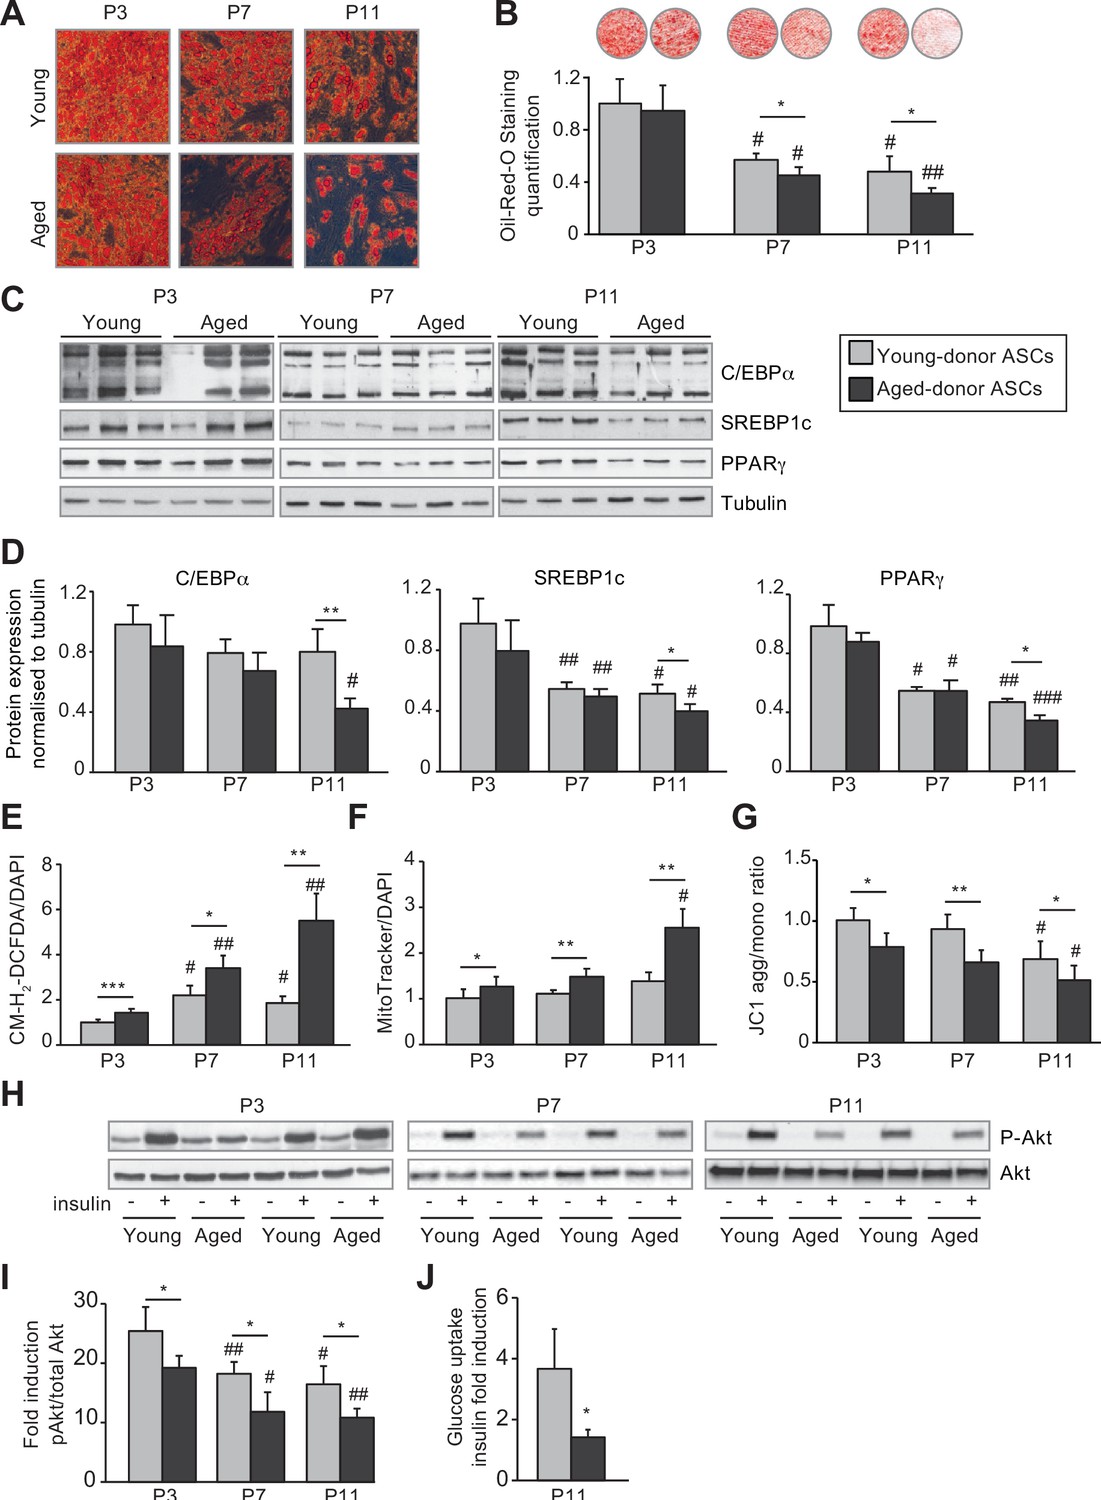
In vivo and in vitro aging are differently associated with adipose dysfunction of adipocytes differentiated from young-donor and aged-donor adipose-derived stromal cells (ASCs).
The ASCs were differentiated into adipocytes for 14 days at P3, P7, and P11. (A) Cells were stained with Oil-Red-O to visualize lipid droplets 14 days post-induction, and representative micrographs are shown. (B) Quantification of Oil-Red-O staining of adipocytes differentiated from ASCs and representative scans of wells are shown. (C) Whole-cell lysates, at day 14 post-induction, of adipocytes differentiated from ASCs isolated from young and aged donors, cultured until P3, P7, and P11, were analyzed by immunoblotting. Representative immunoblots of C/EBPα, SREBP-1c, PPARγ, and tubulin (loading control) are shown. (D) Quantification of western blot was normalized to young-donor ASCs at P3. (E) Reactive oxygen species (ROS) production, normalized against 4′,6-diamidino-2-phenylindole dihydrochloride (DAPI). (F) Mitochondrial mass (normalized against DAPI) and (G) mitochondrial membrane potential were assessed in adipocytes derived from aged-donor ASCs as described in Figure 1. (H) Whole-cell lysates (extracted at day 14 post-induction) of adipocytes differentiated from young- and aged-donor ASCs and stimulated (or not) with insulin were analyzed with immunoblotting. Representative immunoblots of Akt and phospho-Akt (Ser473) are shown. (I) The phosphorylated Akt/total Akt ratio was determined in a densitometric analysis. (J) Insulin sensitivity at P11 in adipocytes differentiated from young- and aged-donor ASCs was evaluated by measuring glucose uptake in basal and insulin-stimulated conditions as described in the Materials and methods section. The insulin fold induction was determined. Results are quoted as the mean ± standard error of the mean (SEM). *p < 0.05, **p < 0.01, ***p < 0.001 for aged-donor vs. young-donor ASCs, #p < 0.05, ##p < 0.01, ###p < 0.001 vs. young- or aged-donor ASCs at P3. All experiments were performed in duplicate or triplicate with ASCs isolated from four different donors in each group.
-
Figure 3—source data 1
Analysis by western blot of sadipogenic markers C/EBPa, SREBP1C and PPARg.
- https://cdn.elifesciences.org/articles/62635/elife-62635-fig3-data1-v2.zip
Figure 4
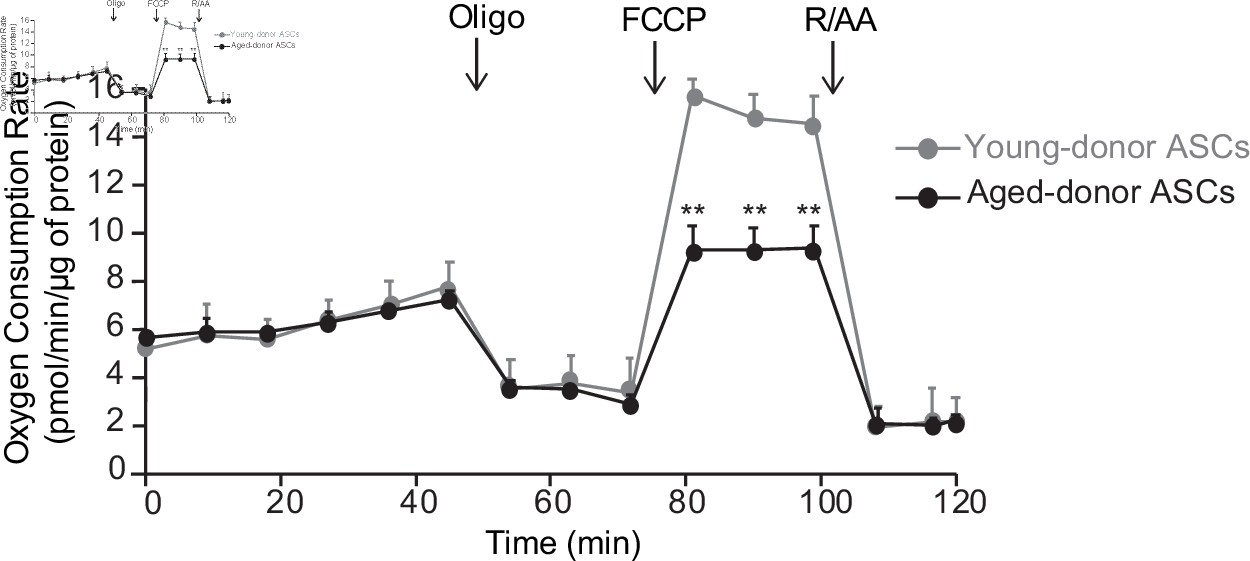
The oxygen consumption rate (OCR) of adipocyte differentiated from young-donor or aged-donor adipose-derived stromal cells (ASCs) is different at early passage.
Cellular respiration was assessed by the measurement of OCR in adipocytes differentiated from young-donor (gray circles) and aged-donor ASCs (black circles) at P3, using Seahorse, at baseline and after sequential addition of oligomycin (oligo), 4-trifluoromethoxyphenylhydrazone (FCCP), and rotenone/antimycin A (R/AA). Results are quoted as the mean ± standard error of the mean (SEM). **p < 0.01, adipocytes differentiated from young-donor ASCs vs. adipocytes differentiated from aged-donor ASCs. The experiment was performed in triplicate with ASCs isolated from three different donors in each group.
Figure 5
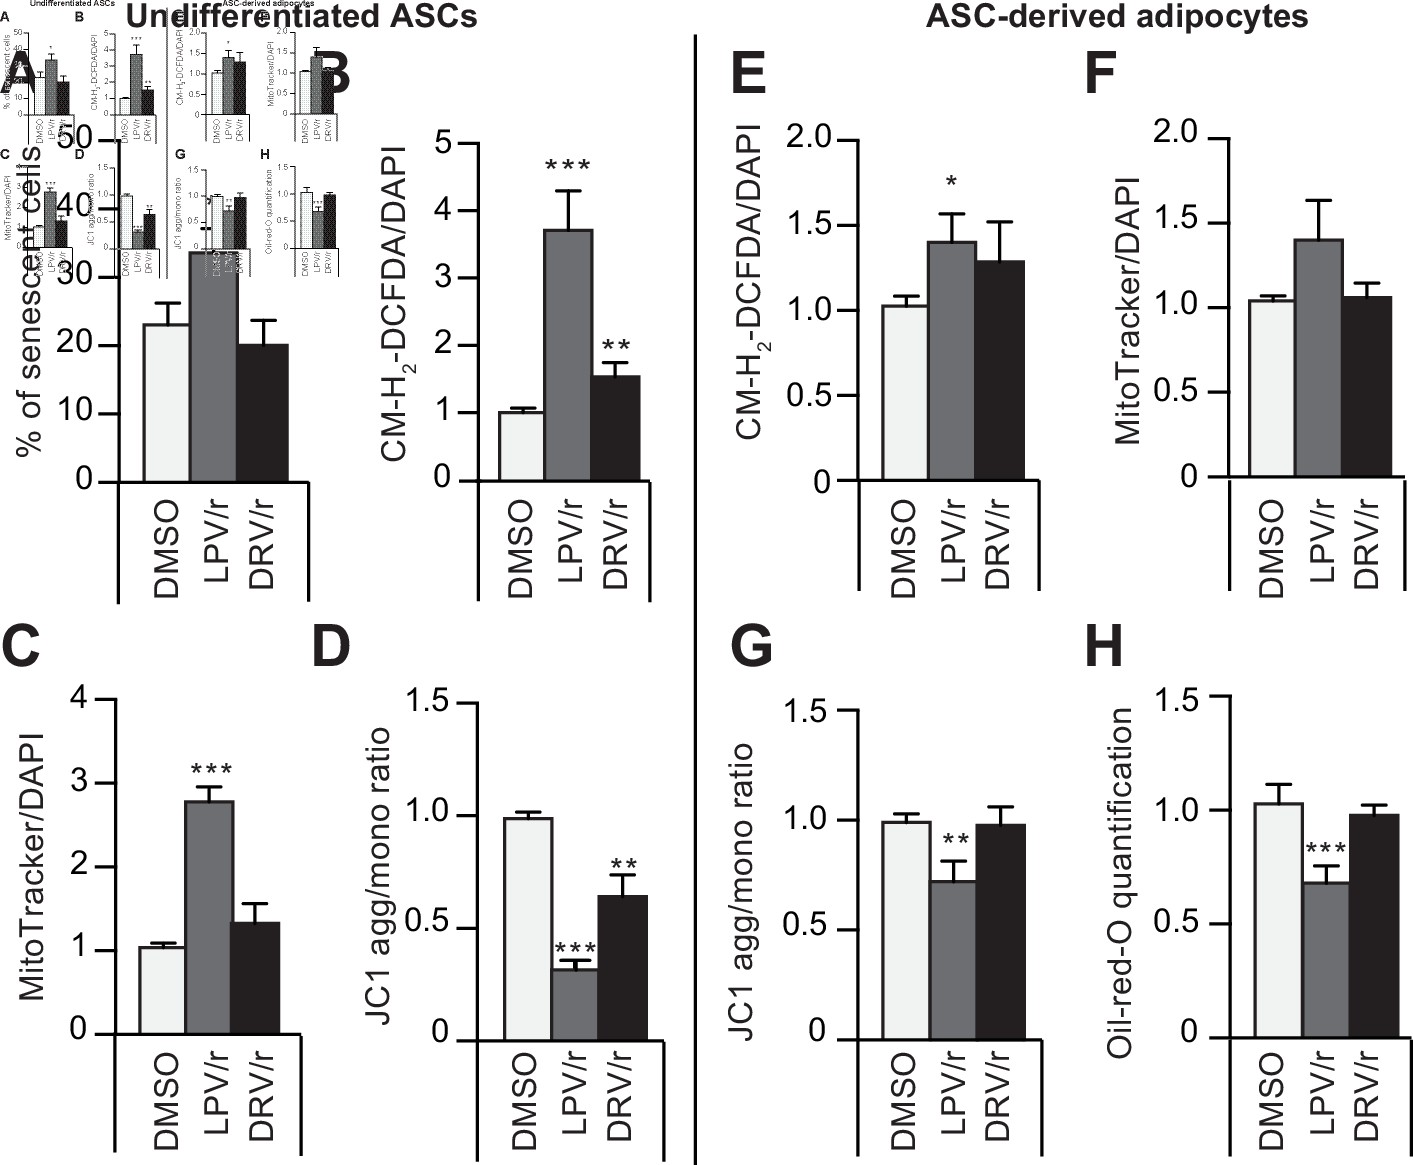
The protease inhibitors (PIs) lopinavir/r and darunavir/r induce, at different extents, in young-donor adipose-derived stromal cells (ASCs) at early passage senescence, oxidative stress, and mitochondrial dysfunction leading or not to altered ASC-derived adipocytes.
ASCs were treated during 30 days with DMSO or PIs: lopinavir (LPV) or darunavir (DRV) associated with a low dose of ritonavir (LPV/r or DRV/r) (A–D). The ASCs were then differentiated into adipocytes for 14 days in the absence of PIs (E–H). (A) ASCs’ senescence was evaluated in terms of senescence-associated (SA)-β-galactosidase activity and expressed as the proportion (in %) of SA-β-galactosidase-positive cells at pH 6. (B) Reactive oxygen species (ROS) production (normalized against 4′,6-diamidino-2-phenylindole dihydrochloride [DAPI]) was assessed by the oxidation of CM-H2DCFDA and expressed as a ratio relative to DMSO. (C) Mitochondrial mass (normalized against DAPI) was evaluated with Mitotracker Red-Probe and expressed as a ratio relative to DMSO. (D) The cationic dye JC1 was used to evaluate the mitochondrial membrane potential. In ASC-derived adipocytes, 14 days post-induction, (E) ROS production (F) mitochondrial mass, and (G) mitochondrial membrane potential normalized to DAPI were evaluated. (H) Cells were stained with Oil-Red-O to visualize lipid droplets. Results are quoted as the mean ± standard error of the mean (SEM). *p < 0.05, **p < 0.01, ***p < 0.001 vs. DMSO. All experiments were performed in triplicate with ASCs isolated from three different donors in each group.
-
Figure 5—source data 1
Impact of HIV protease inhibitors on SA-ß-galactosidase activity.
- https://cdn.elifesciences.org/articles/62635/elife-62635-fig5-data1-v2.zip
Figure 6
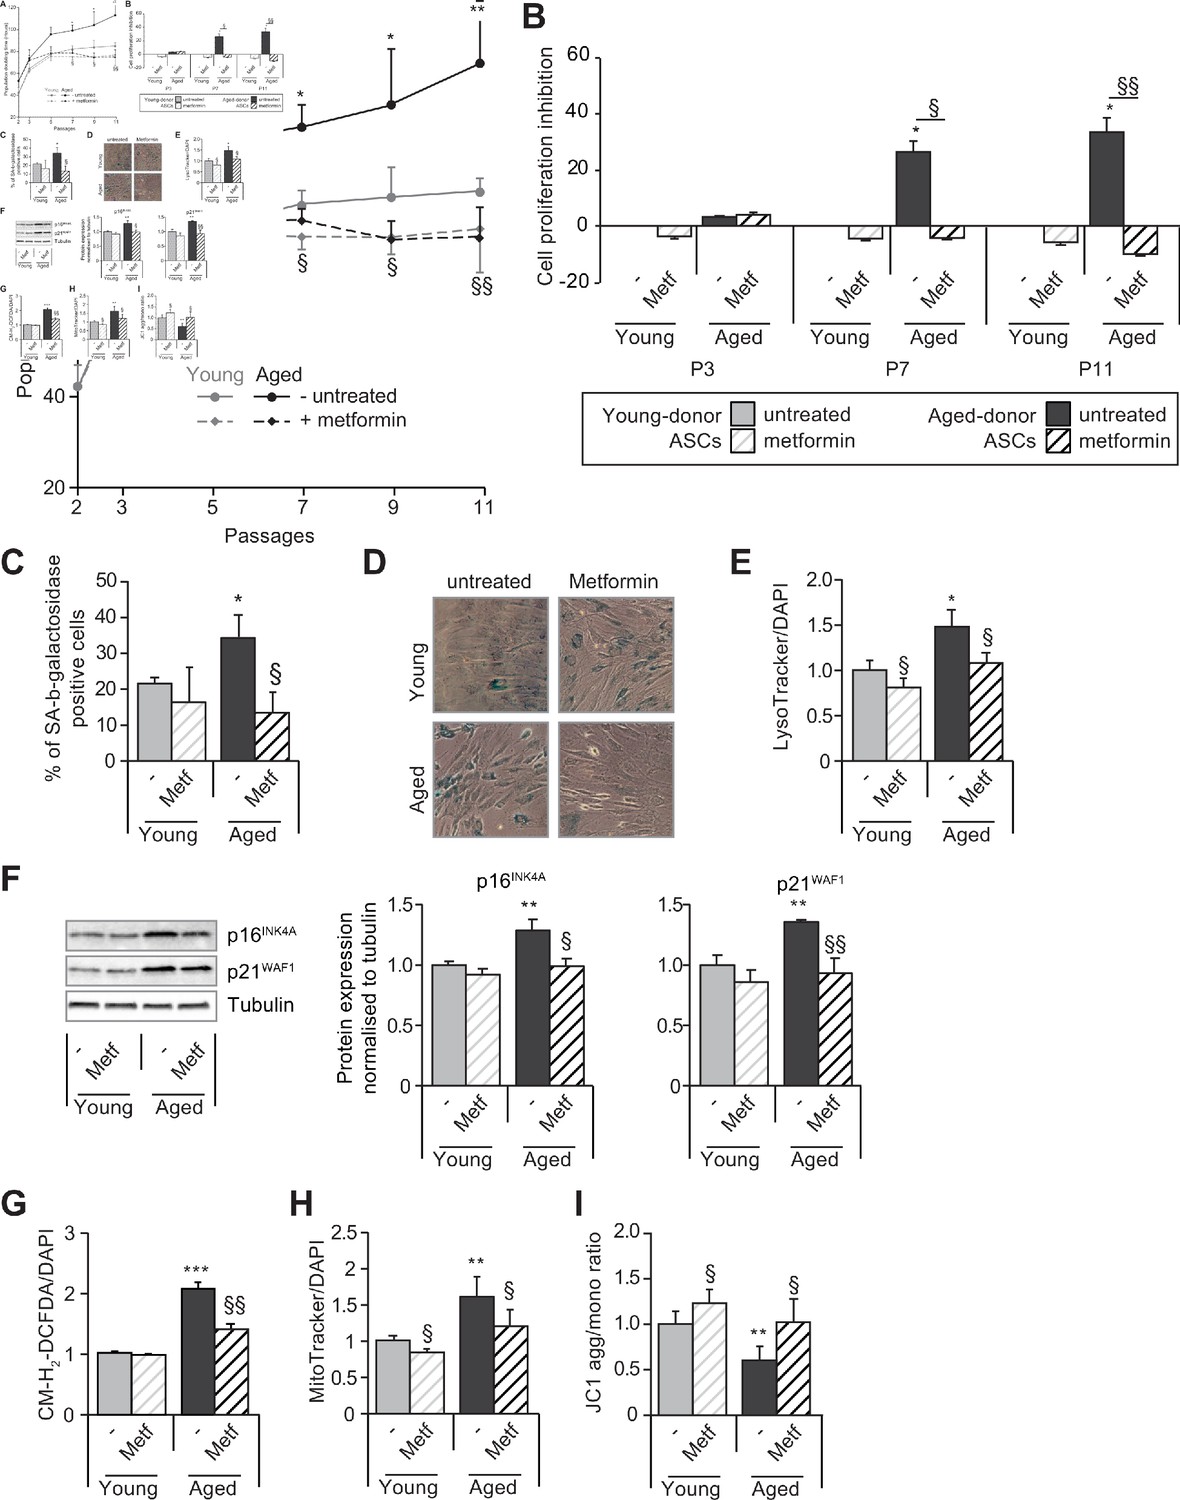
Metformin partially prevents the senescence and associated dysfunctions in adipose-derived stromal cells (ASCs) obtained from aged donors but not in those obtained from young donors.
Metformin (25 µmol/L) was added to the culture medium of aged-donor and young-donor ASCs from P3 onward (young-donor ASC: gray dots and bars in the absence of metformin, gray dotted lines or gray striped bars in the presence of metformin; aged-donor: black circles and bars in the absence of metformin, black dotted lines and striped bars in the presence of metformin). Mean population doubling times (PDT) were determined at the indicated passages in aged-donor and young-donor ASCs treated (or not) with metformin at the same passage. (B) The % inhibition of cell proliferation was calculated for aged-donor ASCs and young-donor ASCs treated by metformin by determining the increase in total cell number that occurred after 7 days, compared to young-donor ASCs. (C) Senescence was evaluated in terms of senescence-associated (SA)-β-galactosidase activity and expressed as the proportion (in %) of SA-β-galactosidase-positive cells at pH 6 in metformin-treated ASCs vs. non-treated ASCs at P11. (D) Representative micrographs of SA-β-galactosidase positive cells. (E) Lysosomal accumulation (normalized against 4′,6-diamidino-2-phenylindole dihydrochloride [DAPI]) was assessed with the Lysotracker fluorescence probe in metformin-treated ASCs vs. non-treated ASCs at P11. (F) Whole-cell lysates of aged-donor and young-donor ASCs treated (or not) with metformin were analyzed at P11 by immunoblotting. Representative immunoblots of the cell cycle arrest markers p16INK4A and p21WAF1 and of tubulin (the loading control) for two donors in each group are shown. Quantitation of western blots, normalized against the values for non-treated young-donor ASCs at P11. (G) Reactive oxygen species (ROS) production, (H) mitochondrial mass (both normalized against DAPI) and (I) mitochondrial membrane potential were assessed as described in Figure 1 in metformin-treated ASCs vs. non-treated ASCs at P11. The results correspond to the mean ± standard error of the mean (SEM). *p < 0.05, **p < 0.01, ***p < 0.001 for aged-donor vs. young-donor ASCs, §p < 0.05, §§p < 0.01 metformin-treated vs. non-treated ASCs. All experiments were performed in duplicate or triplicate in ASCs isolated from three different donors in each group.
-
Figure 6—source data 1
Impact of metformin on SA-ß-galactosidase activity.
- https://cdn.elifesciences.org/articles/62635/elife-62635-fig6-data1-v2.zip
-
Figure 6—source data 2
SA-ß-galactosidase activity in aged and young untreated ASCs.
- https://cdn.elifesciences.org/articles/62635/elife-62635-fig6-data2-v2.zip
-
Figure 6—source data 3
Impact of metformin on p16 p21 protein expression.
- https://cdn.elifesciences.org/articles/62635/elife-62635-fig6-data3-v2.zip
Figure 7 with 1 supplement
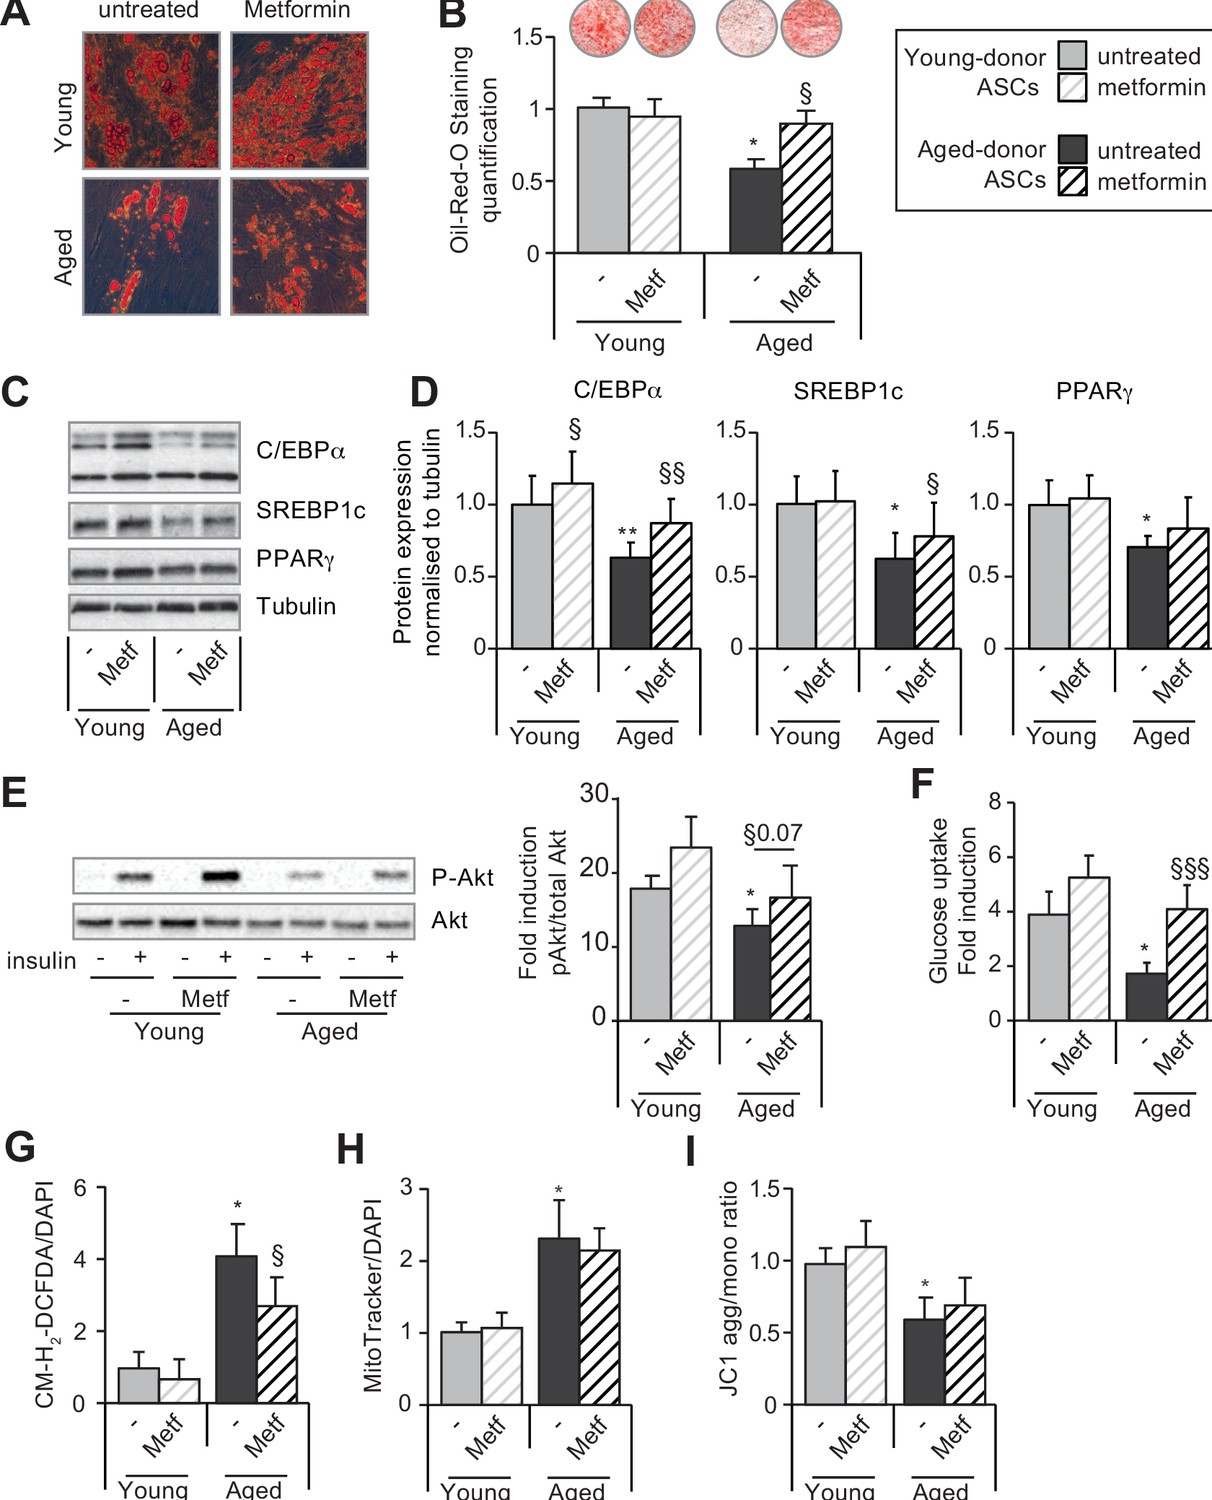
Metformin can improve the adipogenic differentiation capacity of aged-donor but not young-donor adipose-derived stromal cells (ASCs).
Metformin was added to the culture medium of young- and aged-donor ASCs from P3 onward. The ASCs were differentiated into adipocytes for 14 days at P11, in the absence of metformin (young-donor ASC: gray bars in the absence of metformin, gray striped bars in the presence of metformin; aged-donor: black bars in the absence of metformin, black striped bars in the presence of metformin). (A) Cells were stained with Oil-Red-O to visualize lipid droplets 14 days post-induction, and representative micrographs are shown. (B) Quantification of Oil-Red-O staining and representative scans of wells are shown. (C) Whole-cell lysates on day 14 post-induction from adipocytes differentiated from non-treated young-donor and aged-donor ASCs at P11 and treated (or not) with metformin were analyzed by immunoblotting. Representative immunoblots of C/EBPα, SREBP-1c, PPARγ, and tubulin (the loading control) are shown. (D) Quantification of western blots is shown. (E) Whole-cell lysates extracted at day 14 post-induction stimulated (or not) by insulin from differentiated ASCs were analyzed by immunoblotting. Representative immunoblots of Akt and phospho-Akt (Ser473) and quantification of the pAkt/Akt are shown. (F) Insulin sensitivity was evaluated at P11 in adipocytes differentiated from non-treated young-donor and aged-donor ASCs treated (or not) with metformin, by measuring the glucose uptake in response to insulin and calculating the insulin fold induction, as described in the Materials and methods section. (G) Reactive oxygen species (ROS) production, (H) mitochondrial mass, and (I) mitochondrial membrane potential (both normalized against 4′,6-diamidino-2-phenylindole dihydrochloride [DAPI]) were assessed as described in Figure 1. The results are expressed as the mean ± standard error of the mean (SEM). *p < 0.05 for adipocytes differentiated from aged-donor vs. adipocytes differentiated from young-donor ASCs, §p < 0.05, §§p < 0.01, §§§p < 0.001 metformin-treated vs. non-treated adipocytes differentiated from ASCs. All experiments were performed in duplicate on cells isolated from three different donors in each group.
-
Figure 7—source data 1
Impact of metformin on C/EBPa, SREBP1C and PPARg protein expression.
- https://cdn.elifesciences.org/articles/62635/elife-62635-fig7-data1-v2.zip
Figure 7—figure supplement 1
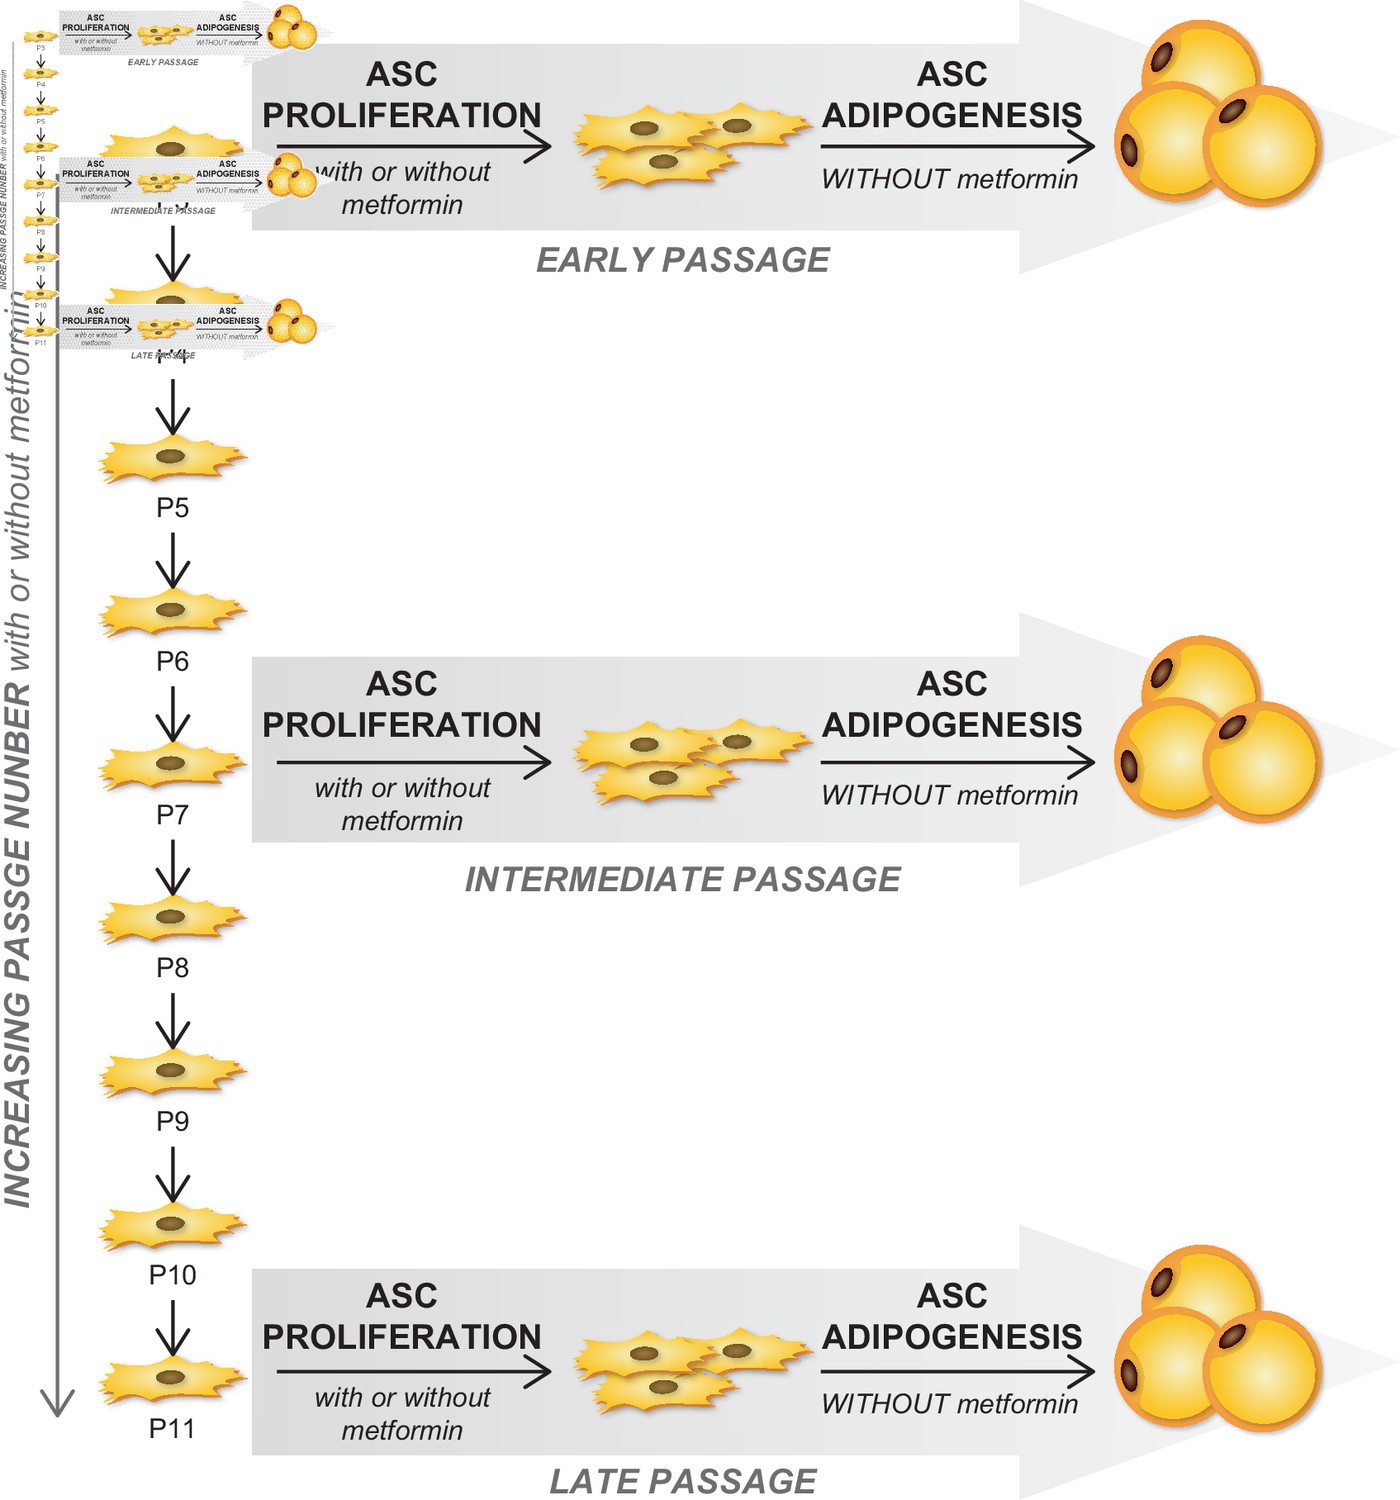
Culture scheme indicating that adipose-derived stromal cells (ASCs) were cultured in the presence or not of metformin along the passages but differentiated in adipocytes in the absence of metformin in the culture medium.
Figure 8 with 2 supplements
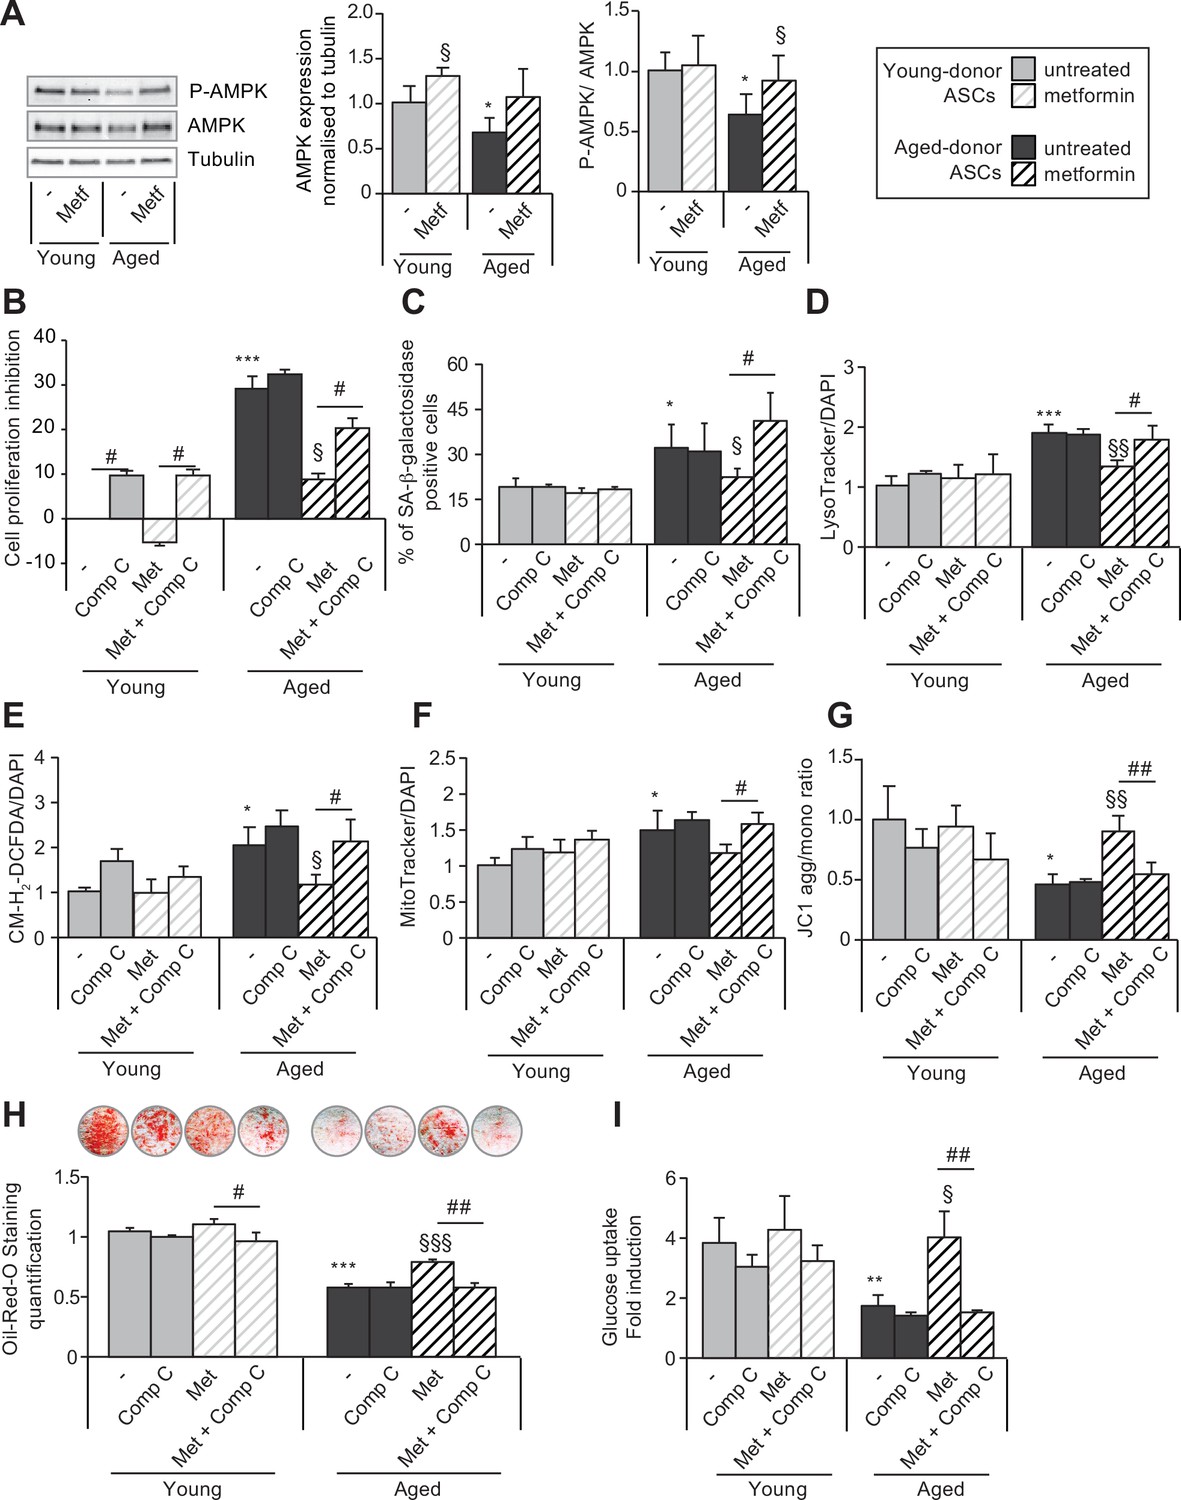
The beneficial effects of metformin on aged-donor adipose-derived stromal cell (ASC) senescence is mediated by AMP-activated protein kinase (AMPK) activation.
Metformin was added to the culture medium of aged-donor and young-donor ASCs from P3 onward. To evaluate the role of AMPK activation, compound C was added at P11. After 7 days of treatment, the experiments on ASCs were carried out (young-donor ASC: gray bars in the absence of metformin or in the presence of compound C, gray striped bars in the presence of metformin or metformin and compound C; aged-donor: black bars in the absence of metformin or in the presence of compound C, black striped bars in the presence of metformin or metformin and compound C). (A) Whole-cell lysates of aged-donor and young-donor ASCs treated (or not) with metformin and compound C at P11 were analyzed by immunoblotting. Representative immunoblots of AMPK, phospho-AMPK, and tubulin (the loading control) and a graph quantifying AMPK (normalized against tubulin) and the pAMPK/AMPK ratio are shown. (B) The % inhibition of cell proliferation was calculated for aged-donor ASCs and young-donor ASCs treated or not with metformin or compound C, by determining the increase in total cell number that occurred after 7 days, compared to young-donor ASCs. (C) Senescence was evaluated in terms of senescence-associated (SA)-β-galactosidase activity and was expressed as described in Figure 1. (D) Lysosomal accumulation (normalized against 4′,6-diamidino-2-phenylindole dihydrochloride [DAPI]) was assessed with the Lysotracker fluorescence probe. (E) Reactive oxygen species (ROS) production, (F) mitochondrial mass (both normalized against DAPI), and (G) mitochondrial membrane potential were assessed as described in Figure 1. (H) The ASCs were then differentiated into adipocytes on P11 in the absence of metformin and compound C. Cells were stained with Oil-Red-O to visualize lipid droplets 14 days post-induction. Quantification of Oil-Red-O staining and representative scans of wells are shown. (I) Insulin sensitivity was evaluated at P11 in adipocytes differentiated from non-treated young-donor and aged-donor ASCs treated (or not) with metformin and/or compound C, by measuring the glucose uptake in response to insulin and calculating the insulin fold induction, as described in the Materials and methods section. Results are expressed as the mean ± standard error of the mean (SEM). *p < 0.05, **p < 0.01 for aged-donor vs. young-donor ASCs, §p < 0.05, §§p < 0.01 for metformin-treated ASCs vs. non-treated ASCs. #p < 0.05, ##p < 0.01 for compound C and metformin-treated ASCs vs. metformin-treated ASCs. All experiments were performed in duplicate or triplicate on ASCs isolated from at three different donors in each group.
-
Figure 8—source data 1
Impact of Compound C on SA-ß-galactosidase activity in aged ASCs.
- https://cdn.elifesciences.org/articles/62635/elife-62635-fig8-data1-v2.zip
-
Figure 8—source data 2
Impact of Compound C on SA-ß-galactosidase activity in young ASCs.
- https://cdn.elifesciences.org/articles/62635/elife-62635-fig8-data2-v2.zip
-
Figure 8—source data 3
Impact of metformin on AMPK protein expression.
- https://cdn.elifesciences.org/articles/62635/elife-62635-fig8-data3-v2.zip
Figure 8—figure supplement 1
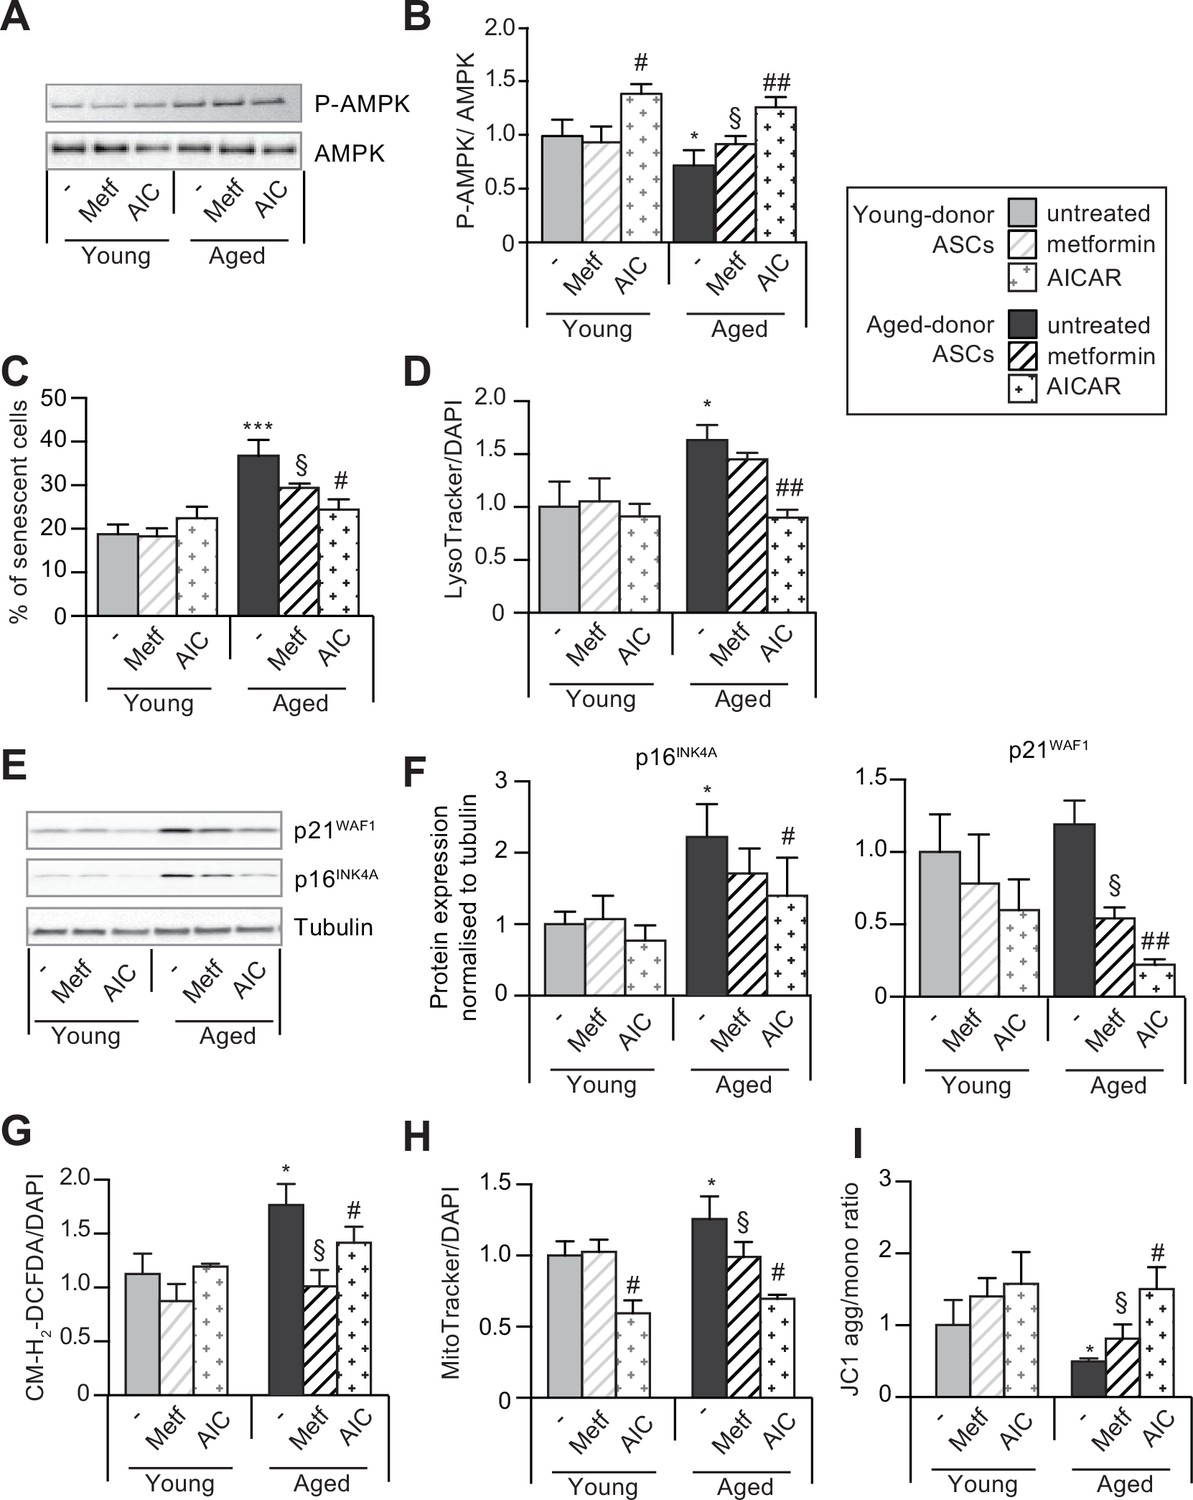
5-Aminoimidazole-4-carboxyamide ribonucleoside (AICAR) can reverse senescence and associated dysfunctions in aged-donor adipose-derived stromal cells (ASCs).
Metformin or AICAR were added to the culture medium of aged-donor and young-donor ASCs at P11. After 7 days of treatment, the experiments on ASCs were carried out. (A) Whole-cell lysates of aged-donor and young-donor ASCs treated (or not) with metformin and AICAR at P11 were analyzed by immunoblotting. Representative immunoblots of AMP-activated protein kinase (AMPK) and phospho-AMPK (pAMPK), and (B) the pAMPK/AMPK ratio are shown. (C) Senescence was evaluated in terms of senescence-associated (SA)-β-galactosidase activity and was expressed as described in Figure 1. (D) Lysosomal accumulation (normalized against 4′,6-diamidino-2-phenylindole dihydrochloride [DAPI]) was assessed with the Lysotracker fluorescence probe. (E) Representative immunoblots of the cell cycle arrest markers p16INK4A and p21WAF1 and tubulin (the loading control) are shown. (F) Quantification of western blot was normalized to young-donor ASCs. (G) Reactive oxygen species production (normalized against DAPI) was assessed by the oxidation of CM-H2DCFDA and expressed as a ratio relative to young-donor ASCs. (H) Mitochondrial mass (normalized against DAPI) expressed as a ratio relative to young-donor ASCs. (I) Mitochondrial membrane potential expressed as a ratio relative to young-donor ASCs. Results are expressed as the mean ± standard error of the mean (SEM). *p < 0.05, ***p < 0.001 for aged-donor vs. young-donor ASCs, §p < 0.05, for metformin-treated ASCs vs. non-treated ASCs. #p < 0.05, ##p < 0.01 for AICAR-treated ASCs vs. non-treated ASCs. All experiments were performed in duplicate or triplicate on ASCs isolated from three different donors in each group.
-
Figure 8—figure supplement 1—source data 1
SA-ß-galactosidase activity in aged and young untreated ASCs.
- https://cdn.elifesciences.org/articles/62635/elife-62635-fig8-figsupp1-data1-v2.zip
-
Figure 8—figure supplement 1—source data 2
SA-ß-galactosidase activity in aged and young metformin treated ASCs.
- https://cdn.elifesciences.org/articles/62635/elife-62635-fig8-figsupp1-data2-v2.zip
-
Figure 8—figure supplement 1—source data 3
SA-ß-galactosidase activity in aged and young AICAR treated ASCs.
- https://cdn.elifesciences.org/articles/62635/elife-62635-fig8-figsupp1-data3-v2.zip
-
Figure
8—figure supplement 1—source data 4. Impact of AICAR on AMPK protein expression.
- https://cdn.elifesciences.org/articles/62635/elife-62635-fig8-figsupp1-data4-v2.zip
Figure 8—figure supplement 2
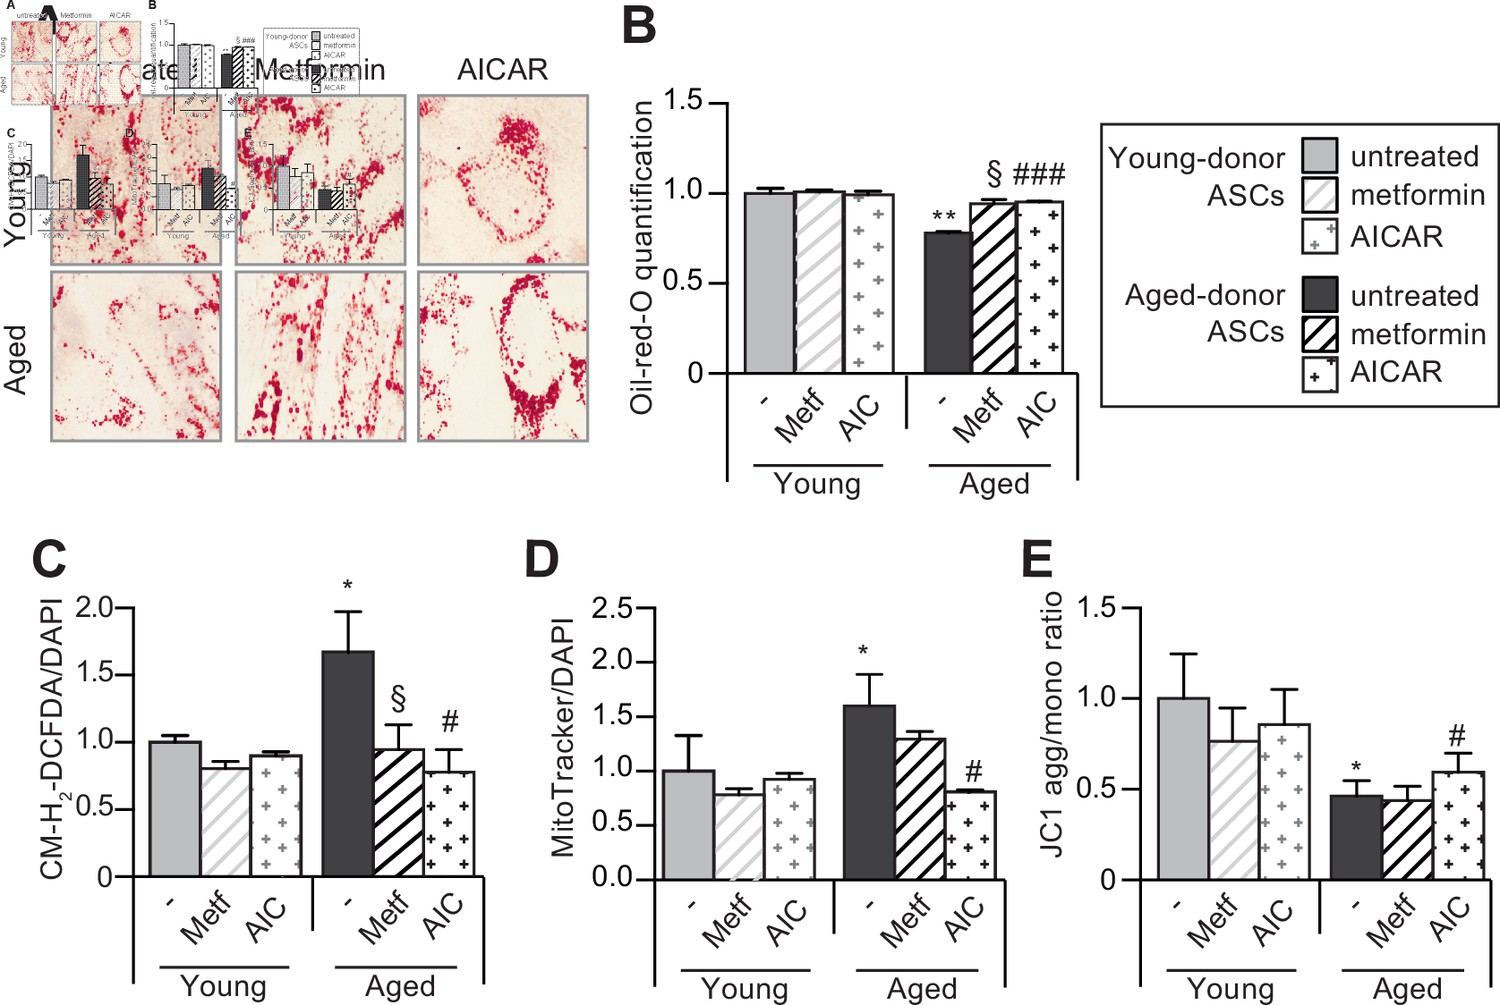
5-Aminoimidazole-4-carboxyamide ribonucleoside (AICAR) can restore the adipogenic differentiation capacity of senescent aged-donor adipose-derived stromal cells (ASCs).
Metformin or AICAR were added to the culture medium of aged-donor and young-donor ASCs at P11. The ASCs were differentiated into adipocytes for 14 days at P11, in the absence of metformin or AICAR. (A) Cells were stained with Oil-Red-O to visualize lipid droplets 14 days post-induction. (B) Representative scans of wells quantification of Oil-Red-O staining are shown. (C) Reactive oxygen species (ROS) production, (D) mitochondrial mass (both normalized against 4′,6-diamidino-2-phenylindole dihydrochloride [DAPI]), and (E) mitochondrial membrane potential were assessed as described in Figure 1. Results are expressed as the mean ± standard error of the mean (SEM). *p < 0.05, **p < 0.01 for aged-donor vs. young-donor ASCs, §p < 0.05 for metformin-treated ASCs vs. non-treated ASCs. #p < 0.05, ###p < 0.001 for AICAR-treated ASCs vs. non-treated ASCs. All experiments were performed in duplicate or triplicate on ASCs isolated from three different donors in each group.
Figure 9
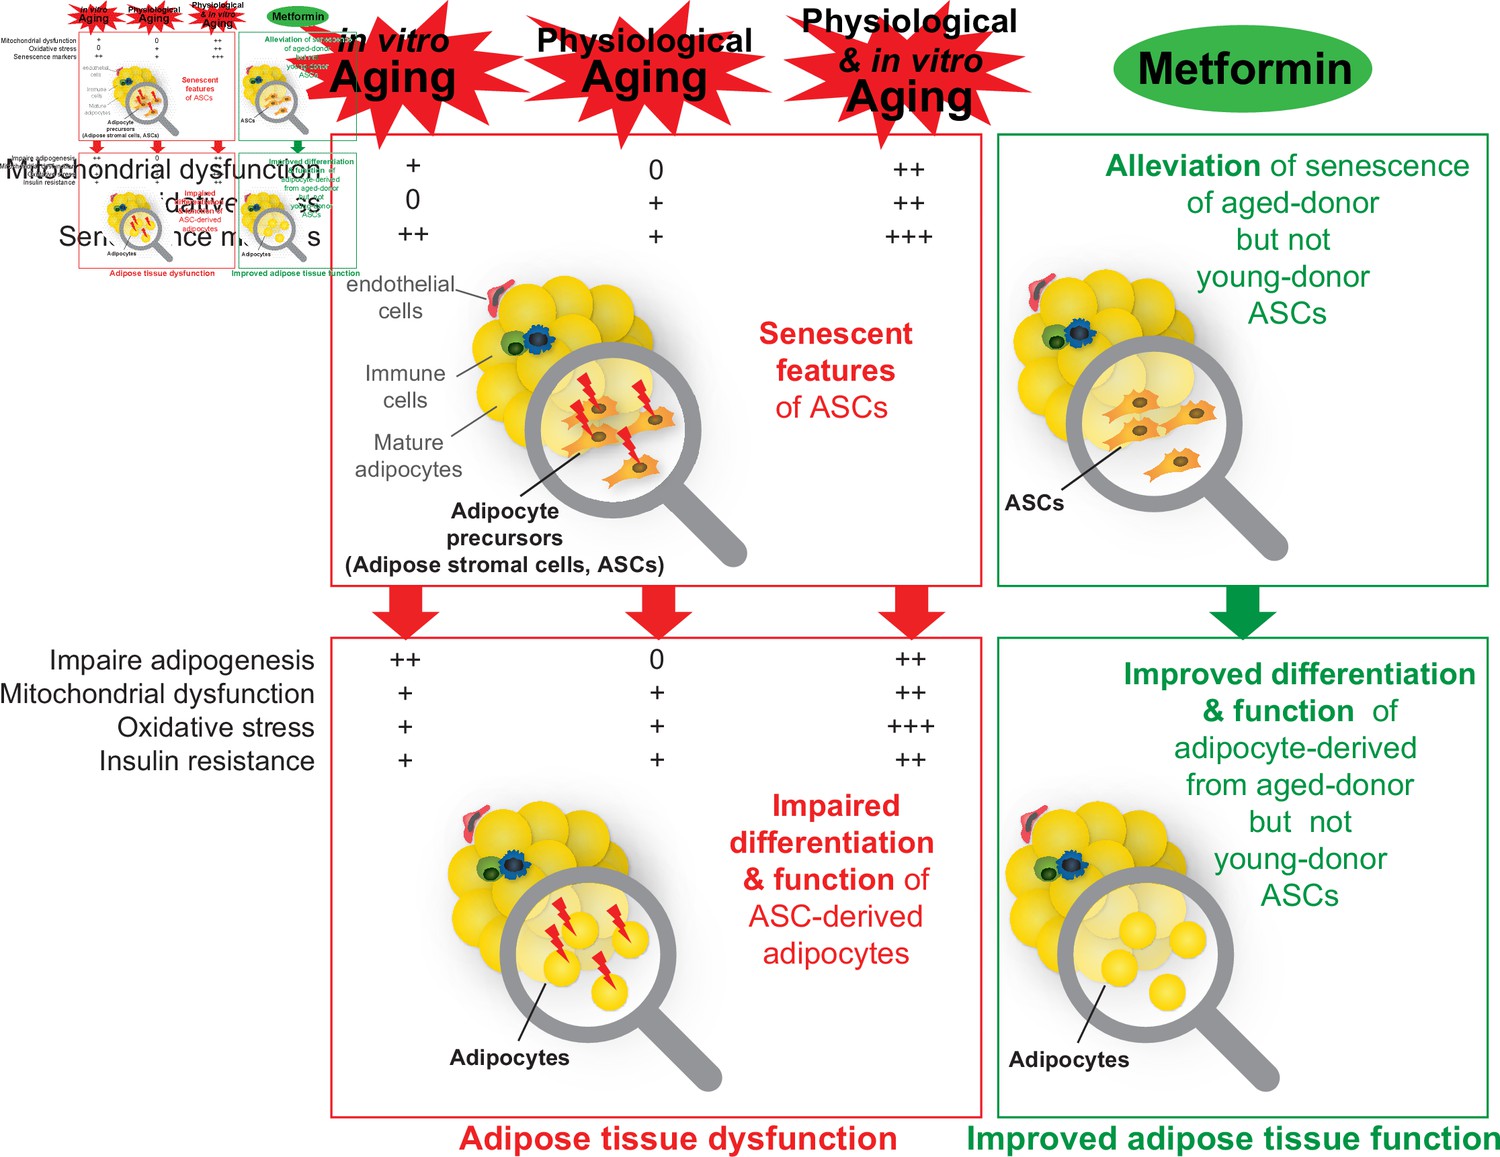
A recapitulative scheme of the alterations observed in adipose stromal cells undergoing in vitro, physiological, and both in vitro and physiological aging and in derived adipocytes.
Metformin alleviated stress-induced senescence of aged-donor adipose-derived stromal cells (ASCs) resulting in improved adipogenesis and insulin sensitivity to the levels observed in young-donor ASCs.
Author response image 1

Activin A secretion increases with ASCs senescence.
The results correspond to the mean ± SEM. *P<0.05, **P<0.01, ***P<0.001 for aged-donor vs. young-donor ASCs, §P<0.05, §§P<0.01 metformin-treated vs. non-treated ASCs. All experiments were performed in duplicate in ASCs isolated from 3 different donors in each group. #P<0.05, ##P<0.01, ###P<0.001 vs. young- or aged-donor ASCs at P3.
Author response image 2

Post confluent cell number in young-donor and aged-donor ASCs.
Tables
Key resources table
| Reagent type (species) or resource | Designation | Source or reference | Identifiers | Additional information |
|---|---|---|---|---|
| Antibody | Anti-tubulin (Mouse monoclonal) | Merck – Sigma-Aldrich | T5168, RRID:AB_477579 | WB (1:10 000) |
| Antibody | Anti-P21 (Mouse monoclonal) | BD Bioscience | 554262, RRID:AB_395331 | WB (1:1000) |
| Antibody | Anti-P16 (Mouse monoclonal) | BD Bioscience | 551154, RRID:AB_394078 | WB (1:1000) |
| Antibody | Anti-prelamin A (Goat polyclonal) | Santa Cruz Biotechnology | sc-6214, RRID:AB_648150 | WB (1:1000) |
| Antibody | Anti-C/EBPA (Rabbit polyclonal) | Santa Cruz Biotechnology | sc-61, RRID:AB_631233 | WB (1:500) |
| Antibody | Anti-PPARG (Rabbit polyclonal) | Santa Cruz Biotechnology | sc-7196, RRID:AB_654710 | WB (1:500) |
| Antibody | Anti-SREBP1 (Rabbit polyclonal) | Santa Cruz Biotechnology | sc-366, RRID:AB_2194229 | WB (1:500) |
| Antibody | Anti-goat IgG, HRP-linked | Santa Cruz Biotechnology | sc-2354, RRID:AB_628490 | WB (1:3000) |
| Antibody | Anti-Phospho-AMPK (Thr172) (Rabbit monoclonal) | Cell Signaling | 4188, RRID:AB_2169396 | WB (1:1000) |
| Antibody | Anti-AMPK (Rabbit polyclonal) | Cell Signaling | 2532, RRID:AB_330331 | WB (1:1000) |
| Antibody | Anti-Akt (Rabbit polyclonal) | Cell Signaling | 9272, RRID:AB_329827 | WB (1:1000) |
| Antibody | Anti-Phospho-Akt (Ser473) (Rabbit monoclonal) | Cell Signaling | 9271, RRID:AB_329825 | WB (1:1000) |
| Antibody | Anti-rabbit IgG, HRP-linked | Cell Signaling | 7074, RRID:AB_2099233 | WB (1:3000) |
| Antibody | Anti-mouse IgG, HRP-linked | Cell Signaling | 7076, RRID:AB_330924 | WB (1:3000) |
| Chemical compound, drug | X-Gal 40 mg/mL DMF | Euromedex | UX-1000–05 | |
| Chemical compound, drug | Oligomycine | Merck – Sigma-Aldrich | O4876 | |
| Chemical compound, drug | Carbonyl cyanide-p-trifluoromethoxyphenylhydrazone (FCCP) | Merck – Sigma-Aldrich | C2920 | |
| Chemical compound, drug | Rotenone | Merck – Sigma-Aldrich | R8875 | |
| Chemical compound, drug | Antimycine A | Merck – Sigma-Aldrich | A8674 | |
| Chemical compound, drug | Metformin hydrochloride | Merck – Sigma-Aldrich | PHR1084 | |
| Chemical compound, drug | Dimethyl sulfoxide | Merck – Sigma-Aldrich | D8418 | |
| Chemical compound, drug | 3-Isobutyl-1-methylxanthine | Merck – Sigma-Aldrich | I5879 | |
| Chemical compound, drug | Dexametasone | Merck – Sigma-Aldrich | D4902 | |
| Chemical compound, drug | Rosiglitazone | Merck – Sigma-Aldrich | R2408 | |
| Chemical compound, drug | Collagenase B | Merck – Sigma-Aldrich | 11088815001 | |
| Chemical compound, drug | Formalin Solution, Neutral Buffered | Merck – Sigma-Aldrich | HT-501 | |
| Chemical compound, drug | Oil-Red-O | Merck – Sigma-Aldrich | O9755 | |
| Chemical compound, drug | Isopropanol | Merck – Sigma-Aldrich | 563935 | |
| Chemical compound, drug | Lopinavir | Santa Cruz Biotechnology | sc-207831 | |
| Chemical compound, drug | Ritonavir | Santa Cruz Biotechnology | sc-208310 | |
| Chemical compound, drug | Darunavir | Santa Cruz Biotechnology | sc-218079 | |
| Chemical compound, drug | AICAR | Santa Cruz Biotechnology | sc-200659 | |
| Chemical compound, drug | Compound C | Santa Cruz Biotechnology | sc-361173 | |
| Chemical compound, drug | DAPI | Thermo Fisher Scientific | D1306 | |
| Chemical compound, drug | CM-H2-DCFDA | Thermo Fisher Scientific | C6827 | |
| Chemical compound, drug | MitoTacker | Thermo Fisher Scientific | M7512 | |
| Chemical compound, drug | JC-1 | Thermo Fisher Scientific | T3168 | |
| Chemical compound, drug | Lysotracker | Thermo Fisher Scientific | L7526 | |
| Commercial assay or kit | Glucose Uptake-Glo Assay | Promega | J1341 | |
| Peptide, recombinant protein | Human Insulin | Merck – Sigma-Aldrich | I9278 | |
| Peptide, recombinant protein | Human FGF-basic | Peprotech | 100-18B | |
| Software, algorithm | Image J | Image J | RRID:SCR_003070 | |
| Software, algorithm | Prism | Prism | RRID:SCR_005375 |
Table 1
Main characteristics of subcutaneous adipose tissue (SCAT) donors used for adipose-derived stromal cell (ASC) isolation.
| Sex | Age(years) | BMI(kg/m2) | Ethnicity |
|---|---|---|---|
| F | 29 | 23.5 | Caucasian |
| F | 16 | 23.7 | Caucasian |
| F | 16 | 26.6 | Caucasian |
| F | 16 | 24.6 | Caucasian |
| F | 29 | 19.3 | Caucasian |
| F | 61 | 26.0 | Caucasian |
| F | 62 | 26.6 | Sub-Saharan African |
| F | 58 | 24.9 | Caucasian |
| F | 60 | 24.4 | Caucasian |
| F | 59 | 24.6 | Caucasian |
Additional files
Download links
A two-part list of links to download the article, or parts of the article, in various formats.
Downloads (link to download the article as PDF)
Open citations (links to open the citations from this article in various online reference manager services)
Cite this article (links to download the citations from this article in formats compatible with various reference manager tools)
Metformin alleviates stress-induced cellular senescence of aging human adipose stromal cells and the ensuing adipocyte dysfunction
eLife 10:e62635.
https://doi.org/10.7554/eLife.62635


