TRIM37 prevents formation of centriolar protein assemblies by regulating Centrobin
- Departamento de Genética, Universidad de Sevilla, Spain
- Centro Andaluz de Biología Molecular y Medicina Regenerativa-CABIMER, Universidad de Sevilla-CSIC-Universidad Pablo de Olavide, Spain
- Swiss Institute for Experimental Cancer Research (ISREC), School of Life Sciences, Swiss Federal Institute of Technology Lausanne (EPFL), Switzerland
- Pediatric Research Center, Children's Hospital, University of Helsinki and Helsinki University Hospital, Finland
Figures
Figure 1 with 2 supplements
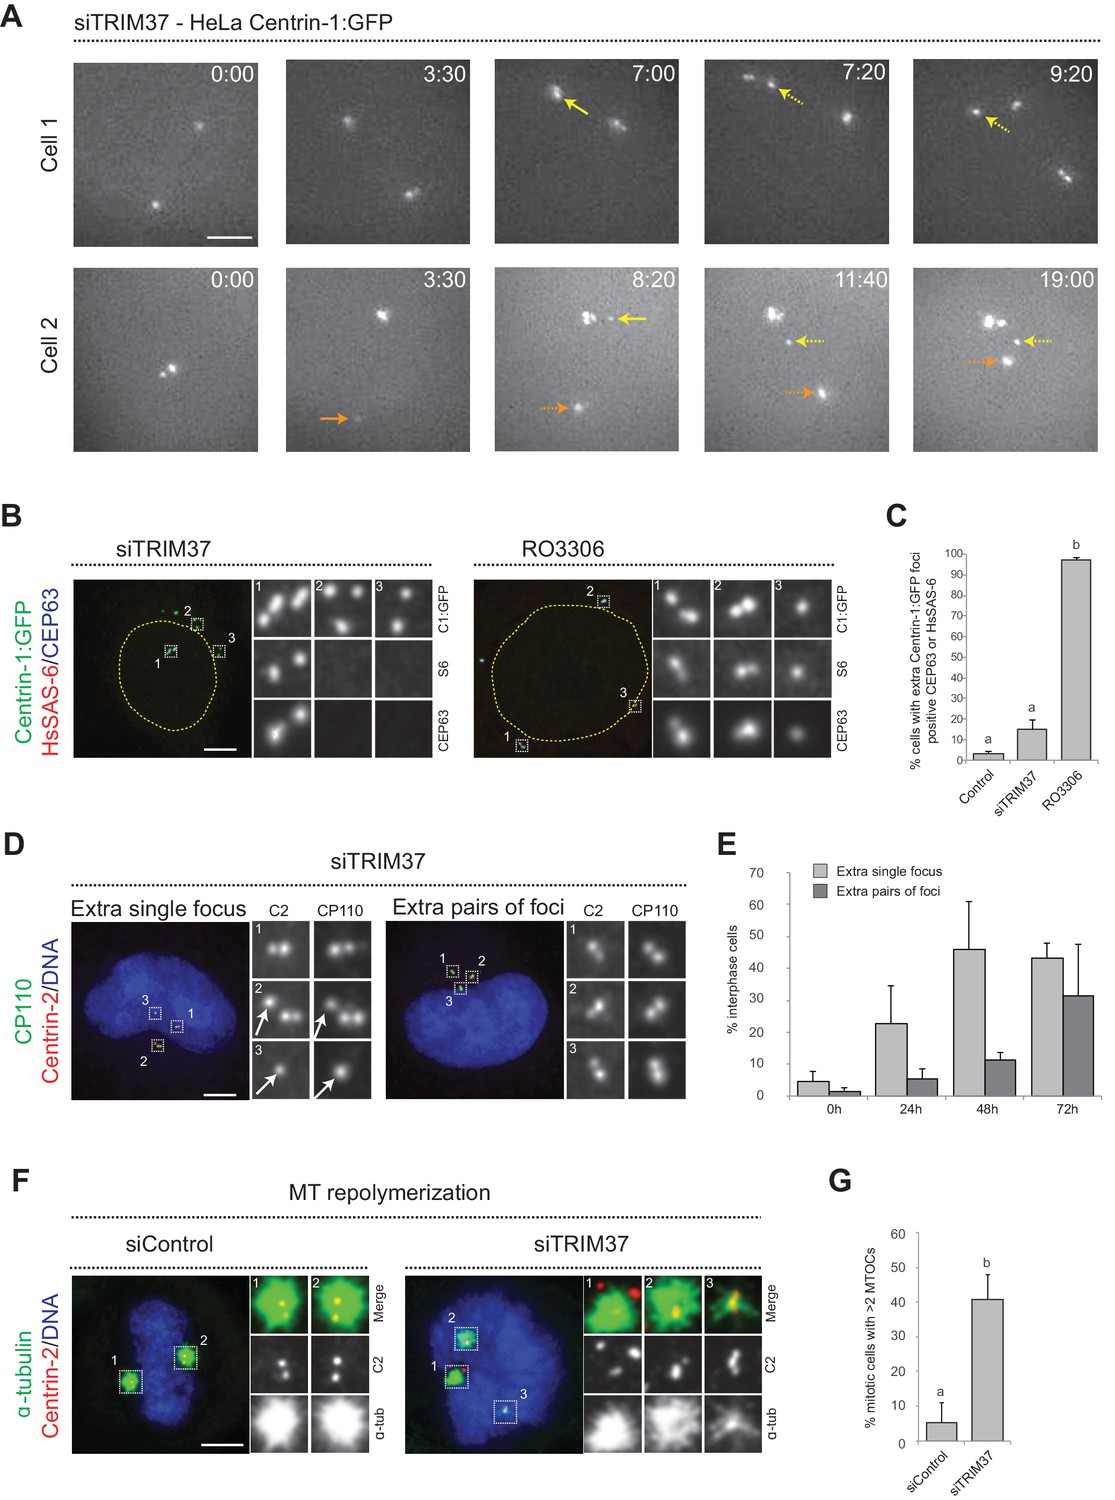
Centriolar protein assemblies (Cenpas) form upon TRIM37 depletion.
(A) Relevant images from wide-field time-lapse recordings of HeLa cells expressing Centrin-1:GFP and depleted of TRIM37 for 48 hr before imaging onset (10 min time frame). Yellow arrows point to two foci appearing close to resident centrioles (8/13 extra foci in 11 cells), orange arrow to one focus appearing away from resident centrioles (5/13 extra foci). Solid arrows indicate first occurrence of foci, dashed arrows their continued presence. Time is indicated in h:min since imaging onset. Note that the intensity of extra Centrin-1:GFP foci was typically weaker than that of regular centrioles, especially in the early assembly stages. Note also resident centriole and procentriole appearing in the field of view at the bottom right in Cell 1, 9:20. In this and other Figure panels, scale bars correspond to 5 μm, unless indicated otherwise. (B) HeLa cells expressing Centrin-1:GFP upon treatment with TRIM37 siRNAs or upon RO3306 addition for 48 hr. Cells were immunostained for GFP, HsSAS-6 and CEP63. Nuclear contours are drawn with dashed yellow lines. In this and subsequent figures, magnified images from indicated numbered regions are shown. (C) Corresponding percentage of cells with extra Centrin-1:GFP foci that also harbor CEP63 and/or HsSAS-6. Note that extra Centrin-1:GFP foci could be positive for both Cep63 and HsSAS-6 in RO3306-treated cells. Chart shows the average and SDs from two independent experiments (n = 50 cells each). Here and in other charts of this figure, two conditions that do not share the same letter are significantly different from each other, with p<0.05; unpaired Student’s t-test; see Supplementary file 2 for exact p values. (D) HeLa cells depleted of TRIM37 and immunostained for Centrin-2 plus CP110, illustrating a case with an extra single focus (left, inset 1) and one with an extra pair of foci (right). DNA is shown in blue in this and all other figure panels unless stated otherwise. (E) Corresponding percentage of interphase cells with extra single focus or extra pairs of foci at indicated times after TRIM37 siRNA transfection. Chart shows the average and SDs from three independent experiments (n = 50 cells each). (F) Microtubule depolymerization-regrowth experiment in mitotic HeLa cells treated with control or TRIM37 siRNAs. Microtubules were depolymerized by a 30-min cold shock followed by 1–2 min at room temperature before fixation and immunostaining for Centrin-2 and α-tubulin. (G) Corresponding percentage of mitotic cells with >2 MTOCs. Chart shows the average and SDs from three independent experiments (n = 50 cells each). Note that ~40% of the extra Centrin-2 foci observed in mitosis did not nucleate microtubules, as illustrated for two of them in inset 1 (siTRIM37); data from n = 40 Cenpas in each of the three independent experiments. Source data for panels C, E, and G can be found in Figure 1—source data 1.
-
Figure 1—source data 1
Source data for figure panels: Figure 1C, E and G, Figure 1—figure supplement 2B and E.
- https://cdn.elifesciences.org/articles/62640/elife-62640-fig1-data1-v2.xlsx
Figure 1—figure supplement 1
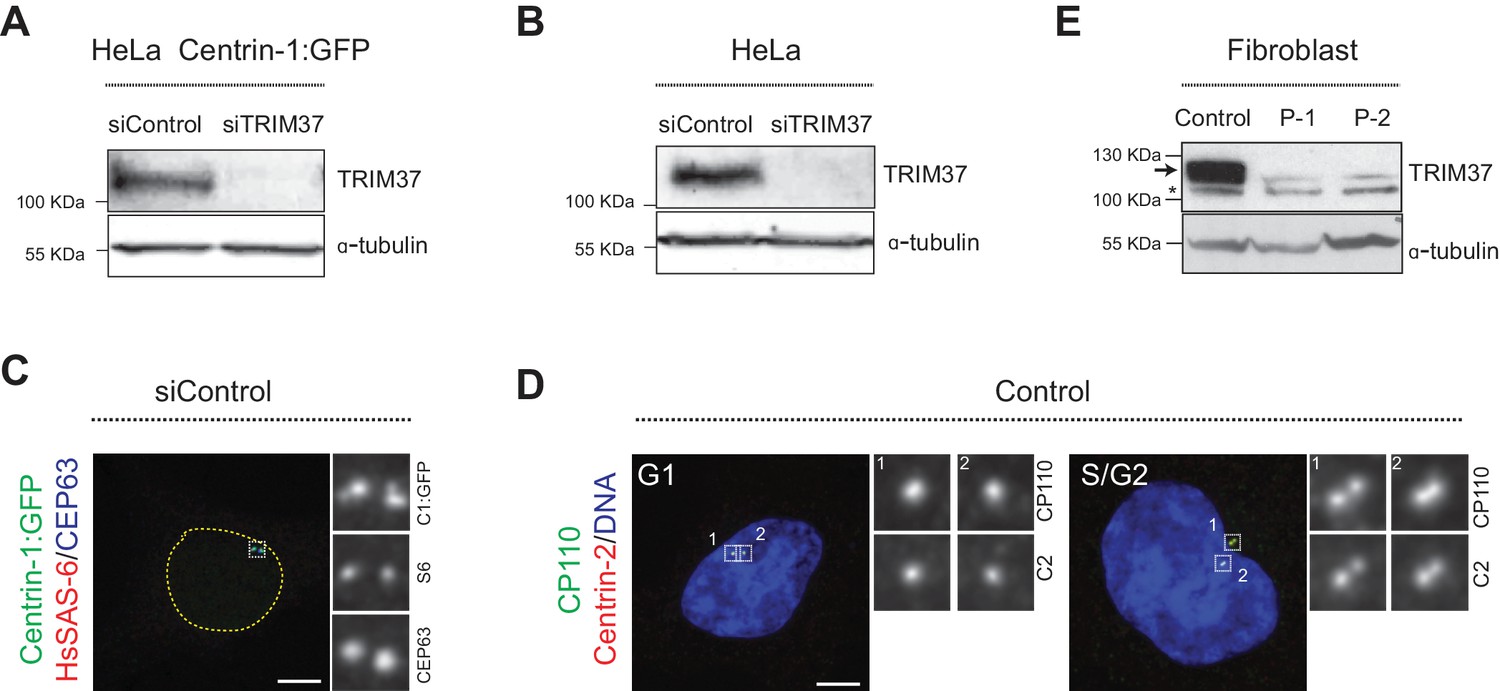
TRIM37 depletion and localization of centriolar markers.
(A, B) Western blot of lysates from HeLa cells (A) or HeLa Centrin-1:GFP cells (B) transfected with siRNAs against TRIM37 and probed with antibodies against TRIM37 (top) or α-tubulin as loading control (bottom). Select molecular weight markers are indicated in kDa in this and other western blot panels. (C) HeLa cells expressing Centrin-1:GFP immunostained for GFP, HsSAS-6 and CEP63. Nuclear contours are drawn with dashed yellow lines. In this and other supplement figure panels, scale bars correspond to 5 μm, unless indicated otherwise. (D) HeLa cells immunostained for Centrin-2 and CP110. Left: G1 cell, with two resident centrioles, right: S/G2 cell with two centriole pairs, each with one resident centriole and one procentriole. (E) Western blot of cell lysates from control and Mulibrey patient (P-1, P-2) fibroblasts probed with antibodies against TRIM37 (top) or α-tubulin as loading control (bottom). The arrow indicates TRIM37, the asterisk a non-specific band.
Figure 1—figure supplement 2
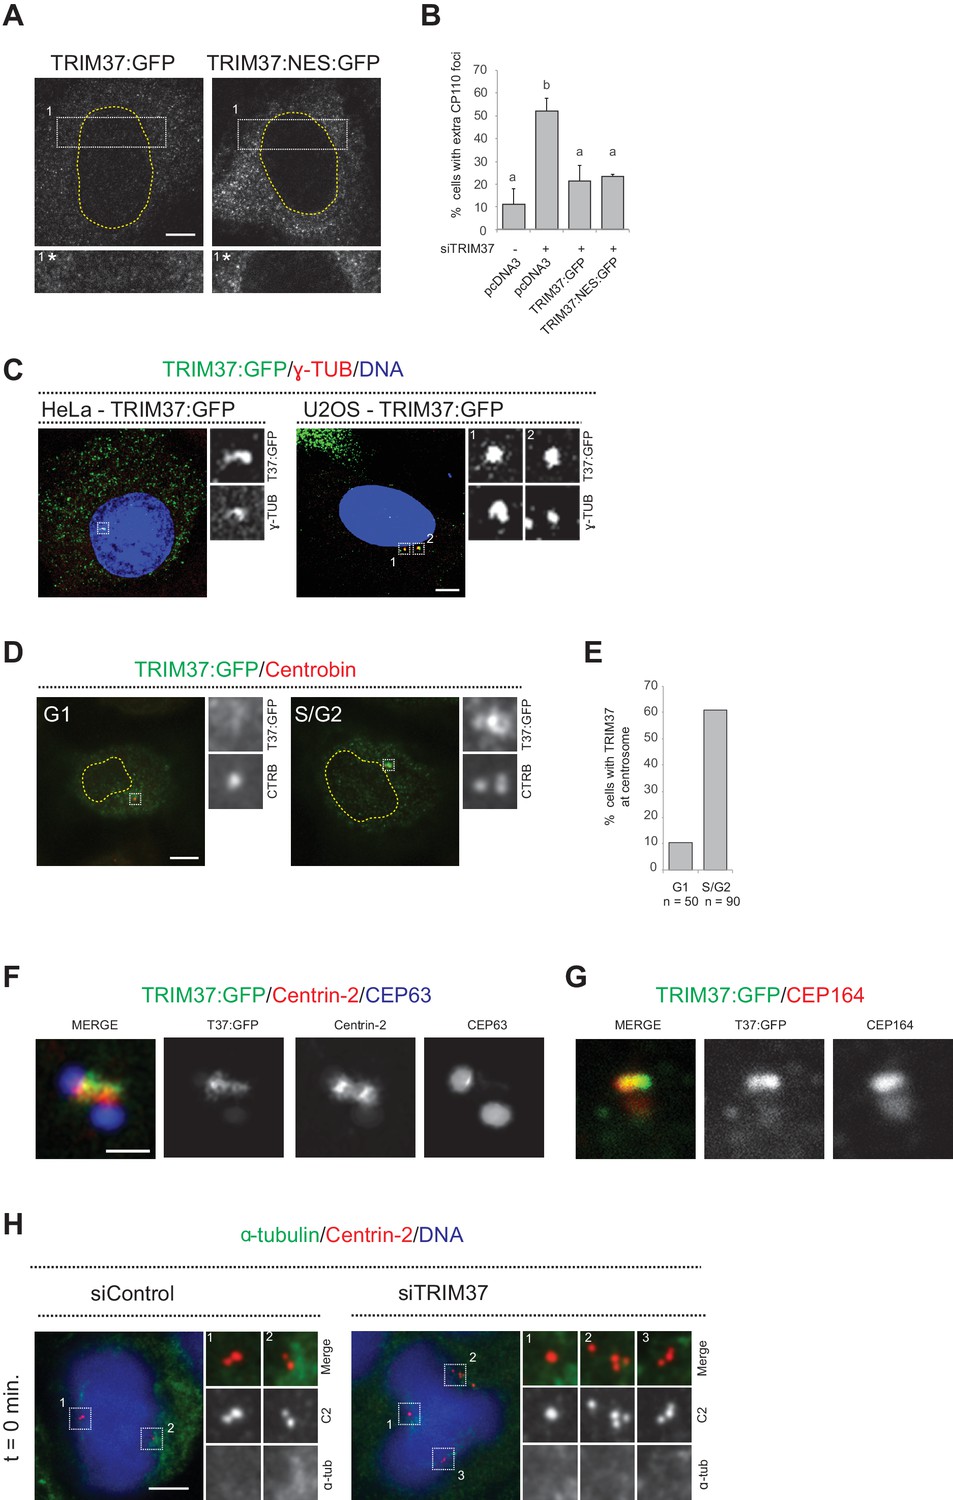
TRIM37 exerts its centriolar function outside the nucleus and localizes to the distal part of centrioles.
(A) HeLa cells expressing TRIM37:GFP or TRIM37 tagged with a nuclear export signal and GFP (TRIM37:NES:GFP) immunostained for GFP. An inset of the indicated area with modified brightness and contrast is shown at the bottom of each image (1*). (B) Quantification of extra number of CP110 foci in HeLa cells treated with control or TRIM37 siRNAs and transfected with indicated plasmids (pcDNA3: parental vector). Cells were immunostained for GFP and CP110. Chart shows the average and SDs from two independent experiments (n = 50 cells each). Two conditions that do not share the same letter are significantly different from each other, with p<0.05; unpaired Student’s t-test; see Supplementary file 2 for exact p values. (C) HeLa (left) and U2OS (right) cells transfected with TRIM37:GFP, and immunostained for GFP plus γ-tubulin. (D) HeLa cells transfected with TRIM37:GFP, and immunostained for GFP plus Centrobin. Cells with a single Centrobin focus (left) were classified as being in G1, cells with two or three Centrobin foci (right) as being in S/G2. (E) Corresponding percentage of cells in G1 or S/G2 exhibiting TRIM37:GFP at centrosomes. n = 50 cells, single experiment. (F, G) High magnification confocal images of TRIM37:GFP localization with respect to indicated centriolar markers; HeLa cells were fixed 24 hr after transfection in this case. Scale bar 500 nm. (H) Microtubule depolymerization-regrowth experiment of mitotic HeLa cells treated with control or TRIM37 siRNAs. Microtubules were depolymerized by a 30-min cold shock, fixed and immunostained for Centrin-2 and α-tubulin. Source data for panels B and E can be found in Figure 1—source data 1.
Figure 2

Cenpas can behave as extra MTOCs, including in Mulibery patient cells.
(A) Control and patient-1 (P-1) fibroblasts in mitosis immunostained for Centrin-2 and γ-tubulin. (B) Corresponding percentage of mitotic cells with extra number of Centrin-2 or γ-tubulin foci in control and patient (P-1 and P-2) fibroblasts. Chart shows the average and SDs from three independent experiments (n: total number of cells scored per condition). Here and in other charts of this figure, two conditions that do not share the same letter are significantly different from each other, with p<0.05; unpaired Student’s t-test; see Supplementary file 2 for exact p values. (C) Control and patient-2 (P-2) fibroblasts in metaphase immunostained for Centrin-2 and α-tubulin. (D, E) Corresponding percentage of metaphase cells with bipolar, pseudobipolar or multipolar spindles (D), and percentage of metaphase cells with extra number of Centrin-2 foci (E). Charts show the average and SDs from three independent experiments (n: total number of cells scored per condition). (F) Control and patient-2 (P-2) fibroblasts in anaphase immunostained for Centrin-2 and α-tubulin. (G, H) Corresponding percentage of anaphase cells with bipolar, pseudobipolar or multipolar spindles (G), and percentage of bipolar or pseudobipolar anaphase cells with chromosome segregation defects (H). Charts show the average and SDs from three independent experiments (n: total number of cells scored per condition). (I) Control and patient-2 (P-2) interphase fibroblasts stained with DAPI. (J) Corresponding percentage of interphase cells bearing a micronucleus. Chart shows the average and SDs from three independent experiments (n: total number of cells scored per condition). Source data for panels B, D, E, G, H, and J can be found in Figure 2—source data 1.
-
Figure 2—source data 1
Source data for figure panels: Figure 2B, D, E, G, H and J.
- https://cdn.elifesciences.org/articles/62640/elife-62640-fig2-data1-v2.xlsx
Figure 3 with 1 supplement
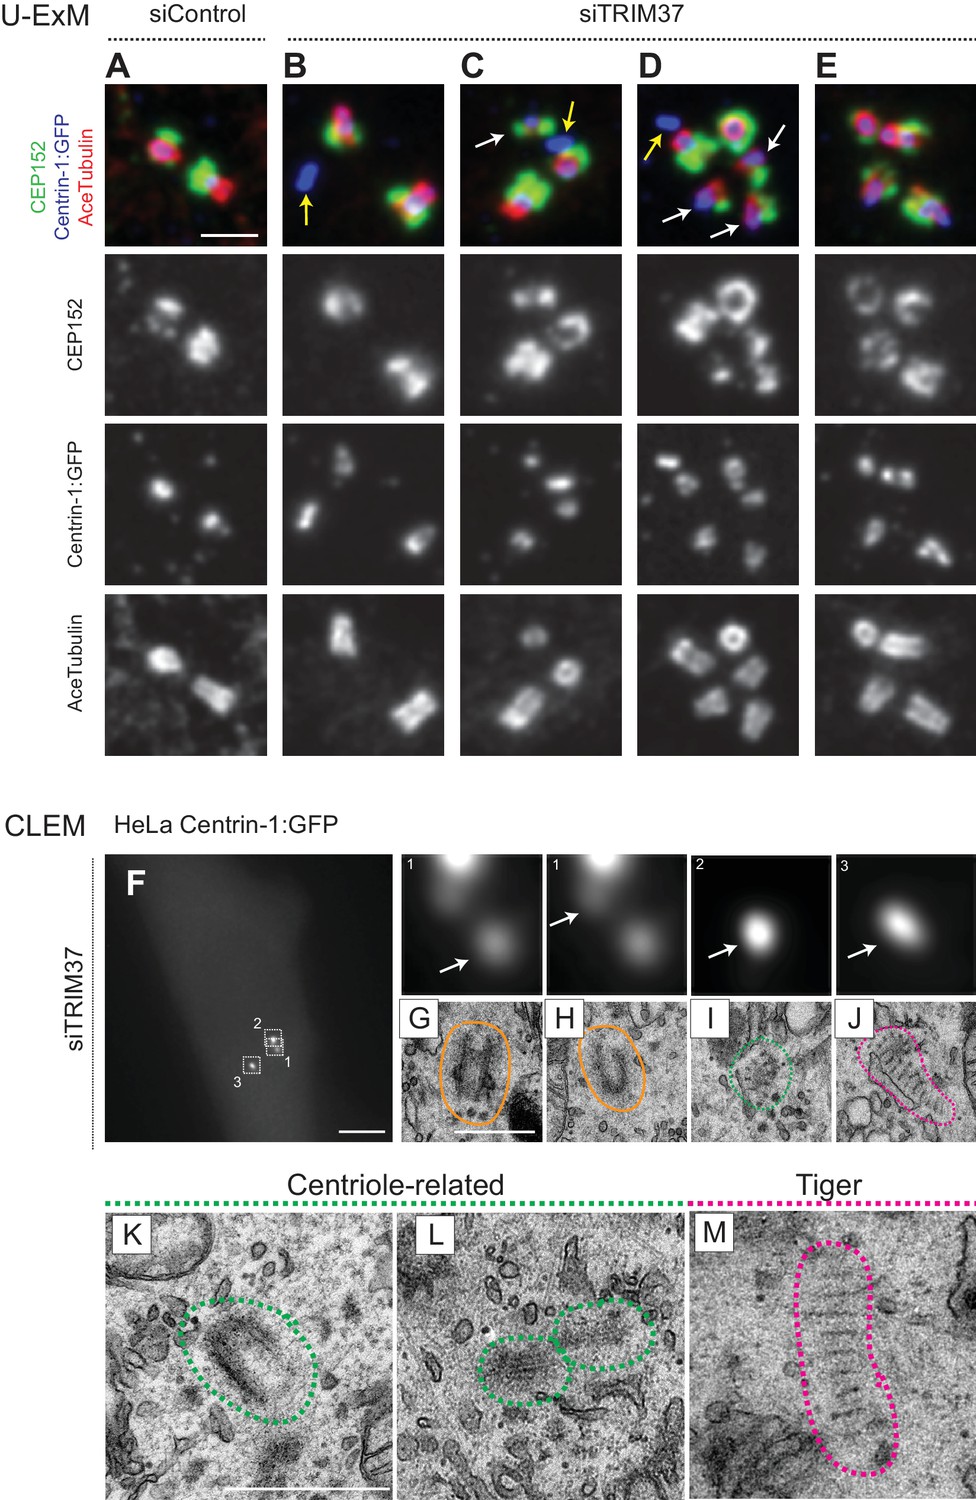
Cenpas are structures related to centrioles or electron-dense striped structures.
(A–E) Ultrastructure expansion microscopy (U-ExM) confocal images of control (A) or TRIM37 (B–E) depleted RPE-1 cells expressing Centrin-1:GFP, and immunostained for GFP, CEP152 as well as acetylated tubulin. Yellow arrows point to Cenpas lacking CEP152 and acetylated tubulin, white arrows to those harboring both proteins, but with an unusual distribution. Scale bar 500 nm. (F–J) CLEM analysis of HeLa cell (cell three in Supplementary file 1) expressing Centrin-1:GFP and depleted of TRIM37. Maximal intensity projection of wide-field microcopy image covering the entire cell volume (F), and magnified insets from the light microscopy images above the corresponding 50 nm section EM images (G–J), with white arrows pointing to relevant Centrin-1:GFP focus. Scale bars: 5 μm in F, 500 nm in G. Here and in panels K-M, green and pink dashed lines surround centriole-related and tiger structures, respectively. Filled orange lines surround resident centrioles, which could be recognized when going through all the sections encompassing the organelle. (K–M) Centriole-related (K, cell seven in Supplementary file 1; L, cell seven in Supplementary file 1), and tiger structure (M, cell two in Supplementary file 1). Scale bar is 500 nm.
Figure 3—figure supplement 1
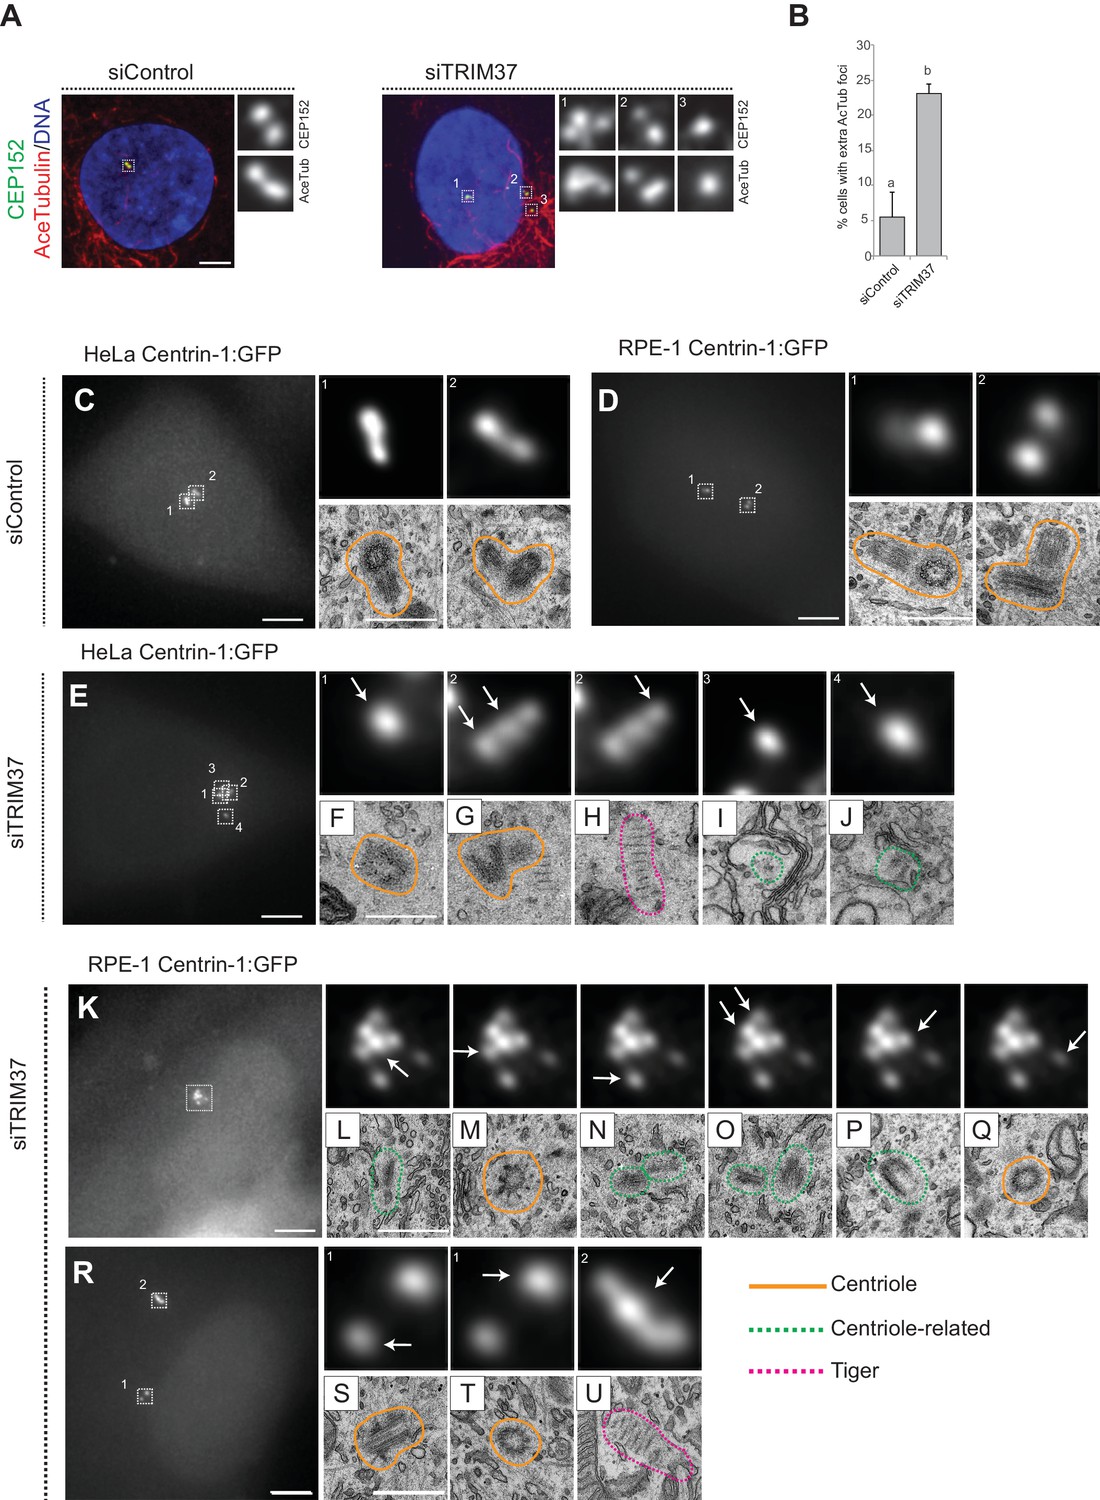
Cenpas formed upon TRIM37 depletion are centriole related structures or striped structures.
(A) RPE-1 cells treated with control or TRIM37 siRNAs, and immunostained for CEP152 plus acetylated tubulin. (B) Corresponding percentage of cells with extra foci of acetylated tubulin. Chart shows the average and SDs from two independent experiments (n = 50 cells each). Two conditions that do not share the same letter are significantly different from each other, with p<0.05; unpaired Student’s t-test; see Supplementary file 2 for exact p values. (C–U) CLEM analysis of HeLa and RPE-1 cells expressing Centrin-1:GFP and transfected with control (C–D) or TRIM37 (E, K, R) siRNAs. Left-most images show maximal intensity projection of wide-field microcopy image covering the entire cell volume; scale bar: 5 μm. Magnified insets from the light microscopy images are shown above the 50 nm section EM images taken from the corresponding position. E corresponds to cell 2, K to cell 7, and R to cell 6 in Supplementary file 1. White arrows indicate the Centrin-1:GFP focus that correlates with the EM image shown below. Scale bars in insets are 500 nm. Green and pink dashed lines surround centriole-related and tiger structures, respectively. Filled orange lines surround resident centrioles. Source data for panel B can be found in Figure 3—figure supplement 1—source data 1.
-
Figure 3—figure supplement 1—source data 1
Source data for figure panels: Figure 3—figure supplement 1B.
- https://cdn.elifesciences.org/articles/62640/elife-62640-fig3-figsupp1-data1-v2.xlsx
Figure 4 with 2 supplements
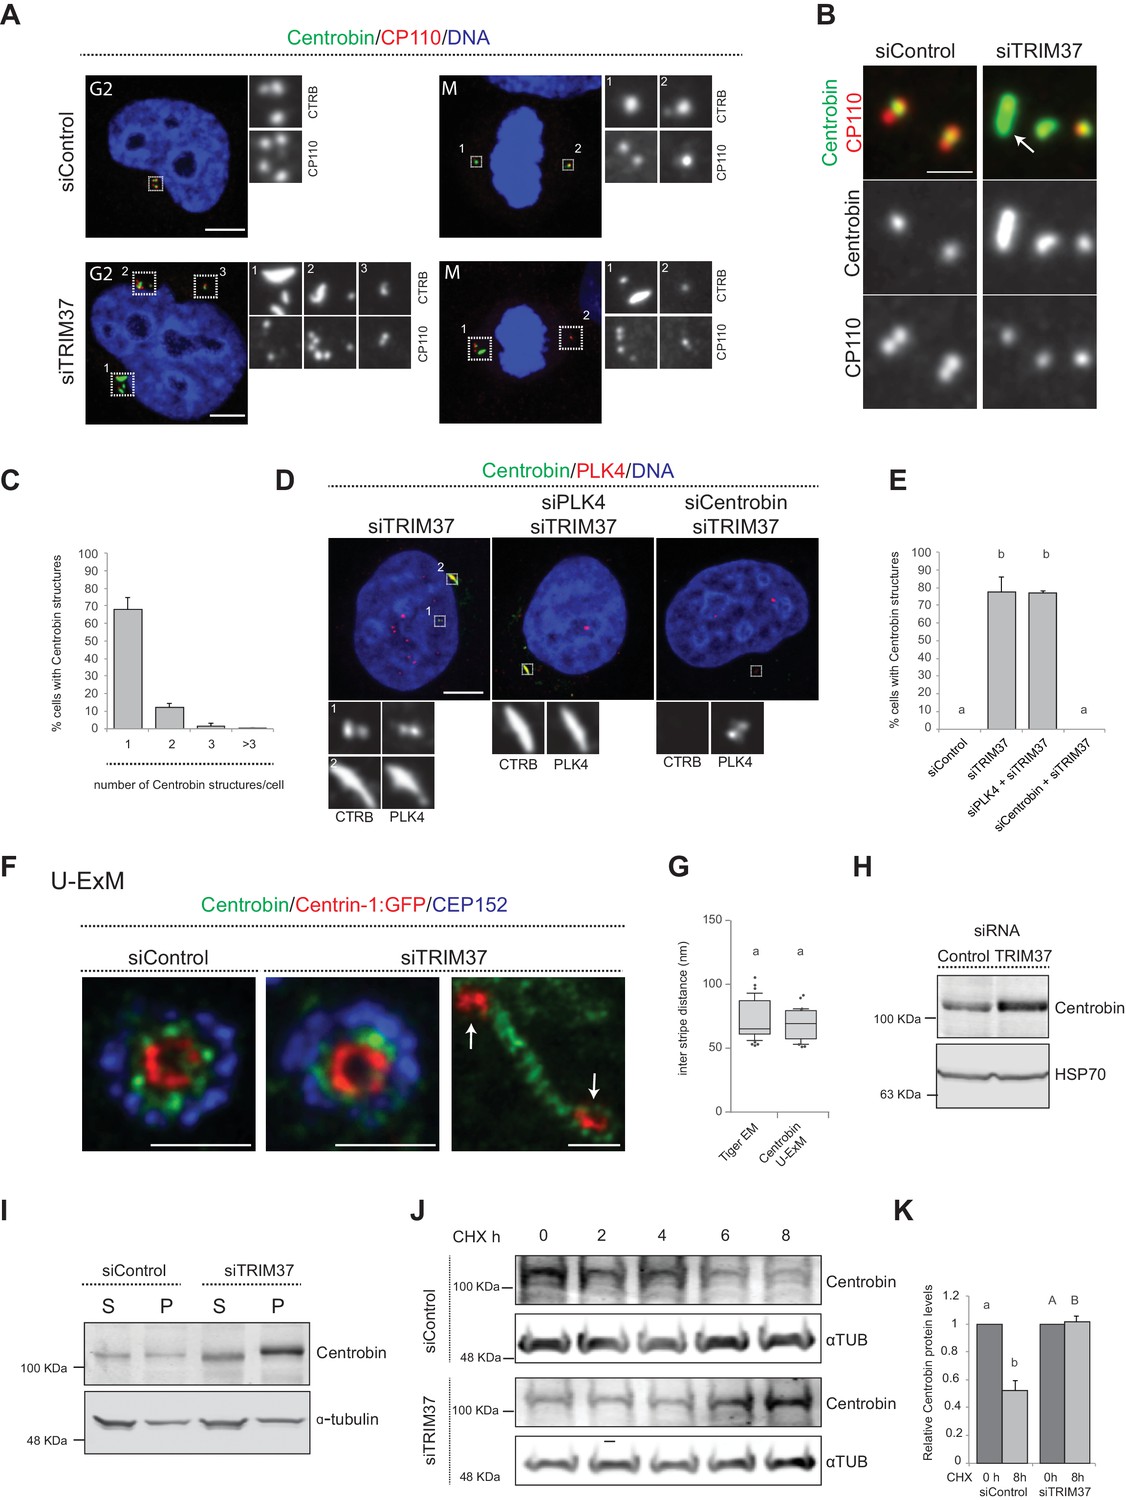
TRIM37 regulate Centrobin protein stability and levels.
(A) HeLa cells in G2 or mitosis (M), as indicated in the upper left corners of the images, treated with control or TRIM37 siRNAs, and immunostained for CP110 plus Centrobin. (B) High-magnification confocal view of cells treated with control or TRIM37 siRNAs immunostained for Centrobin and CP110. Arrow points to elongated Centrobin assembly. Scale bar 1 μm. (C) Number of Centrobin structures in HeLa cells depleted of TRIM37. Chart shows the average and SDs from three independent experiments (n = 50 cells each). (D) HeLa cells were first transfected with PLK4 or Centrobin siRNAs and 24 hr thereafter transfected again with TRIM37 siRNAs. Cells were fixed 72 hr after first transfection and stained with Centrobin and PLK4 antibodies (Wong et al., 2015). (E) Corresponding percentage of cells bearing Centrobin structures. Chart shows the average and SDs from three independent experiments (n = 50 cells each). Here and in other charts of this figure, two conditions that do not share the same letter are significantly different from each other, with p<0.05; unpaired Student’s t-test; see Supplementary file 2 for exact p values. (F) U-ExM coupled to STED super-resolution microscopy of RPE-1 cells immmunostained for CEP152, Centrin-1 and Centrobin. White arrows point to Cenpas in close proximity to Centrobin assembly. Scale bars are 250 nm. (G) Box-and-whisker plot of inter stripe distances in TEM tiger structures (n = 53 from five tiger structures) and U-ExM Centrobin structures (n = 30 from three Centrobin structures). U-ExM-induced sample expansion was taken into consideration to compare TEM vs. U-ExM inter stripe measurements. Box plots show median, interquartile range (10–90 percentile) and SDs. (H) Western blot of lysates from HeLa cells treated with control or TRIM37 siRNAs probed with antibodies against Centrobin (top) or HSP70 as loading control (bottom). (I) Western blot of soluble (S) or insoluble (P, for pellet) fractions of lysates from HeLa cells treated with control or TRIM37 siRNAs, probed with antibodies against Centrobin (top) or α-tubulin as loading control (bottom). Note that Centrobin in the insoluble fraction migrates slower upon TRIM37 depletion, suggestive of some posttranslational modification. (J) Western blot of total Centrobin protein levels in control and TRIM37-depleted HeLa cells treated with cycloheximide (CHX) for indicated time in hours (h), probed with antibodies against Centrobin (top) or α-tubulin as loading control (bottom). Note that the amount of lysate loaded for the TRIM37-depleted sample was ~50% of that loaded for the siControl condition in this case. (K) Quantification of relative Centrobin protein levels from western blots such as the one shown in J. Chart shows the average and SDs from two independent experiments. Lower-case and upper-case letters above the charts reflect comparisons of two distinct data sets. Source data for panels C, E, G, and K can be found in Figure 4—source data 1.
-
Figure 4—source data 1
Source data for figure panels: Figure 4C, E, G and K, Figure 4—figure supplement 1B and Figure 4—figure supplement 2A.
- https://cdn.elifesciences.org/articles/62640/elife-62640-fig4-data1-v2.xlsx
Figure 4—figure supplement 1
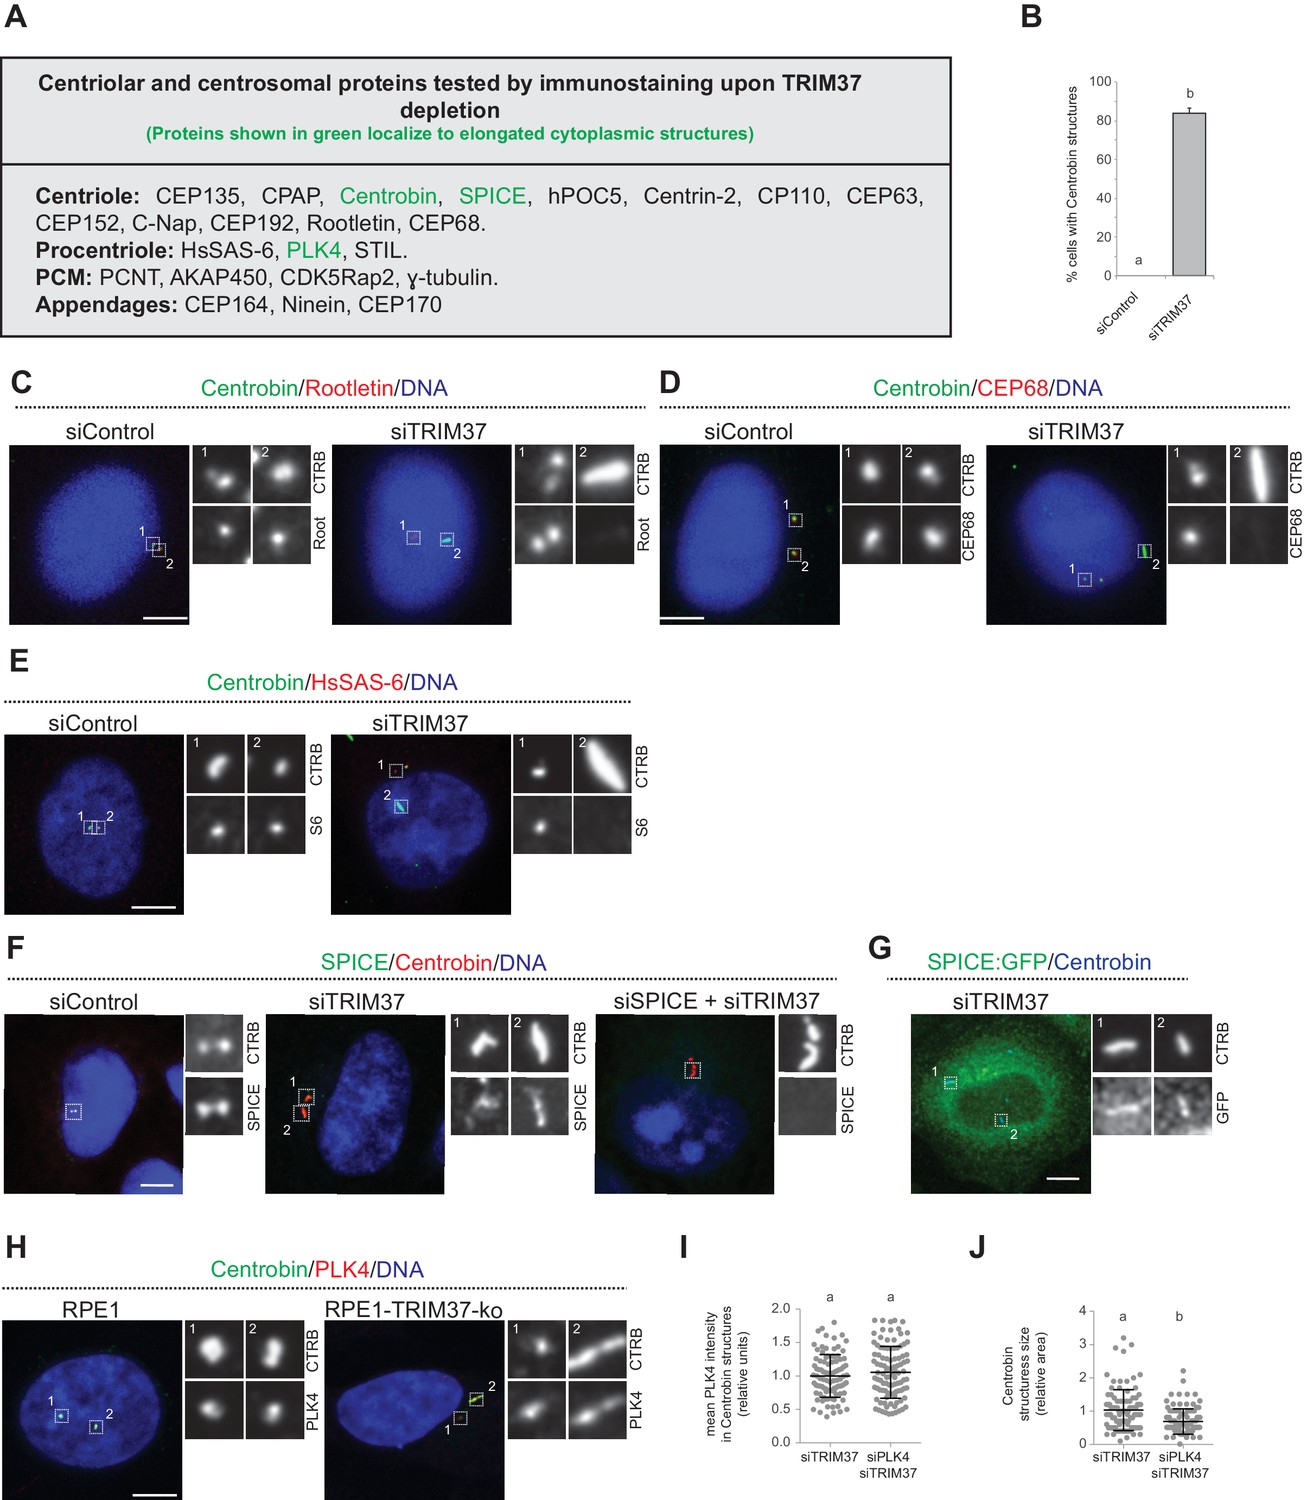
Distribution of centriolar and centrosomal proteins upon TRIM37 depletion, as well as testing of SPICE and PLK4 requirements for Centrobin assembly formation.
(A) Centriolar and centrosomal proteins analyzed by immunofluorescence upon TRIM37 depletion. See Materials and methods for antibodies utilized. (B) Quantification of frequency of Centrobin assemblies in HeLa cells depleted of TRIM37. Chart shows the average and SDs from three independent experiments (n = 50 cells each). Here and in other charts of this figure, two conditions that do not share the same letter are significantly different from each other, with p<0.05; unpaired Student’s t-test; see Supplementary file 2 for exact p values. (C–E) HeLa cells depleted of TRIM37 and immunostained with antibodies against Centrobin and Rootletin (C), Centrobin and CEP68 (D), Centrobin and HsSAS-6 (E). (F) HeLa cells treated with control, TRIM37 or simultaneously with both TRIM37 and SPICE siRNAs, immunostained for SPICE and Centrobin. (G) HeLa cell expressing SPICE:GFP immunostained for GFP and Centrobin. (H) RPE-1 and RPE-1 TRIM37 knock-out cells immunostained with antibodies against Centrobin and PLK4 (Wong et al., 2015). (I) Quantification of mean PLK4 intensity in Centrobin structures in HeLa cells depleted of TRIM37 or double depleted of TRIM37 and PLK4 as in Figure 4D. Chart shows the average and SDs from two independent experiments. Approximately 50 Centrobin structures were quantified per experiment and condition. (J) Quantification of area of Centrobin assemblies in HeLa cells depleted of TRIM37 or simultaneously of both TRIM37 and PLK4, as in Figure 4D. Chart shows the average and SDs from two independent experiments. Approximately 50 Centrobin structures were quantified per experiment and condition. Source data for panels B, I, and J can be found in Figure 4—source data 1.
Figure 4—figure supplement 2
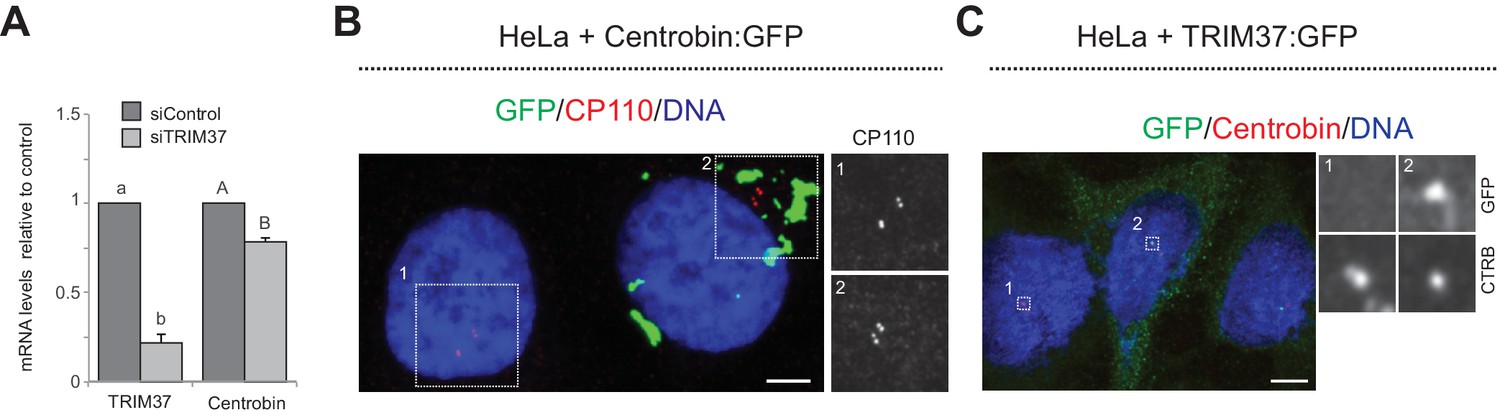
Increased Centrobin level is not sufficient for Cenpas formation.
(A) Quantitative real time PCR of TRIM37 and Centrobin mRNA in HeLa cells treated with control or TRIM37 siRNAs. Average of three independent experiments. In the statistical analysis, lower-case and upper-case letters indicate two independent set of data analyzed. Two conditions that do not share the same letter are significantly different from each other, with p<0.05; unpaired Student’s t-test; see Supplementary file 2 for exact p values. (B) HeLa cell (left) and HeLa cell overexpressing Centrobin:GFP (right), immunostained for GFP and CP110. (C) Confocal images of HeLa cells overexpressing TRIM37:GFP immunostained with antibodies against GFP and Centrobin. Source data for panel A can be found in Figure 4—source data 1.
Figure 5 with 1 supplement
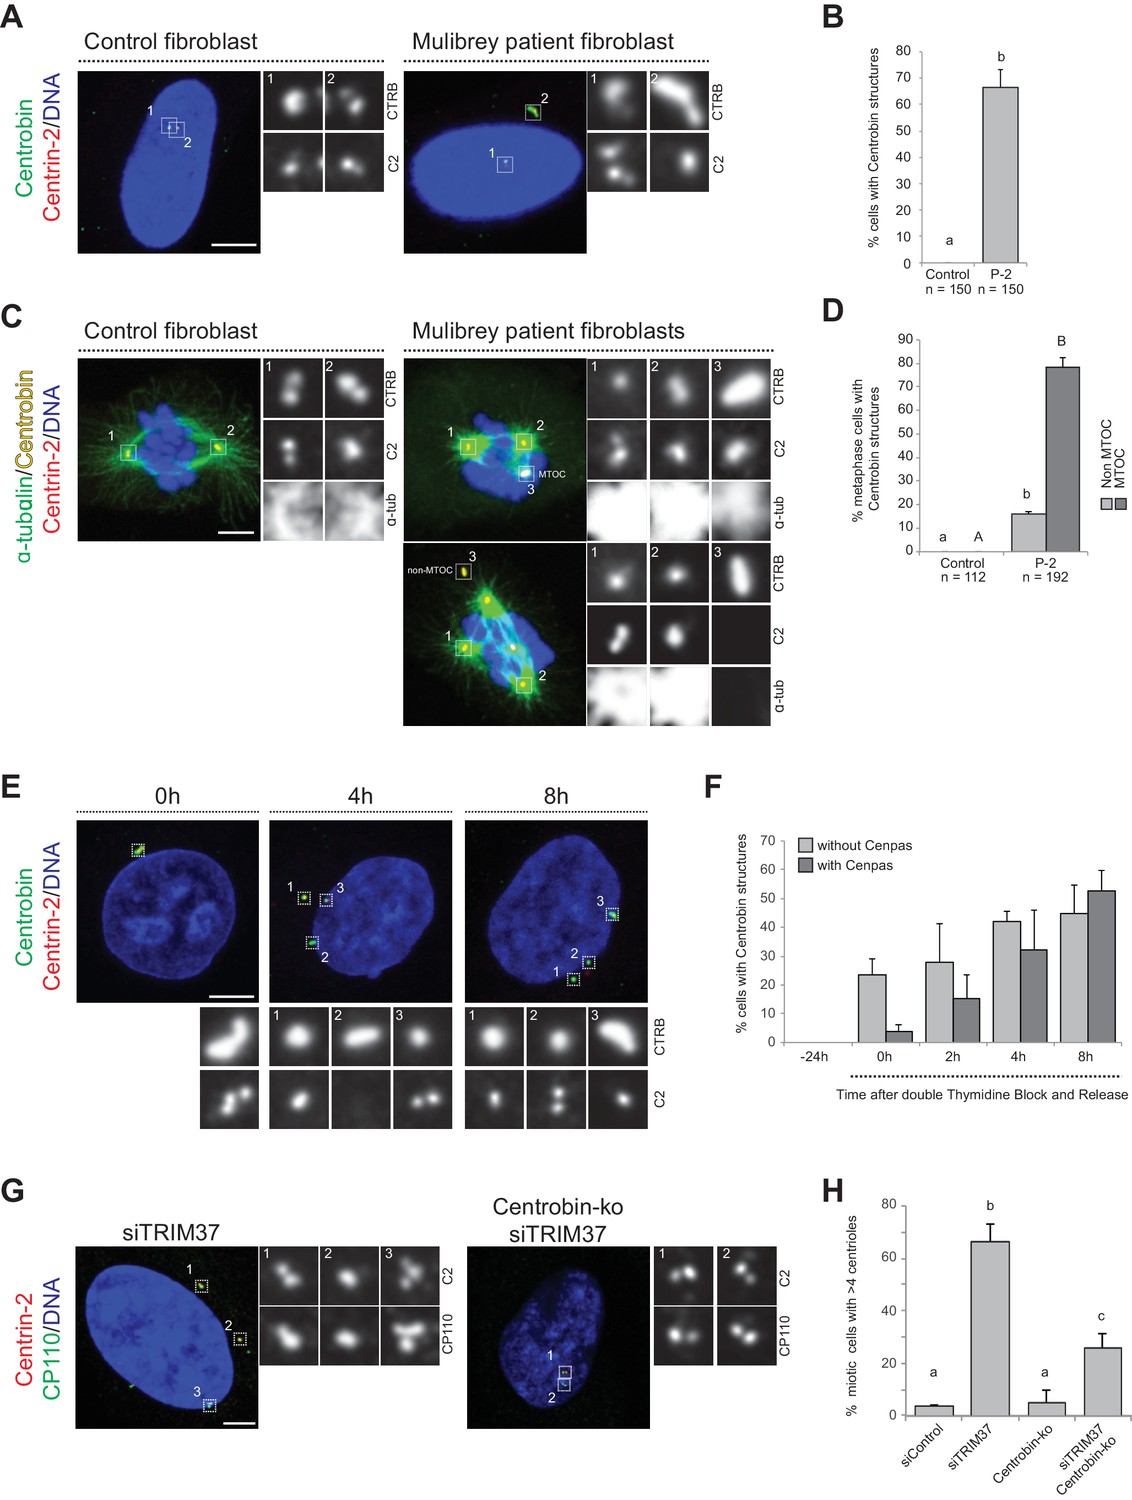
Centrobin promotes Cenpas formation.
(A) Control and patient-2 fibroblasts immunostained for Centrin-2 and Centrobin. (B) Corresponding percentage of cells bearing Centrobin structures. Chart shows the average and SDs from three independent experiments (n: total number of cells scored per condition). Here and in other charts of this figure, two conditions that do not share the same letter are significantly different from each other, with p<0.05; unpaired Student’s t-test; see Supplementary file 2 for exact p values. (C) Control and patient-2 fibroblasts in mitosis immunostained for Centrin-2, Centrobin and α-tubulin. Note that Centrobin structures can either act as MTOCs (inset 3, top cell) or not (inset 3, bottom cell). (D) Corresponding percentage of metaphase cells with Centrobin structures either associated or not associated to an active MTOC. Chart shows the average and SDs from three independent experiments (n: total number of cells scored per condition). Lower-case and upper-case letters above the charts reflect comparisons of two distinct data sets. (E) HeLa cells were synchronized with a double thymidine block, released and transfected with TRIM37 siRNAs 24 hr before second thymidine release. Cells were fixed and immunostained with antibodies against Centrin-2 and Centrobin at the time of transfection (−24 hr) and at the indicated times after release. (F) Corresponding percentage of cells with Centrobin assemblies either in close proximity to Cenpas or else not associated with them. Chart shows the average and SDs from three independent experiments (n = 50 cells each). (G) Control and Centrobin-ko RPE-1 cells transfected with TRIM37 siRNAs immunostained for Centrin-2 and CP110. (H) Corresponding percentages of mitotic cells with >4 CP110 foci. Chart shows the average and SDs from three independent experiments (n = 50 cells each). Source data for panels B, D, F, and H can be found in Figure 5—source data 1.
-
Figure 5—source data 1
Source data for figure panels: Figure 5B, D, F and H, Figure 5—figure supplement 1B and D.
- https://cdn.elifesciences.org/articles/62640/elife-62640-fig5-data1-v2.xlsx
Figure 5—figure supplement 1
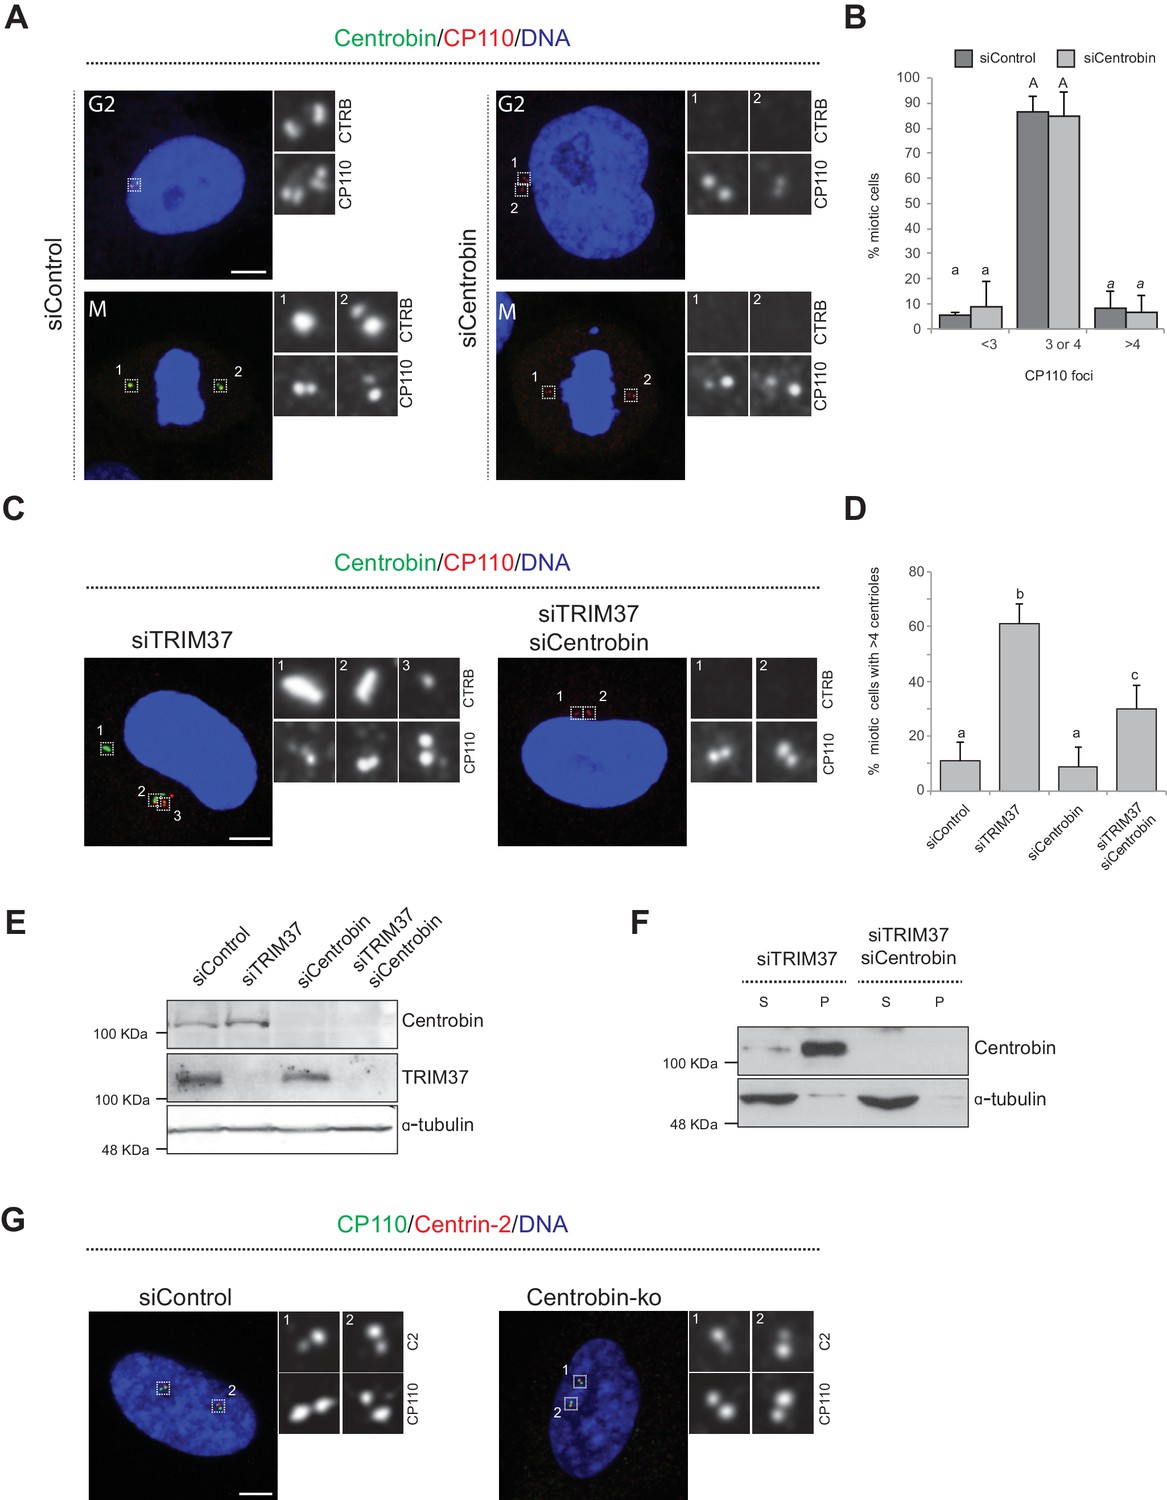
Centrobin promotes Cenpas assembly.
(A) HeLa cells in G2 or mitosis, as indicated, treated with control or Centrobin siRNAs, and immunostained for Centrobin plus CP110. (B) Corresponding percentage of mitotic cells with indicated number of CP110 foci. In the statistical analysis, lower-case, upper-case and italic letters indicate three independent set of data analyzed. Chart shows the average and SDs from three independent experiments (n = 50 cells each). Here and in other charts of this figure, two conditions that do not share the same letter are significantly different from each other, with p<0.05; unpaired Student’s t-test; see Supplementary file 2 for exact p values. (C) HeLa cells depleted of TRIM37 alone or simultaneously of TRIM37 and Centrobin, and immunostained for CP110 plus Centrobin. (D) Corresponding percentages of mitotic cells treated with the indicated siRNAs harboring >4 CP110 foci. Chart shows the average and SDs from two independent experiments (n = 50 cells each). (E) Western blot of HeLa cells depleted of TRIM37 or Centrobin alone and simultaneously of TRIM37 and Centrobin. probed with antibodies against Centrobin (top), TRIM37 (middle), or α-tubulin as loading control (bottom). (F) Western blot of soluble (S) and insoluble (P, for pellet) fractions of lysates from HeLa cells transfected with siRNAs against TRIM37 or against both TRIM37 and Centrobin, probed with antibodies against Centrobin (top) or α-tubulin as loading control (bottom). (G) Control or Centrobin-ko RPE-1 cells transfected with control siRNAs and immunostained for Centrin-2 plus CP110. Source data for panels B and D can be found in Figure 5—source data 1.
Figure 6 with 1 supplement
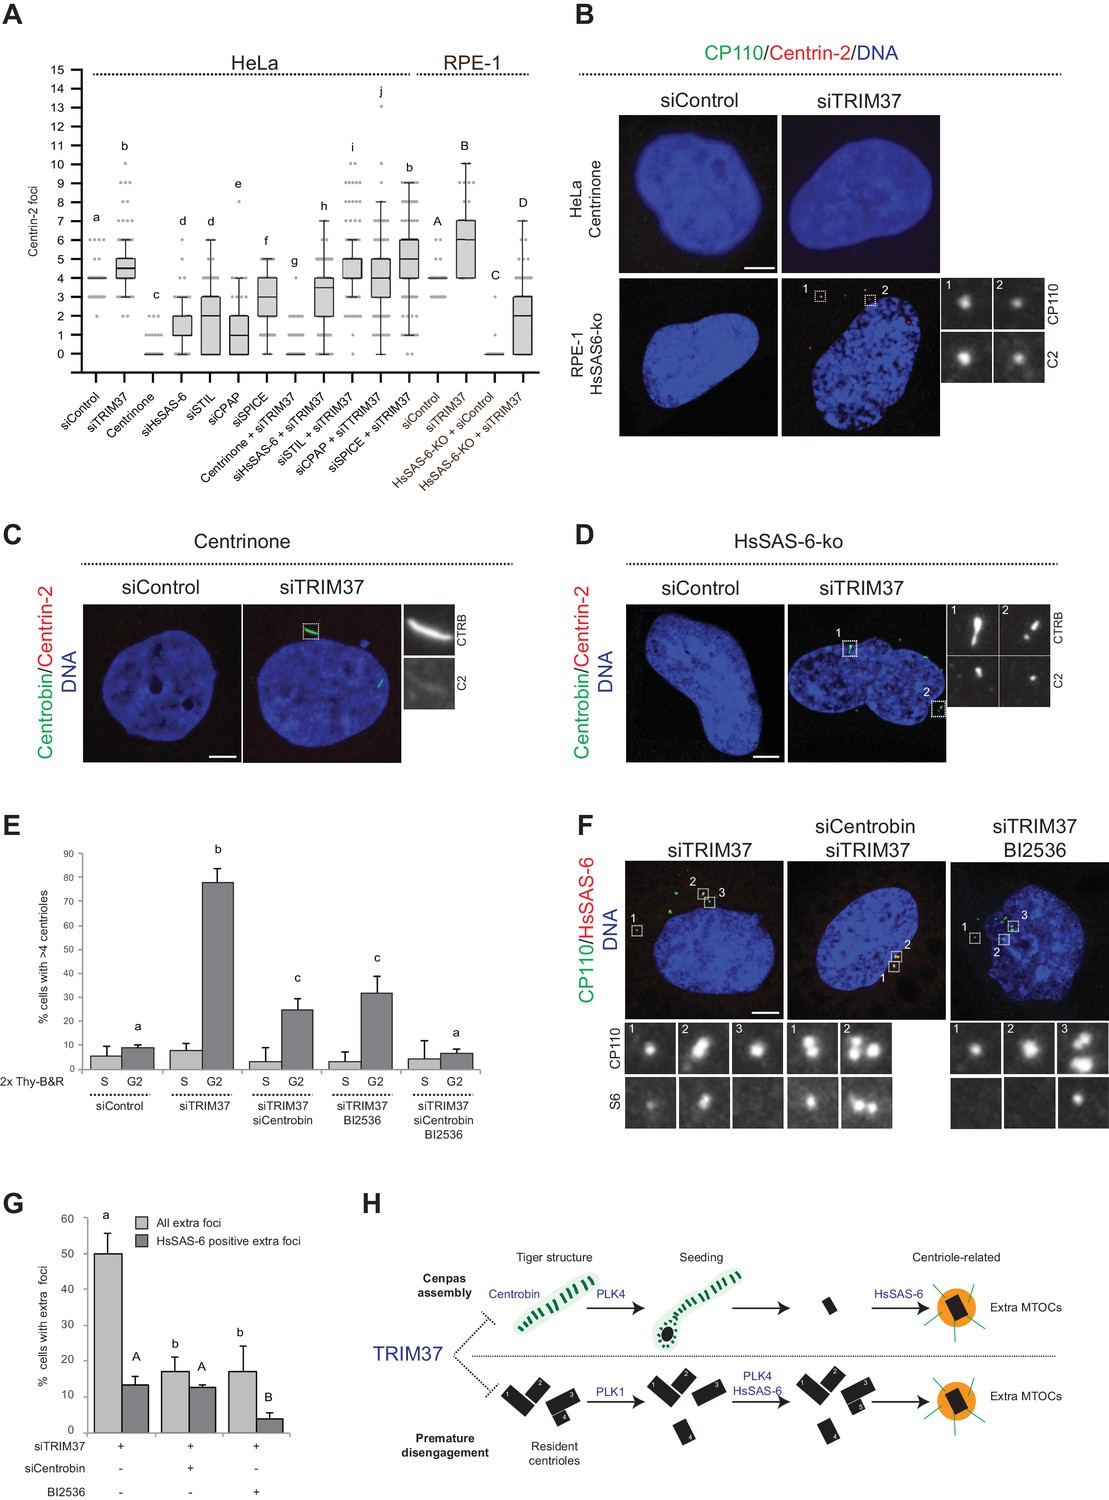
Two pathways contribute to Cenpas formation upon TRIM37 depletion.
(A) Box-and-whisker Tukey plot of Centrin-2 foci number per cell in indicated conditions. Box plots show median, interquartile range (10–90 percentile) and SDs from two independent experiments (n = 50 cells each). All cells were analyzed in mitosis with the exception of HsSAS-6-ko conditions. Here and in other charts of this figure, two conditions that do not share the same letter are significantly different from each other, with p<0.05; unpaired Student’s t-test; see Supplementary file 2 for exact p values. Lower-case and upper-case letters above the charts reflect comparisons of two distinct data sets. (B) HeLa cells grown with centrinone for 8 days (top) or RPE-1 HsSAS-6-ko cells (bottom), both treated with control or TRIM37 siRNAs, before immunostaining for CP110 and Centrin-2. (C–D) HeLa cells grown with centrinone for 8 days (C) or RPE-1 HsSAS-6-ko cells (D), both treated with control or TRIM37 siRNAs, before immunostaining for Centrobin and Centrin-2. (E) HeLa cells were synchronized with a double thymidine block, released and transfected with control, TRIM37, Centrobin, or both TRIM37 and Centrobin siRNAs, as indicated. Additionally, DMSO or BI-2536 was added to the cells, which were fixed at time 0 hr or 8 hr after release, before immunostaining with antibodies against CP110 and Centrobin. The percentage of cells with extra CP110 foci was quantified in each condition. Chart shows the average and SDs from three independent experiments (n = 50 cells each). (F) HeLa cells were synchronized with a double thymidine block, released and transfected with control, TRIM37, Centrobin, or both TRIM37 and Centrobin siRNAs, as indicated. Moreover, DMSO or BI-2536 was added to the cells, which were fixed at time 0 hr or 8 hr after release, before immunostaining with antibodies against CP110 and HsSAS-6. (G) Corresponding percentage of cells with extra CP110 foci, with an indication of the fraction of them bearing HsSAS-6. Chart shows the average and SDs from two independent experiments (n = 50 cells each). (H) Working model of TRIM37 role in preventing formation of supernumerary MTOCs. Our findings lead us to propose that TRIM37 prevents the formation of supernumerary Centrin foci through two pathways mediated by Centrobin (top) and PLK1 (bottom). The Centrobin pathway relies on tiger Centrobin assemblies that act as platforms for PLK4-dependent Cenpas formation. Thereafter, Cenpas could evolve into centriole-related structures with the stepwise incorporation of other centriolar proteins such as HsSAS-6. We propose that the PLK1 pathway might reflect its role in promoting centriole disengagement. Note that only extra MTOCs are represented. See text for details. Source data for panels A, E, and G can be found in Figure 6—source data 1.
-
Figure 6—source data 1
Source data for figure panels: Figure 6A, E and G and Figure 6—figure supplement 1A.
- https://cdn.elifesciences.org/articles/62640/elife-62640-fig6-data1-v2.xlsx
Figure 6—figure supplement 1
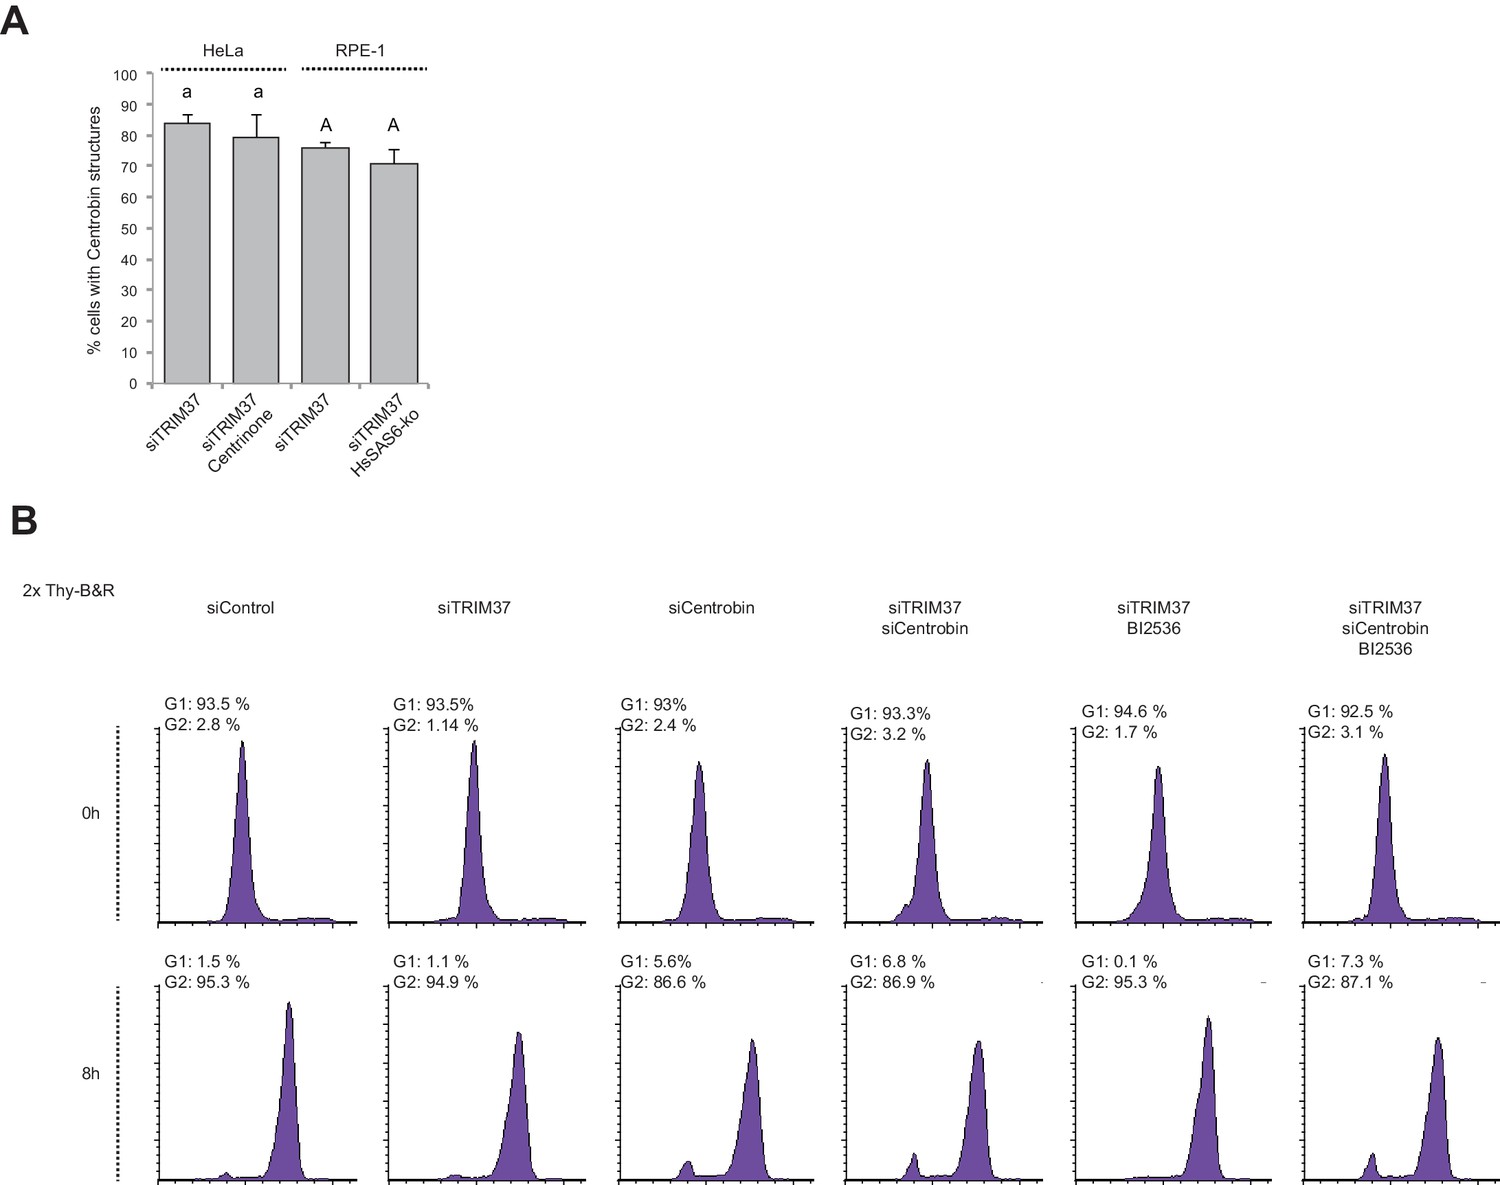
PLK4 activity and HsSAS-6 are dispensable for Centrobin assemblies.
(A) Percentages of cells with Centrobin structures in the indicated conditions. Chart shows the average and SDs at least from two independent experiments (n = 50 cells each). In the statistical analysis, lower-case and upper-case letters indicate two independent set of data analyzed. Two conditions that do not share the same letter are significantly different from each other, with p<0.05; unpaired Student’s t-test; see Supplementary file 2 for exact p values. (B) FACs profile of HeLa cells synchronized with a double thymidine block, released and transfected with control, TRIM37, Centrobin, or both TRIM37 and Centrobin siRNAs, as indicated. Additionally, DMSO or BI-2536 was added to the cells, which were fixed at time 0 hr or 8 hr after release. Source data for panel A can be found in Figure 6—source data 1.
Tables
Key resources table
| Reagent type (species) or resource | Designation | Source or reference | Identifiers | Additional information |
|---|---|---|---|---|
| Gene (Homo sapiens) | TRIM37 | Ensembl | ENST00000 262294.12 | |
| Cell line (Homo sapiens) | HeLa Kyoto | Schmitz and Gerlich, 2009 | ||
| Cell line (Homo sapiens) | HeLa Centrin-1:GFP | Piel et al., 2000 | ||
| Cell line (Homo sapiens) | U2OS | Sigma | 92022711 | |
| Cell line (Homo sapiens) | hTERT-RPE-1 | ATCC | CRL-4000 | |
| Cell line (Homo sapiens) | hTERT-RPE-1 p53 -/- Centrin-1:eGFP | This work | carrying an integrated plasmid (pCW57.1) expressing Centrin-1:eGFP under a doxycycline inducible promoter (generous gift from George Hatzopoulos) | |
| Cell line (Homo sapiens) | hTERT-RPE-1 Centrobin -/- | Ogungbenro et al., 2018 | ||
| Cell line (Homo sapiens) | hTERT-RPE-1 TRIM37 -/- | Meitinger et al., 2016 | ||
| Cell line (Homo sapiens) | primary fibroblast | This work | skin biopsy samples a control individual, with approval by the Institutional Review Board of the Helsinki University Central Hospital (183/13/03/03/2009). | |
| Cell line (Homo sapiens) | primary fibroblast | This work | skin biopsy samples from a Mulibrey nanism patient (P-1) homozygous for the Finnish founder mutation with approval by the Institutional Review Board of the Helsinki University Central Hospital (183/13/03/03/2009). | |
| Cell line (Homo sapiens) | primary fibroblast | This work | skin biopsy samples from a Mulibrey nanism patient (P-2) homozygous for the Finnish founder mutation with approval by the Institutional Review Board of the Helsinki University Central Hospital (183/13/03/03/2009). | |
| Antibody | Anti-TRIM37 (Rabbit polyclonal) | Bethyl Laboratories | A301-174A | WB (1/1000) |
| Antibody | Anti- α-tubulin (Mouse monoclonal) | Sigma-Aldrich | T6199 (DM1a) | WB (1/13000) IF (1/1000) |
| Antibody | Anti-Centrobin (Rabbit polyclonal) | Atlas Ab | HPA023321 | WB (1/500) IF (1/1000) |
| Antibody | Anti-Centrobin (Mouse monoclonal) | Abcam | Ab70448 | IF (1/1000) |
| Antibody | Anti-HSP70 (Mouse monoclonal) | Santa Cruz Biotechnology | sc-24 | WB (1/20000) |
| Antibody | Anti-GFP (human) | Antibody platform of Institute Curie | A-R-H#11 | IF (1/50) |
| Antibody | Anti- α-tubulin (human) | Antibody platform of Institute Curie | A-R-H#02 | IF (1/50) |
| Antibody | Anti-HsSAS-6 (Mouse monoclonal) | Santa Cruz Biotechnology | sc-81431 | IF (1/500) |
| Antibody | Anti-CEP63 (Rabbit polyclonal) | Millipore | 06–1292 | IF (1/1000) |
| Antibody | Anti-CEP152 (Rabbit polyclonal) | Sigma Aldrich | HPA039408 | IF (1/2000) |
| Antibody | Anti-acetylated tubulin (Mouse monoclonal) | Sigma Aldrich | T6793 | IF (1/1000) |
| Antibody | Anti-γ-tubulin (Mouse monoclonal) | Sigma Aldrich | T5326 | IF (1/1000) |
| Antibody | Anti-Centrin 2 (Mouse Monoclonal) | Sigma Aldrich | 20H5 | IF (1/1000) |
| Antibody | Anti-CEP164 (Rabbit polyclonal) | Novus Biologicals | 45330002 | IF (1/1000) |
| Antibody | Anti-CP110 (Rabbit polyclonal) | Proteintech | 12780–1-AP | IF (1/1000) |
| Antibody | Anti-CEP135 (Rabbit polyclonal) | Abcam | Ab-75005 | IF (1/1000) |
| Antibody | Anti-CPAP (Rabbit polyclonal) | Kohlmaier et al., 2009 | IF (1/500) | |
| Antibody | Anti-SPICE (Rabbit polyclonal) | Sigma Aldrich | HPA064843 | IF (1/500) |
| Antibody | Anti-Ninein (Rabbit polyclonal) | Delgehyr et al., 2005 | L77 | IF (1/8000) |
| Antibody | Anti-hPOC5 (Rabbit polyclonal) | Azimzadeh et al., 2009 | IF (1/1000) | |
| Antibody | Anti-C-Nap (Mouse monoclonal) | BD Biosciences | 611374 | IF (1/400) |
| Antibody | Anti-STIL (Rabbit polyclonal) | Abcam | Ab-222838 | IF (1/2000) |
| Antibody | Anti-PCNT (Rabbit polyclonal) | Abcam | Ab-4448 | IF (1/1000) |
| Antibody | Anti-AKAP450 (Mouse monoclonal) | BD Biosciences | 611518 | IF (1/1000) |
| Antibody | Anti-CDK5-Rap2 (Rabbit polyclonal) | Millipore | 06–1398 | IF (1/1000) |
| Antibody | Anti-CEP192 (Rabbit polyclonal) | Zhu et al., 2008 | IF (1/1000) | |
| Antibody | Anti-CEP170 (Rabbit polyclonal) | Sigma Aldrich | HPA042151 | IF (1/1000) |
| Antibody | Anti-P-T210-PLK1 (Mouse monoclonal) | BD Bioscience | 558400 | IF (1/1000) |
| Antibody | Anti-Rootletin (Rabbit polyclonal) | Santa Cruz Biotechnology | sc-374056 | IF (1/200) |
| Antibody | Anti-CEP68 (Rabbit polyclonal) | Atlas Ab | HPA040493 | IF (1/1000) |
| Antibody | Anti-PLK4 (Rabbit polyclonal) | Sillibourne et al., 2010 | raised against PLK4 kinase domain residues 13–265 | IF (1/1000) |
| Antibody | Anti-PLK4 (Rabbit polyclonal) | Moyer et al., 2015 | raised against residues 510-970 | IF (1/1000) |
| Antibody | Anti-PLK4 (Rabbit polyclonal) | Wong et al., 2015 | raised against residues 814–970 | IF (1/2000) |
| Recombinant DNA reagent | pEBTet-TRIM37:GFP (plasmid) | Balestra et al., 2013 | GFP fused version of TRIM37 into pEB-tet plasmid under a doxycycline inducible promoter | |
| Recombinant DNA reagent | p-Centrobin:GFP (plasmid) | Shin et al., 2015 | GFP fused version of Centrobin | |
| Recombinant DNA reagent | pEGFP:SPICE (plasmid) | Archinti et al., 2010 | GFP fused version of SPICE | |
| Recombinant DNA reagent | pcDNA3-TRIM37:GFP (plasmid) | This paper | GFP fused version of TRIM37 | |
| Recombinant DNA reagent | pcDNA3-TRIM37: NES:GFP (plasmid) | This paper | GFP fused version of TRIM37 with the HIV-Rev NES sequence (LQLPPLERLTLD) Wen et al., 1995 | |
| Sequenced-based reagent | CNTROB-FW | This paper | PCR primers | 5‘-GTCTCCATCTAGCTCAGCCC-3’ |
| Sequenced-based reagent | CNTROB-RV | This paper | PCR primers | 5‘-AGGCTCTGAATATGGCGCT C-3’ |
| Sequenced-based reagent | TRIM37-FW | This paper | PCR primers | 5‘-TGCCATCTTACGATTCAGCTAC-3’ |
| Sequenced-based reagent | TRIM37- RV | This paper | PCR primers | 5‘-CGCACAACTCCATTTCCATC-3’ |
| Sequenced-based reagent | GAPDH-FW | This paper | PCR primers | 5‘-GGAAGGTGA AGGTCGGAGTC-3’ |
| Sequenced-based reagent | GAPDH-RV | This paper | PCR primers | 5‘-GTTGAGGTCAATGAAGGGGTC-3’ |
| Sequenced-based reagent | siRNA-TRIM37 | Invitrogen Balestra et al., 2013 | 5‘-UUAAGGACCGGA GCAGUAUAGAAAA-3’ | |
| Sequenced-based reagent | siRNA-Centrobin | Invitrogen Zou et al., 2005 | 5‘-AGUGCCAGACUGCAGCAACGGGAAA-3’ | |
| Sequenced-based reagent | siRNA-SPICE | Invitrogen Archinti et al., 2010 | 5‘-GCAGCUGAGAACAAAUGAGUCAUUA-3’ | |
| Sequenced-based reagent | siRNA-HsSAS-6 | Invitrogen Strnad et al., 2007 | 5‘-GCACGUUAAUCAGCUACAAUU-3’ | |
| Sequenced-based reagent | siRNA-STIL | Invitrogen Kitagawa et al., 2011a | 5‘-AACGUUUACCAUACAAAGAAA-3’ | |
| Sequenced-based reagent | siRNA-CPAP | Invitrogen Kitagawa et al., 2011a | 5‘-AGAAUUAGCUCGAAUAGAA-3’ | |
| Sequenced-based reagent | siRNA-PLK4 | Invitrogen Balestra et al., 2013 | 5‘-GAAAUGAACAGGUAUCUAA-3’ | |
| Sequenced-based reagent | Stealth RNAi siRNA Negative Control Lo GC | Invitrogen | 12935200 | |
| Chemical compound | BI-2536 | Selleck Chemicals | S1109 | 10 μM |
| Chemical compound | RO-3306 | Sigma Aldrich | SML0569 | 10 μM |
| Chemical compound | Centrinone | MCE | Hy-18682 | 125 nM |
| Chemical compound | Cycloheximide | Sigma Aldrich | C7698 | 150 μg/ml |
Additional files
-
Supplementary file 1
Summary table of CLEM analysis.
Summary of CLEM analysis of HeLa or RPE-1 cells depleted of TRIM37, with number of GFP foci, as well as corresponding resident centriole/procentriole and Cenpas ultrastructure identified by CLEM. See main text for further details. Note that no distinct ultrastructure was found for 5 Centrin-1:GFP foci in cell 4, perhaps reflecting a technical issue in this case.
- https://cdn.elifesciences.org/articles/62640/elife-62640-supp1-v2.xlsx
-
Supplementary file 2
Statistical analysis table.
Table summarizing the statistical analysis show in main Figures and Figures Supplements. Statistical significance was determined with an unpaired Student’s t-test using PRISM software (Graphpad Software Inc).
- https://cdn.elifesciences.org/articles/62640/elife-62640-supp2-v2.xlsx
-
Transparent reporting form
- https://cdn.elifesciences.org/articles/62640/elife-62640-transrepform-v2.docx
Download links
A two-part list of links to download the article, or parts of the article, in various formats.
Downloads (link to download the article as PDF)
Open citations (links to open the citations from this article in various online reference manager services)
Cite this article (links to download the citations from this article in formats compatible with various reference manager tools)
TRIM37 prevents formation of centriolar protein assemblies by regulating Centrobin
eLife 10:e62640.
https://doi.org/10.7554/eLife.62640


