Distinct clonal evolution of B-cells in HIV controllers with neutralizing antibody breadth
- Ragon Institute of MGH, MIT and Harvard, United States
- Atreca Inc, United States
- Center for Virology and Vaccine Research, Beth Israel Deaconess Medical Center, United States
Figures
Figure 1 with 3 supplements

Non-neutralizer (NN) and top-neutralizer (TN) memory B-cells (MBCs) B-cell receptor (BCR) repertoires.
(A) IgG subclass distribution in NNs and TNs. (B) The proportion of IGHV-IGLV gene combination in NN and TN individuals' usage was averaged and plotted in heatmaps representing the intensities of heavy and light chain paired V gene usage. (C) CDRH3 and CDRL3 length distribution (in aa) in NN and TN.
Figure 1—figure supplement 1

Non-neutralizer (NN) and top-neutralizer (TN) characteristics at time of sampling.
Figure 1—figure supplement 2

Gating strategy to identify and sort single envelope (Env)-specific memory B cells.
Figure 1—figure supplement 3
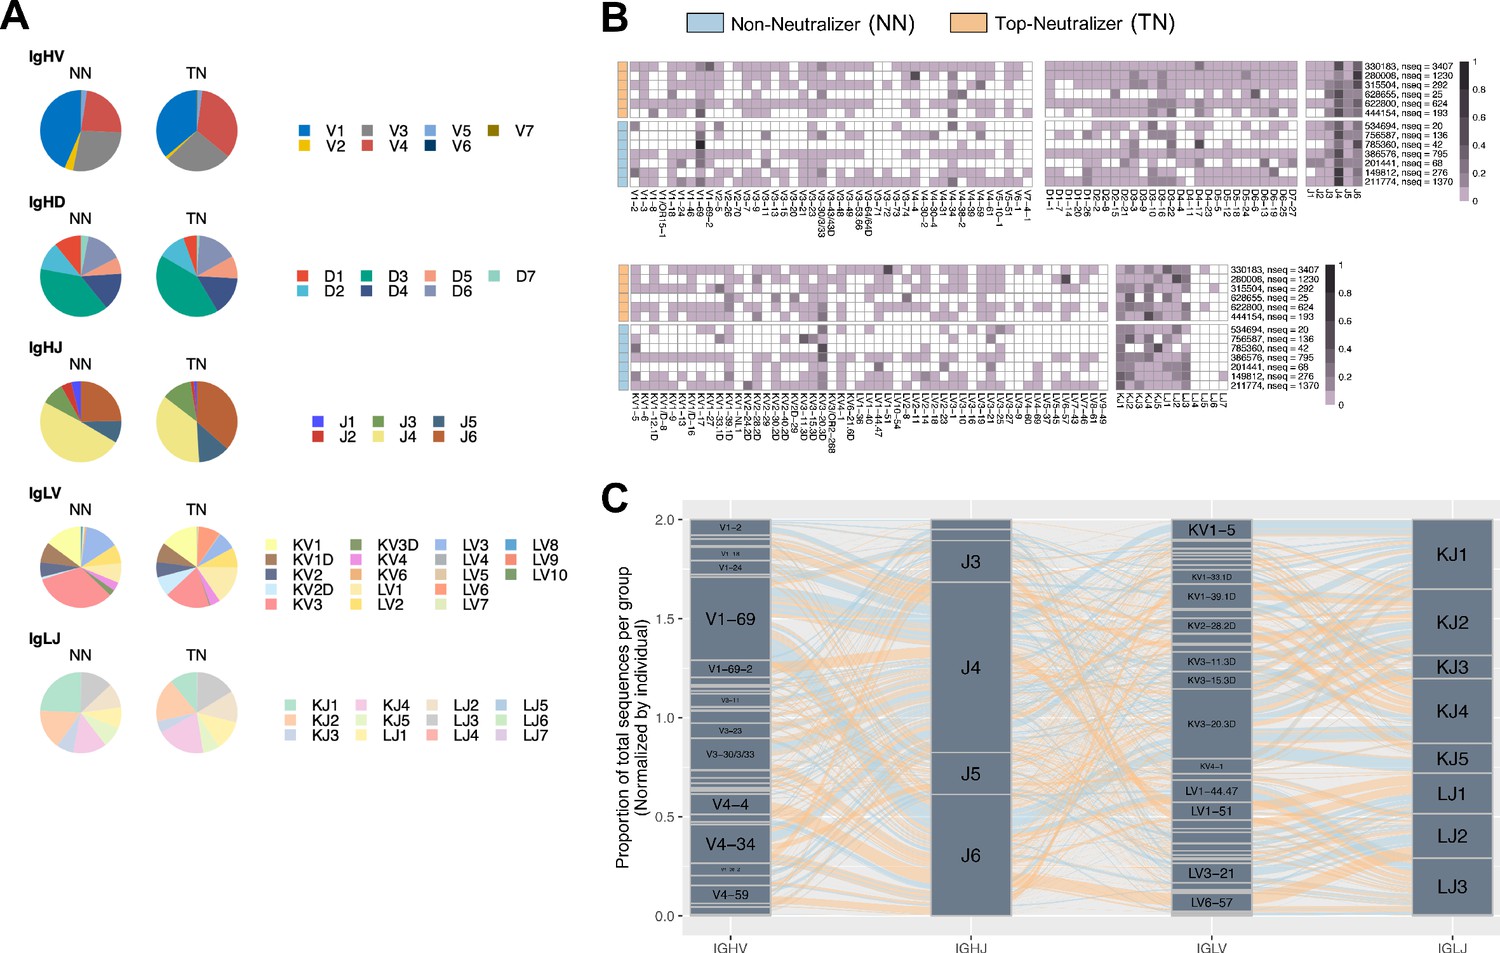
Non-neutralizer (NN) and top-neutralizer (TN) B-cell receptor (BCR) repertoires.
(A) The frequencies at which the IGH V/D/J and IGL V/J gene families are expressed by NN and TN memory B-cells (MBCs) are shown in pie charts as the average of percentages of gene sequences obtained in each individual. (B) The proportion of IGHV, IGHD, IGLV, IGLJ genes used per individual was plotted in a heatmap. Each row is annotated with the donor ID and the number of total sequences obtained from the individual. (C) The frequencies at which the paired IGH and IGL V/J gene families are expressed by NN and TN MBCs are shown. Per individual, proportions of each IGHV-IGHJ-IGLV-IGLV gene combination over the total number of sequences obtained from the individual were calculated. Then, these proportions are averaged in each NN and TN group separately. The total height of the plot reflects the cumulative quantity of the proportions. The height of each gene segment represents the proportion of usage. The thickness of flow lines reflects the proportion of gene combinations, NN sequences as blue lines, and TN sequences as orange lines.
Figure 2
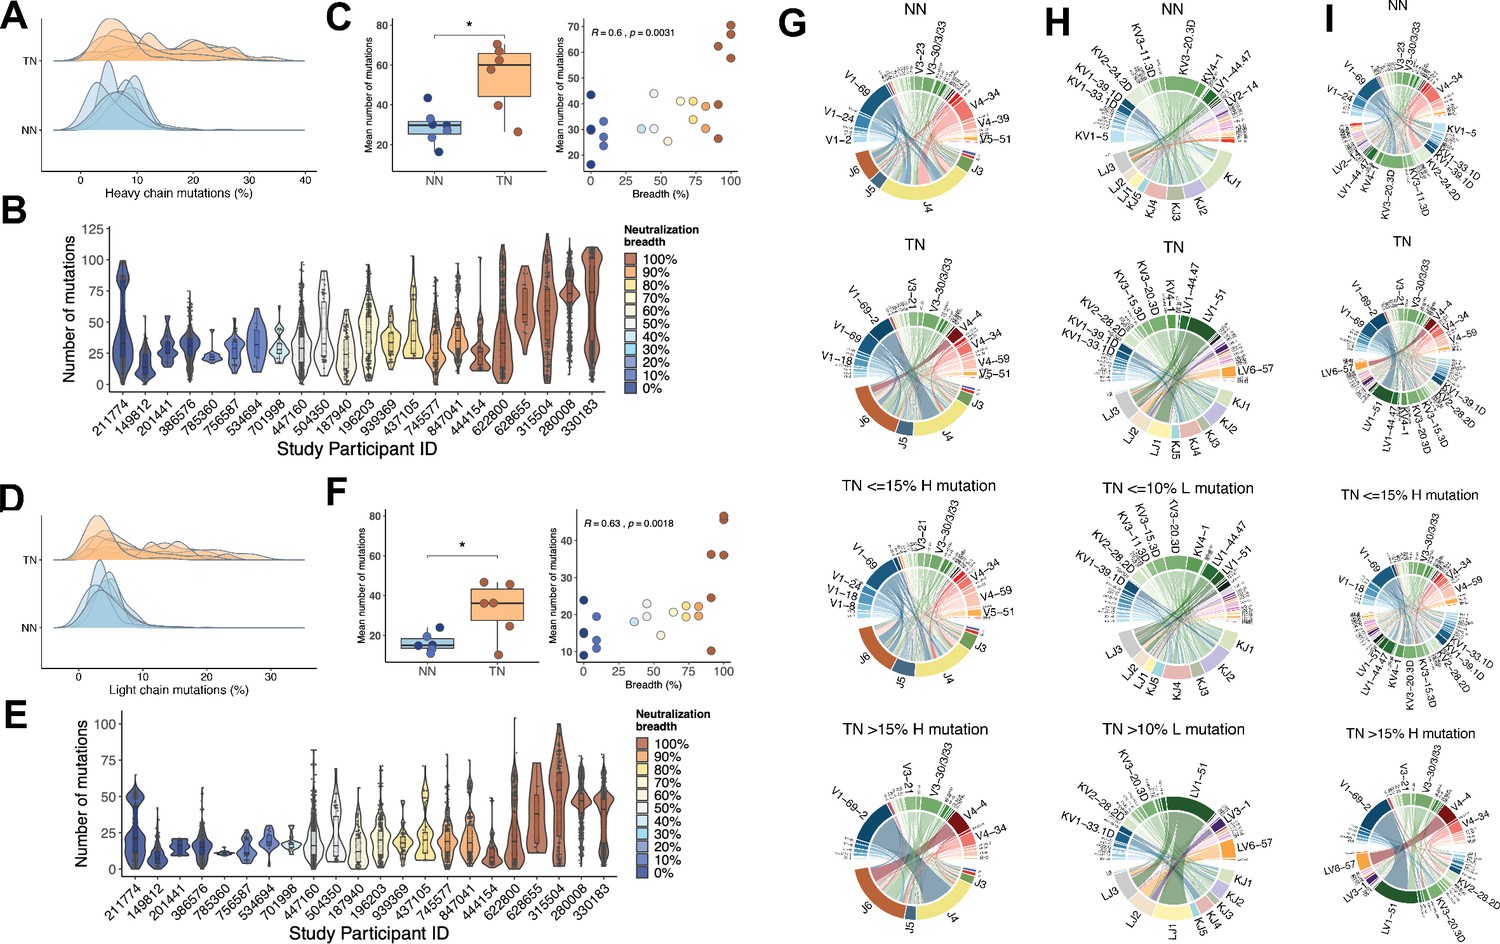
Mutation characteristics of IGHV and IGLV genes and associations with neutralization breadth.
(A) The overall mutation frequencies in IGHV in top-neutralizers (TNs) versus non-neutralizers (NNs) are significantly different with mean number of mutations of 54 in TNs and 29 in NNs (unpaired t-test, p<0.05). (B) The number of mutations in IGHV for each of the 22 study participants is plotted and the serum neutralization breadth is color-coded ranging from blue (0% neutralization) to red (100% neutralization). (C) The mean frequency of mutations in IGHV correlates with the serum neutralization breadth in % (Spearman’s rho = 0.60, p<0.01). Similarly, for IGLV, the mean number of mutations differ (35 in TNs and 14 in NNs) (D) and correlates with the serum neutralization breadth in % (r = 0.63, p<0.01) (E and F). Circos plots summarize the combinations of V and J segments used in the rearranged IGH genes (G) and IGL genes (H) and V segment combinations of IGH and IGL (I) expressed by memory B-cells (MBCs). Top circos graphs demonstrate combinations expressed by NN MBCs and second row graphs demonstrate TN MBCs independent of the number of detected mutations. Third and fourth row circos graphs demonstrate gene combinations expressed by TN MBCs with low and high mutation rates. For each (G)/(H) plot, the bottom half depicts J genes and the top half depicts V genes. For (I) top half depicts IGHV and bottom half IGLV. To exclude potential bias caused by the number of input cells, the number of sequences in each repertoire signature was weighted by the total number of sequences and total number of unique clones in each individual (see 'Materials and methods'). The arc length of each segment denotes the normalized frequency at which each gene segment was identified. Rearrangement of a J gene with a V gene segment in a clonal immunoglobulin (Ig) sequence is represented by a ribbon (ribbons carry the color of the HV or LV family of the gene participating in the pairing). The width of the ribbons corresponds to the weighted frequency at which each particular HV-HJ or LV-LJ rearrangement was used in the respective MBC repertoire.
Figure 3
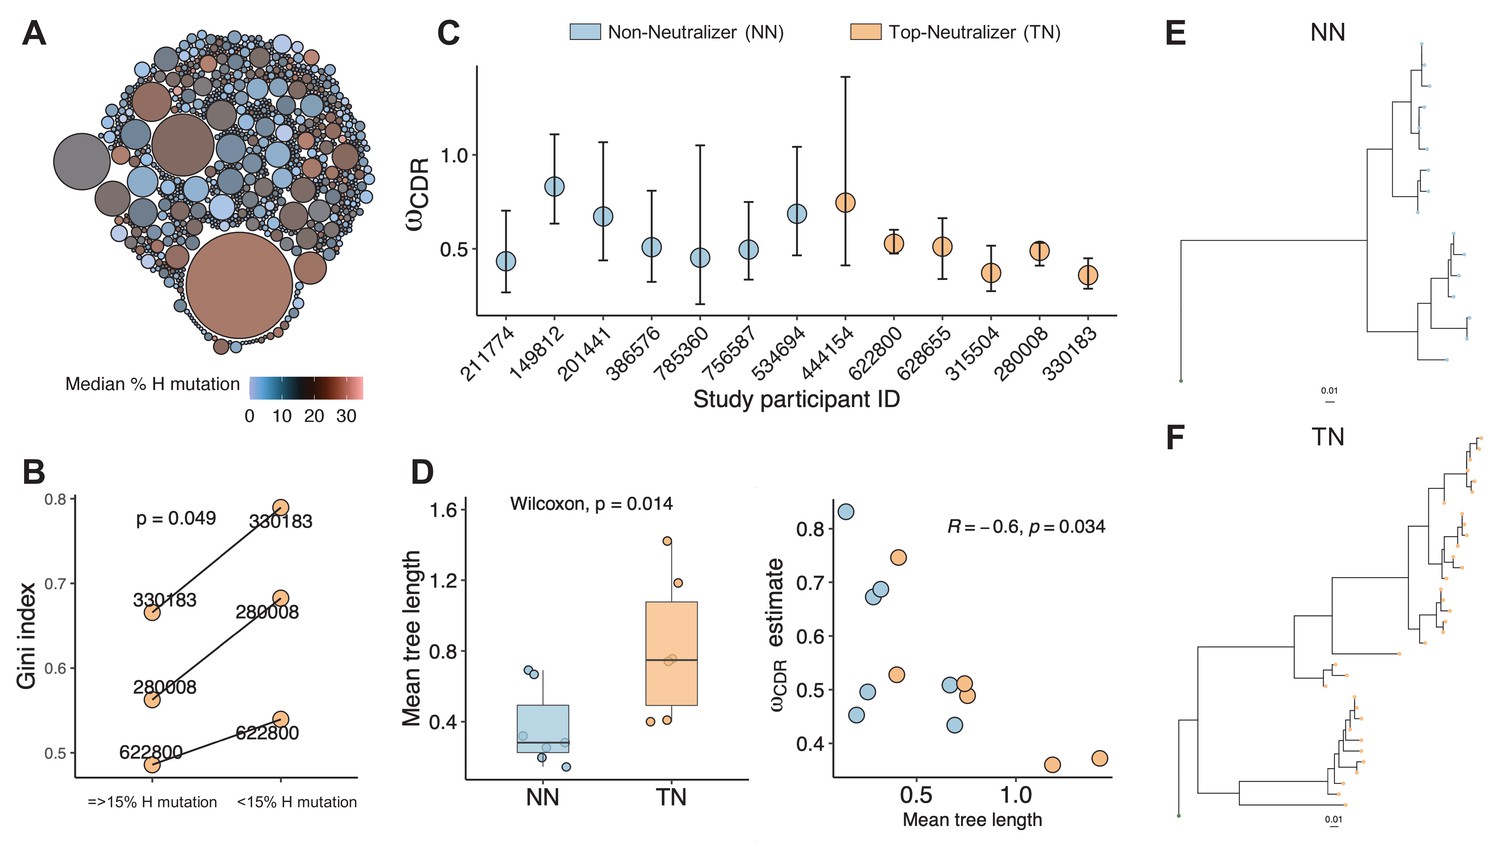
Clonality analysis.
A total number of 770 clones were obtained for top-neutralizers (TNs). (A) Each clone is represented as a circle. The sizes of the circles are scaled to the number of sequences in each clone (mean number of sequences 7.4); the colors represent mean number of mutations per clone. Dominant clones consist of highly mutated sequences. (B) Gini index (0 represents perfect equality and one perfect inequality) was calculated as an estimate of clonality for TNs for which a total of more than 600 sequences were obtained (subject IDs: 330183, 280008, 622800). Per each subject, sequences were divided into two sets as high mutated sequences (>60 mutations) and low mutated sequences (≤60 mutations). Each set of sequences were clustered into clones and Gini index was calculated. Gini Index is higher (paired t-test, p=0.04) in highly mutated sequence sets supporting the presence of fewer dominant clones. (C) Maximum likelihood point estimates of ω with 95% confidence intervals. (D) Estimates of mean tree length (total substitutions per codon within a lineage, averaged across all lineages within a repertoire) were compared between TN and non-neutralizer (NN) using Wilcoxon rank sum test (left graph). The correlation between ω and mean tree length calculated using Spearman’s correlation. Largest lineage trees in NNs (E) and TNs (F).
Author response image 1
Tables
Key resources table
| Reagent type (species) or resource | Designation | Source or reference | Identifiers | Additional information |
|---|---|---|---|---|
| Chemical compound, drug | Propidium iodide | Life Technologies | Cat# P1304MP | |
| Antibody | Anti-CD3 (FITC, clone UCHT1) | Biolegend | Cat# 300406, RRID:AB_314060 | 10 μg/ml |
| Antibody | Anti-CD14 (FITC, clone HCD14) | Biolegend | Cat# 325604, RRID:AB_830677 | Dilution (1:100) |
| Antibody | Anti-IgM (FITC, clone MHM-88) | Biolegend | Cat# 314506, RRID:AB_493009 | Dilution (1:100) |
| Antibody | Anti-CD20 (PE-cy7, clone 2H7) | BD Biosciences | Cat# 560735, RRID:AB_1727450 | Dilution (1:100) |
| Antibody | Anti-CD19 (BV421, clone HIB19) | Biolegend | Cat# 302233, RRID:AB_10897802 | Dilution (1:100) |
| Antibody | Anti-IgA (FITC, clone IS11-8E10) | Miltenyi Biotec | Cat# 130-093-071, RRID:AB_1036156 | Dilution (1:100) |
| Antibody | hCD40L His tag | BPS Biosciences | Cat# 71191 | Dilution (1:100) |
| Chemical compound, drug | Streptavidin conjugated to PE or AlexaFluor 647 | Life Technologies | ||
| Recombinant protein | Clade B JR-CSF gp120, JR-FL gp140, 92BR020 gp120, clade A BG505 SOSIP, clade C IAVI C22 gp120 | Duke Human Vaccine Institute, protein production facility | ||
| Cell line (Homo sapiens) | TZM-bl cells | NIH AIDS Reagent Program | Cat# 8129–442, RRID:CVCL_B478 | |
| Recombinant DNA reagent | AC10.0.29, RHPA4259.7, THRO4156.18, REJO4541.67, WITO4160.33, TRO.11, SC422661.8, QH0692.42, CAAN5342.A2, PVO.4 TRJO4551.58 | Seaman lab | Plasmids | |
| Commercial assay or kit | Ampure XP beads | Beckman Coulter | Cat# A63881 | |
| Commercial assay or kit | Quant-iT PicoGreen dsDNA Assay Kit | Invitrogen | Cat# P7589 | |
| Software, algorithm | FlowJo | https://www.flowjo.com/solutions/flowjo | RRID:SCR_008520 | |
| Software, algorithm | IgBLAST | https://www.ncbi.nlm.nih.gov/igblast/ | RRID:SCR_002873 | |
| Software, algorithm | 454 GS FLX data analysis software | Roche | RRID:SCR_018028 | |
| Software, algorithm | R version 4.0.0 | https://cloud.r-project.org | RRID:SCR_001905 | |
| Software, algorithm | Igphyml (version 1.1.0) | https://igphyml.readthedocs.io/en/latest/ | ||
| Software, algorithm | Alakazam (version 1.0.0) | https://alakazam.readthedocs.io/en/1.0.1/news/ |
Additional files
-
Supplementary file 1
Study participant characteristics.
CD4+ T-cell counts (cells/μl), viral loads (HIV RNA copies/ml) and neutralization titers (50% inhibitory dose [ID50], 1/x] from each individual against a panel of 11 tier 2 and 3 envelope (Env)-pseudoviruses and murine leukemia virus (MuLV)-pseudotyped virion control. The right column (breadth %) shows the % of viruses that are neutralized above background (3× MuLV control). Six individuals with neutralization of more than 90% of the panel classified as top-neutralizer (TN) while neutralization of less than 10% of the panel viruses classified as non-neutralizer (NN).
- https://cdn.elifesciences.org/articles/62648/elife-62648-supp1-v1.docx
-
Supplementary file 2
Annotated sequences.
- https://cdn.elifesciences.org/articles/62648/elife-62648-supp2-v1.xlsx
-
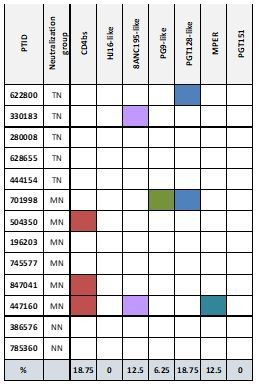
Supplementary file 3
Sequences similarity with known broadly neutralizing antibody (bNAb) families.
- https://cdn.elifesciences.org/articles/62648/elife-62648-supp3-v1.xlsx
-
Transparent reporting form
- https://cdn.elifesciences.org/articles/62648/elife-62648-transrepform-v1.docx
Download links
A two-part list of links to download the article, or parts of the article, in various formats.
Downloads (link to download the article as PDF)
Open citations (links to open the citations from this article in various online reference manager services)
Cite this article (links to download the citations from this article in formats compatible with various reference manager tools)
Distinct clonal evolution of B-cells in HIV controllers with neutralizing antibody breadth
eLife 10:e62648.
https://doi.org/10.7554/eLife.62648


