A genetic screen identifies new steps in oocyte maturation that enhance proteostasis in the immortal germ lineage
- Calico Life Sciences LLC, United States
- Department of Molecular and Cellular Biology, University of California, Berkeley, United States
- Dominick P. Purpura Department of Neuroscience, Albert Einstein College of Medicine, United States
Figures
Figure 1 with 2 supplements
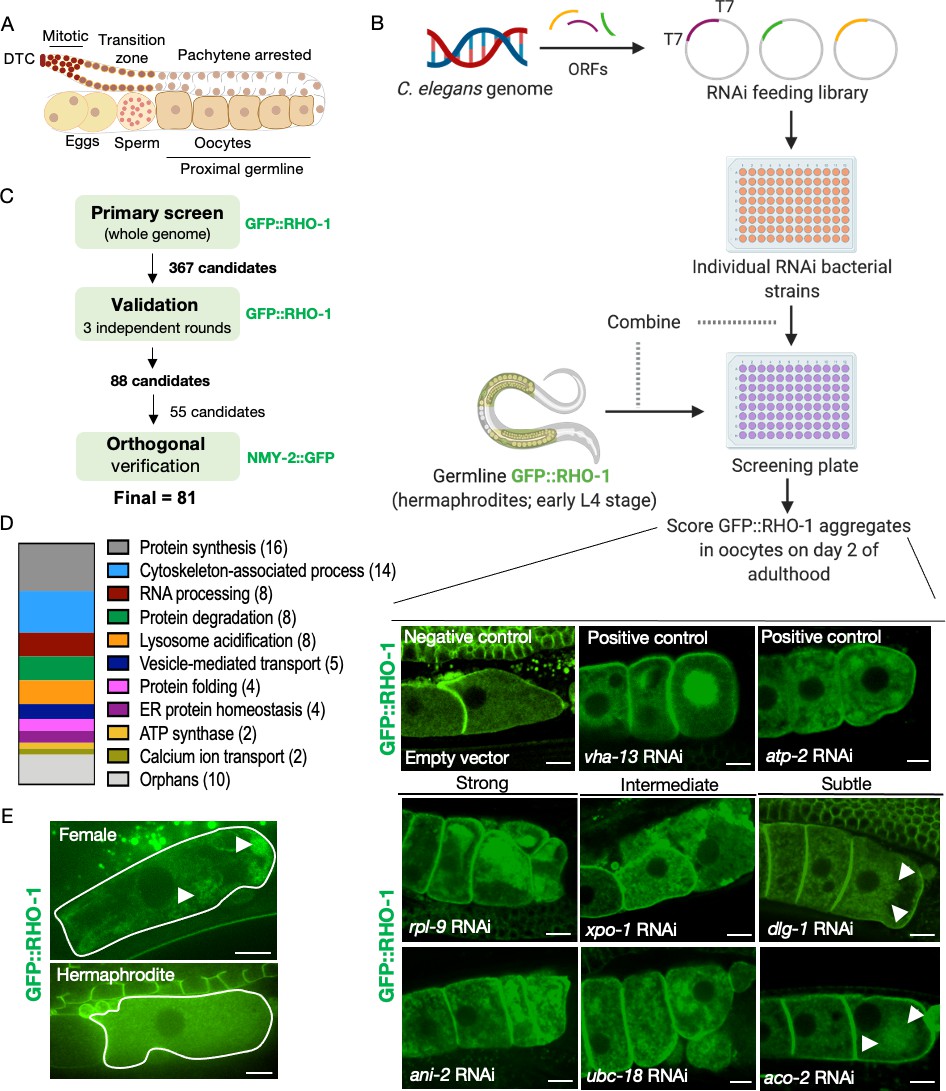
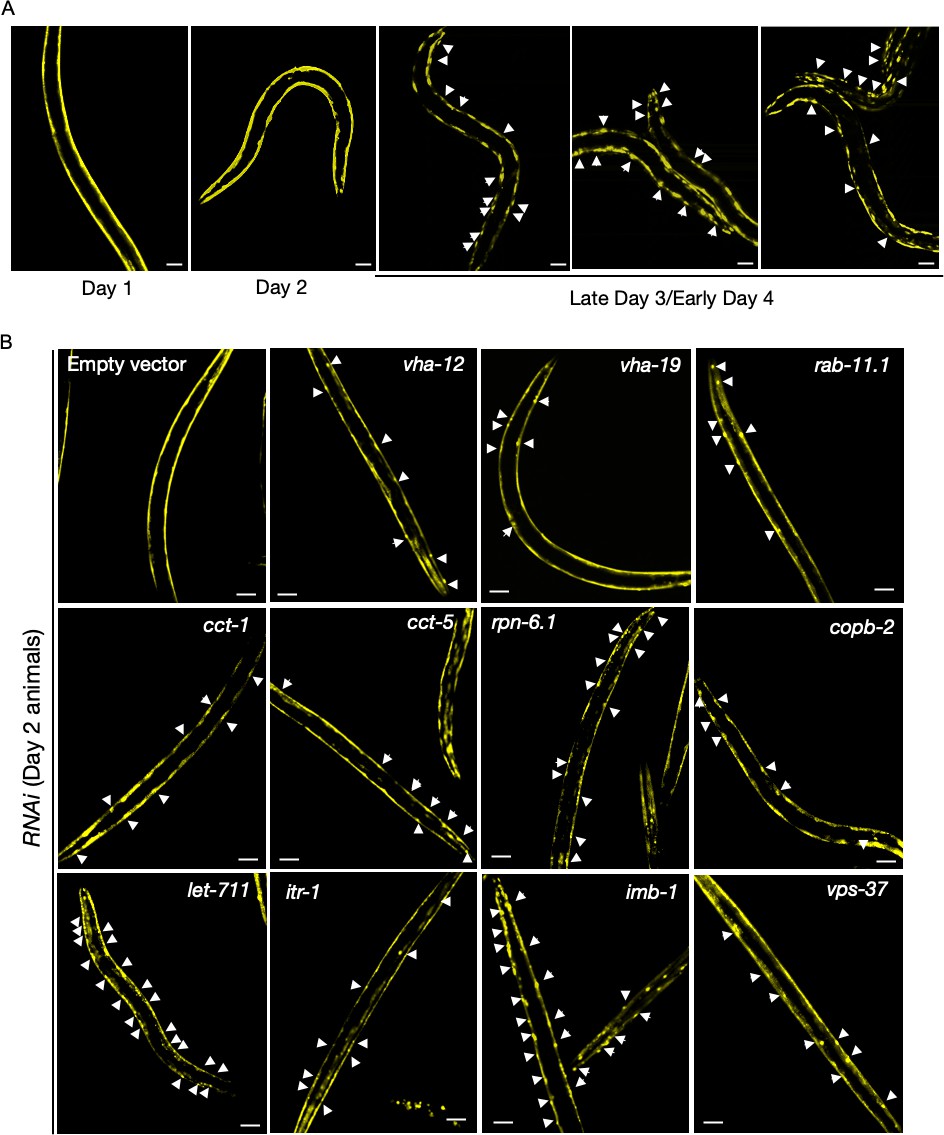
Identification of genes that prevent protein aggregation in maturing C. elegans oocytes.
(A) Diagram of the C. elegans germline. (B) Genome-wide RNAi-screen workflow. High-resolution images from the validation rounds are represented here. Scale bars, 10 µm; white arrows, GFP::RHO-1 aggregates in subtle hits. (C) Schematic representation of the procedure used for candidate validation and orthogonal verification using two independent germline-specific reporters. 45 candidates representing the major gene ontology (GO) categories, and all 10 orphans were subjected to orthogonal verification. (D) Common biological process GO categories enriched in the screen hits. Genes that were not members of these enriched categories were classified as orphans. (E) Very early oocytes of females and hermaphrodites (CF4557 and CF4552 strains, respectively). GFP::RHO-1 aggregates often appear in newly formed female oocytes. Scale bars, 10 µm; white arrows, GFP::RHO-1 aggregates.
Figure 1—figure supplement 1
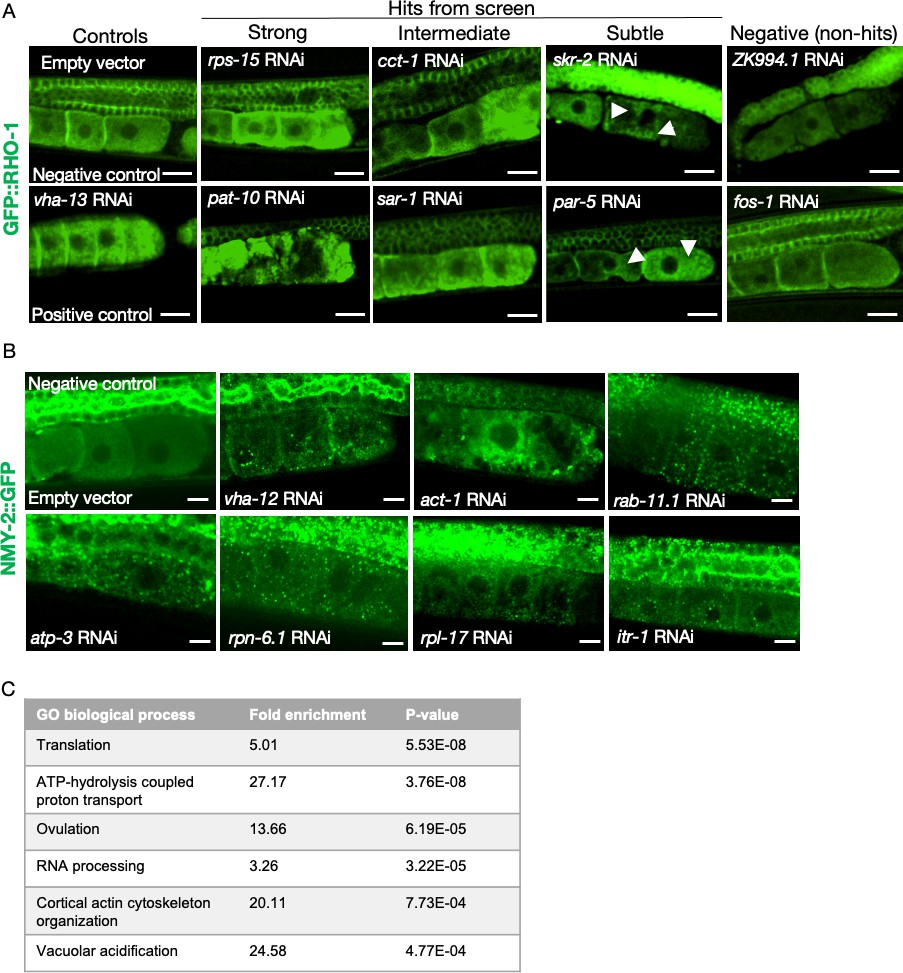
Additional examples of phenotypes from the primary and the orthogonal screens, and the most-highly enriched GO-terms.
(A) RNAi clones causing GFP::RHO-1 aggregates in hermaphrodite oocytes (SA115), visualized at low magnification (×20 objective) during the primary screening. Scale bars, 20 µm; white arrows, GFP::RHO-1 aggregates in subtle hits. (B) Examples of NMY-2::GFP aggregates in oocytes of hermaphrodites (JJ1473) undergoing orthogonal verification with a different aggregation-prone protein. Scale bars,10 µm. (C) The highest enriched gene ontology process categories represented by the validated genes identified in the screen.
Figure 1—figure supplement 2
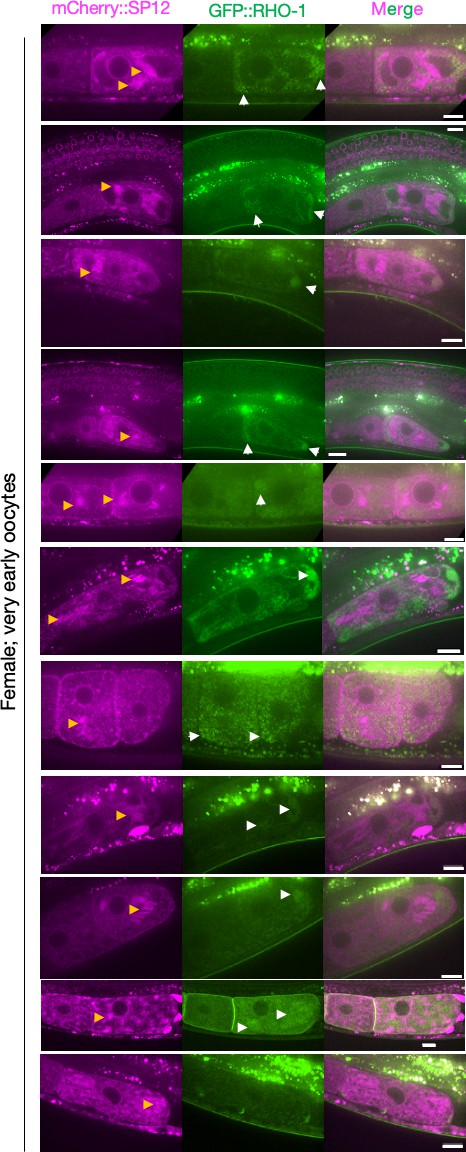
Visualizing ER morphology and GFP::RHO-1 aggregates in very early oocytes.
ER morphology and GFP::RHO-1 localization in the first, newly formed oocytes from mCherry::SP12 expressing females (CF4557). Orange arrows, ER patches; white arrows, GFP::RHO-1 aggregates. Scale bars, 10 µm. Note that the GFP::RHO-1 image from the sixth row is also displayed in Figure 1E.
Figure 2 with 6 supplements
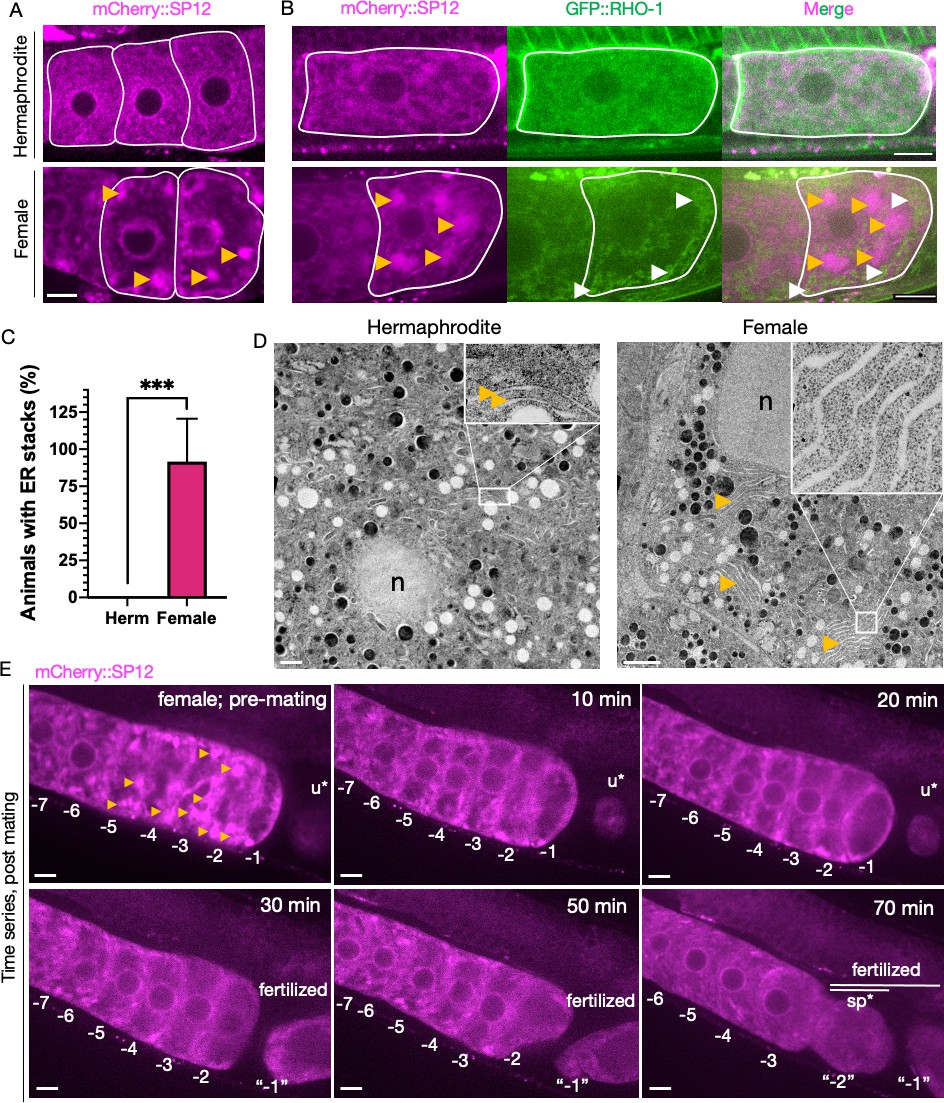
Endoplasmic reticulum (ER) morphology is regulated by sperm and correlates with protein aggregation.
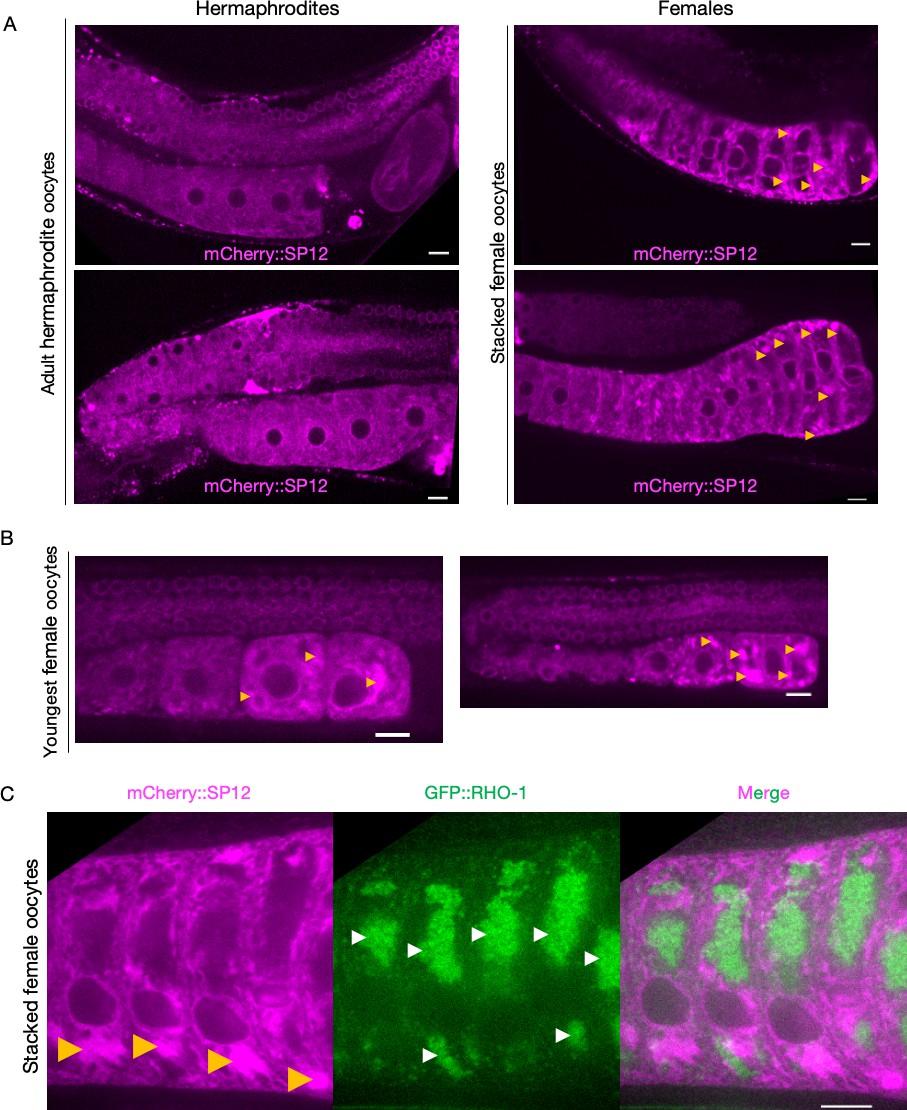
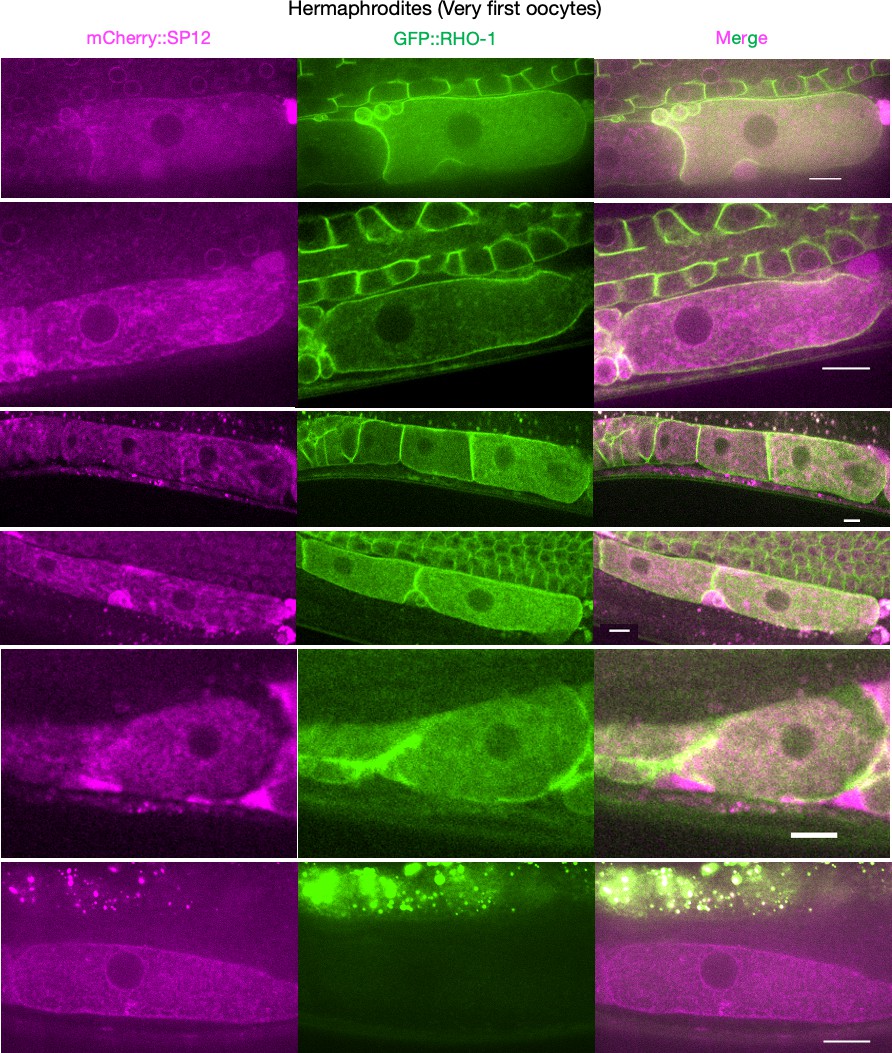
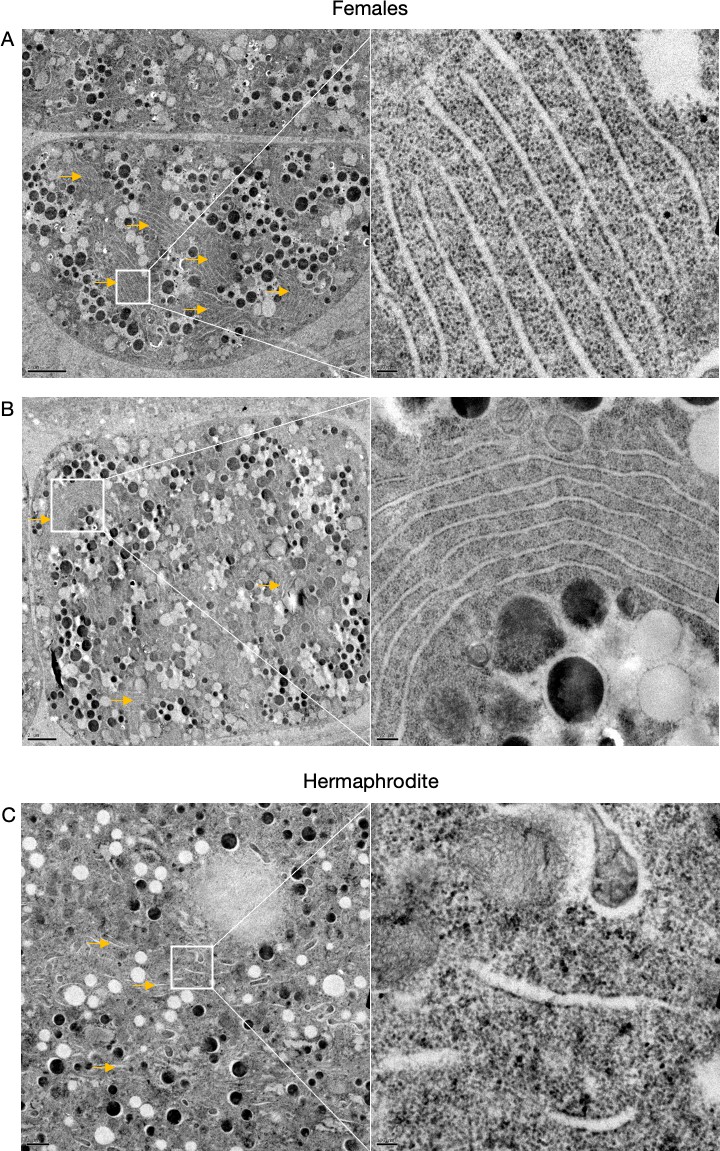
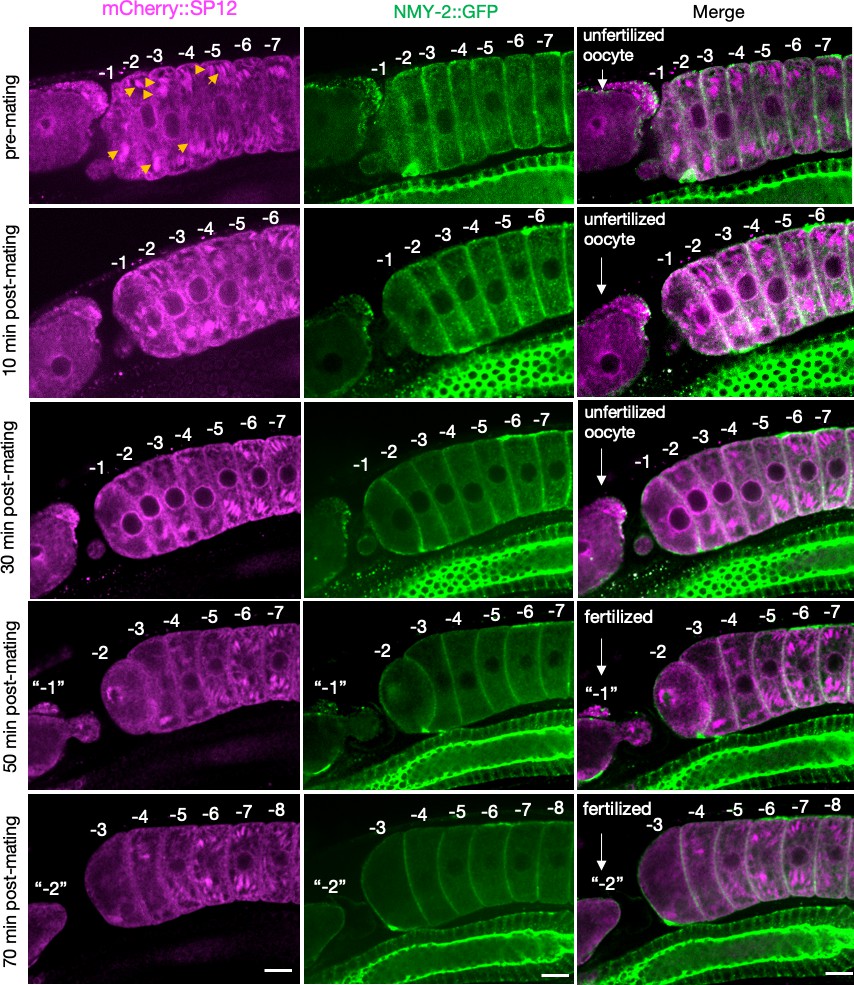
(A) ER morphology in the germline of hermaphrodite (OCF15) and female (CF4542) animals, visualized using an mCherry::SP12 reporter. Orange arrows, ER patches. Scale bar, 10 µm. (B) GFP::RHO-1 localization in newly formed oocytes from hermaphrodites (CF4552) and females (CF4557) also expressing mCherry::SP12. White arrows, GFP::RHO-1 aggregates. Scale bars, 10 µm. (C) Percentage of animals with ER patches in oocytes. n = 12; mean ± sd, ***p≤0.001 (Mann–Whitney test). (D) Transmission electron micrographs (TEM) from hermaphrodite (N2E) and female (CF4101) oocytes. At least eight females and eight hermaphrodites were subjected to TEM. Orange arrows, ER. Left panel, magnification ×1400, scale bar, 1 µm; inset: magnification ×13,000, scale bar, 100 nm. Right panel, magnification ×1200, scale bar, 2 µm; inset: magnification ×18,500, scale bar, 100 nm. (E) Dissolution of ER patches (orange arrows) in female oocytes upon mating with CB1490 males. Female oocytes were imaged before and after mating at the indicated time points. Each oocyte is numbered according to its initial position relative to the spermatheca, and original numbers are maintained after fertilization. The figure shows a single representative animal from seven independent experiments. u*, unfertilized oocyte/debris in uterus in a different focal plane; sp*, an oocyte passing through the spermatheca during fertilization. Scale bars, 10 µm.
Figure 2—figure supplement 1
Endoplasmic reticulum (ER) morphologies in hermaphrodite and female oocytes.
(A) Comparison of ER morphology in oocytes from hermaphrodites (OCF15) and females (CF4542) expressing the ER reporter mCherry::SP12 in the germline. Oocytes in the female gonad stack over time as new meiotic cells make their way down towards the spermatheca, but mature ones pass less readily into the uterus. Orange arrows, ER patches. (B) Visualization of ER patches in young oocytes of female animals, staged to capture the earliest oocytes. (C) Simultaneous visualization of GFP::RHO-1 aggregates and the ER in females (CF4557) at high magnification (×100 objective). Orange arrows, ER patches; white arrows, GFP::RHO-1 aggregates. Scale bars (A–C), 10 µm.
Figure 2—figure supplement 2
Supplementary data related to Figure 2B.
Endoplasmic reticulum morphology and GFP::RHO-1 localization in the first, newly formed oocytes from mCherry::SP12-expressing hermaphrodites (CF4552). Scale bars,10 µm. Note that the GFP::RHO-1 image from the first row is also displayed in Figure 1E.
Figure 2—figure supplement 3
Supplementary data related to Figure 2D.
Transmission electron micrographs from hermaphrodite (N2E) and female (CF4101) oocytes. (A) Female oocyte. Arrows, endoplasmic reticulum (ER) stacks. Left panel, magnification: ×1200, scale bar, 2 µm. Right panel, magnification: ×13,000, scale bar, 100 nm. (B) Female oocyte. Arrows, ER stacks. Left panel, magnification: ×890, scale bar, 2 µm. Right panel, magnification: ×6800, scale bar, 200 nm. (C) Hermaphrodite oocyte. Arrow, ER. Left panel, magnification: ×1400, scale bar, 1 µm. Right panel, magnification: ×13,000, scale bar, 100 nm.
Figure 2—figure supplement 4
Simultaneous visualization of the alteration in endoplasmic reticulum (ER) morphology and clearance of aggregates in female oocytes (CF4560) as a function of time, following mating.
The earliest changes in the mCherry::SP12 signal (ER) were observed ~10 min after mating, whereas the first signs of aggregate (NMY-2::GFP) clearance appeared later, between 20 and 30 min. The ER morphology was significantly altered by 30 min. Orange arrows, initial ER patches altered at ~10 min. The oocytes are numbered according to their initial positions relative to the spermatheca prior to mating, and the numbers are maintained as the oocytes enter the uterus following fertilization. The figure shows a single representative animal from seven independent experiments. Scale bars, 10 µm.
Figure 2—figure supplement 5
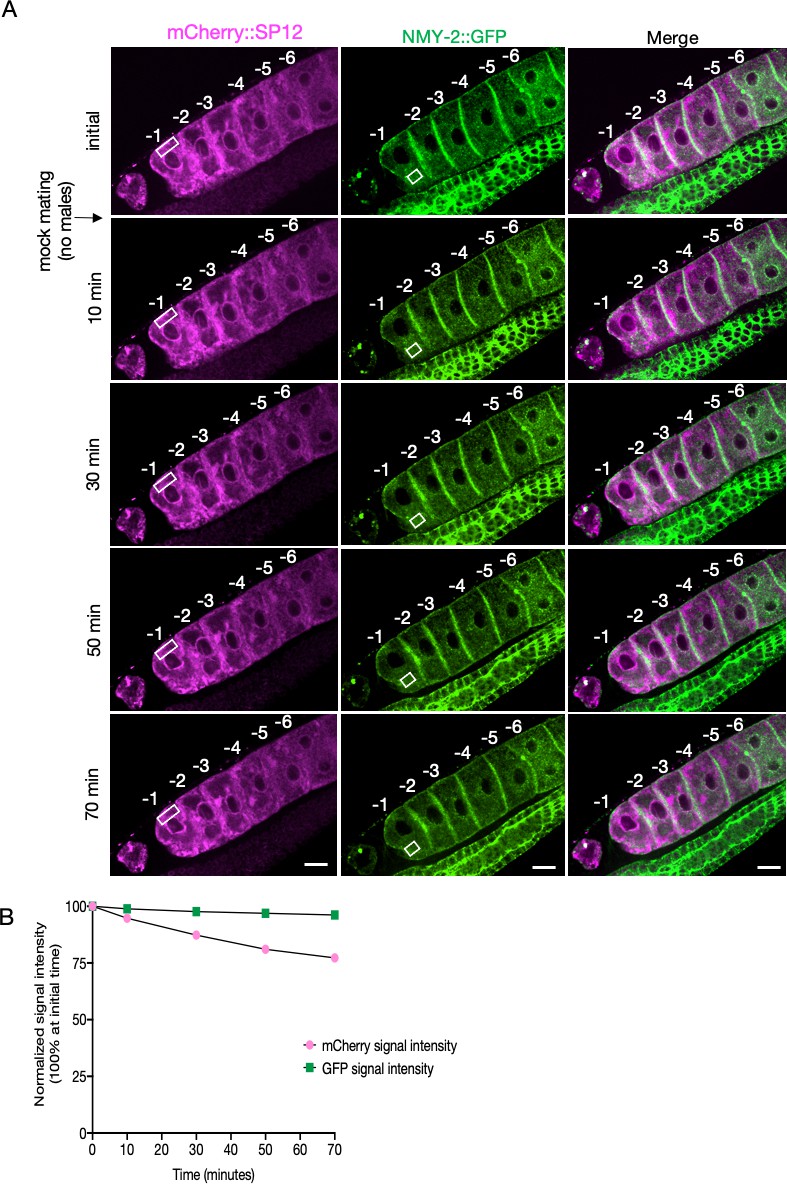
Simultaneous visualization of oocyte ER morphology and protein aggregates in an unmated female (CF4560).
(A) The mCherry::SP12 and NMY-2::GFP signals in oocytes from CF4560 females visualized as in Figure 2—figure supplement 4 but not subjected to mating, to control for photobleaching. A single individual is shown from a total of four independent experiments. Scale bars, 10 µm. (B) Reduction in signal intensity of the two fluorophores with time due to photobleaching, without exposure to males (from A). The signal intensities from specified areas (white rectangles) of the most proximal oocyte were assessed for this purpose.
Figure 2—figure supplement 6
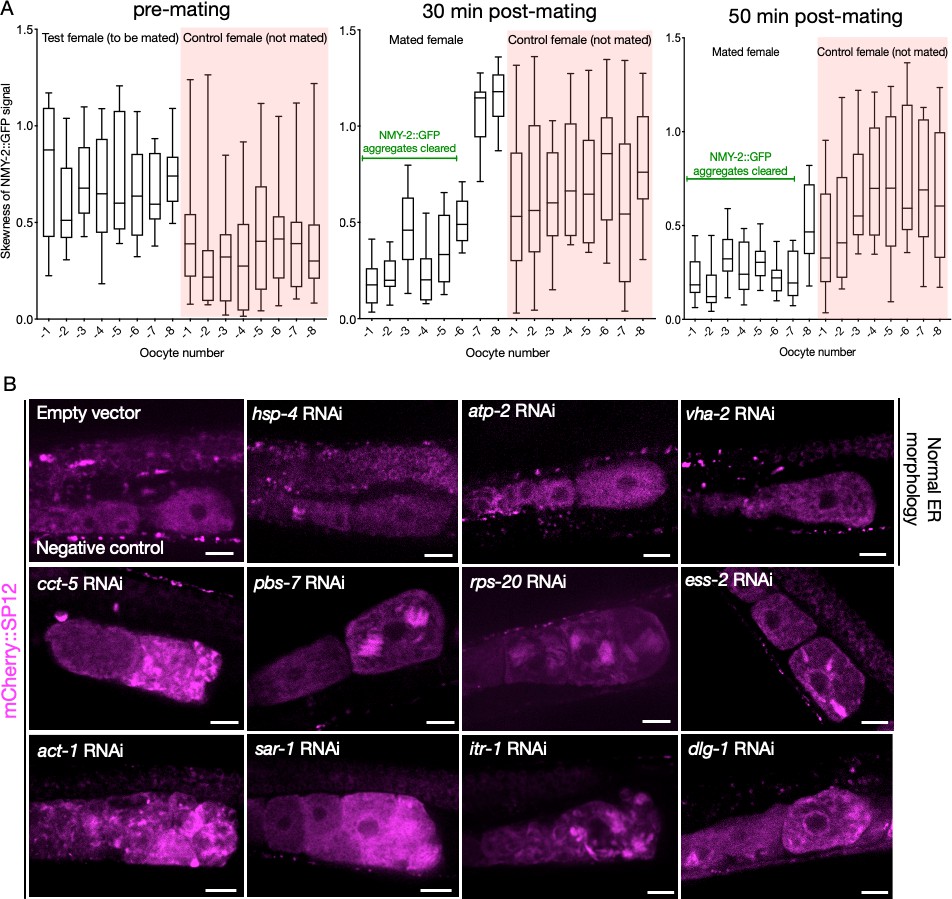
Changes in NMY-2::GFP signal following mating, as a function of time; and representative ER morphologies in assay-pool knockdowns.
(A) NMY-2::GFP signal skewness as a function of time in the proximal oocytes of CF4560 females, either subjected to mating with CB1490 males (white) or not exposed to males (pink). The mated females exhibit a reduction in signal skewness with time, and in relation to the distance from spermatheca, indicative of aggregate clearance. (B) Examples of oocyte endoplasmic reticulum morphology in CF4552 hermaphrodites subjected to assay pool RNAi treatment, demonstrating the range of morphologies we observed. GFP::RHO-1 aggregation in the same animals was used as a control to verify successful gene knockdown (not shown). Scale bars, 20 µm.
Figure 3 with 4 supplements
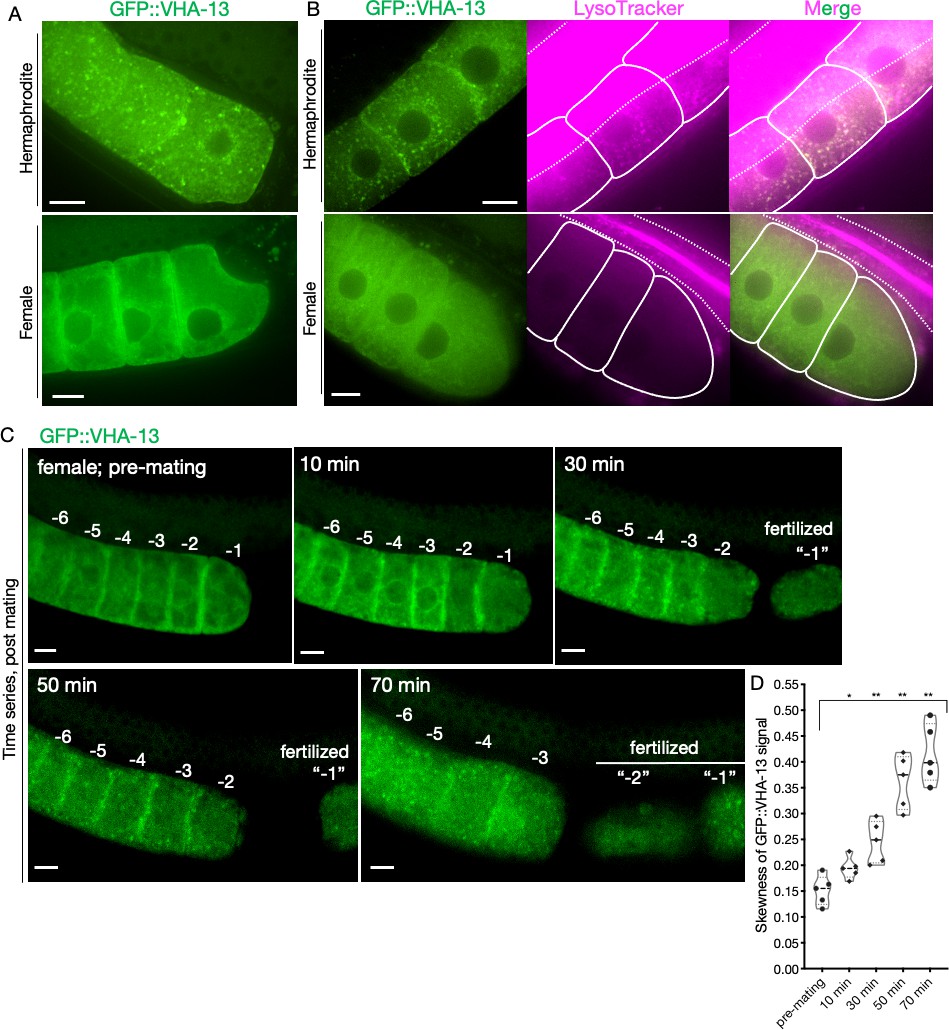
Sperm-dependent lysosomal localization of VHA-13.
(A) Distribution of GFP::VHA-13 in proximal oocytes of hermaphrodites (PHX1414) and females (CF4599). (B) LysoTracker-stained oocytes from GFP::VHA-13-expressing hermaphrodites and females for visualization of acidic lysosomes. The two signals colocalized in hermaphrodite oocytes. Dotted line, intestinal boundary; solid line, oocytes. (C) Sperm signal-induced GFP::VHA-13 redistribution in female oocytes (CF4599). Oocytes were imaged before and after mating with CB1490 males. The GFP::VHA-13 signal shifts from diffuse to punctate following mating. Each oocyte is numbered according to its initial position relative to the spermatheca, and original numbers are maintained after fertilization. A representative individual is shown from five independent mating experiments. (D) Increase in signal skewness (inhomogeneity) of GFP::VHA-13 as a function of time following mating. Mann–Whitney test was used to determine statistical significance; *p≤0.05, **p≤0.01. Scale bars, 10 µm (A–C).
-
Figure 3—source data 1
Skewness of oocyte GFP::VHA-13 signal as a function of time post mating.
- https://cdn.elifesciences.org/articles/62653/elife-62653-fig3-data1-v1.xlsx
Figure 3—figure supplement 1
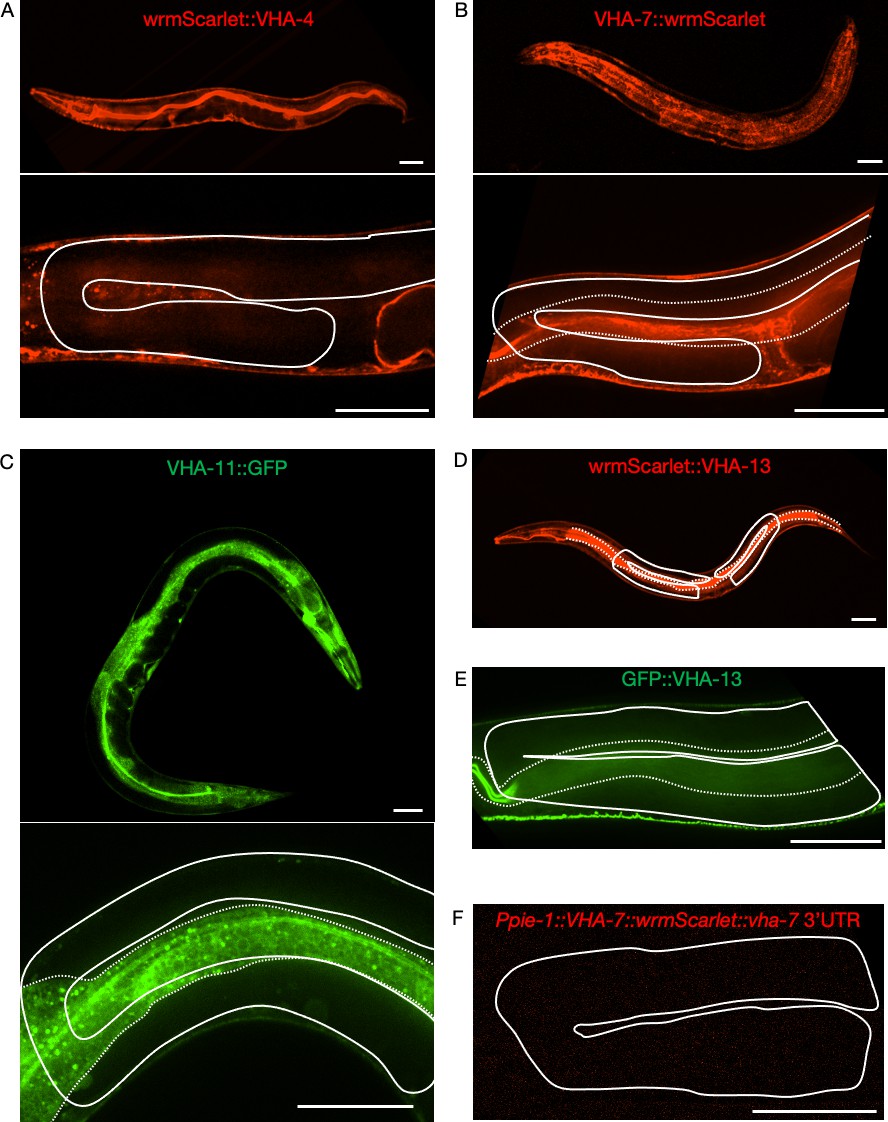
Attempts to visualize endogenously tagged V-ATPase subunits in the germline.
Expression of endogenously tagged V-ATPase subunits from the V0 domain (A, B) and the V1 domain (C–E), and of a single-copy integrated germline transgene (F). None of the strains exhibited detectable signal in the gonad. (A) WrmScarlet::VHA-4, PHX1363 vha-4(syb1363[wrmScarlet::vha-4]/+) II. (B) VHA-7::wrmScarlet, PHX1317 vha-7(syb1317[vha-7::wrmScarlet]) IV. (C) VHA-11::GFP, PHX1198 ieSi65[sun-1p::TIR1::sun-1 3′UTR Cbr-unc-119(+)] II; unc-119(ed3) III; vha-11(syb1198[vha-11::gfp::degron]/+) IV. (D) WrmScarlet::VHA-13, PHX731 vha-13(syb731[wrmScarlet::vha-13]) V. (E) GFP::VHA-13, PHX1049 vha-13(syb1049[gfp::vha-13]) V. (F) Ppie-1::vha-7::wrmScarlet::vha-7 3′UTR, PHX2690 sybIs2690[Ppie-1::vha-7::wrmScarlet::vha-7 3'UTR Cbr-unc-119(+)] I; unc-119(ed3) III. Solid line, gonad; dotted line, intestine. Scale bars, 50 µm. For each strain, a minimum of 50 animals were first analyzed under a fluorescent stereo microscope. At least three animals were then imaged for each strain by confocal microscopy. Strains were generated by SunyBiotech for the Kenyon lab.
Figure 3—figure supplement 2
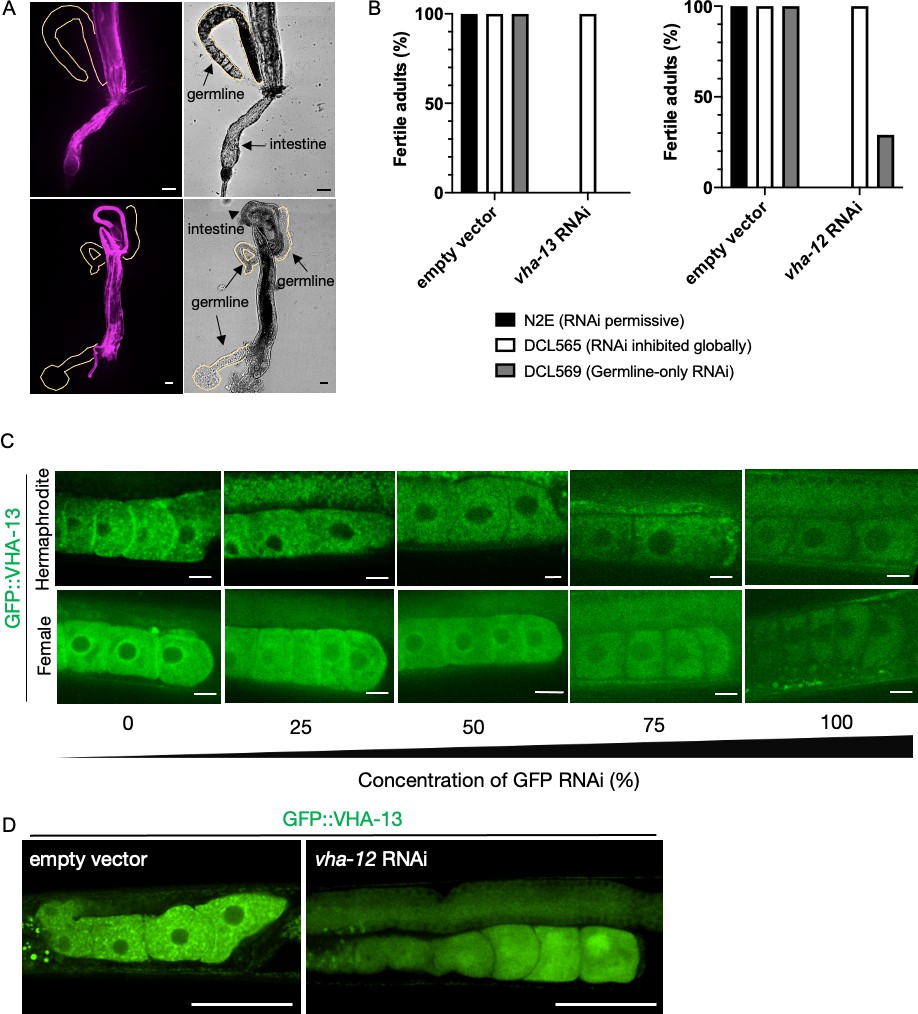
Investigating VHA-13 expression and function in the germline.
(A) Attempts to visualize endogenously tagged wrmScarlet::VHA-13 expression in the germline of PHX731 animals by dissecting gonads (n = 10 worms) to distance them from somatic tissues where it is highly expressed. Scale bars, 25 µm. (B) Percentage of fertile adults in N2E, DCL565 rde-1(mkc36), and DCL569 rde-1(mkc36); Psun-1::rde-1(+) strains upon exposure to empty-vector RNAi control, vha-13 RNAi or vha-12 RNAi, from hatching. Results are averaged from three biological replicates with each n > 10. (C) Reduction of GFP::VHA-13 expression by serial dilution of gfp RNAi bacteria. Even at the limit of fluorescence detection, hermaphrodites (PHX1414) exhibit discrete GFP::VHA-13 foci, whereas females (CF4599) exhibit a diffuse distribution. Scale bars, 10 µm. (D) Expression of GFP::VHA-13 in the germline of hermaphrodites exposed to empty-vector RNAi (left) or vha-12 RNAi (right). Scale bars, 50 µm.
Figure 3—figure supplement 3
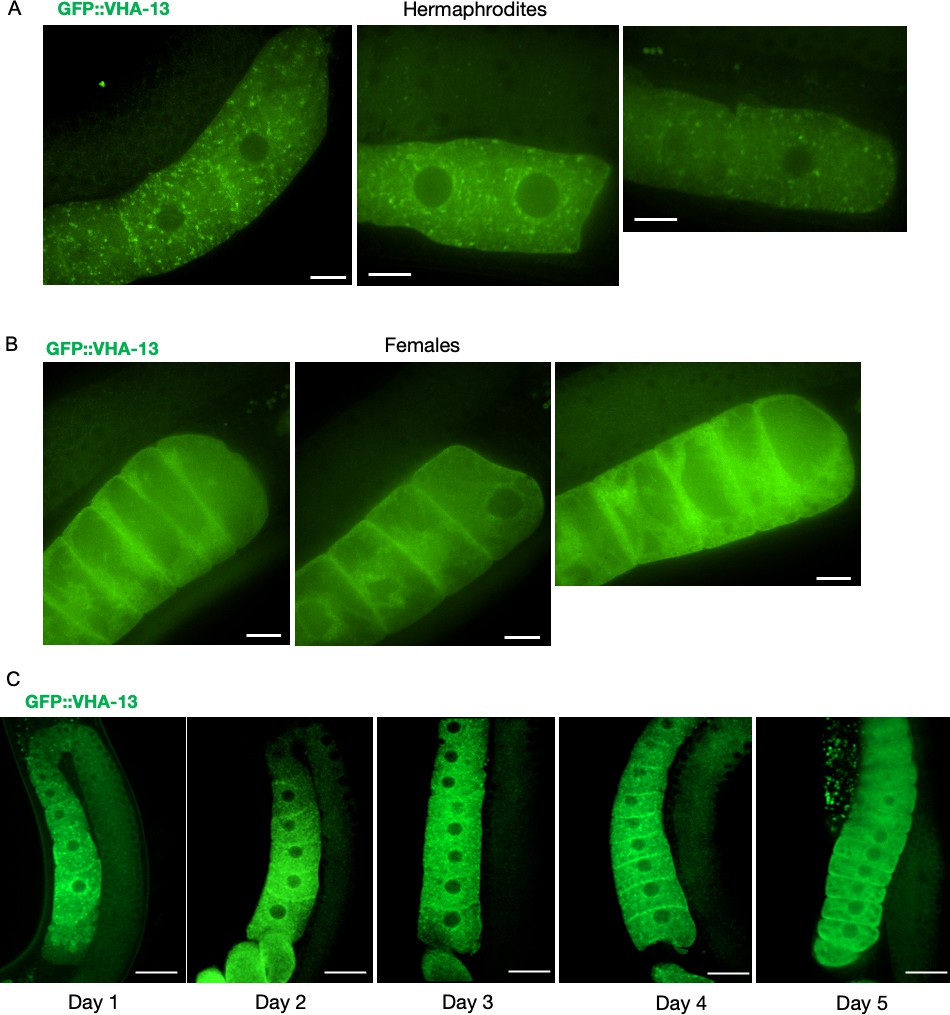
GFP::VHA-13 localization in the presence and absence of sperm (Supplementary data related to Figure 3A).
Additional images showing the distribution of GFP::VHA-13 in proximal oocytes of (A) hermaphrodites (PHX1414) and (B) females (CF4599). Scale bars, 10 µm. (C) Changes in oocyte GFP::VHA-13 localization, from punctate to diffuse, in hermaphrodites (PHX1414) imaged daily from day 1 to day 5 of adulthood, when sperm are depleted. Scale bars, 20 µm.
Figure 3—figure supplement 4
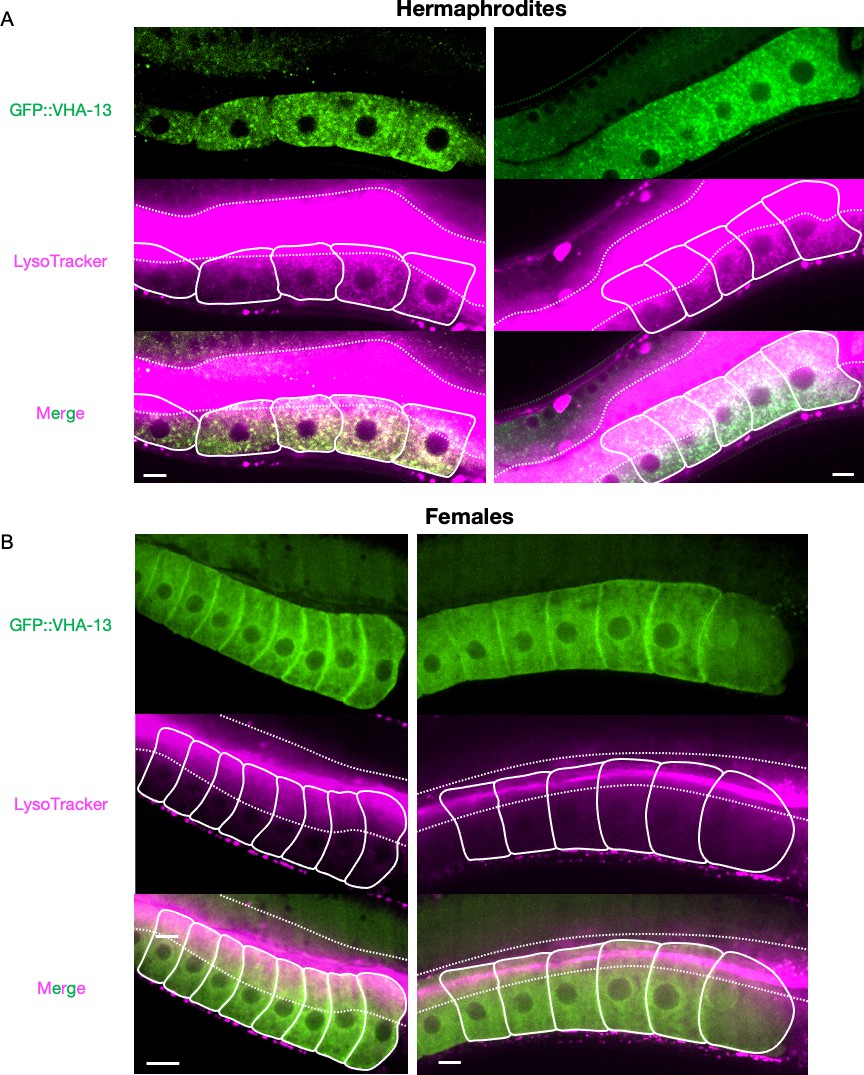
Supplementary data related to Figure 3B.
Additional images of the LysoTracker-stained oocytes from GFP::VHA-13-expressing (A) hermaphrodites (PHX1414) and (B) females (CF4599) for visualization of acidic lysosomes. The two signals colocalize in hermaphrodite oocytes. Dotted line, intestinal boundary; solid line, oocytes. Scale bars, 10 µm.
Figure 4 with 1 supplement
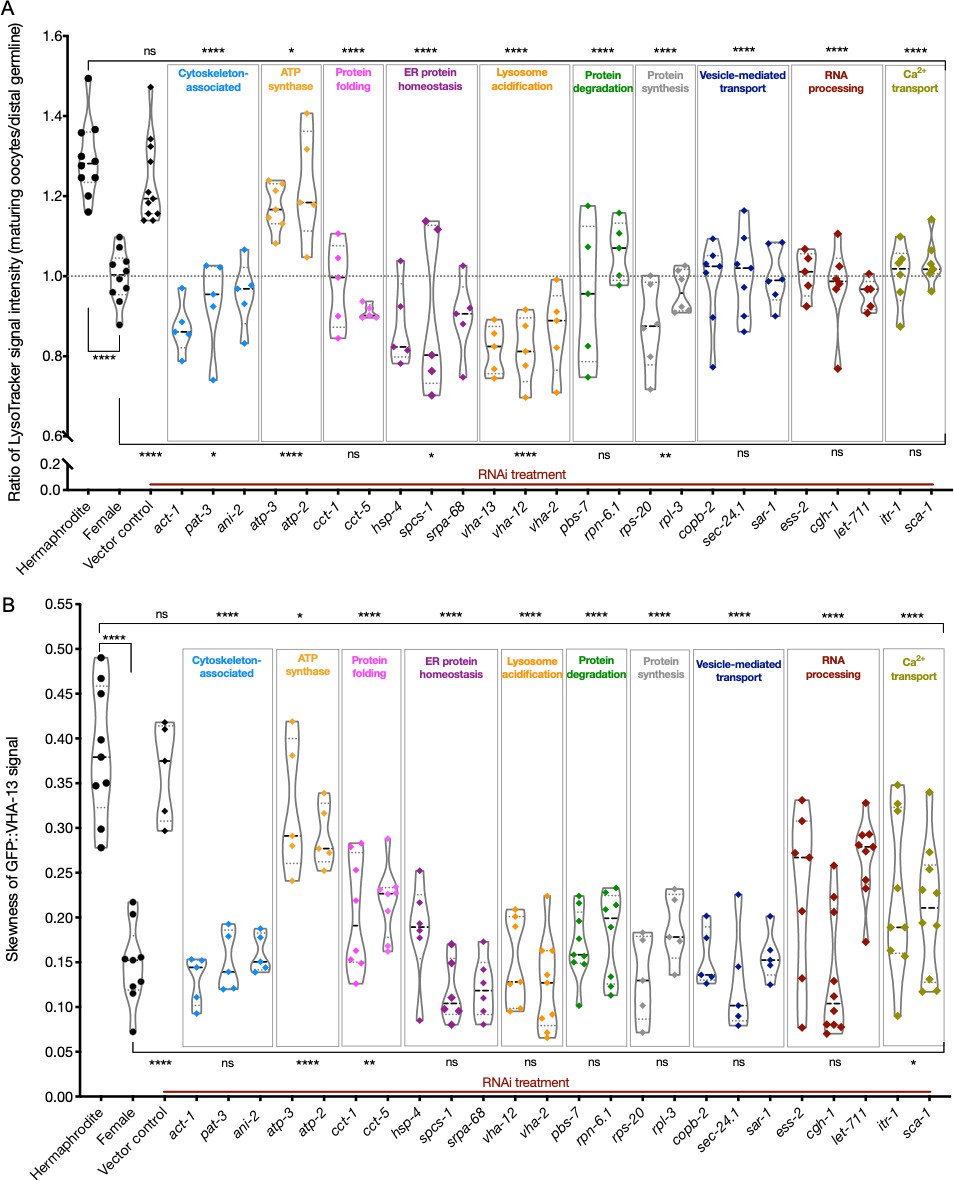
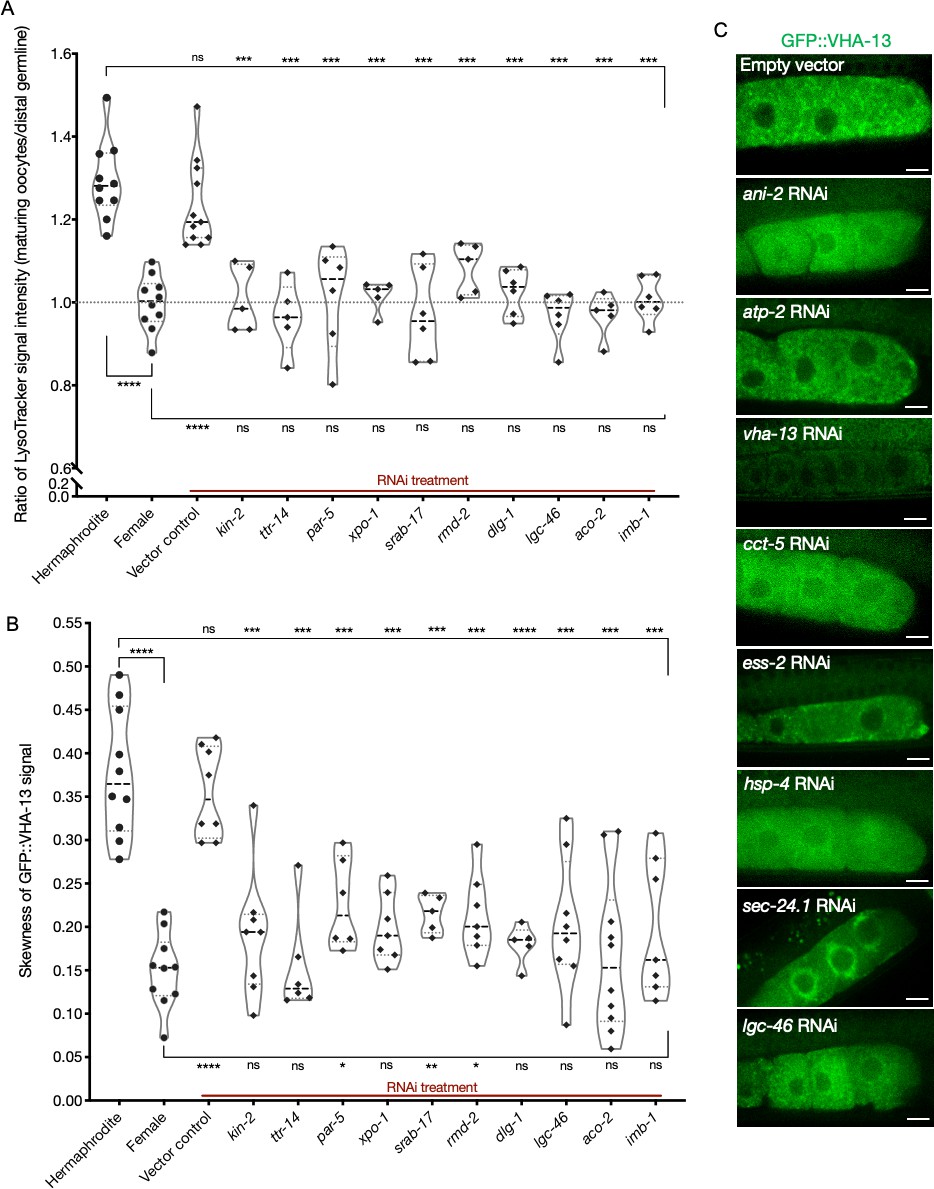
Lysosome acidification and GFP::VHA-13 localization following knockdown of genes identified by the screen.
(A) LysoTracker staining in hermaphrodites (SA115) subjected to RNAi. The LysoTracker signal is represented as the ratio of proximal oocyte to distal germline staining. Staining ratios obtained from hermaphrodite (N2E) and female (CF4101) animals were used as controls (~1.3 and ~1.0, respectively). Each data point represents the average of values from three different locations in the most proximal oocyte from a single animal. The presence of GFP::RHO-1 aggregates in the same animals confirmed successful gene knockdown (not shown). (B) Analysis of GFP::VHA-13 localization, assessed by the degree of GFP skewness (inhomogeneity) in hermaphrodites (PHX1414) subjected to RNAi, and compared to control hermaphrodites and females (PHX1414 and CF4599). Each data point represents the average of 10 skewness values from different regions within the first three proximal oocytes of a single animal. The presence of aggregates in GFP::RHO-1 animals (SA115) treated in parallel was used as a control to verify successful gene knockdown (not shown). For (A, B), Mann–Whitney test was used to determine the statistical significance. The top and bottom rows of significance indicators in each experiment compare the mean values from each process category to hermaphrodite and female animals, respectively. p-Values: p>0.05 = n.s., *p≤0.05, **p≤0.01, and ****p≤0.0001.
-
Figure 4—source data 1
LysoTracker signal intensity ratios (maturing oocytes/distal germline) in assay pool knockdowns.
- https://cdn.elifesciences.org/articles/62653/elife-62653-fig4-data1-v1.xlsx
-
Figure 4—source data 2
Skewness of oocyte GFP::VHA-13 signal in assay pool knockdowns.
- https://cdn.elifesciences.org/articles/62653/elife-62653-fig4-data2-v1.xlsx
Figure 4—figure supplement 1
Lysosomal acidification and GFP::VHA-13 localization in the germline following knockdowns of orphan genes.
(A) Analysis of germline LysoTracker staining in hermaphrodites (SA115) subjected to RNAi for the orphan genes. The LysoTracker signal is represented as the ratio of proximal oocyte to distal germline staining, and the values obtained from hermaphrodites (N2E) and females (CF4101) were used as controls (~1.3 and ~1.0, respectively). Each data point represents the average of values from three different locations in the most proximal oocyte of a single animal. The presence of GFP::RHO-1 aggregates in the same animals was used as a control to determine successful gene knockdown (not shown). (B) Analysis of GFP::VHA-13 localization (in terms of signal skewness) in hermaphrodites (PHX1414) subjected to RNAi for the orphan genes and compared to hermaphrodite and female animals (PHX1414 and CF4599). Each data point represents the average of 10 skewness values from independent regions within the first three oocytes of a single animal. The presence of GFP::RHO-1 aggregates in SA115 animals in a parallel experiment served as a control for successful gene knockdown (not shown). For (A, B), Mann–Whitney test was used to determine the statistical significance. The top and bottom rows of significance indicators in each experiment compare a specific RNAi condition to hermaphrodite and female animals, respectively. p-Values: p>0.05 = n.s., *p≤0.05, **p≤0.01, ***p≤0.001, and ****p≤0.0001. (C) Visualization of GFP::VHA-13 distribution and localization in PHX1414 hermaphrodites following RNAi. A few representative gene knockdowns from the assay pool are shown here to demonstrate the range of localization phenotypes observed. Scale bars, 10 µm.
Figure 5 with 3 supplements
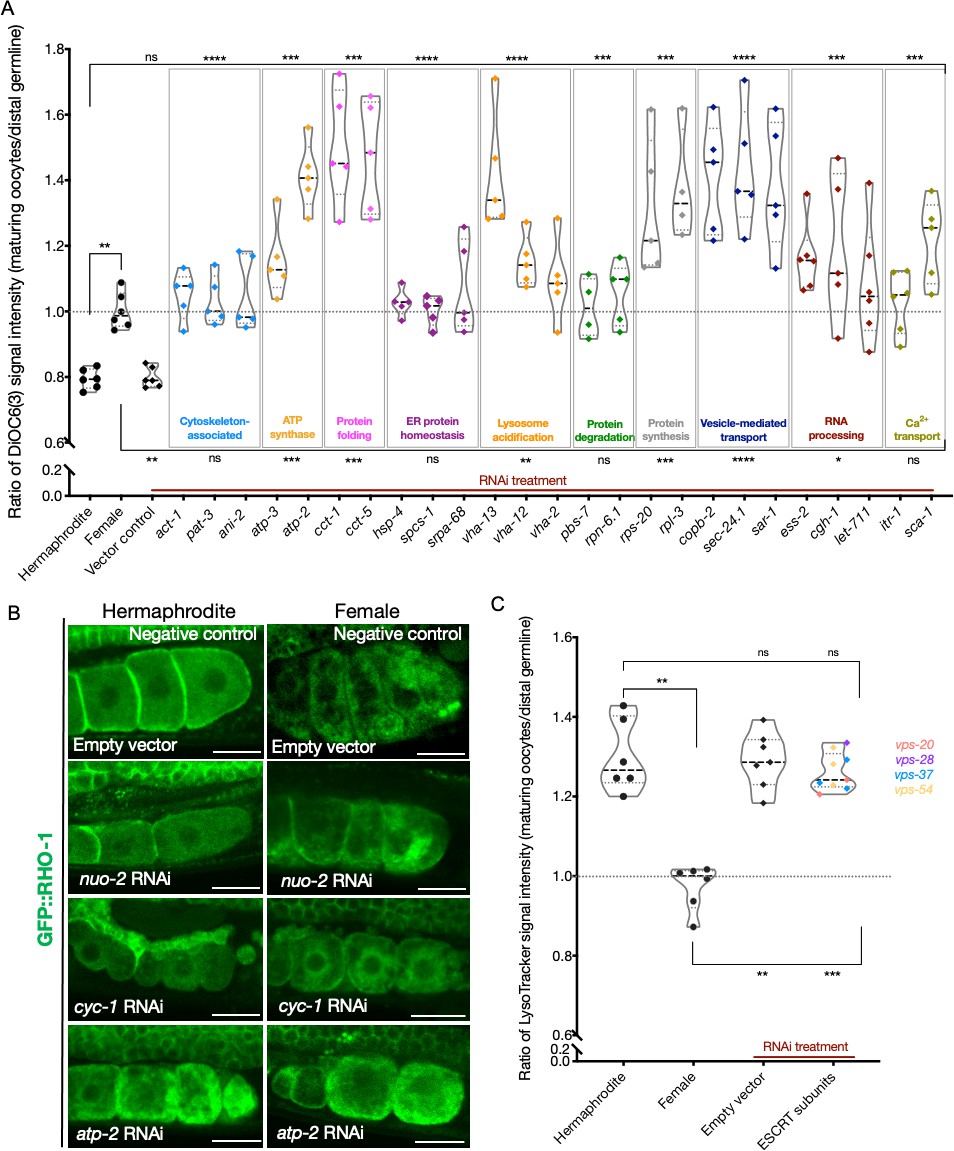
Analysis of mitochondrial membrane potential and ESCRT-complex subunits.
(A) Analysis of oocyte ΔΨ using DiOC6(3) staining in RNAi-treated hermaphrodites (OCF15), represented as the ratio of proximal oocyte to distal germline staining. Staining ratios obtained from N2E hermaphrodites (~0.8) and CF4101 females (~1) were used as controls for comparison. Each data point represents the average of values from three different locations in the most proximal oocyte of a single animal. When applicable, alteration in endoplasmic reticulum (ER) morphology was used as a control to determine successful gene knockdown in the same animals. The presence of GFP::RHO-1 aggregates in SA115 animals treated in parallel was also used as an RNAi control (not shown). (B) Visualization of GFP::RHO-1 aggregates in oocytes of hermaphrodites (SA115) and females (CF4115) subjected to disruption of mitochondrial electron transport chain (ETC) genes. Successful ETC disruption was confirmed by smaller body sizes (visible in the images) and severely reduced brood sizes, similar to ATP synthase subunit knockdowns. Scale bars, 25 µm. (C) LysoTracker staining in hermaphrodites (SA115) subjected to ESCRT-complex RNAi, represented as the ratio of proximal oocyte to distal germline staining, and compared to hermaphrodites (N2E) and females (CF4101). Only animals exhibiting GFP::RHO-1 aggregates upon RNAi treatment (confirming knockdown; shown in Figure 5—figure supplement 3A) were included in the quantification. For (A, C), Mann–Whitney test was used to determine the statistical significance. The top and bottom rows of significance indicators in each experiment compare the mean values from each process category to hermaphrodite and female animals, respectively. p-Values: p>0.05 = n.s., *p≤0.05, **p≤0.01, ***p≤0.001, and ****p≤0.0001.
-
Figure 5—source data 1
DiOC6(3) signal intensity ratios (maturing oocytes/distal germline) in assay pool knockdowns.
- https://cdn.elifesciences.org/articles/62653/elife-62653-fig5-data1-v1.xlsx
-
Figure 5—source data 2
LysoTracker signal intensity ratios (maturing oocytes/distal germline) in ESCRT subunit knockdowns.
- https://cdn.elifesciences.org/articles/62653/elife-62653-fig5-data2-v1.xlsx
-
Figure 5—source data 3
BioTracker ATP-Red staining of oocytes.
- https://cdn.elifesciences.org/articles/62653/elife-62653-fig5-data3-v1.xlsx
-
Figure 5—source data 4
Skewness of oocyte GFP::VHA-13 signal in ESCRT subunit knockdowns.
- https://cdn.elifesciences.org/articles/62653/elife-62653-fig5-data4-v1.xlsx
Figure 5—figure supplement 1
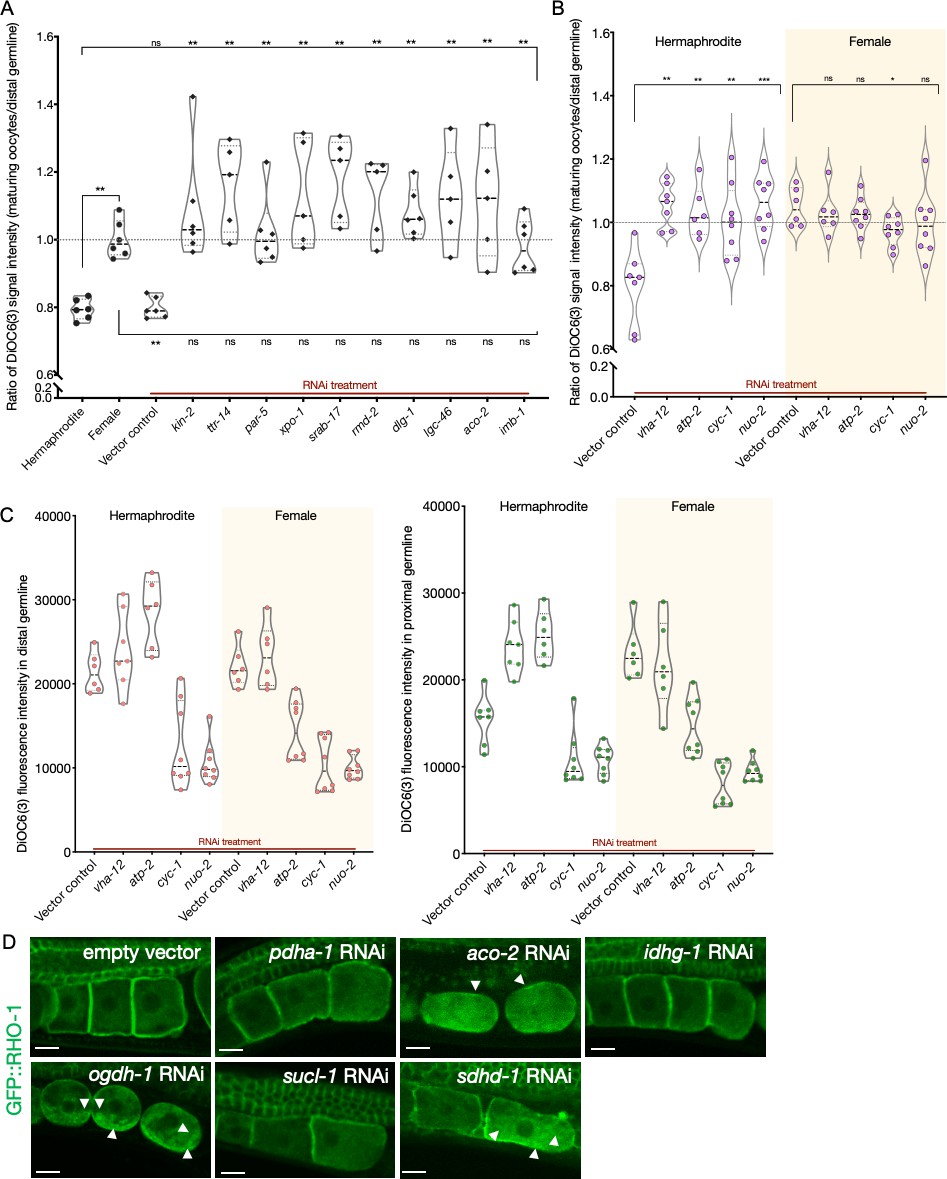
Analysis of germline mitochondrial membrane potential; and effect of Krebs cycle gene knockdowns on GFP::RHO-1 aggregates.
(A) Analysis of germline DiOC6(3) staining in hermaphrodite animals (OCF15) subjected to RNAi for the orphan genes, represented as the ratio of proximal oocyte to distal germline staining. Staining ratios obtained from N2E hermaphrodites (~0.8) and CF4101 females (~1) were used as controls for comparison. Each data point represents the average of values from three different locations within the most proximal oocyte of a single animal. When applicable, alteration in endoplasmic reticulum (ER) morphology was used as a control to determine successful gene knockdown in the same animals. The presence of aggregates in GFP::RHO-1 animals (SA115) treated in parallel was also used as a control to verify successful gene knockdown (not shown). The top and bottom rows of significance indicators compare a specific RNAi treatment to hermaphrodites and females, respectively. (B) DiOC6(3) staining expressed as the ratio between proximal oocytes and distal germline in hermaphrodites (N2E; white) and females (CF4101; yellow) subjected to RNAi treatment for control (vha-12 and atp-2) and electron transport chain (cyc-1 and nuo-2) genes. Successful gene knockdown was determined by monitoring GFP::RHO-1 aggregation in parallel (shown in Figure 5B). (A, B) Mann–Whitney test was used to determine the statistical significance. p-Values: p>0.05 = n.s., *p≤0.05, **p≤0.01, and ***p≤0.001. (C) For the animals in (B), DiOC6(3) signal intensity following RNAi treatment for electron transport chain genes in the distal (left panel) and proximal (right panel) germlines, respectively. vha-12-RNAi was used an independent positive control. (D) Identification of Krebs cycle genes that, when knocked down in hermaphrodites (SA115), cause GFP::RHO-1 aggregates to accumulate in oocytes. Scale bars, 10 µm; white arrows, GFP::RHO-1 aggregates.
Figure 5—figure supplement 2
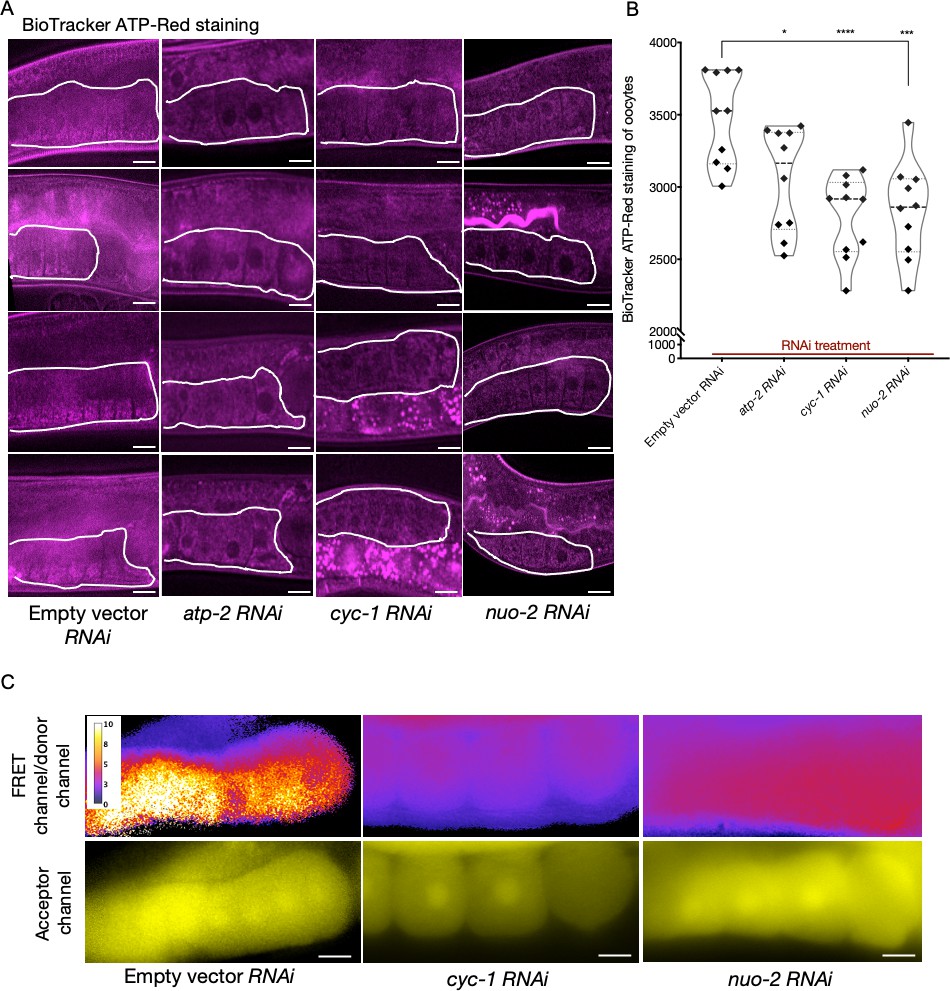
Analysis of germline ATP levels.
(A) BioTracker ATP-Red stained germlines of dye-fed animals also subjected to knockdowns of electron transport chain (ETC) subunits; proximal germlines, white outlines. Scale bars, 20 µm. (B) Quantification of BioTracker ATP-Red staining. Each data point represents the average of fluorescence intensity values normalized to area from 12 independent locations of the first three oocytes of a single animal. Mann–Whitney test was used to determine the statistical significance. p-Values: *p≤0.05, ***p≤0.001, and ****p≤0.0001. (C) Comparison of oocyte ATP levels subjected to ETC knockdowns (cyc-1 and nuo-2) using the Ateam sensor. Relative ATP levels estimated from the ratio of FRET channel to donor channel using an intensity scale (top panel); and fluorescence observed in the acceptor channel (bottom panel). Scale bars, 10 µm; note that we examined very few animals in this experiment due to transgene silencing: n = 2 animals per RNAi condition and n = 1 for control. Therefore, support for our interpretation rests primarily on the BioTracker ATP-Red dye-staining experiment.
Figure 5—figure supplement 3
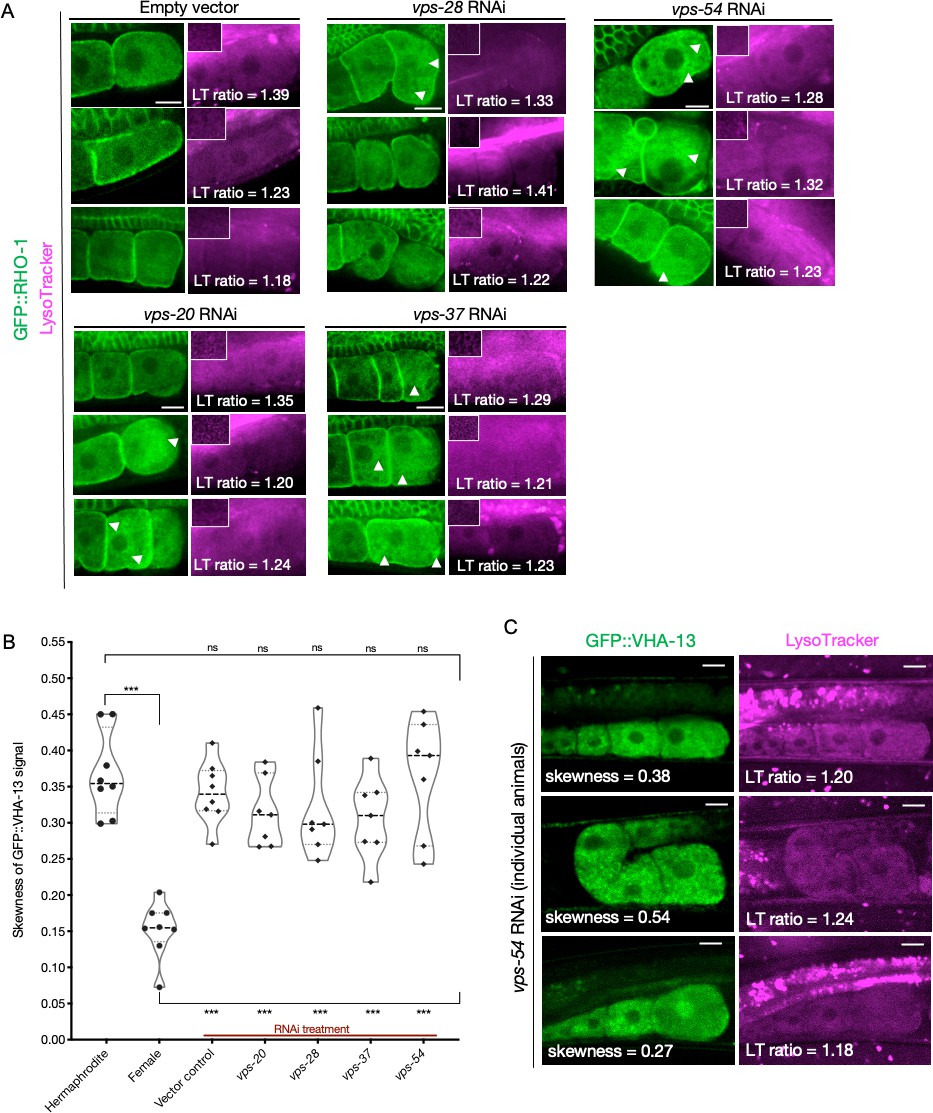
Consequences of ESCRT gene knockdown on GFP::RHO-1 aggregates and GFP::VHA-13 localization.
(A) GFP::RHO-1 aggregation and LysoTracker signal in hermaphrodites (SA115) subjected to ESCRT-complex RNAi. The proximal oocyte/distal germline ratio of LysoTracker intensity is indicated for each animal. Distal germline images from the same animal are shown as insets in the LysoTracker panels. LysoTracker staining ratios ranged from 1.18 to 1.45 and 0.85–1.15 in control hermaphrodites (N2E) and females (CF4101), respectively, across multiple experiments (not shown in this figure). Oocyte GFP::RHO-1 aggregates (confirming knockdown) are indicated with white arrows, and only oocytes containing aggregates were selected for calculating lysosome acidification in Figure 5C. Scale bars, 10 µm. (B) GFP::VHA-13 localization (signal skewness) in hermaphrodites (PHX1414) subjected to RNAi for ESCRT subunits, and compared to hermaphrodites and females (PHX1414 and CF4599, respectively). Each data point represents the average of 10 skewness values from different regions within the three most proximal oocytes of a single animal. Statistical significance was determined by Mann–Whitney test, and the top and bottom rows of significance indicators compare a specific RNAi treatment to hermaphrodite and female animals, respectively. p-Values: p>0.05 = n.s. and ***p≤0.001. (C) Variability in GFP::VHA-13 localization and lysosome acidification phenotypes for individual PHX1414 animals treated with vps-54 RNAi. The skewness value for the GFP::VHA-13 signal and LysoTracker staining ratio (proximal oocyte to distal germline) are indicated for each animal. Successful knockdown could not be verified in each animal (since VHA-13 and RHO-1 were both tagged with GFP). Instead, it was done in a parallel experiment with GFP::RHO-1-expressing animals (SA115) in which more than 75% of animals subjected to a specific RNAi treatment exhibited detectable aggregation (not shown). Scale bars, 10 µm.
Figure 6 with 4 supplements
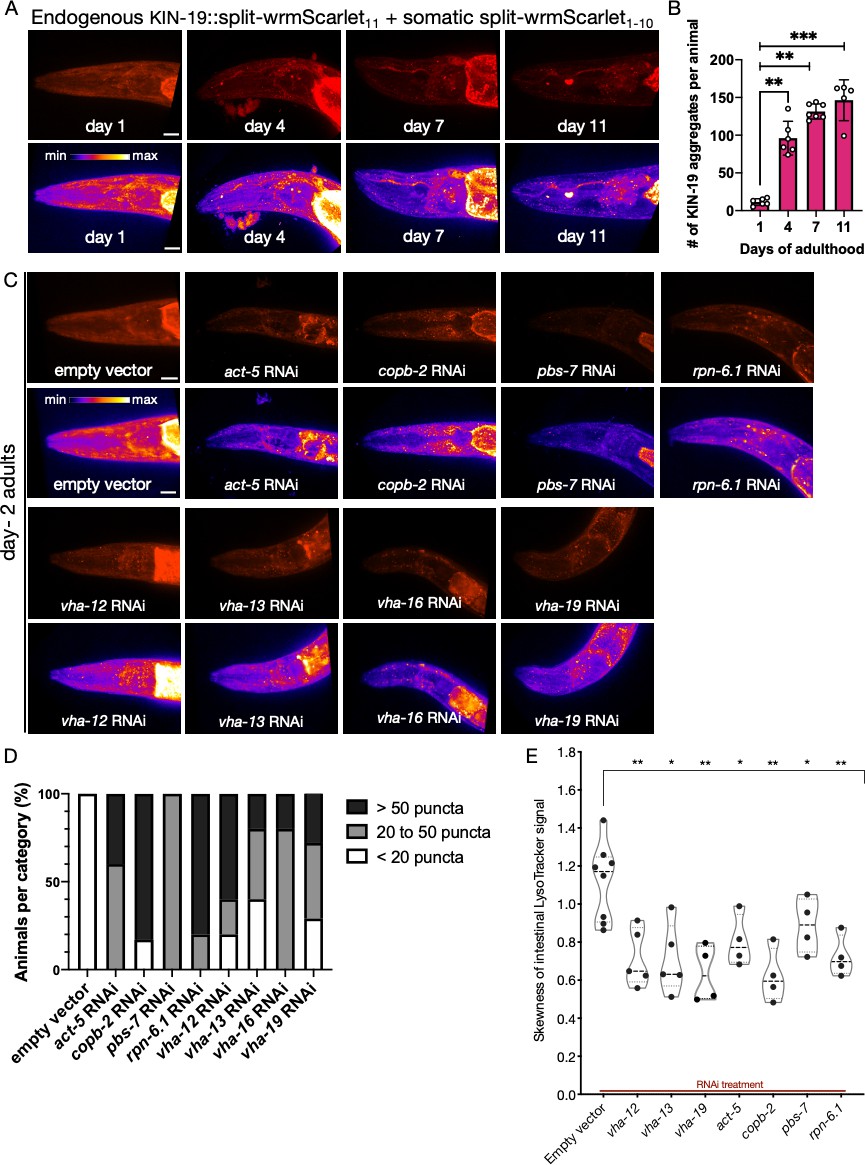
Analysis of protein aggregation and lysosome acidification in somatic tissues.
(A) Representative images of CF4609 animals expressing KIN-19::split-wrmScarlet11 and somatic split-wrmScarlet1-10 at days 1, 4, 7, and 11 of adulthood. Maximum intensity projections of 3D stacks are shown in red (upper panels) and also using an intensity scale (lower panels). Scale bars, 10 µm. (B) Quantification of KIN-19::split-wrmScarlet aggregates per animal in the head region. The bright fluorescent signal in the pharyngeal region was not included in the quantification. Mann–Whitney test was used to determine the statistical significance. p-Values: **p≤0.01 and ***p≤0.001. (C) Representative images of CF4609 animals expressing KIN-19::split-wrmScarlet11 and somatic split-wrmScarlet1-10 subjected to RNAi or empty-vector negative control, imaged for presence of KIN-19 aggregates at day 2 of adulthood. Scale bars, 10 µm. (D) Quantification of fluorescent KIN-19::split-wrmScarlet puncta (only from the head region) in CF4609 animals subjected to RNAi or empty-vector control. (E) Skewness of the intestinal LysoTracker signal in SA115 animals subjected to RNAi (shown in Figure 6—figure supplement 2). Each data point represents the average of six independent skewness values from the anterior intestinal region, near the pharyngeal bulb, in a single animal. The simultaneous presence of GFP::RHO-1 aggregates in oocytes was used as a control for successful gene knockdown in each animal (not shown). Mann–Whitney test was used to determine the statistical significance. p-Values: *p≤0.05 and **p≤0.01.
-
Figure 6—source data 1
Number of KIN-19 aggregates per animal.
- https://cdn.elifesciences.org/articles/62653/elife-62653-fig6-data1-v1.xlsx
-
Figure 6—source data 2
Skewness of intestinal LysoTracker signal.
- https://cdn.elifesciences.org/articles/62653/elife-62653-fig6-data2-v1.xlsx
-
Figure 6—source data 3
Quantitative RT‐PCR analysis of mRNA levels in ESCRT subunit knockdowns.
- https://cdn.elifesciences.org/articles/62653/elife-62653-fig6-data3-v1.xlsx
Figure 6—figure supplement 1
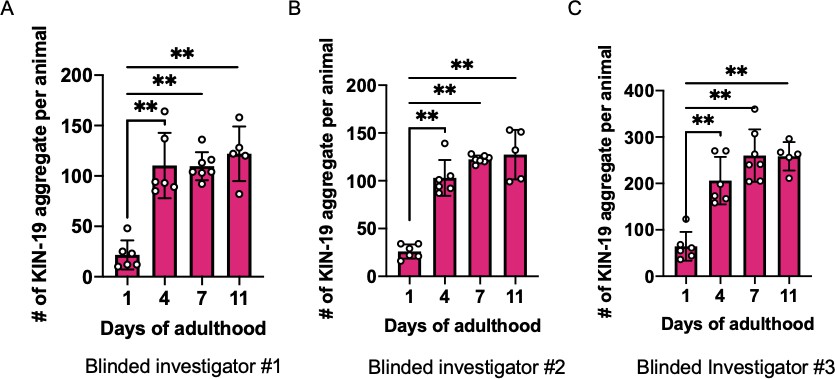
Supplementary data related to Figure 6B.
The same image sets of KIN-19 aggregates used in Figure 6B were scored again, blindly, by three additional investigators (A–C). Mann–Whitney test was used to calculate the statistical significance, **p≤0.01.
Figure 6—figure supplement 2
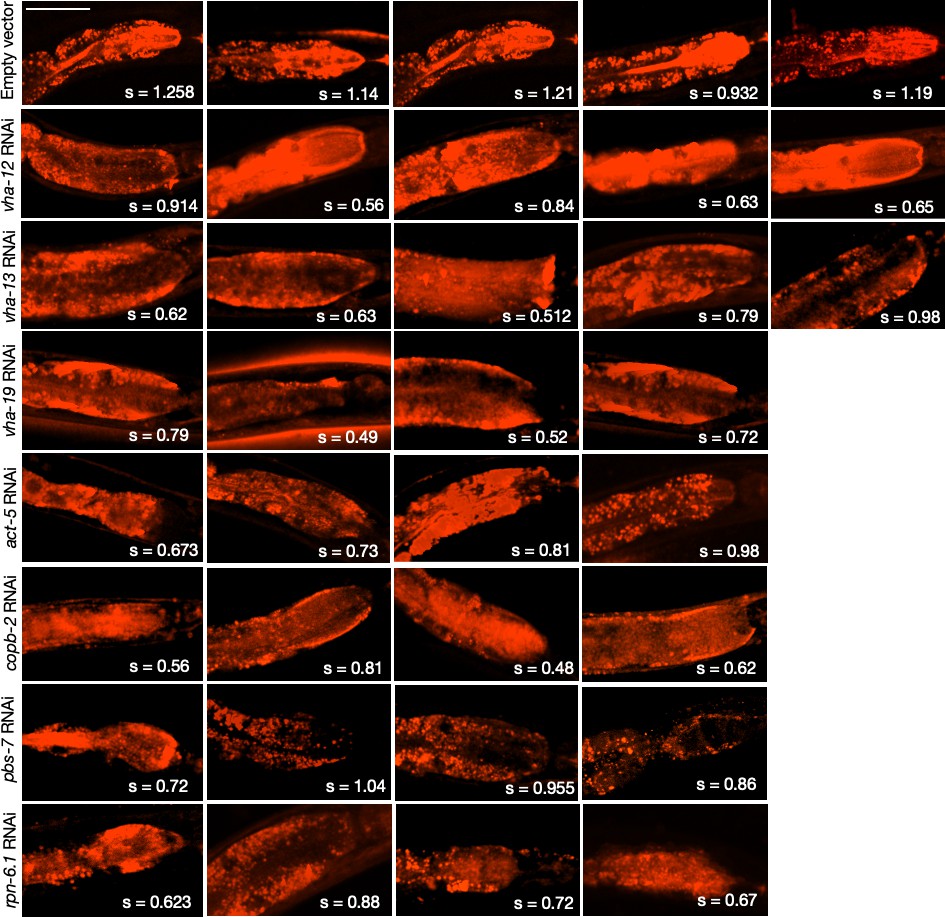
LysoTracker staining in the intestines of animals subjected to gene knockdowns that caused KIN-19::split-wrmScarlet aggregation in the head.
Due to variability in dye uptake and staining, the actual LysoTracker signal intensities within the intestines were not evaluated. Instead, the mean skewness values, s, indicative of inhomogeneity expected for acidic intestinal lysosomes (so-called ‘lysosome-related organelles’), are reported for each animal (compared in Figure 6E). Skewness values were derived from six different locations within the anterior intestinal region near the pharyngeal bulb. Scale bar, 50 µm.
Figure 6—figure supplement 3
Q35::YFP aggregation in body-wall muscle with age; and following assay-pool knockdowns.
(A) Representative images of AM140 animals expressing the polyQ reporter Q35::YFP in body wall muscle cells imaged at days 1, 2, and 3 of adulthood, with appearance of age-associated aggregates on day 3 of adulthood. 0/8 animals with aggregates were observed on day 2. Scale bars, 50 µm. (B) Q35::YFP aggregates in animals subjected to assay pool RNAi or empty-vector negative control imaged for the presence of reporter aggregates on day 2 of adulthood. Successful gene knockdown was determined in a parallel experiment with GFP::RHO-1-expressing animals (SA115) subjected to RNAi treatment and exhibiting aggregation in the germline (not shown). White arrows, representative locations of Q35::YFP aggregates. Scale bars, 50 µm.
Figure 6—figure supplement 4
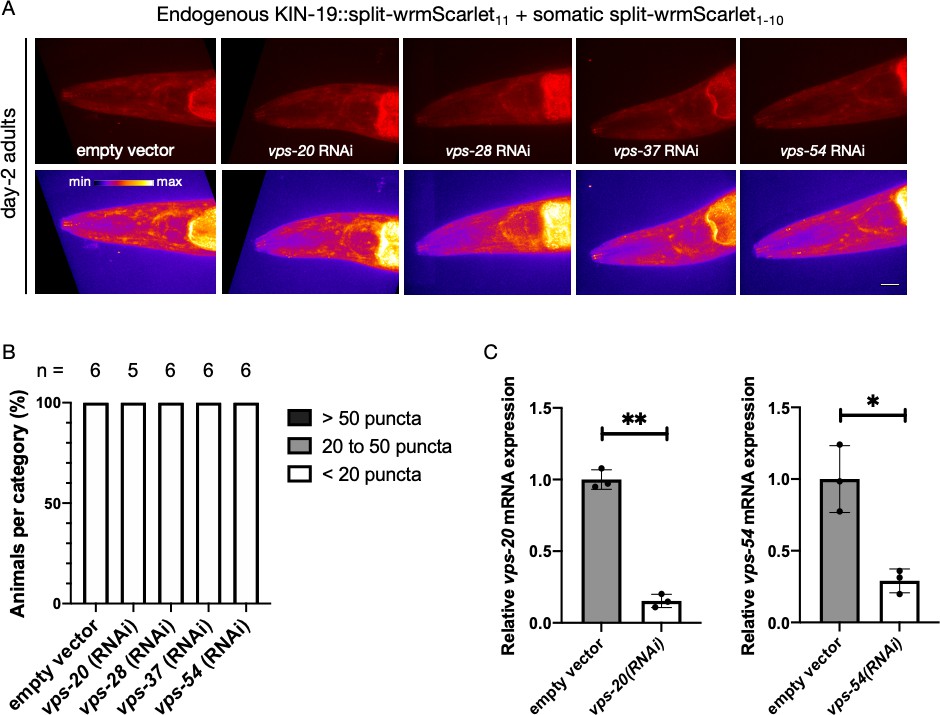
Investigating the contribution of ESCRT genes in preventing KIN-19 aggregation.
(A) Representative images of CF4609 animals expressing KIN-19::split-wrmScarlet11 and somatic split-wrmScarlet1-10 subjected to ESCRT-complex RNAi or empty-vector negative control from the L1 stage, imaged for the presence of KIN-19::split-wrmScarlet aggregates at day 2 of adulthood. Maximum intensity projections of 3D stacks are shown in red (upper panels) and also using an intensity scale (lower panels). Scale bar, 10 µm. (B) Quantification of fluorescent KIN-19::split-wrmScarlet puncta (only from the head region) in CF4609 animals subjected to RNAi or empty-vector control, using the same scoring method as in Figure 6D. (C) Quantitative RT‐PCR analysis of mRNA levels of vps-20 and vps-54, in the set of animals imaged, compared to control empty-vector or treated with vps-20 or vps-54 RNAi, respectively. Two-way ANOVA test was used to determine statistical significance; p-values; *p<0.05, **p<0.01.
Figure 7
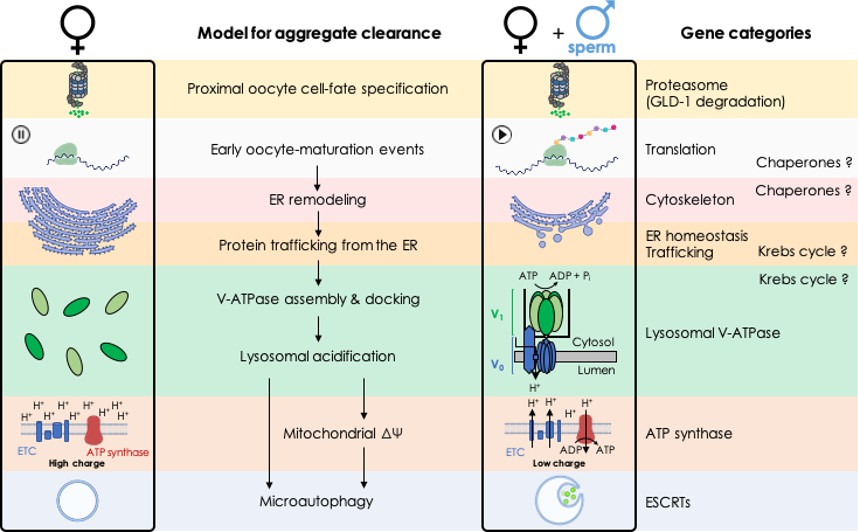
Model: biological processes implicated in the clearance of protein aggregates during oocyte maturation.
Tables
Table 1
Functional gene categories from the proteostasis screen.
| Biological process | RNAi target | Gene code | Normal ER architecture | GFP::VHA-13 puncta | Lysosome acidification | Reduction in ΔΨ |
|---|---|---|---|---|---|---|
| Protein degradation | pbs-7 | F39H11.5 | No | No | No | No |
| rpn-6.1 | F57B9.10 | Mixed | No | No | No | |
| Protein synthesis (translation) | rps-20 | Y105E8A.16 | No | No | No | No |
| rpl-3 | F13B10.2 | No | No | No | No | |
| Protein folding (chaperones) | cct-1 | T05C12.7 | No | Reduced | No | No |
| cct-5 | C07G2.3 | No | Reduced | No | No | |
| Cytoskeleton-associated process | act-1 | T04C12.6 | No | No | No | No |
| pat-3 | ZK1058.2 | No | No | No | No | |
| ani-2 | K10B2.5 | No | No | No | No | |
| ER protein homeostasis | hsp-4 | F43E2.8 | Yes | No | No | No |
| spcs-1 | C34B2.10 | Yes | No | No | No | |
| srpa-68 | F55C5.8 | Yes | No | No | No | |
| Vesicle-mediated transport (trafficking) | copb-2 | F38E11.5 | No | No | No | No |
| sec-24.1 | F12F6.6 | Inconclusive | No | No | No | |
| sar-1 | ZK180.4 | Mixed | No | No | No | |
| Lysosome acidification (V-ATPase) | vha-13 | Y49A3A.2 | Yes | No signal | No | No |
| vha-12 | F20B6.2 | Yes | No | No | No | |
| vha-2 | R10E11.2 | Yes | No | No | No | |
| ATP synthase | atp-3 | F27C1.7 | Yes | Yes | Yes | No |
| atp-2 | C34E10.6 | Yes | Yes | Yes | No | |
| RNA processing | ess-2 | F42H10.7 | No | Reduced | No | No |
| cgh-1 | C07H6.5 | Mixed | No | No | No | |
| let-711 | F57B9.2 | Mixed | Reduced | No | No | |
| Calcium ion transport | itr-1 | F33D4.2 | No | Reduced | No | No |
| sca-1 | K11D9.2 | Yes | Reduced | No | No | |
| Orphans | kin-2 | R07E4.6 | Mixed | No | No | No |
| ttr-14 | T05A10.3 | Mixed | No | No | No | |
| par-5 | M117.2 | Yes | No | No | No | |
| xpo-1 | ZK742.1 | Yes | No | No | No | |
| srab-17 | T11A5.2 | Yes | Reduced | No | No | |
| rmd-2 | C27H6.4 | Yes | No | No | No | |
| dlg-1 | C25F6.2a.1 | No | No | No | No | |
| lgc-46 | Y71D11A.5 | Yes | Reduced | No | No | |
| aco-2 | F54H12.1 | Yes | No | No | No | |
| imb-1 | F28B3.8 | Inconclusive | No | No | No | |
| ESCRT subunits* | vps-20 | Y65B4A.3 | Not tested | Yes | Yes | Not tested |
| vps-28 | Y87G2A.10 | Not tested | Yes | Yes | Not tested | |
| vps-37 | CD4.4 | Not tested | Yes | Yes | Not tested | |
| vps-54 | T21C9.2 | Not tested | Yes | Yes | Not tested | |
| List of representative genes from each functional category that were selected for the assay pool and their effects on ER morphology, lysosome acidification, GFP::VHA-13 localization, and mitochondrial membrane potential. *The ESCRT complex subunits were not derived from the original screen but from subsequent candidate testing. ER: endoplasmic reticulum. | ||||||
Key resources table
| Reagent type (species) or resource | Designation | Source or reference | Identifiers | Additional information |
|---|---|---|---|---|
| RNAi reagents (Caenorhabditis elegans) | Multiple | C. elegans RNAi Collection (Source BioScience) | RRID:SCR_017064 | Supplementary file 1 |
| Strains, (Caenorhabditis elegans) | Multiple | Caenorhabditis Genetics Center (CGC) | RRID:SCR_007341 | Supplementary file 2 |
| Software, algorithm | GraphPad Prism 9.0.1 | GraphPad | RRID:SCR_002798 | |
| Software, algorithm | ImageJ/Fiji | Fiji | RRID:SCR_002285 |
Additional files
-
Supplementary file 1
Germline proteostasis candidates captured in the screen.
List of candidates obtained from primary screening and validation rounds with GFP::RHO-1. The phenotypic strengths and fertility status are indicated for each. Candidates that were discarded on the basis of their known functions, possible off-target effects, or the failure to pass orthogonal verification with NMY-2::GFP are indicated accordingly.
- https://cdn.elifesciences.org/articles/62653/elife-62653-supp1-v1.xlsx
-
Supplementary file 2
List of C. elegans strains.
Description of all strains used in the study, including the corresponding genotypes and sources.
- https://cdn.elifesciences.org/articles/62653/elife-62653-supp2-v1.xlsx
-
Supplementary file 3
Candidates from primary screen that did not pass validation.
This list is included because some of these candidates could be false negatives, as was the case for the ESCRT-complex genes. Also included are the gene ontology terms (biological process) they represent.
- https://cdn.elifesciences.org/articles/62653/elife-62653-supp3-v1.xlsx
-
Transparent reporting form
- https://cdn.elifesciences.org/articles/62653/elife-62653-transrepform-v1.docx
Download links
A two-part list of links to download the article, or parts of the article, in various formats.
Downloads (link to download the article as PDF)
Open citations (links to open the citations from this article in various online reference manager services)
Cite this article (links to download the citations from this article in formats compatible with various reference manager tools)
A genetic screen identifies new steps in oocyte maturation that enhance proteostasis in the immortal germ lineage
eLife 10:e62653.
https://doi.org/10.7554/eLife.62653


