A multifaceted analysis reveals two distinct phases of chloroplast biogenesis during de-etiolation in Arabidopsis
- Plant Physiology Laboratory, University of Neuchâtel, Switzerland
- Institute of Molecular Plant Biology, Department of Biology, ETH Zurich, Switzerland
- Neuchâtel Platform of Analytical Chemistry, University of Neuchâtel, Switzerland
- Université Grenoble Alpes, CNRS, CEA, INRAE, IRIG-DBSCI-LPCV, France
- Department of Botany and Plant Biology, University of Geneva, Switzerland
Figures
Figure 1 with 1 supplement
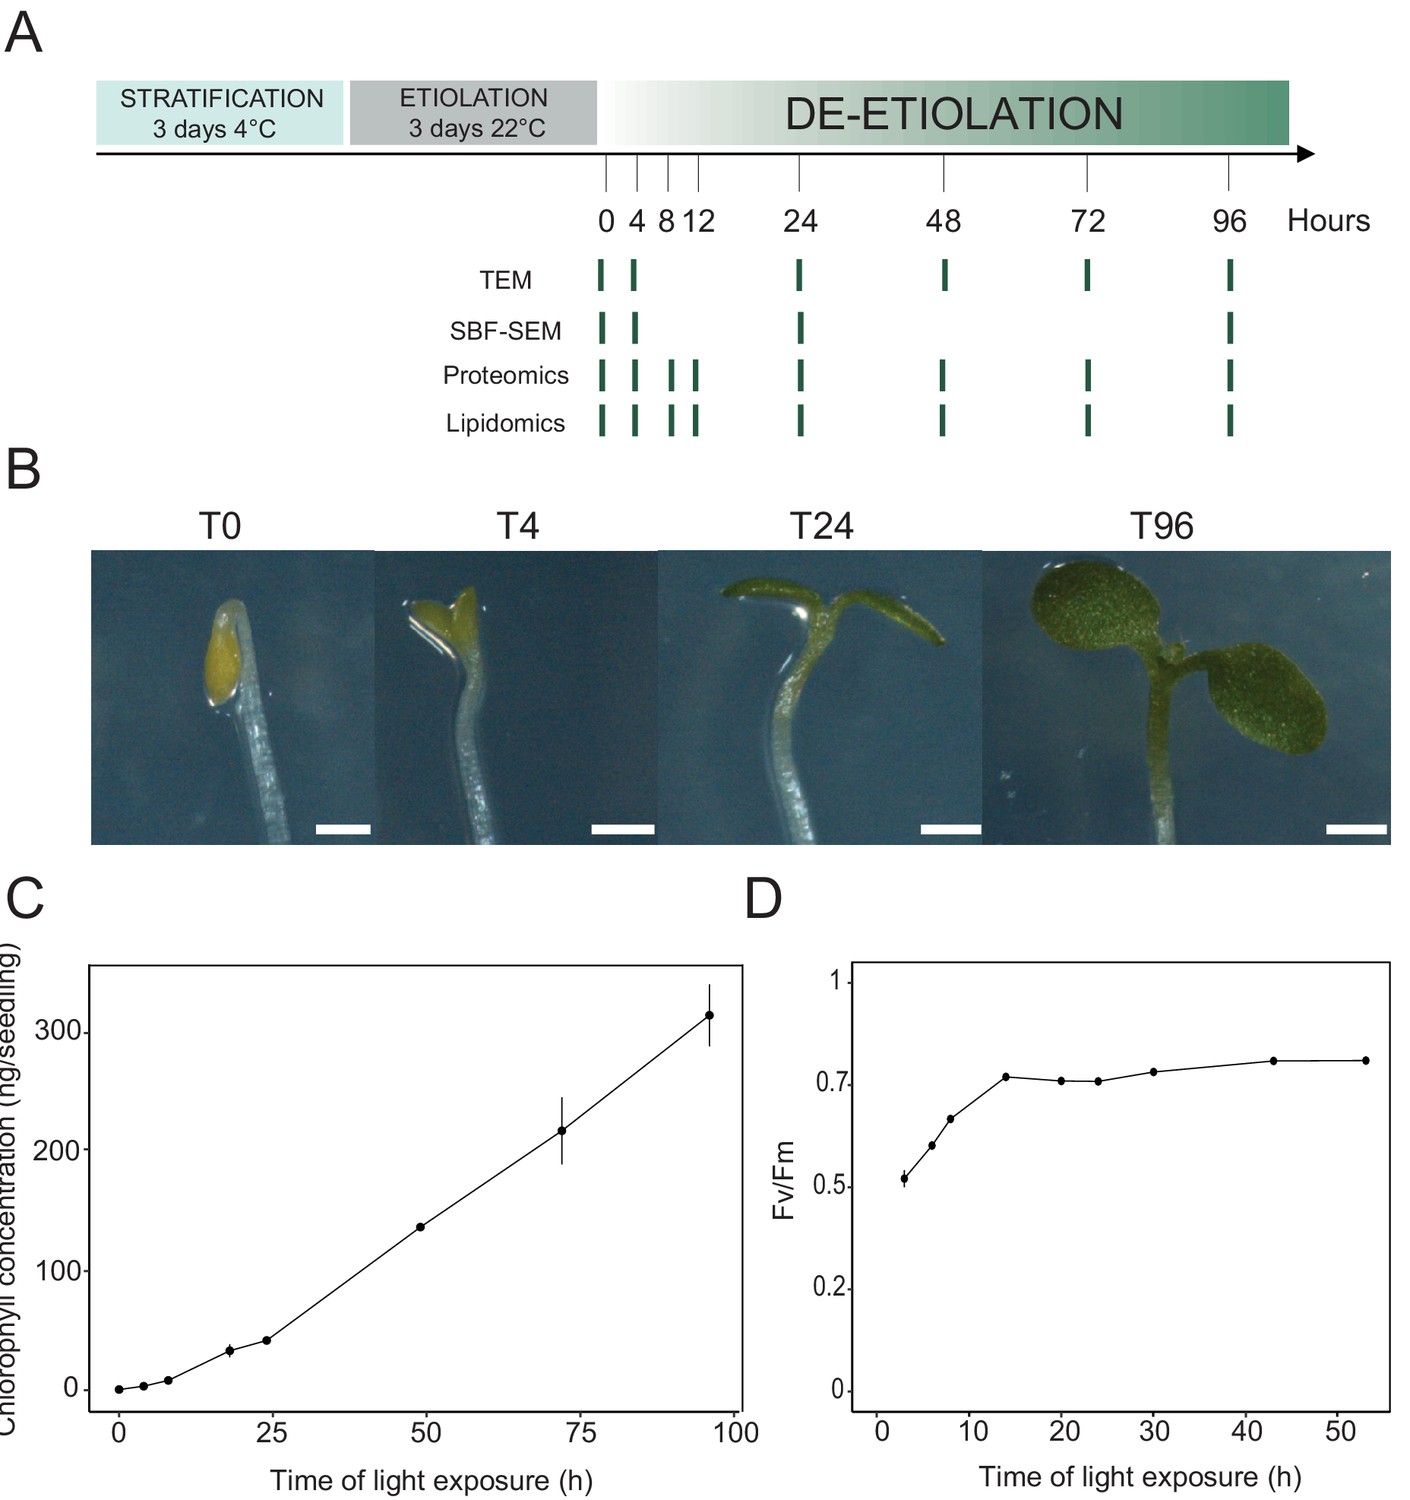
Photosynthesis onset during de-etiolation.
(A) Scheme of the experimental design. Seeds of Arabidopsis thaliana (Columbia) sown on agar plates were stratified for three days at 4°C and then transferred to 22°C in the dark. After 3 days, etiolated seedlings were exposed to continuous white light (40 µmol/m2/s) and harvested at different time points during de-etiolation. Selected time points used for different analyses are indicated. (B) Cotyledon phenotype of etiolated seedlings (T0) after 4 hr (T4), 24 hr (T24), and 96 (T96) hr in continuous white light. Scale bars: 0.5 mm. (C) Chlorophyll quantification at different time points upon illumination. Error bars indicate ± SD (n = 3). (D) Maximum quantum yield of photosystem II (Fv/Fm). Error bars indicate ± SD (n = 4–10). For some data points, the error bars are inferior to the size of the symbol. Measurements of further photosynthetic parameters are presented in Figure 1—figure supplement 1.
Figure 1—figure supplement 1

Photosynthesis parameters during de-etiolation.
Maximum photosynthetic quantum yield of PSII (Fv/Fm) of plants (dark-adapted for 5 min) grown under different light intensities (A). Photochemical quenching (B) and efficiency of the photosystem PSII (Φ PSII; C) measurements were made on 3-day-old etiolated seedlings that were de-etiolated under continuous light (40 μmol/m2/s) using a Fluorcam (Photon System Instrument). Error bars indicate ± SD (n = 10).
Figure 2 with 1 supplement
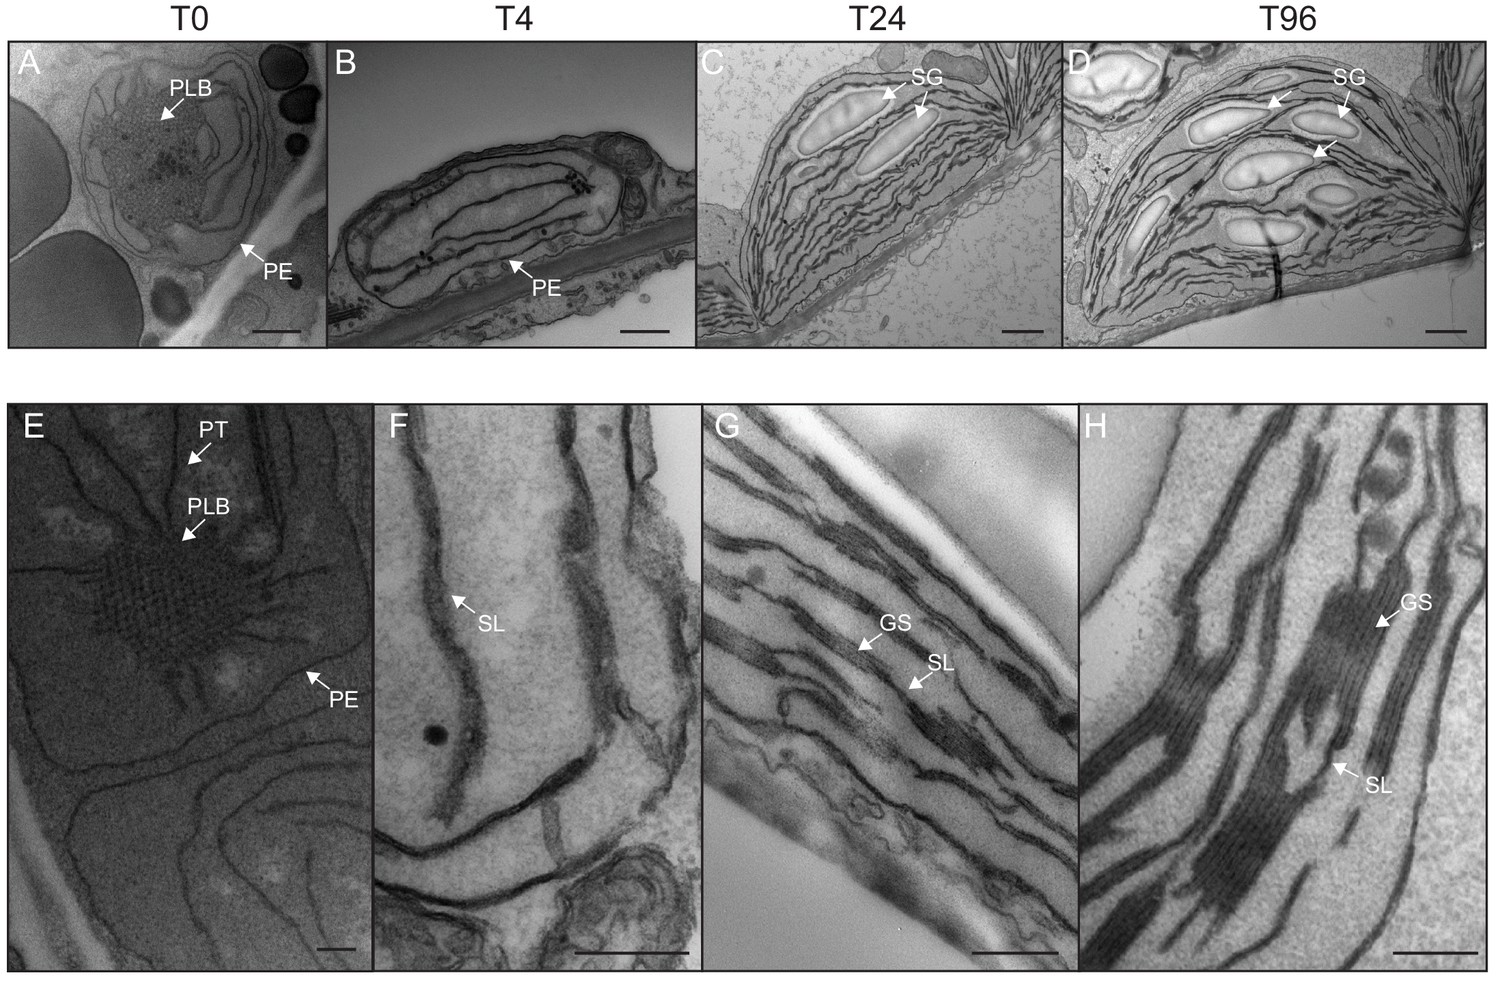
Qualitative analysis of chloroplast ultrastructure during de-etiolation.
Transmission electron microscopy (TEM) images of cotyledon cells of 3-day-old, dark-grown Arabidopsis thaliana (Columbia) seedlings illuminated for 0 hr (T0, A and E), 4 hr (T4, B and F), 24 hr (T24, C and G), and 96 hr (T96, D and H) in continuous white light (40 µmol/m2/s). (A–D) Scale bars: 500 nm, (E–H) higher magnification of A–D images; Scale bars: 200 nm. PLB: prolamellar body; PT: prothylakoid; PE: plastid envelope; SG: starch grain; GS: grana stack; SL: single lamella. Specific details for measurements of lamella thickness are provided in Figure 2—figure supplement 1.
Figure 2—figure supplement 1
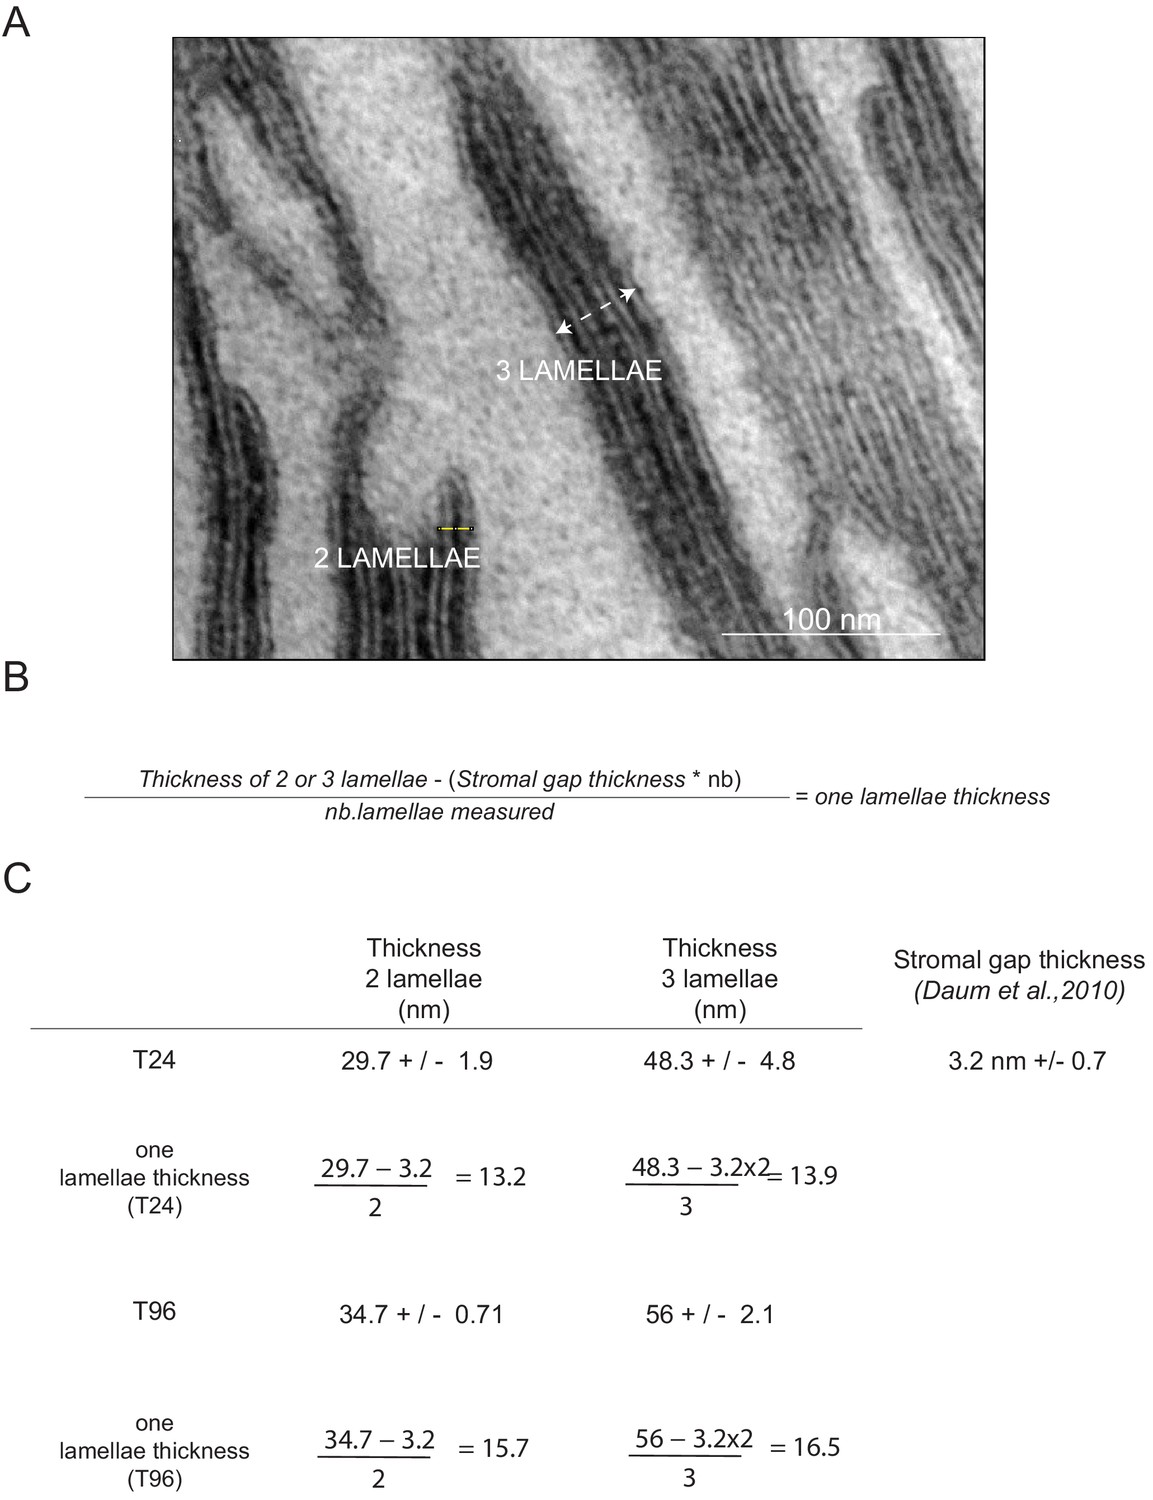
Measurement of lamella thickness.
(A) TEM chloroplast micrographs of 3-day-old, dark-grown Arabidopsis thaliana (Columbia) seedlings illuminated for 96 hr in continuous white light (40 μmol/m2/s) were used to measure the thickness of lamellae that constitute the grana stack. Measurements were performed using ImageJ. Scale bar: 100 nm. (B) Equation used to calculate the thickness of one lamella. (C) Data indicate mean ± SD (n = 10 for two lamellae and n = 7 for three lamellae).
Figure 3 with 1 supplement
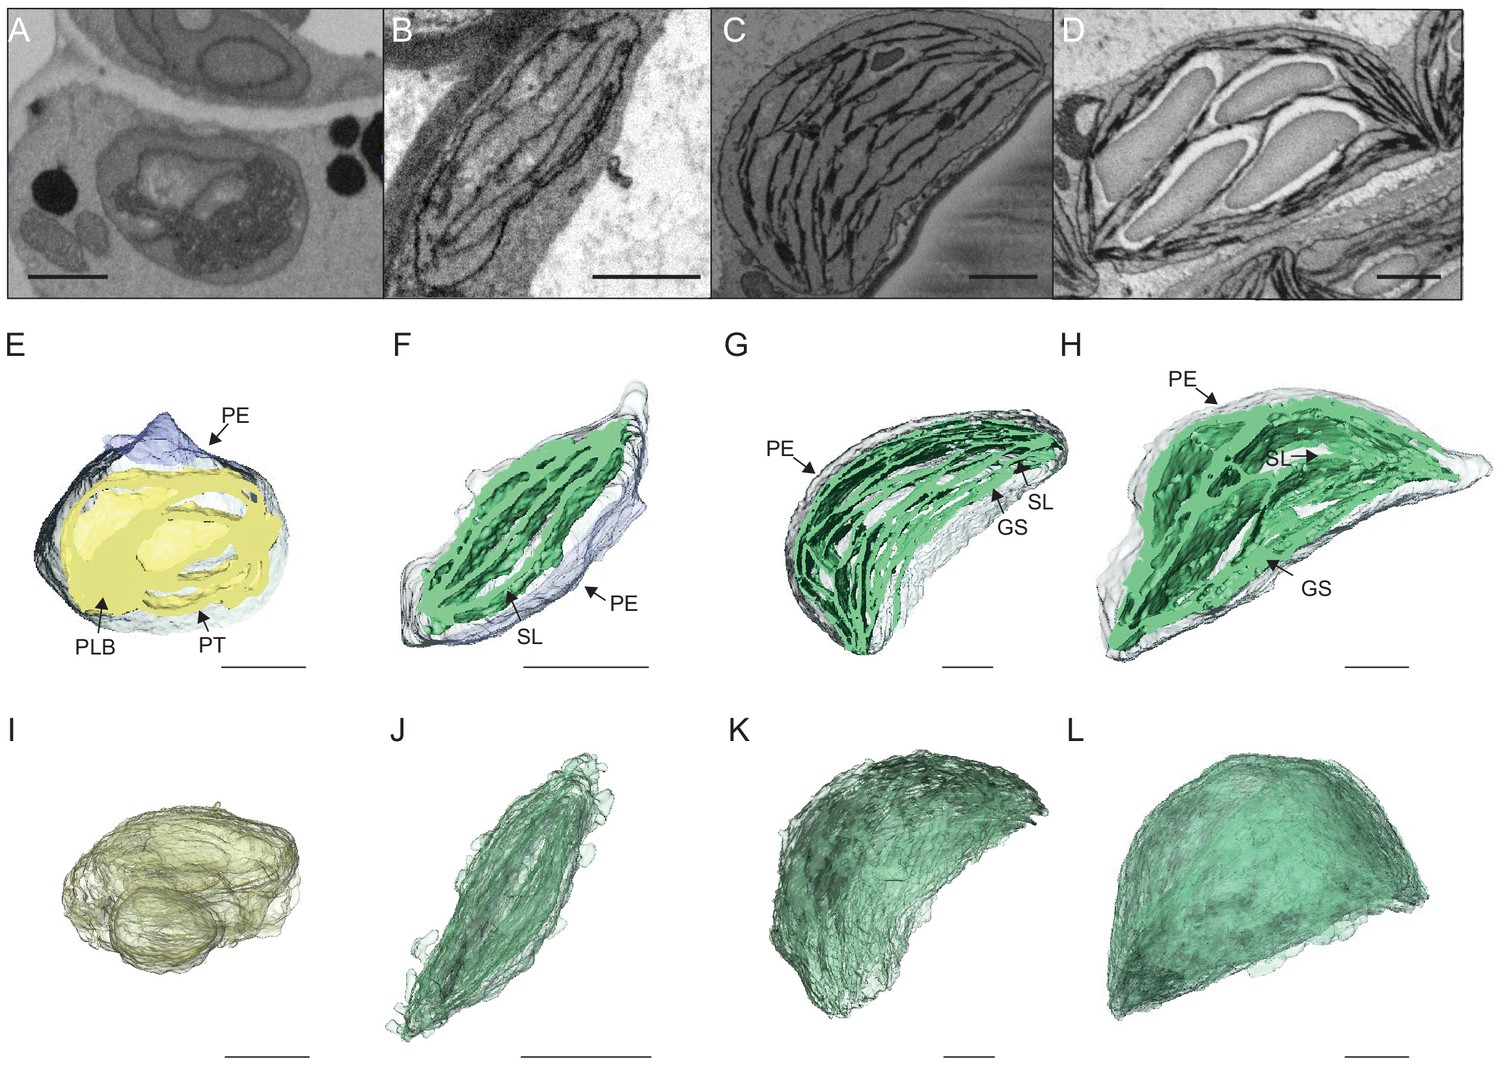
3D reconstructions of chloroplast thylakoid networks during de-etiolation.
(A–D) Scanning electron microscopy (SEM) micrographs of representative etioplasts and chloroplasts from 3-day-old, dark-grown Arabidopsis thaliana seedlings illuminated for 0 hr (T0; A), 4 hr (T4; B), 24 hr (T24; C), and 96 hr (T96; D) in continuous white light (40 µmol/m2/s). (E–H) Partial 3D reconstruction of thylakoid membranes (green) and envelope (blue) at T0 (E), T4 (F), T24 (G), and T96 (H). Z-depth of thylakoid membrane reconstruction corresponds to 0.06 µm (E), 0.10 µm (F), 0.13 µm (G), and 0.15 µm (H). (I–L) 3D reconstruction of a thylakoid membrane of an etioplast at T0 (I) or a chloroplast at T4 (J), T24 (K), and T96 (L). Scale bars = 1 µm. Details of grana segmentation at T24 are provided in Figure 3—figure supplement 1. PLB: prolamellar body; PT: prothylakoid; PE: plastid envelope; SG: starch grain; GS: grana stack; SL: single lamella.
Figure 3—figure supplement 1
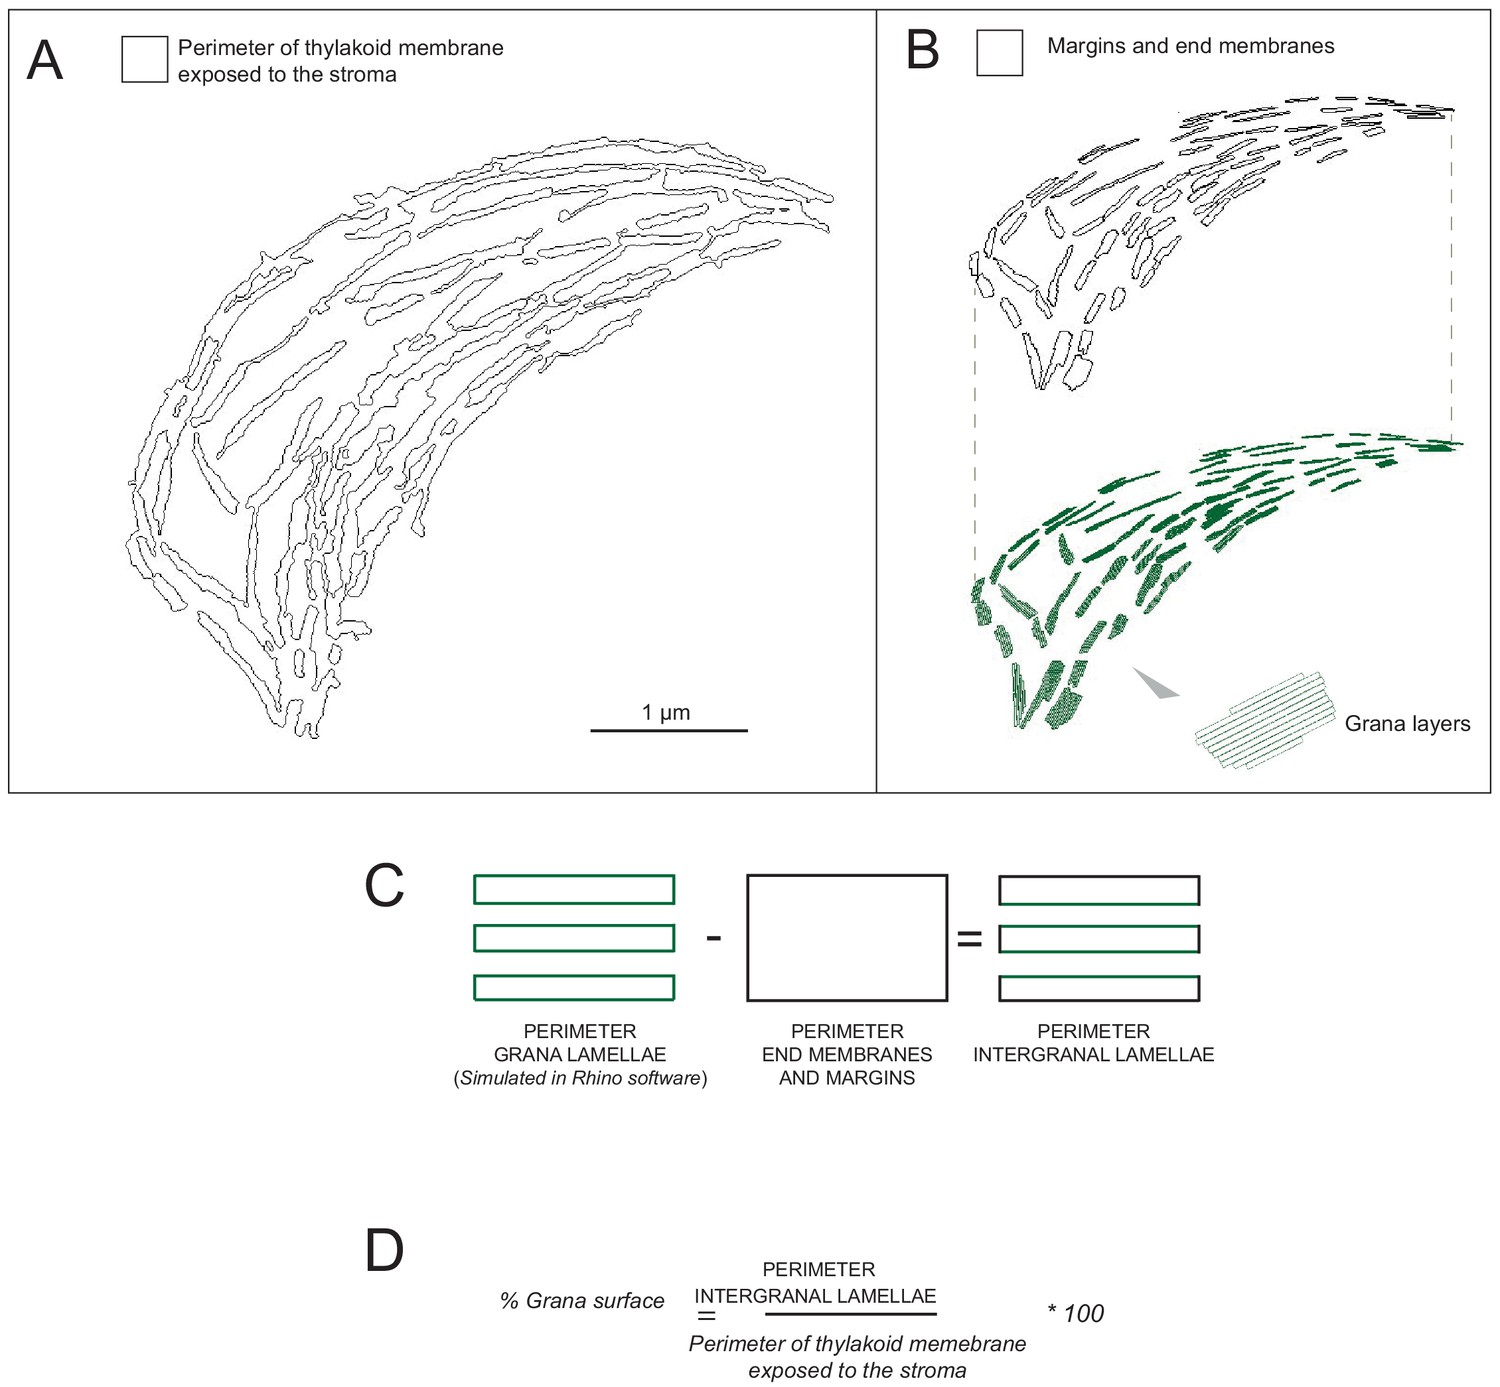
Grana segmentation (T24).
(A) Selection of thylakoid membrane exposed to the stroma was acquired using Amira. (B) The perimeter of the grana structures showed in black were segmented in layers of a specific thickness and distance using Rhino software, with the corresponding thickness (lamellae and stromal gap) measured and calculated as described in Figure 2—figure supplement 1. Grana segmentation was performed using thylakoid membrane of de-etiolating seedlings exposed to continuous white light (40 μmol/m2/s) for 24 (T24) and 96 (T96) hr. A representative example of a T24 replicate is illustrated here. (C) Schematic representation of the grana stack perimeter comprising margins, end membranes, and intergranal lamellae. (D) Equation used to calculate the percentage of the grana stack surface area relative to total thylakoid surface area.
Figure 4
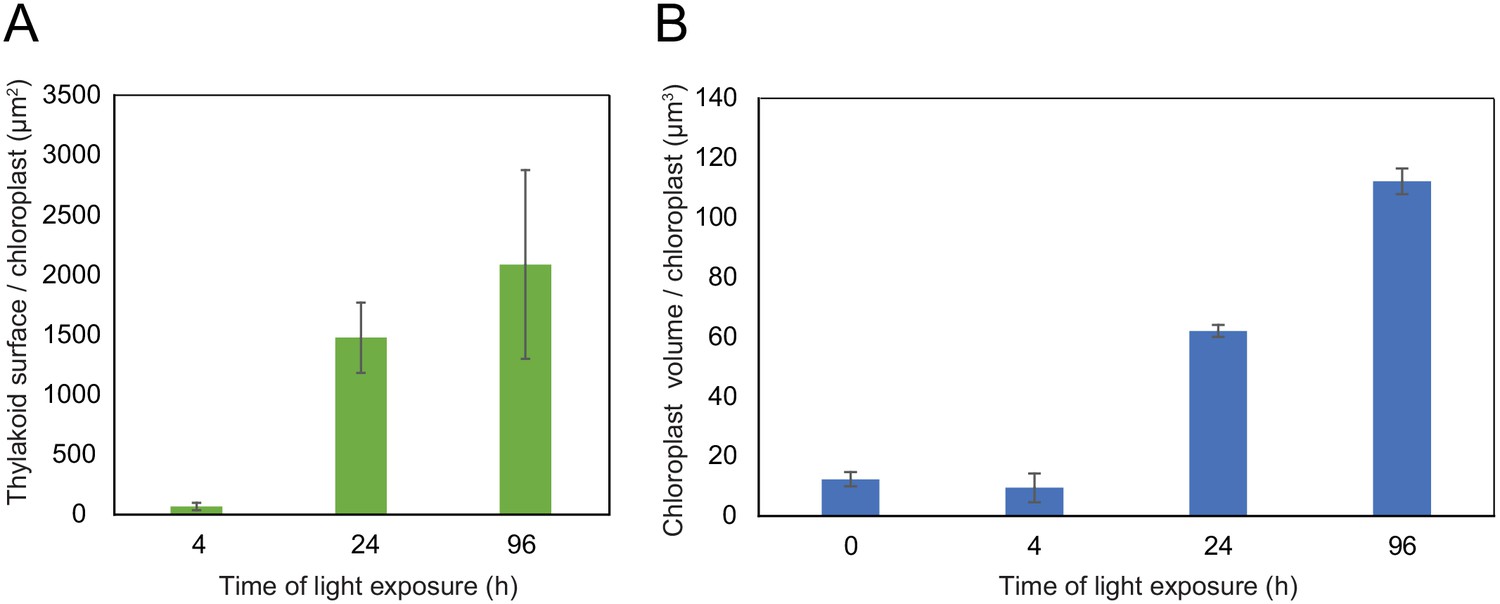
Quantitative analysis of chloroplast volume and thylakoid surface during de-etiolation.
Quantification of thylakoid surface per chloroplast (A) and chloroplast volume (B) using 3-day-old, dark-grown Arabidopsis thaliana (Columbia) seedlings illuminated for 0 hr, 4 hr, 24 hr, and 96 hr in continuous white light (40 µmol/m2/s). Morphometric data were quantified by Labels analysis module of Amira software. Error bars indicate ± SD (n = 3). The total thylakoid surface indicated in A corresponds to the thylakoid surface exposed to the stroma, calculated in Amira software, in addition to the percentage of the grana surface (%Gs) calculated as described in Figure 3—figure supplement 1.
-
Figure 4—source data 1
Quantitative chloroplast morphomotric data.
- https://cdn.elifesciences.org/articles/62709/elife-62709-fig4-data1-v1.xlsx
Figure 5 with 1 supplement
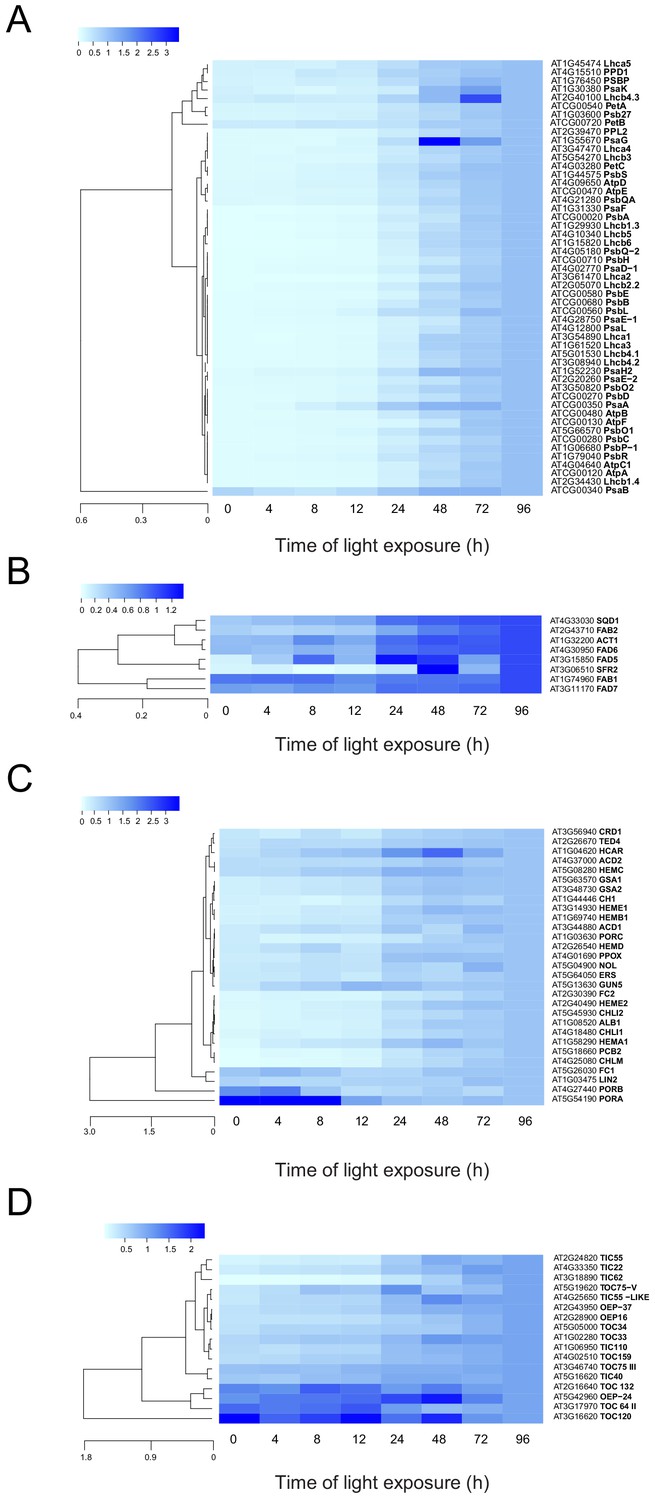
Accumulation dynamics of plastid proteins during de-etiolation.
Three-day-old etiolated seedlings of Arabidopsis thaliana were illuminated for 0 hr (T0), 4 hr (T4), 8 hr (T8), 12 hr (T12), 24 hr (T24), 48 hr (T48), 72 hr (T72), and 96 hr (T96) under white light (40 µmol/m2/s). Hierarchical clustering (Euclidean, average linkage) of normalized protein abundance for photosynthesis-(A), galactolipid metabolism- (B), chlorophyll metabolism- (C), and protein import-related proteins during de-etiolation (D). Protein abundance was quantified by shot-gun proteomics and heatmap colors indicate the fold change (average of 3–4 replicates) of each selected protein at each time point of de-etiolation (T0 to T96), relative to the last time point (T96). Note that some PORA values in panel D were higher than 3.5 and outside of the color range limits. Further hierarchical clustering based on the accumulation dynamics of all plastid-localized proteins is provided in Figure 5—figure supplement 1.
-
Figure 5—source data 1
Chloroplast localized proteins identified by MS and clusters.
- https://cdn.elifesciences.org/articles/62709/elife-62709-fig5-data1-v1.xlsx
Figure 5—figure supplement 1
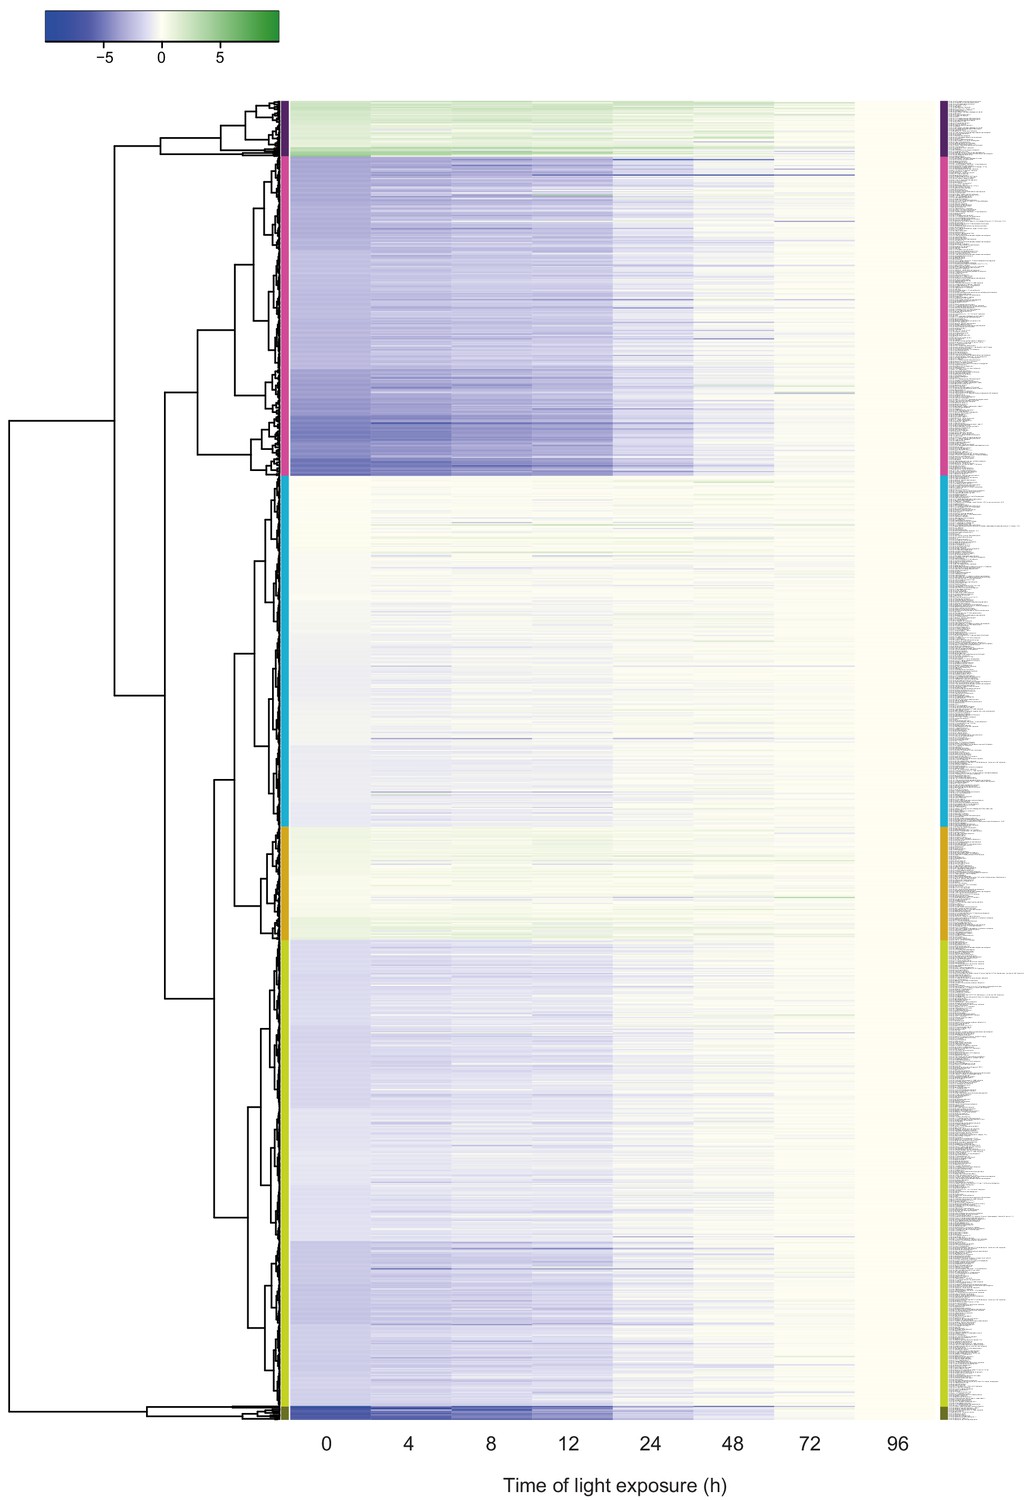
Accumulation dynamics of selected plastid proteins during de-etiolation.
Hierarchical clustering (Euclidean, average linkage) of normalized protein abundance (log2 fold changes with values increasing from blue to yellow to green, with yellow corresponding to log2 fold change = 0) for plastid-localized proteins during de-etiolation. Normalization was performed to the last time point (96 hr). Defined clusters are indicated with different colors (1 = purple; 2 = pink; 3 = turquoise; 4 = brown; 5 = light green; 6 = dark green). Protein IDs (AGI) and names are legible upon zoom-in.
-
Figure 5—figure supplement 1—source data 1
List of proteins identified by MS and quantitative data.
- https://cdn.elifesciences.org/articles/62709/elife-62709-fig5-figsupp1-data1-v1.xlsx
Figure 6 with 1 supplement
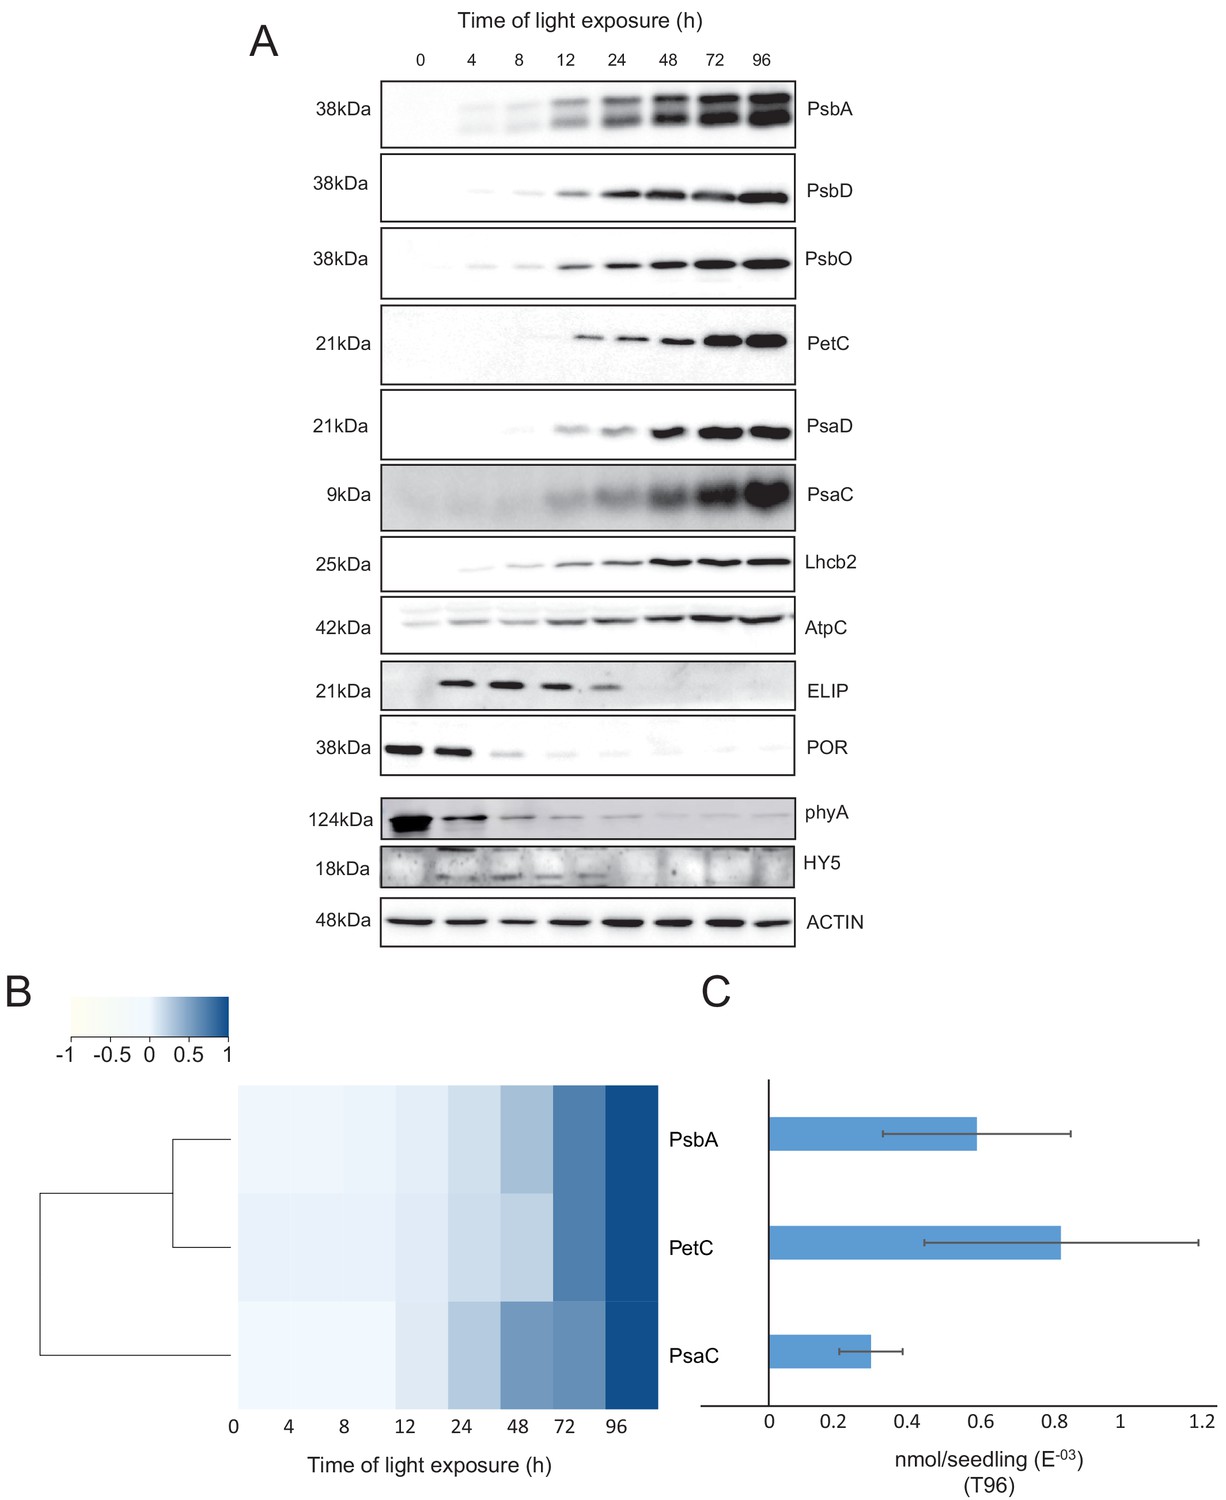
Accumulation dynamics of photosynthesis-related proteins during de-etiolation.
Three-day-old etiolated seedlings of Arabidopsis thaliana were illuminated for 0 hr (T0), 4 hr (T4), 8 hr (T8), 12 hr (T12), 24 hr (T24), 48 hr (T48), 72 hr (T72), and 96 hr (T96) under white light (40 µmol/m2/s). (A) Proteins were separated by SDS-PAGE and transferred onto nitrocellulose membrane and immunodetected with antibodies against PsbA, PsbD, PsbO, PetC, PsaD, PsaC, Lhcb2, AtpC, ELIP, POR, phyA, HY5, and ACTIN proteins. (B–C) Quantification of PsbA, PetC, and PsaC during de-etiolation. Heatmap (B) was generated after normalization of the amount of each protein relative to the last time point (T96). Graph (C) corresponds to the absolute quantification of proteins at T96. Error bars indicate ± SD (n = 3). Quantification of photosystem-related proteins during de-etiolation is detailed in Figure 6—figure supplement 1.
-
Figure 6—source data 1
Quantitative data for immunoblot analysis.
- https://cdn.elifesciences.org/articles/62709/elife-62709-fig6-data1-v1.xlsx
Figure 6—figure supplement 1
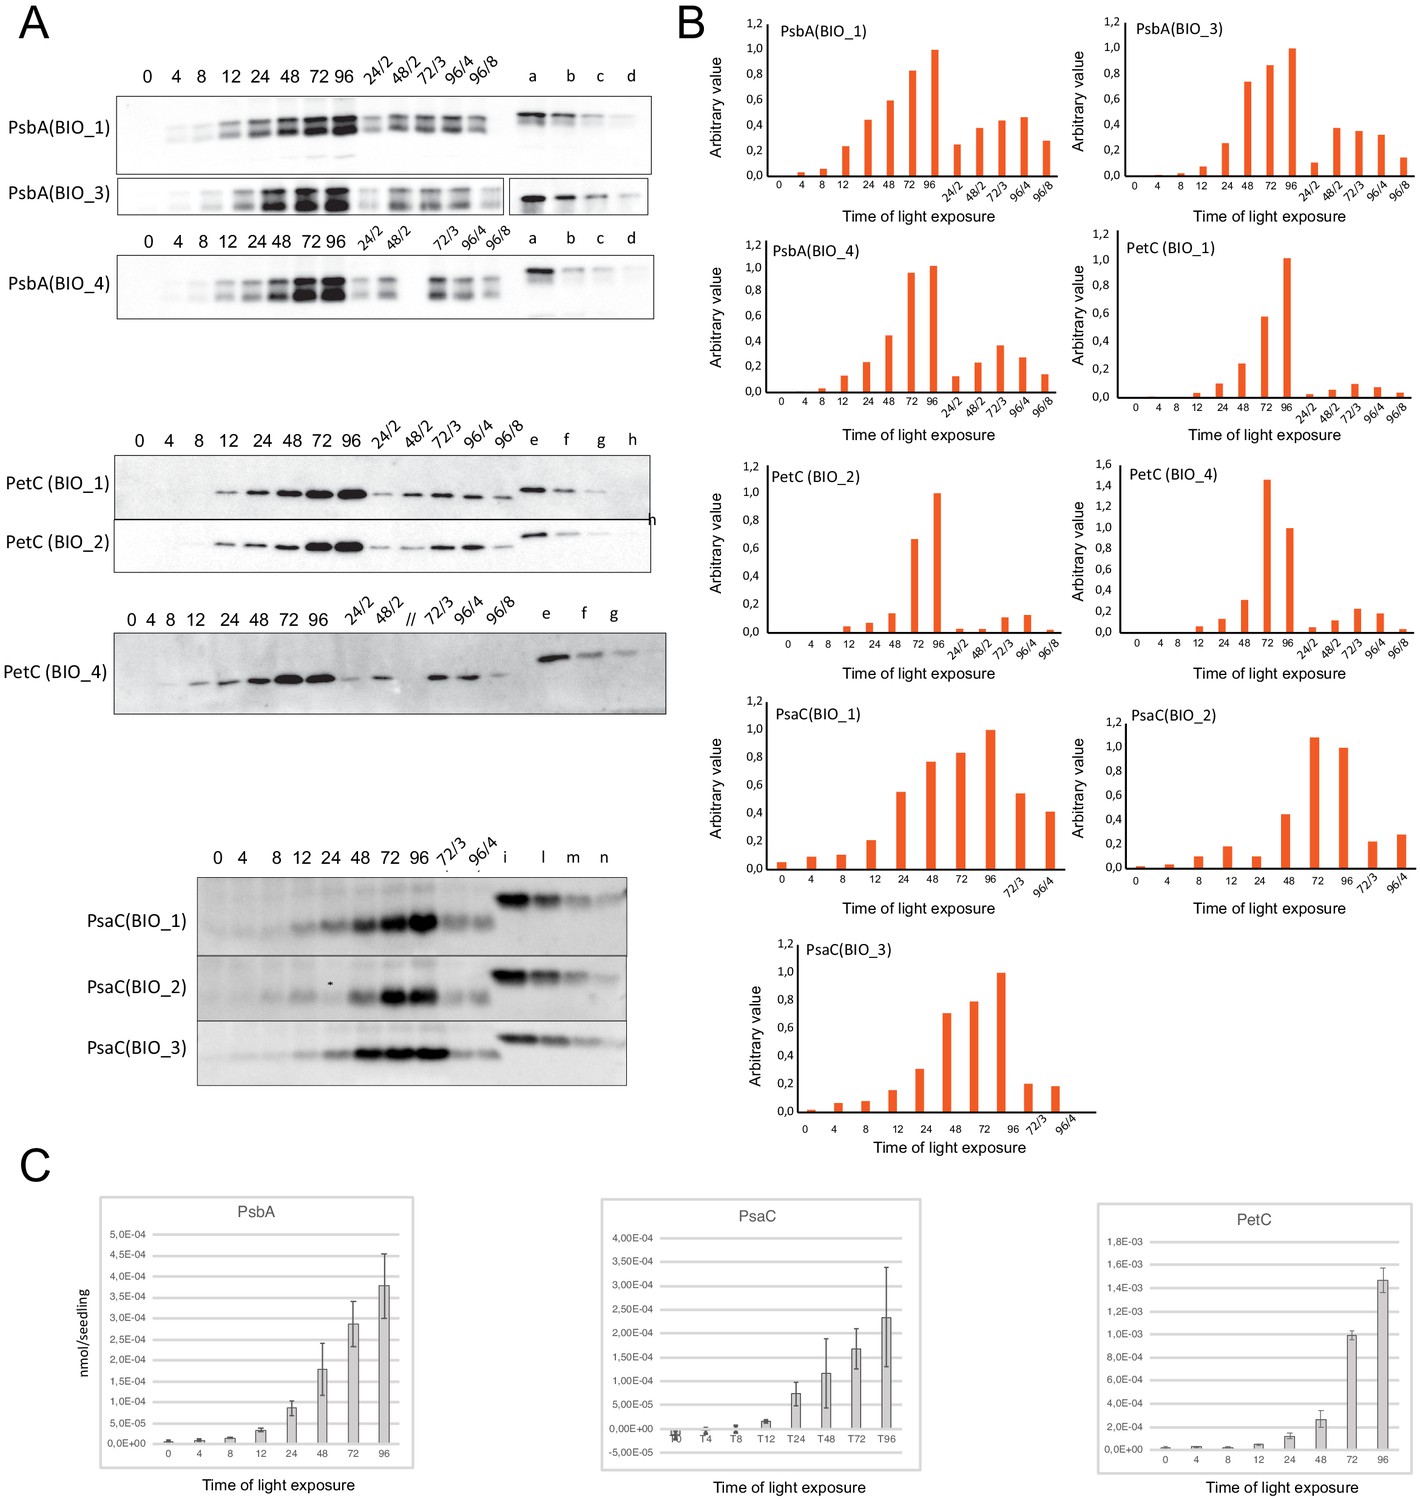
Quantification of photosynthesis-related proteins.
(A) Immunodetection of PsbA, PetC, and PsaC during de-etiolation. Dilutions were used for the later time points to avoid saturation of the signal. (B) Different bands were detected by Amersham Imager program and quantified by Image QuantTL (Amersham). (C) Calibration curves were created using recombinant proteins (Agrisera). Calibration curve composition: PsbA 10 ng (A; lane a), 5 ng (b), 2.5 ng (c), and 1.25 ng (d); PetC 10 ng (e), 5 ng (f), 2.5 ng (g), and 1.25 ng (h); PsaC 3 ng (i), 1.5 ng (l), 0.75 ng (m), and 0.325 ng (n). Data indicate mean ± SD (n = 3–4). Raw data and calculations are shown in Figure 6—source data 1.
Figure 7
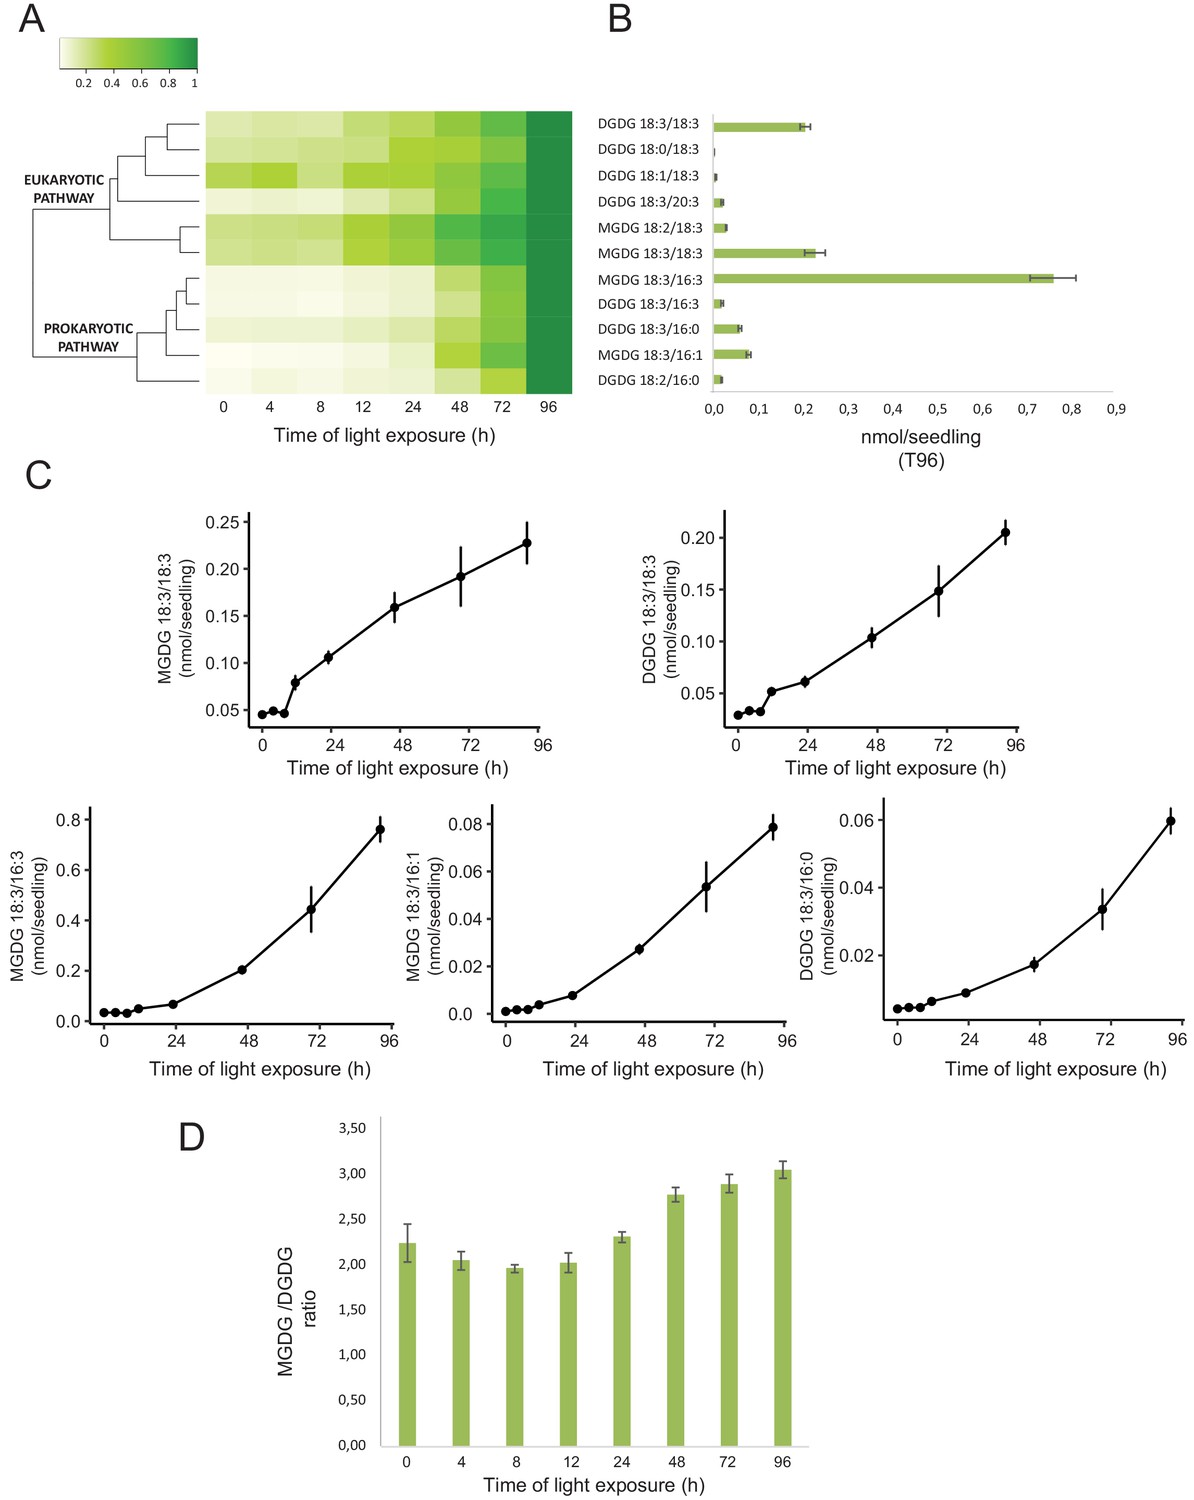
Accumulation dynamics of galactolipids during de-etiolation.
Three-day-old etiolated seedlings of Arabidopsis thaliana were illuminated for 0 hr (T0), 4 hr (T4), 8 hr (T8), 12 hr (T12), 24 hr (T24), 48 hr (T48), 72 hr (T72), and 96 hr (T96) under white light (40 µmol/m2/s). (A) Heatmap representation of galactolipids (MGDG and DGDG) during de-etiolation. Samples were normalized to the last time point (T96). (B) Absolute quantification at T96 expressed in nmol/seedling. Error bars indicate ± SD (n = 4). (C) Absolute quantification (nmol/seedling) of the most abundant chloroplast galactolipids MGDG (MGDG 18:3/18:3, MGDG 18:3/16:3, MGDG 18:3/16:1) and DGDG (DGDG 18:3/18:3, DGDG 18:3/16:0) at different time points during de-etiolation. Error bars indicate ± SD (n = 4). (D) The MGDG/DGDG ratio was calculated using all 12 species of galactolipids detected during de-etiolation. Error bars indicate ± SD (n = 4).
-
Figure 7—source data 1
Quantitative data for lipidomics.
- https://cdn.elifesciences.org/articles/62709/elife-62709-fig7-data1-v1.xlsx
Figure 8 with 1 supplement
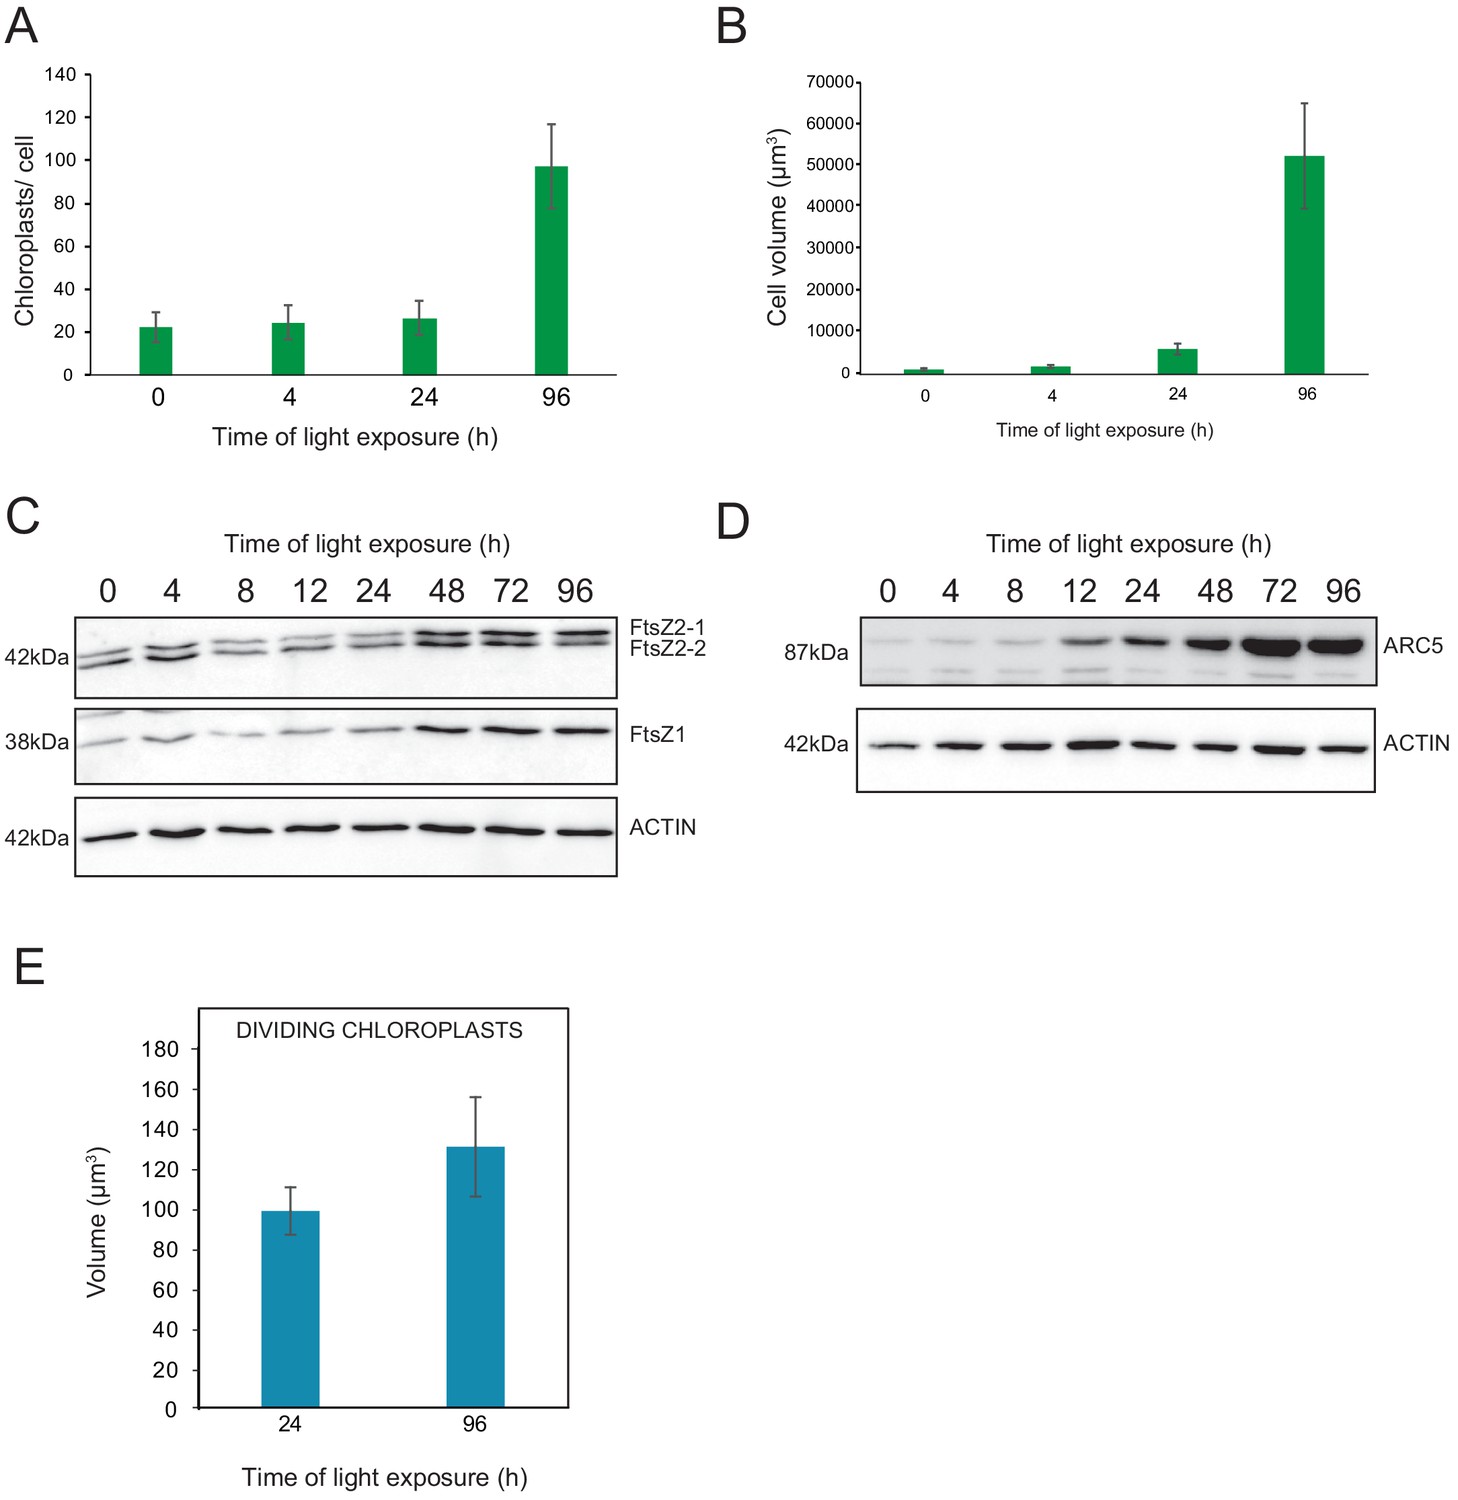
Relationship between chloroplast proliferation and chloroplast volume.
(A–B) Chloroplast number and cell volume in cotyledons of 3-day-old, dark-grown Arabidopsis thaliana seedlings illuminated for 0 hr (T0), 4 hr (T4), 24 hr (T24), and 96 hr (T96) in continuous white light (40 µmol/m2/s). (A) Chloroplast number per cell during de-etiolation. Error bars indicate ± SD (n = 6 for T0 and T4; seven for T24; five for T96). (B) Cell volume was quantified by the Labels analysis module of Amira software. Error bars indicate ± SD (n = 5–6). (C–D) Total proteins were extracted from T0–T96 seedlings, separated on SDS-PAGE, and transferred onto nitrocellulose. Proteins involved in plastid division (C, FtsZ; D, ARC5) and loading control (actin) were detected using specific antibodies (FtsZ2 antibody recognizes both FtsZ2-1 and FtsZ2-2). (E) Volume of dividing chloroplast at T24 and T96. Error bars indicate ± SD (n = 3). Further details of chloroplast proliferation in parallel with cell expansion are provided in Figure 8—figure supplement 1.
-
Figure 8—source data 1
Quantitative data for chloroplast number, cell and chloroplast volumes.
- https://cdn.elifesciences.org/articles/62709/elife-62709-fig8-data1-v1.xlsx
Figure 8—figure supplement 1
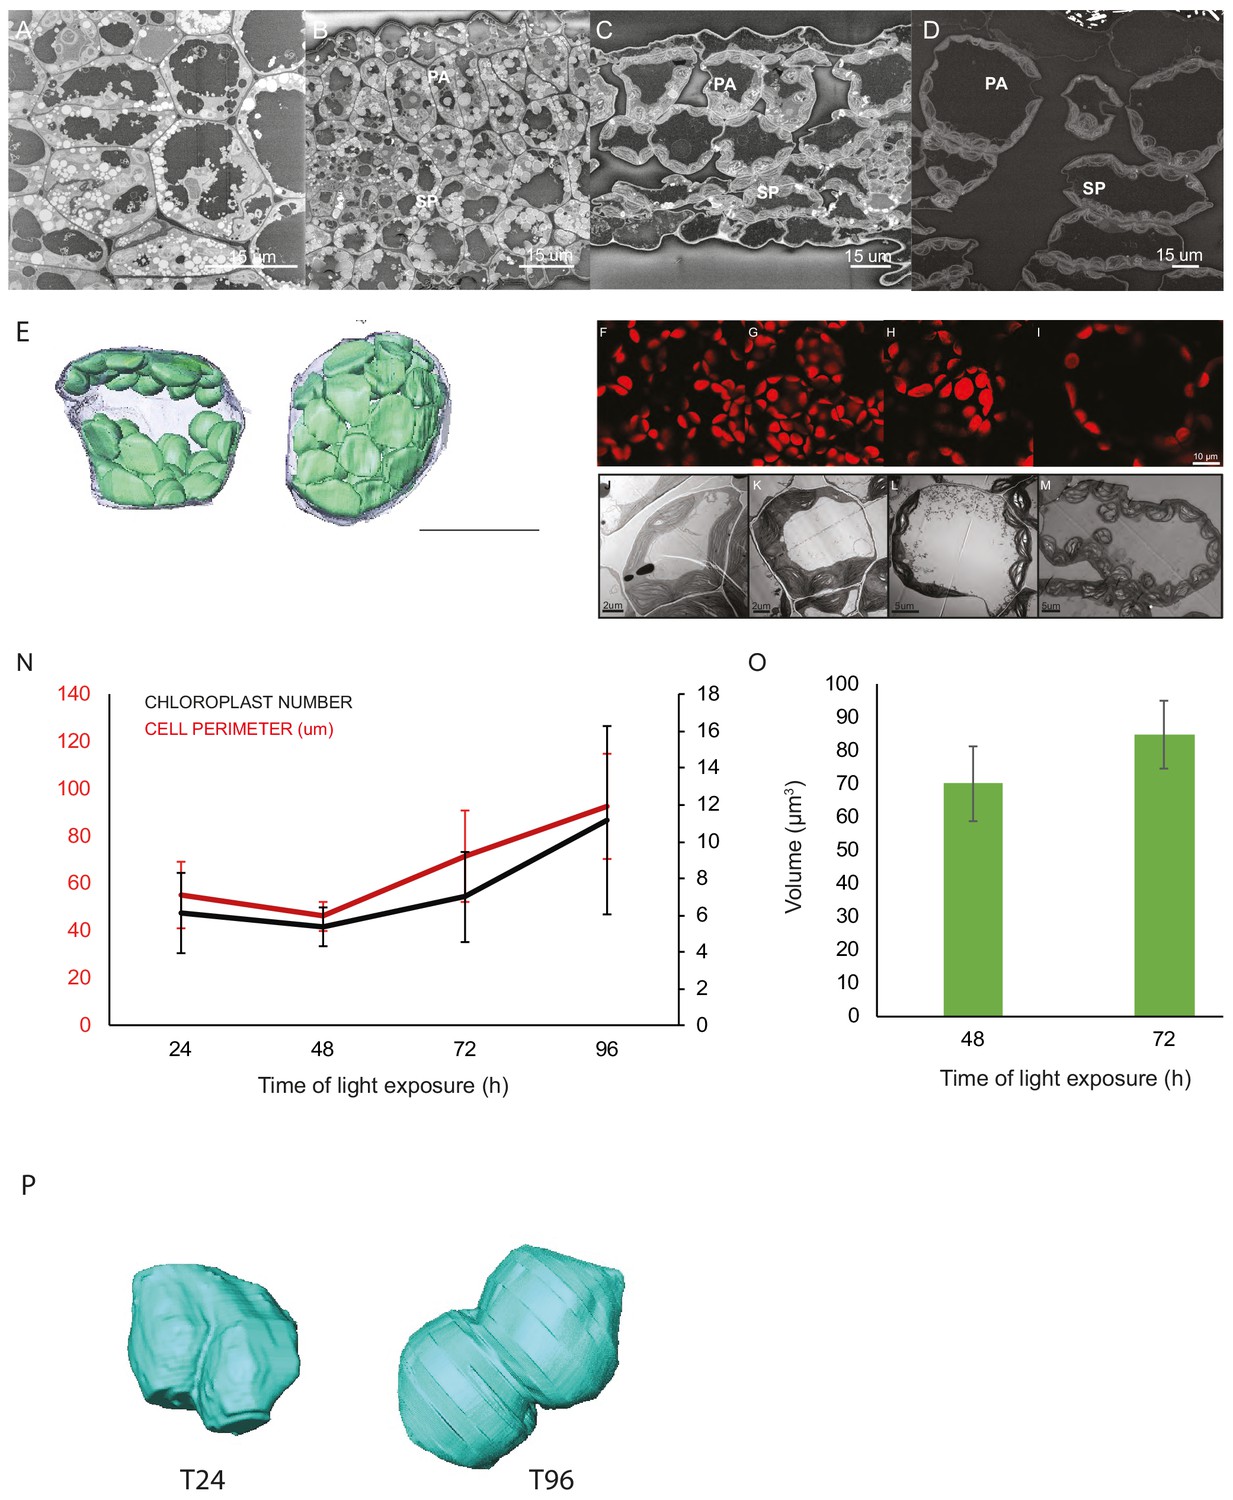
Chloroplast proliferation in parallel with cell expansion.
SEM micrographs of 3-day-old, dark-grown Arabidopsis thaliana (Columbia) seedlings illuminated for 0 hr (T0; A), 4 hr (T4; B), 24 hr (T24; C), and 96 hr (T96; D) in continuous white light (40 μmol/m2/s). Palisade (PA) and spongy (SP) cells are indicated. Scale bars: 15 μm. (E) 3D reconstruction of a palisade cell at T24 after segmentation of chloroplasts and cell plasma membrane. (F–I) Confocal images of cotyledons of dark-grown seedlings at T24 (F), T48 (G), T72 (H), and T96 (I). Scale bars: 10 μm. (J–M) TEM micrographs of cotyledon cells of dark-grown seedlings at T24 (J), T48 (K), T72 (L), and T96 (M). (J–K), scale bars: 2 μm; L–M, scale bars: 5 µm. (N) Cell perimeter measured with Amira software using (red line). The Z-depth of each stack corresponds to 1 μm. Relative chloroplast number per cell was counted using 2D TEM images (black line). Red error bars indicate ± SD (n = 17). Black error bars indicate ± SD (n = 3–4). (O) Single chloroplast volume quantified at T48 and T72. Data indicate mean ± SD (n = 5). (P) Examples of chloroplasts selected for the quantification of the volume of chloroplast in division at T24 and T96.
Figure 9 with 2 supplements
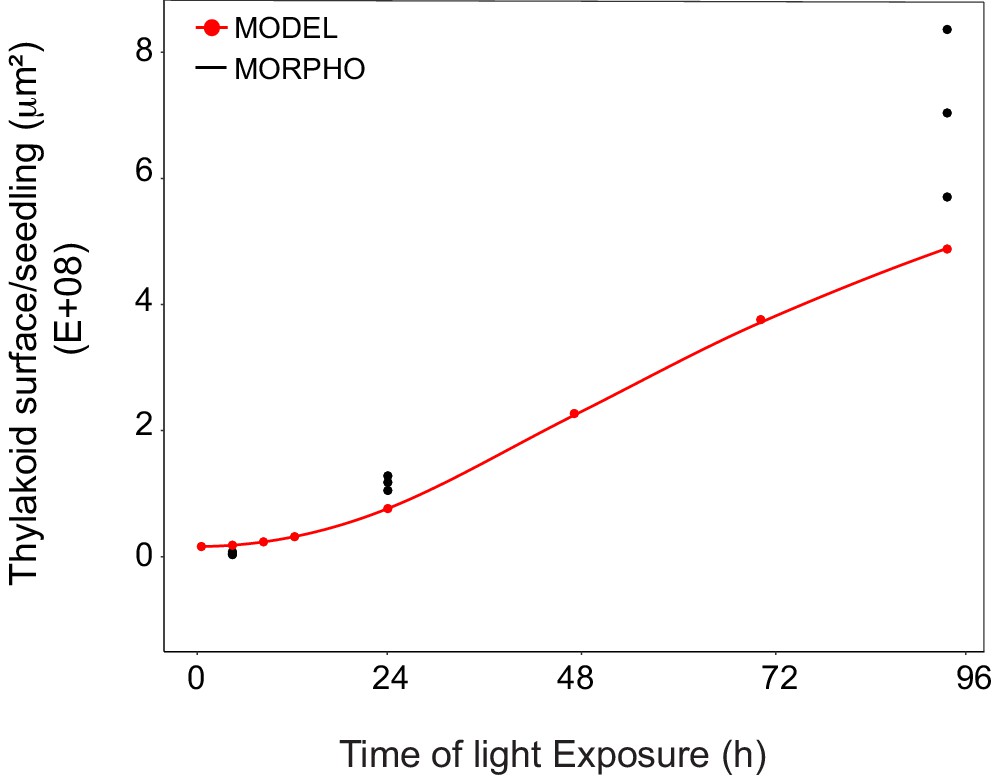
Superimposition of thylakoid surface per seedling obtained from morphometric analysis and mathematical modeling.
Thylakoid surface per seedling was estimated using quantitative data from 3View analysis (‘MORPHO’ black dots at T4, T24, and T96; and see Figure 4 and Table 1) and model generated using the quantitative data from proteomics and lipidomics (‘MODEL’ red line at T0, T4, T8, T12, T24, T48, T72, and T96, and Table 1). Further details are provided in Figure 9—figure supplements 1 and 2.
-
Figure 9—source data 1
Quantitative data used for the mathematical model.
- https://cdn.elifesciences.org/articles/62709/elife-62709-fig9-data1-v1.xlsx
Figure 9—figure supplement 1
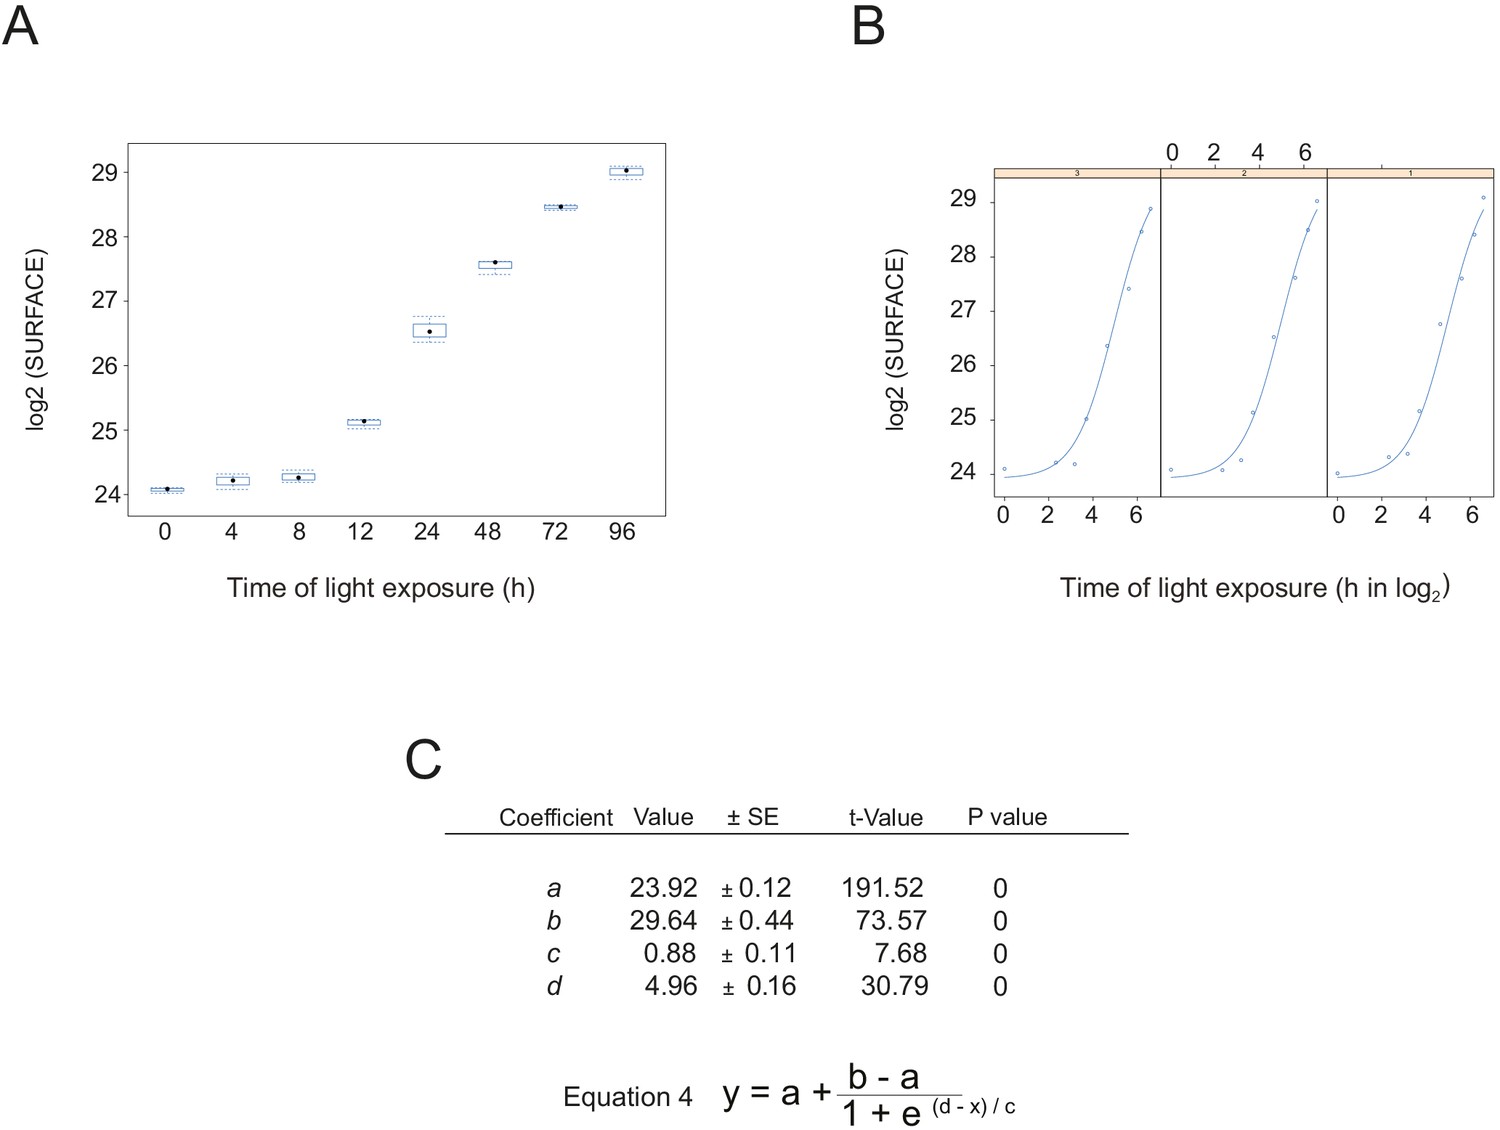
Non-linear mixed effect model of thylakoid surface during de-etiolation.
(A) Total surface of thylakoid membrane components (in μm2) in function of de-etiolation time point. (B) Individual plots for each biological replicate. (C) Values, standard errors, t-value, and p-value of the four parameters (a, b, c, and d) used in the main equation. Smodel = surface of thylakoid at a specific time (t) t = time of light exposure (h) a = asymptote (to the left if c > 0) b = right asymptote (to the right if c > 0) c = proportional to the slope of the curve at the inflection point d = inflection point (point at which the mean Smodel value is reached).
Figure 9—figure supplement 2

Morphometric analysis of cotyledons.
(A) Cotyledon surface area of 3-day-old, dark-grown Arabidopsis thaliana (Columbia) seedlings illuminated with 24 hr (T24) and 96 hr (T96) of continuous white light (40 µmol/m2/s). (B) The thickness (T) of mesophyll tissue constituted of palisade (PA), spongy (SP) cells, and vascular system (VS) in addition to the epidermal tissue was measured. Error bars indicate ± SD (n = 3–4). (C) Estimation of cotyledon volume. Error bars indicate ± SD (n = 3–4). (D) Estimation of the number of cells per cotyledon (see Figure 9—source data 1 for calculations).
Figure 10
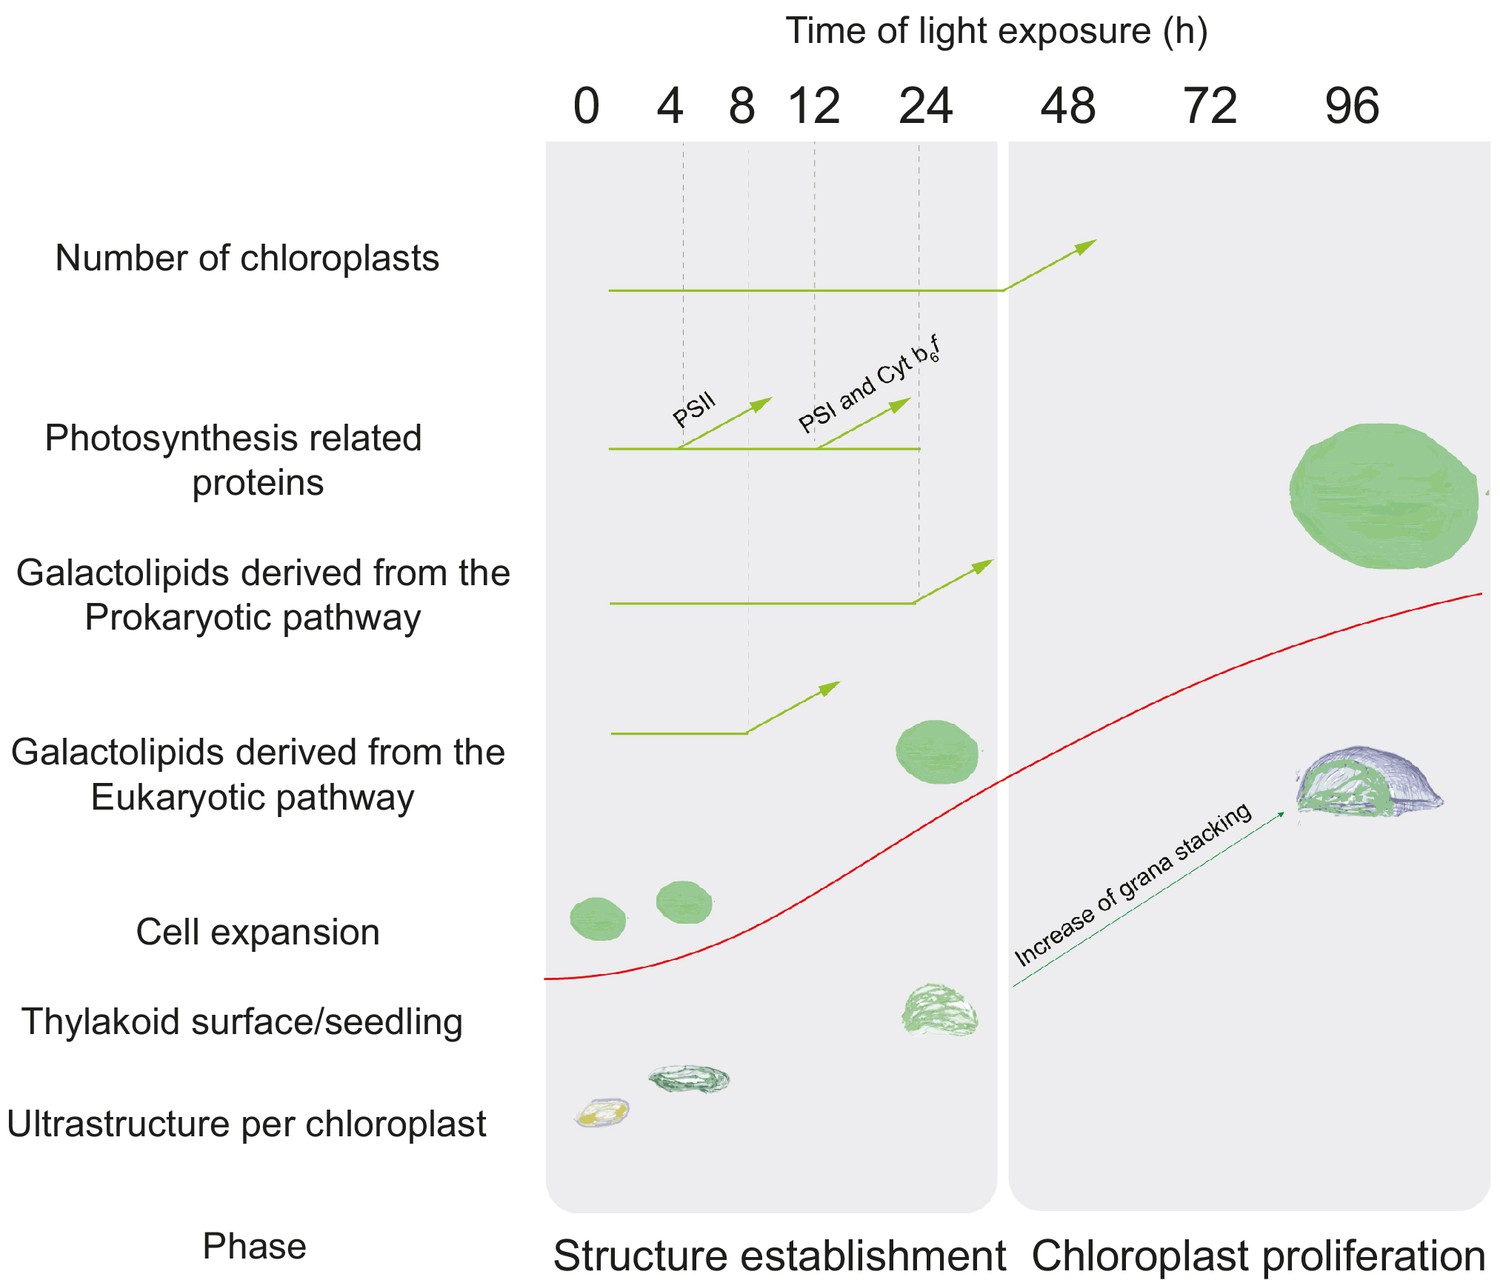
Overview of changes observed during the de-etiolation process in Arabidopsis thaliana seedlings.
The ‘Structure Establishment Phase’ is correlated with disassembly of the PLB and gradual formation of the thylakoid membrane as well as an initial increase of eukaryotic (after 8 hr) and prokaryotic (after 24 hr) galactolipids and photosynthesis-related proteins (PSII subunits at 4 hr, PSI and cyt b6f at 12 hr). The subsequent ‘Chloroplast Proliferation Phase’ is associated with an increase in chloroplast number in concomitance with cell expansion, a linear increase of prokaryotic and eukaryotic galactolipids and photosynthesis-related proteins, and increased grana stacking. The red curve (retrieved from the Figure 9) shows thylakoid surface/seedling dynamics during the de-etiolation process.
Videos
Video 1
Representative sequential sections showing etioplasts (T0) followed by segmentation and 3D reconstruction of envelope (blue), and prothylakoids and prolamellar body (yellow) of a single etioplast.
The tour of the etioplast reveals its ovoid shape. The sequential view of the 3D reconstruction and final partial 3D visualization reveals a single prolamellar body and interconnected prothylakoids.
Video 2
Representative sequential sections of a chloroplast (T4) followed by segmentation and 3D reconstruction of envelope (blue), and thylakoids (green).
The tour of the chloroplast reveals its ovoid/discoid shape. The sequential view of the 3D reconstruction and final partial 3D visualization reveals that thylakoids are constituted by lamellae parallelly oriented.
Video 3
Representative sequential sections of a chloroplast (T24) followed by segmentation and 3D reconstruction of envelope (blue), and thylakoids (green).
The tour of the chloroplast reveals its hemispheric shape. The sequential view of the sections reveals the presence of 8 starch granules . The sequential view of the 3D reconstruction and final partial 3D visualization reveals that thylakoids are constituted by non-appressed (stroma lamellae) and appressed regions (grana).
Video 4
Representative sequential sections of a chloroplast (T96) followed by segmentation and 3D reconstruction of envelope (blue), and thylakoids (green).
The tour of the chloroplast reveals its hemispheric shape. The sequential view of the sections reveals the presence of 11 large starch granules . The sequential view of the 3D reconstruction and final partial 3D visualization reveals that thylakoids are constituted by non-appressed (stroma lamellae) and appressed regions (grana), with large spaces between lamellae occupied by starch granules.
Tables
Table 1
Collection of quantitative data.
Morphometric data corresponding to thylakoid surfaces and volumes, thylakoid/envelope surface ratio, and chloroplast and cell volumes were collected after SBF-SEM and 3D reconstruction. Chloroplast and cell volumes were also quantified by subsequent confocal microscopy analysis, whereas plastid length was measured using TEM images. Molecular data for galactolipids (GLs) were analyzed by lipidomics, whereas PsbA, PsaC, and PetC were quantified by quantitative immunodetection.
| Method | T0 | T4 | T8 | T12 | T24 | T48 | T72 | T96 | |
|---|---|---|---|---|---|---|---|---|---|
| Chloroplast volume (µm3) | SBF-SEM | 12.27 (±2.3) | 9.4 (±4.8) | - | - | 62 (±2.04) | - | - | 112.14 (±4.3) |
| Thylakoid surface (µm2) | SBF-SEM | - | 67 (±29.5) | - | - | 1476 (±146) | - | - | 2086 (±393) |
| Grana lamellae/total thylakoid surface | - | - | - | - | 2.55 (±0.11) | - | - | 2.08 (±0.57) | |
| Thylakoid/envelope surface | - | 1.02 (±0.15) | - | - | 7.37 (±0.51) | - | - | 6.83 (±1.40) | |
| Length of plastid (µm) | TEM | 2 (±0.90) | 2.8 (±0.90) | - | - | 5.1 (±1.47) | - | - | 6 (±1.62) |
| Stroma lamellae volume (µm3) | SBF-SEM | 2.43 (±0.95) | - | - | 17.87 (±1.04) | - | - | 29.17 (±1.94) | |
| Chloroplast volume (µm3) | Confocal | - | - | - | - | 61.5 (±11.2) | 70.1 (±10.2) | 85 (±22) | - |
| Cell volume (µm3) | SBF-SEM | 1173 (±284) | 1891 (±362) | - | - | 6103 (±1309) | - | - | 52597 (±12671) |
| Cell perimeter (µm) | TEM | 55.3 (±14.1) | 46.4 (±6.1) | 71.7 (±19.1) | 92.8 (±22.1) | ||||
| Number of chloroplast per cell | SBF-SEM | 22 (±6) | 25 (±8) | - | - | 26 (±6) | - | - | 112 (±29) |
| Number of cells per seedling | - | - | - | - | ~3000 | - | - | ~3000 | |
| Protein / GLs surface | 0.19 (±0.05) | 0.23 (±0.04) | 0.34 (±0.03) | 0.52 (±0.07) | 0.80 (±0.14) | 0.80 (±0.17) | 0.78 (0.07) | 0.87 (±0.25) | |
| GLs (nmol/seedling) | Lipidomics | 0.31 (±0.03) | 0.31 (±0.02) | 0.32 (±0.02) | 0.54 (±0.02) | 0.67 (±0.04) | 1.28 (±0.12) | 1.84 (±0.01) | 2.20 (±0.09) |
| PsbA (nmol/seedling) | Immuno-detection | 6.9E-06 (±1.8E-06) | 9.2E-06 (±1.7E-06) | 1.5E-05 (±0.07E-05) | 3.2E-05 (±0.4E-05) | 9.3E-05 (±2E-05) | 2.0E-04 (±0.6E-04) | 3.9E-04 (±0.4E-04) | 6.2E-04 (±1.7E-04) |
| PsaC (nmol/seedling) | Immuno-detection | 1.6E-05 (±0.2 E-05) | 7.3E-05 (±2E-05) | 1.1E-04 (±0.7E-04) | 1.7E-04 (±0.4E-04) | 2.3E-04 (±1E-04) | |||
| PetC (nmol /seedling) | Immuno-detection | 2.7E-05 (±0.8E-05) | 2.8E-05 (±1E-05) | 2.5E-05 (±0.4E-05) | 5.3E-05 (±2.2E-05) | 1.2E-04 (±0.4E-04) | 1.8E-04 (±0.E-04) | 5.7E-04 (±1.8E-04) | 7.9E-04 (±3.7E-04) |
Table 2
Surface area occupied by the main galactolipids (MGDG and DGDG) and photosynthetic complexes (PSII, cyt b6f, and PSI).
Shown are values at different time points following illumination of 3-day-old etiolated seedlings. Each value indicates the calculated surface area in µm2 and corresponds to the average of three biological replicates. Errors indicate SD.
| T0 | T4 | T8 | T12 | T24 | T48 | T72 | T96 | |
|---|---|---|---|---|---|---|---|---|
| MGDG | 1.11E+07 (±0.03E+07) | 1.15E+07 (±0.1E+07) | 1.11E+07 (±0.1E+07) | 1.75E+07 (±0.18E+07) | 4.16E+07 (±0.4E+07) | 8.65E+07 (±0.6E+07) | 1.68E+08 (±0.09E+08) | 2.35E+08 (±0.2E+07) |
| DGDG | 3.64E+06 (±0.4E+06) | 4.23E+06 (±0.5E+06) | 4.10E+06 (±0.1E+06) | 6.26E+06 (±0.5E+05) | 1.32E+07 (±0.1 07) | 2.32E+07 (±0.2 E+07) | 3.97E+07 (±0.3E+07) | 5.48E+07 (±0.41E+07) |
| PSII | 2.04E+06 (±0.5 E+05) | 2.74E+06 (±0.5E+05) | 4.40E+06 (±0.2E+06) | 9.91E+06 (±1.3E+06) | 2.75E+07 (±0.6E+07) | 6.06E+07 (±0.2E+07) | 1.15E+08 (±0.2E+08) | 1.83E+08 (±0.5E+08) |
| PSI | 0E+00 (±0E+00) | 0E+00 (±0E+00) | 0E+00 (±0E+00) | 8.95E+05 (±4.49E+05) | 1.33E+07 (±0.4E+07) | 2.10E+07 (±1.30E+07) | 3.04E+07 (±0.8E+07) | 4.24E+07 (±1.89E+07) |
| Cyt b6f | 7.99E+05 (±2.33E+05) | 8.43E+05 (±2.91E+05) | 7.5E+05 (±1.33E+05) | 1.57E+06 (±0.7E+06) | 3.44E+06 (±1.22E+06) | 5.30E+06 (±1.01E+06) | 1.69E+07 (±0.5E+06) | 2.37E+07 (±1.11E+07) |
-
Table 2—source data 1
Quantitative data of surface occupied by galactolipids and proteins.
- https://cdn.elifesciences.org/articles/62709/elife-62709-table2-data1-v1.xlsx
Table 3
Surface area occupied by galactolipid and photosynthetic complexes.
Values were retrieved from the corresponding references. MGDG and DGDG surfaces correspond to the minimal molecular area. The surfaces of PSII-LHCII, PSI, and Cyt b6f complexes correspond to the surface exposed to the stroma (19*26 nm, 20*15 nm, and 90*55 Å, respectively).
| Surface in nm2 | reference | |
|---|---|---|
| MGDG | 0.82 | Bottier et al., 2007 |
| DGDG | 0.64 | Bottier et al., 2007 |
| PSII - LHCII (C2 S2 M2) | 494 | Caffarri et al., 2014 |
| Cyt b6f | 49.5 | Kurisu et al., 2003 |
| PSI | 300 | Caffarri et al., 2014 |
Additional files
Download links
A two-part list of links to download the article, or parts of the article, in various formats.
Downloads (link to download the article as PDF)
Open citations (links to open the citations from this article in various online reference manager services)
Cite this article (links to download the citations from this article in formats compatible with various reference manager tools)
A multifaceted analysis reveals two distinct phases of chloroplast biogenesis during de-etiolation in Arabidopsis
eLife 10:e62709.
https://doi.org/10.7554/eLife.62709


