Identical sequences found in distant genomes reveal frequent horizontal transfer across the bacterial domain
- Theoretical Biology and Bioinformatics, Biology Department, Utrecht University, Netherlands
- Division of Molecular Carcinogenesis, the Netherlands Cancer Institute, Netherlands
- Max Planck Institute for Molecular Genetics, Germany
- Berlin Institute for Medical Systems Biology, Max Delbrück Center, Germany
- Université de Lyon, Université Lyon 1, CNRS, Laboratoire de Biométrie et Biologie Evolutive UMR 5558, France
Figures
Figure 1 with 4 supplements
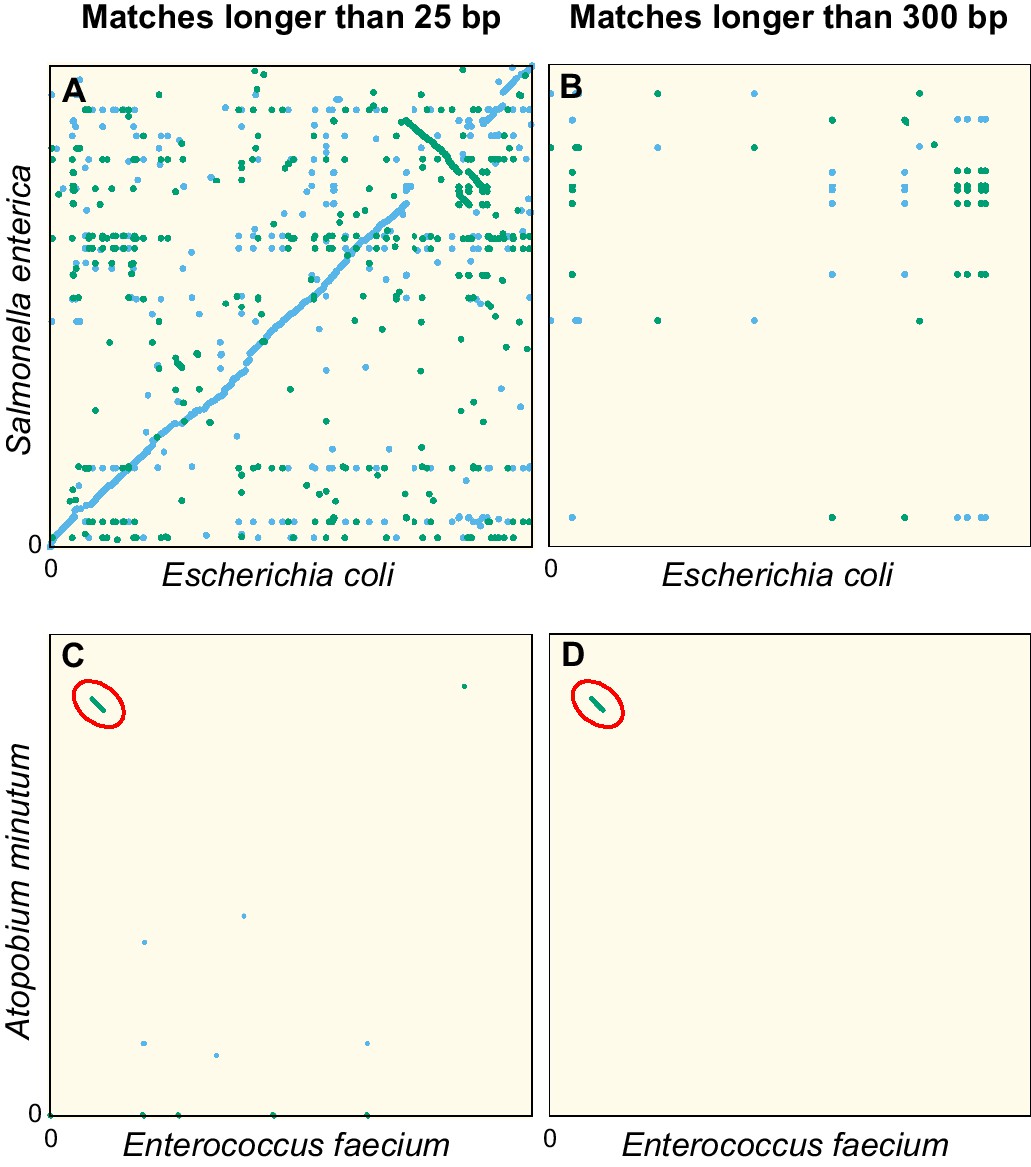
Dot plots of the exact sequence matches found in pairs of distant bacteria.
On panels (A and B) resp. (C and D), each dot/line on the grid represents an exact match at locus of the genome of Escherichia coli (resp. Enterococcus faecium) and locus of the genome of Salmonella enterica (resp. Atopobium minutum). Blue dots/lines indicate matches between the forward strands of the two species, and green dots/lines those between the forward strand of E. coli (resp. E. faecium) and the reverse complement strand of S. enterica (resp. A. minutum). (A–B) Full genomes of E. coli K-12 substr. MG1655 (U00096.3) and S. enterica (NC_003198.1), which both belong to the family of Enterobacteriaceae. Panel A shows all matches longer than 25 bp. The sequence similarity and synteny of both genomes, by descent, is evident from the diagonal blue line. Panel B only shows matches longer than 300 bp. (C–D) Same as panels (A-B), but for the first 1.4 Mbp of E. faecium (NZ_CP013009.1) and A. minutum (NZ_KB822533.1), which belong to different phyla, showing few matches longer than 25 bp (panel C). Yet, a single match of 19,117 bp is found, as indicated with red ellipses in panels (C-D). The most parsimonious explanation for this long match is an event of horizontal gene transfer.
Figure 1—figure supplement 1
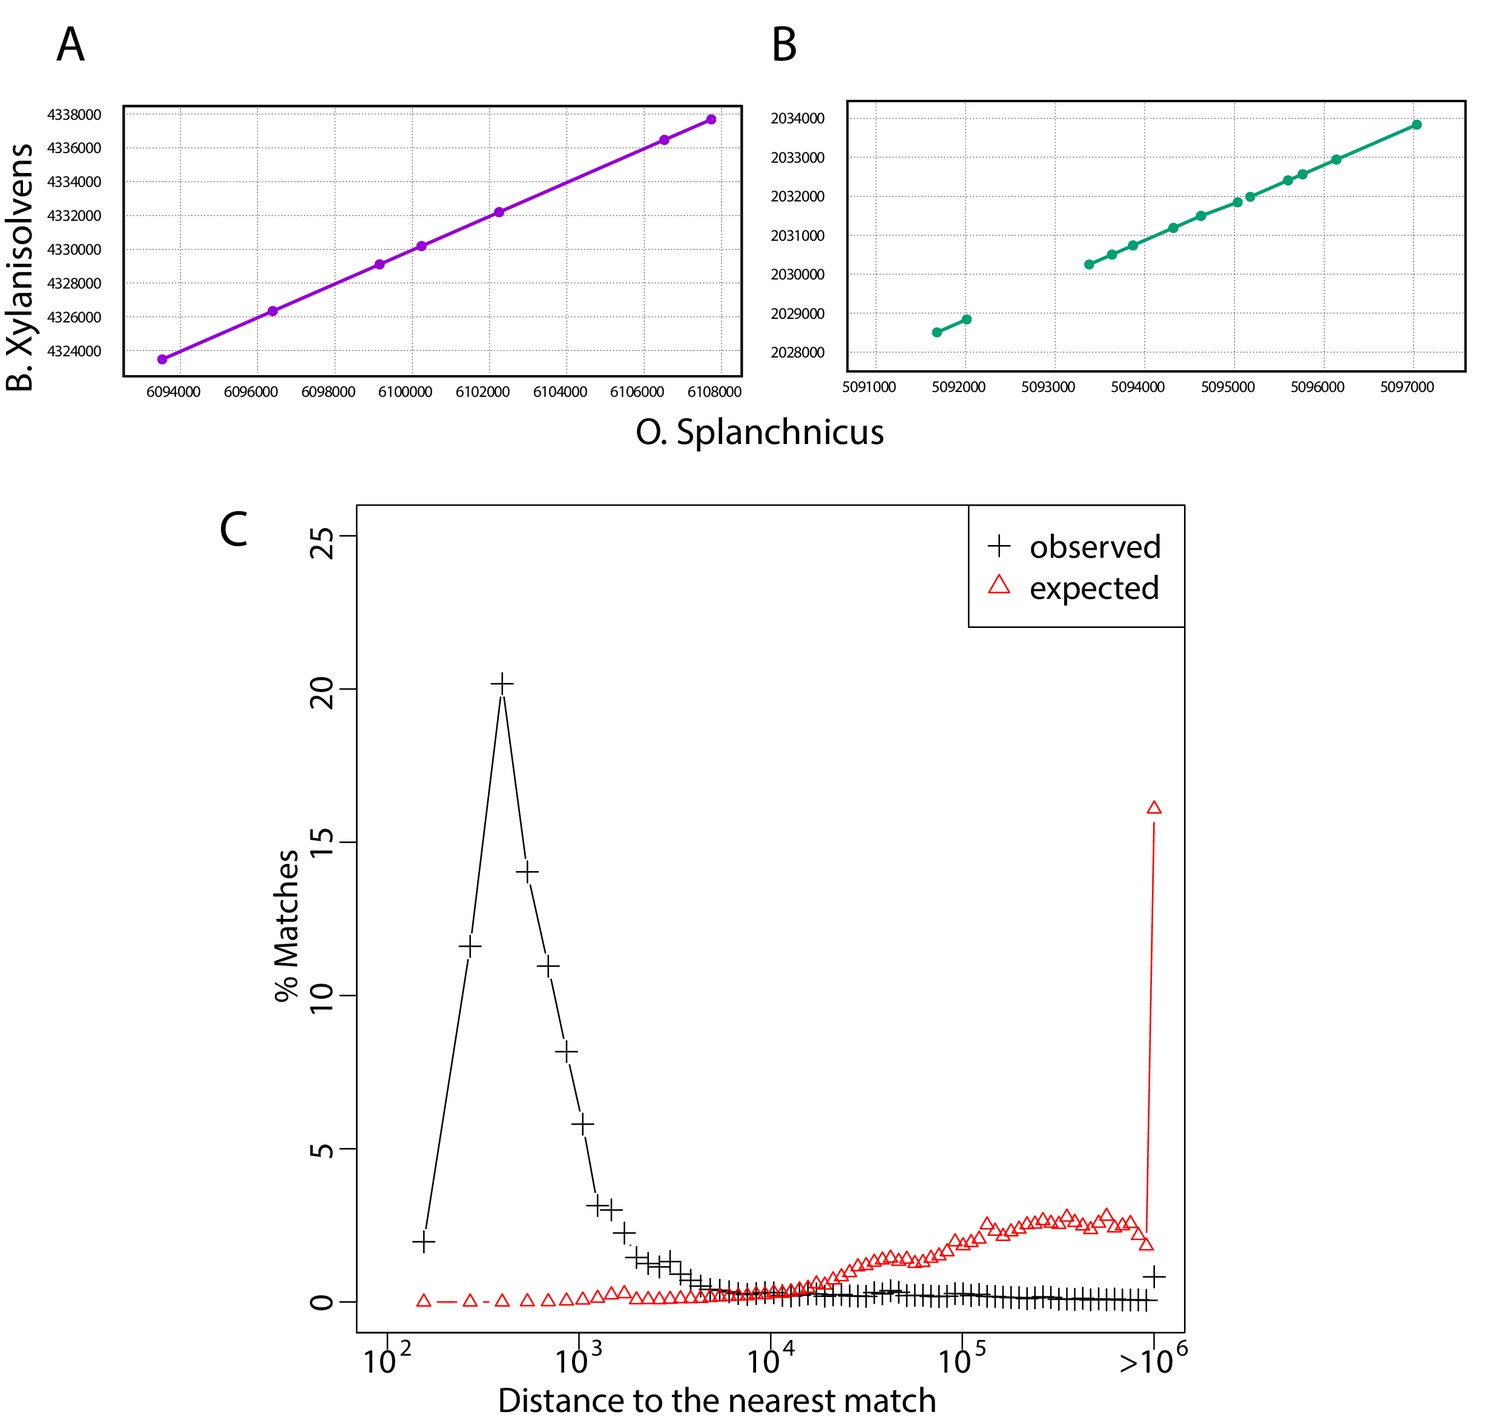
Long exact matches cluster in bacterial genomes.
(A-B) Dot plots resulting from the comparison of two regions of Bacteroides xylanisolvens (strain_H207) and Odoribacter splanchnicus (DSM_20712). Lines represent exact matches longer than 200 bp and large dots represent the end of such exact matches, to highlight short mismatches in between long exact matches. (C) Histogram of the distance to the nearest match for each match of the curated dataset. For each comparison with at least two exact matches >300 bp, we compute, in each species for each match, its distance to the nearest match found in the same pairwise comparison. Black plus signs present the distribution of distances to the nearest match. If matches were uniformly distributed over genomes, the distance between a match and its nearest counterpart in the comparison of species and should be of the order of , where is the length of genome of species and the number of exact matches between species and . Red plus signs present the distribution of for all comparisons with at least two matches. The large difference between the two distributions shows that matches are not uniformly distributed over genomes. See Restricted dataset for a description of the restricted dataset.
Figure 1—figure supplement 2
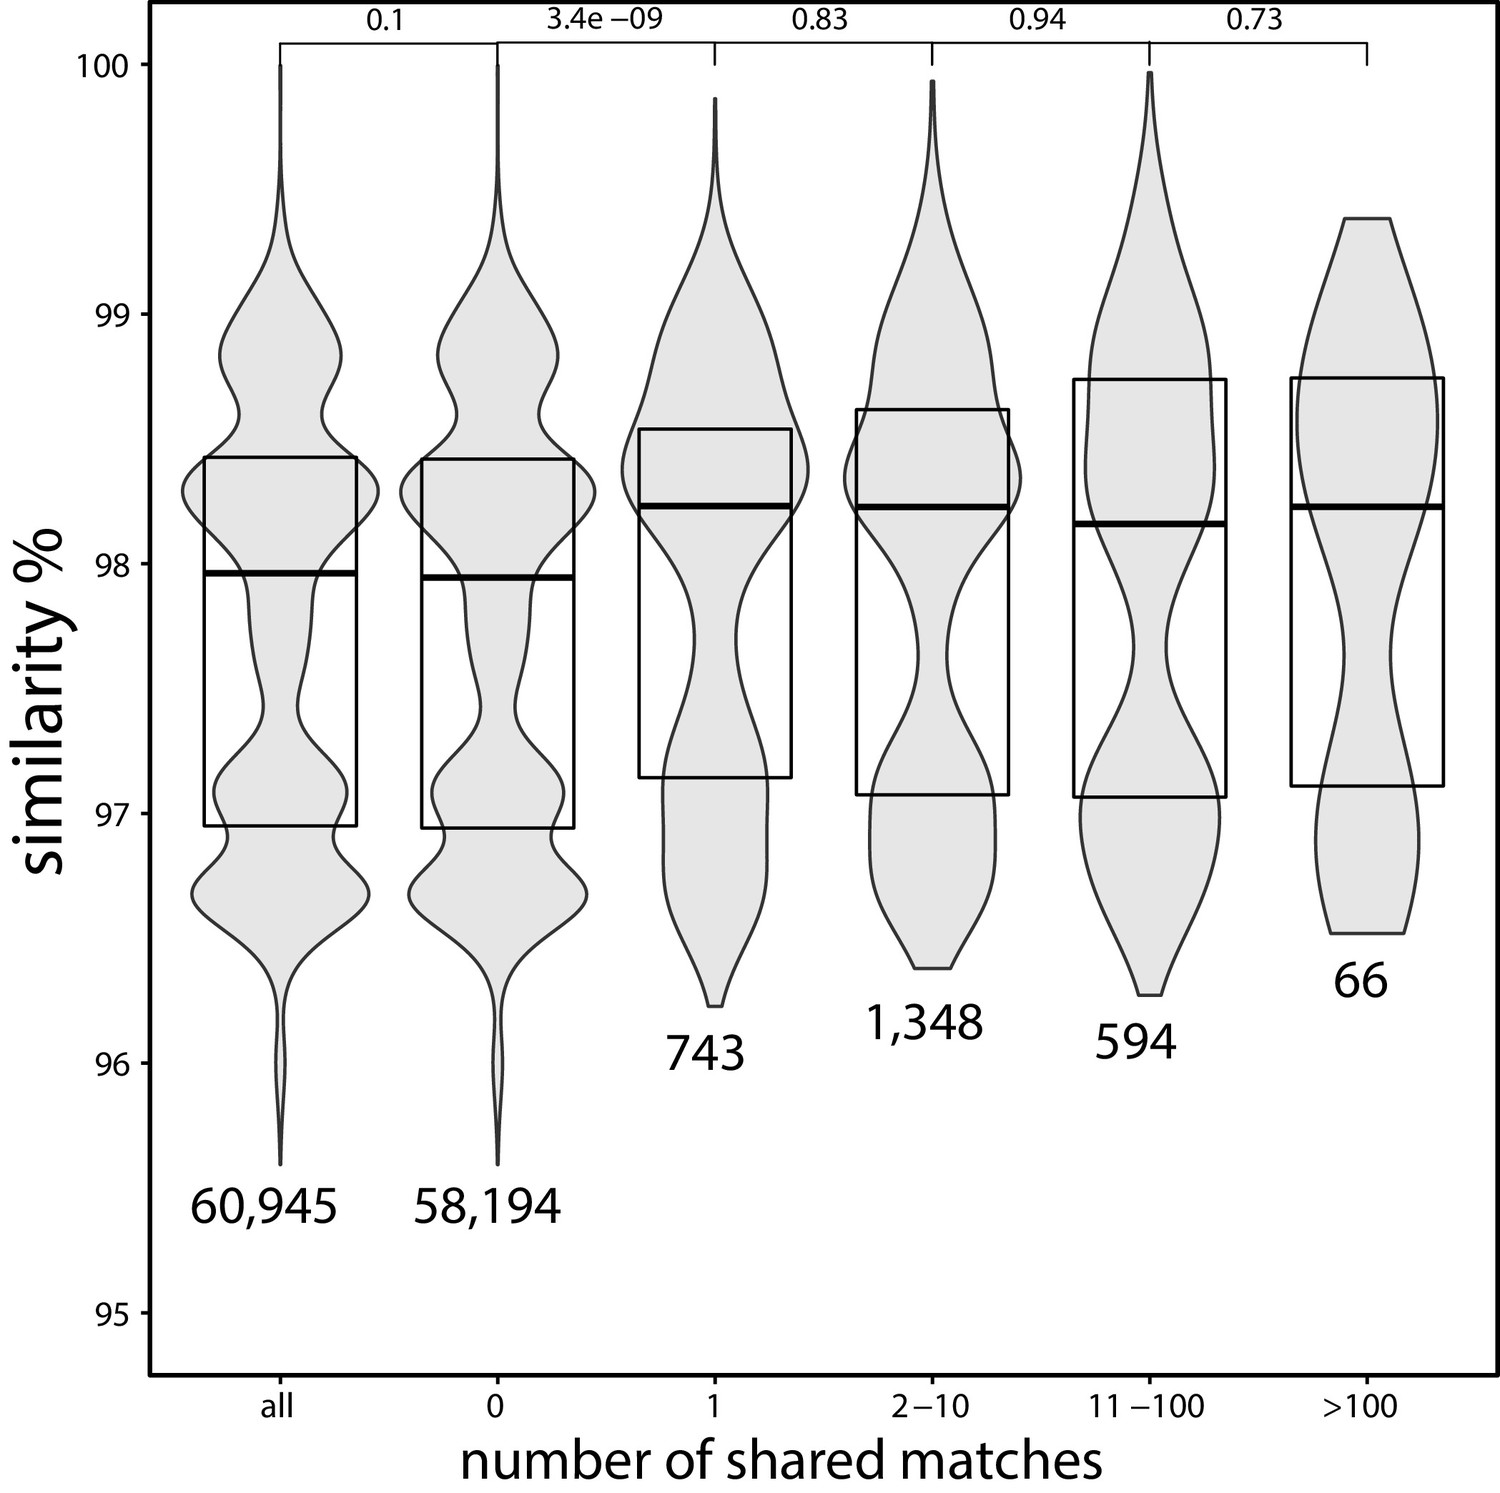
Average nucleotide identity (ANI) between strains of Escherichia coli which share a certain number of exact matches to a different family.
ANI (obtained from Rodriguez-R et al., 2018) between strains of E. coli which share a certain number (horizontal axis) of exact matches to a different family, based on the matches found in the curated set (strains without matches to genomes in a different family are filtered out in this analysis). The p-values on the top are obtained using the Wilcoxon rank-sum test. The numbers below the distributions indicate the total number of pairs with the corresponding number of shared matches. This figure suggests that strains which share matches to distant species tend to be more similar genetically.
Figure 1—figure supplement 3
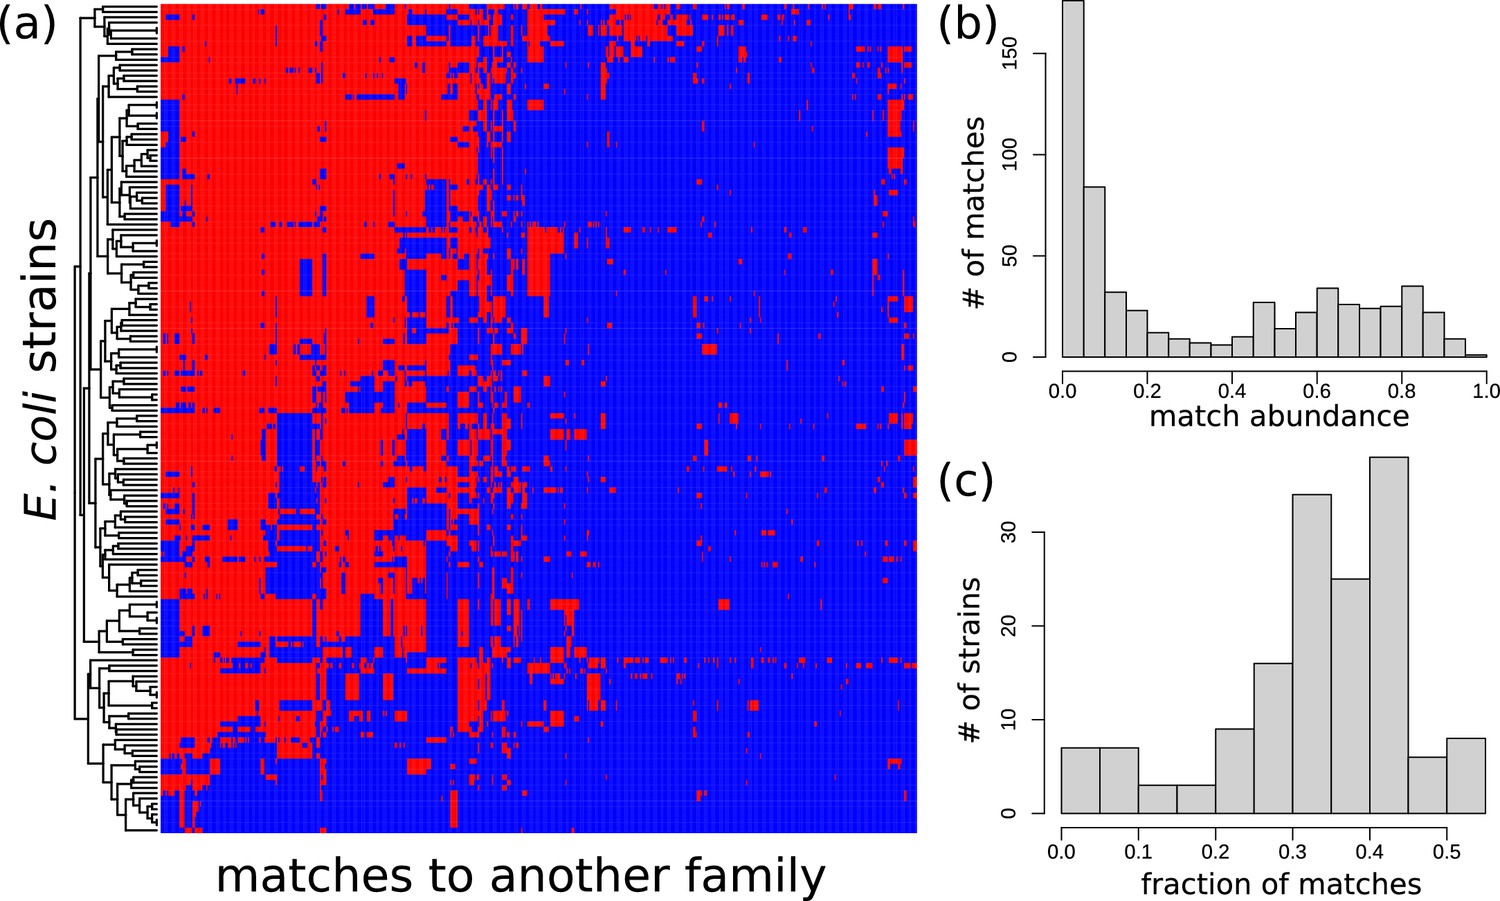
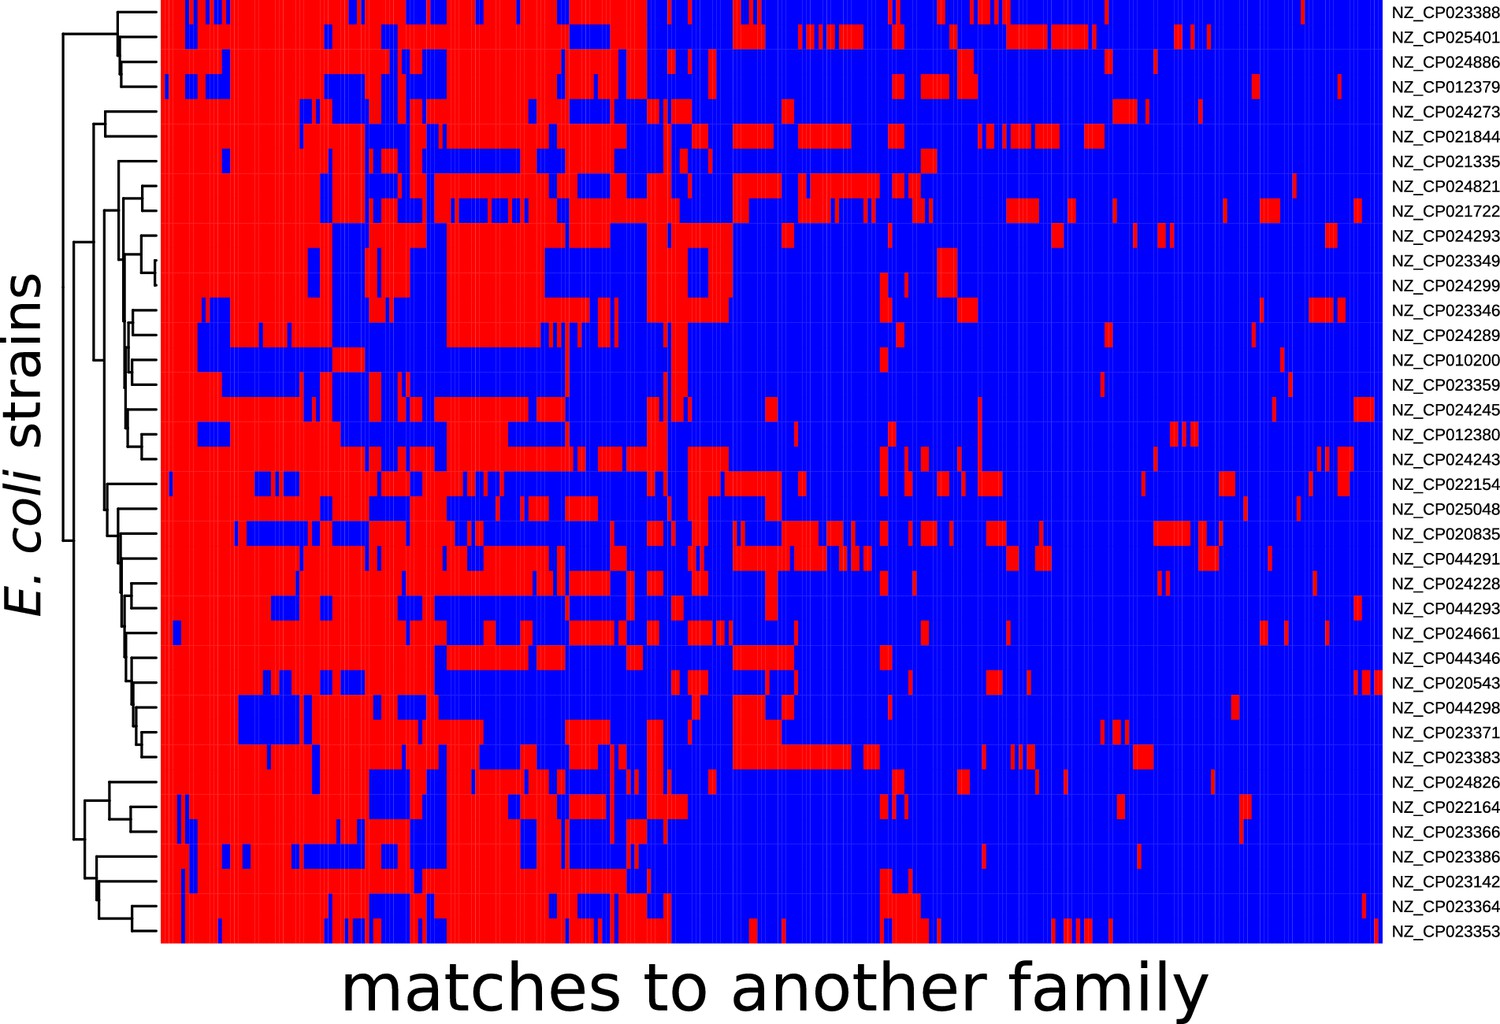
Distribution of exact matches between Escherichia coli strains and bacteria from a different family.
Distribution of exact matches between E. coli strains and bacteria from a different family. (See Section Appendix 1 Phylogenetic analysis among HGT event in E. coli.) (a) For all long matches between E. coli and genomes from a different family found in the curated dataset, we determined whether a blastn hit with -value is present in 156 strains of E. coli. The heatmap visualises the results: blue represents absence, red represents presence. blastn found 32,446 hits, but only 598 matches with a unique presence/absence pattern are displayed in this figure (i.e., filtered matches have exactly the same presence/absence pattern in the strains as one of the matches in the figure). Rows (strains) and columns (matches) were hierarchically clustered. (b) For the set of matches of panel (a), this panel presents a histogram of the proportion of E. coli strains that possess these matches. A bimodal distribution is apparent. (c) For the set of E. coli strains of panel (a), this panel shows a histogram of the fraction of the matches that they posses.
Figure 1—figure supplement 4
Distribution of exact matches between Escherichia coli strains and bacteria from a different family.
Distribution of exact matches between E. coli strains and bacteria from a different family. The same as Figure 1—figure supplement 3, but for 35 E. coli strains with average nucleotide identity (ANI) distances taken from Rodriguez-R et al., 2018. The dendrogram represents the UPMGA tree based on the ANI distances.
Figure 2 with 2 supplements
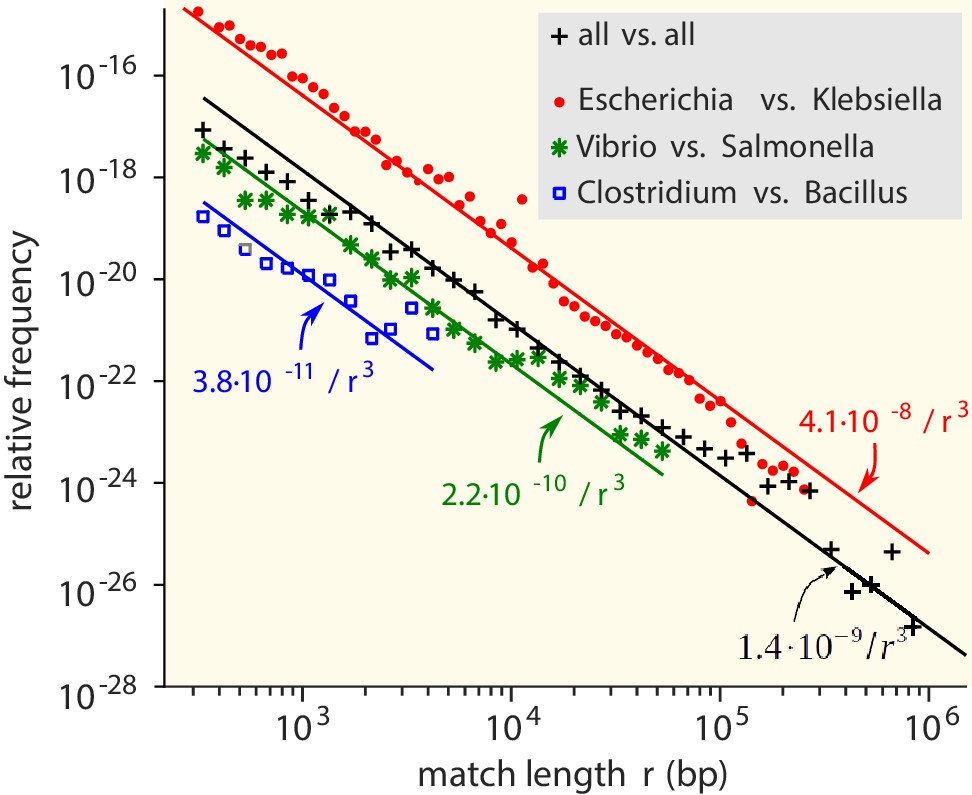
Match-length distributions (MLDs) obtained by identifying exact sequence matches in pairs of genomes from different genera, based on matches between Escherichia and Klebsiella (red dots), Vibrio and Salmonella (green stars), and Clostridium and Bacillus (blue squares).
Black plus signs represent the MLD obtained by combining the MLDs for all pairs of genera. Each MLD is normalised to account for differences in the number of available genomes in each genus (see Empirical calculation of the MLD for pairs of genera and sets of genera in Materials and methods). Only the tails of the distributions (length ) are shown. Solid lines are fits of power laws with exponent −3 (Equation (1)) with just a single free parameter.
-
Figure 2—source data 1
MLD obtained by combining the MLDs for all pairs of genera.
- https://cdn.elifesciences.org/articles/62719/elife-62719-fig2-data1-v2.txt
-
Figure 2—source data 2
MLD based on matches between Clostridium and Bacillus.
- https://cdn.elifesciences.org/articles/62719/elife-62719-fig2-data2-v2.txt
-
Figure 2—source data 3
MLD based on matches between Vibrio and Salmonella.
- https://cdn.elifesciences.org/articles/62719/elife-62719-fig2-data3-v2.txt
-
Figure 2—source data 4
MLD based on matches between Escherichia and Klebsiella.
- https://cdn.elifesciences.org/articles/62719/elife-62719-fig2-data4-v2.txt
Figure 2—figure supplement 1
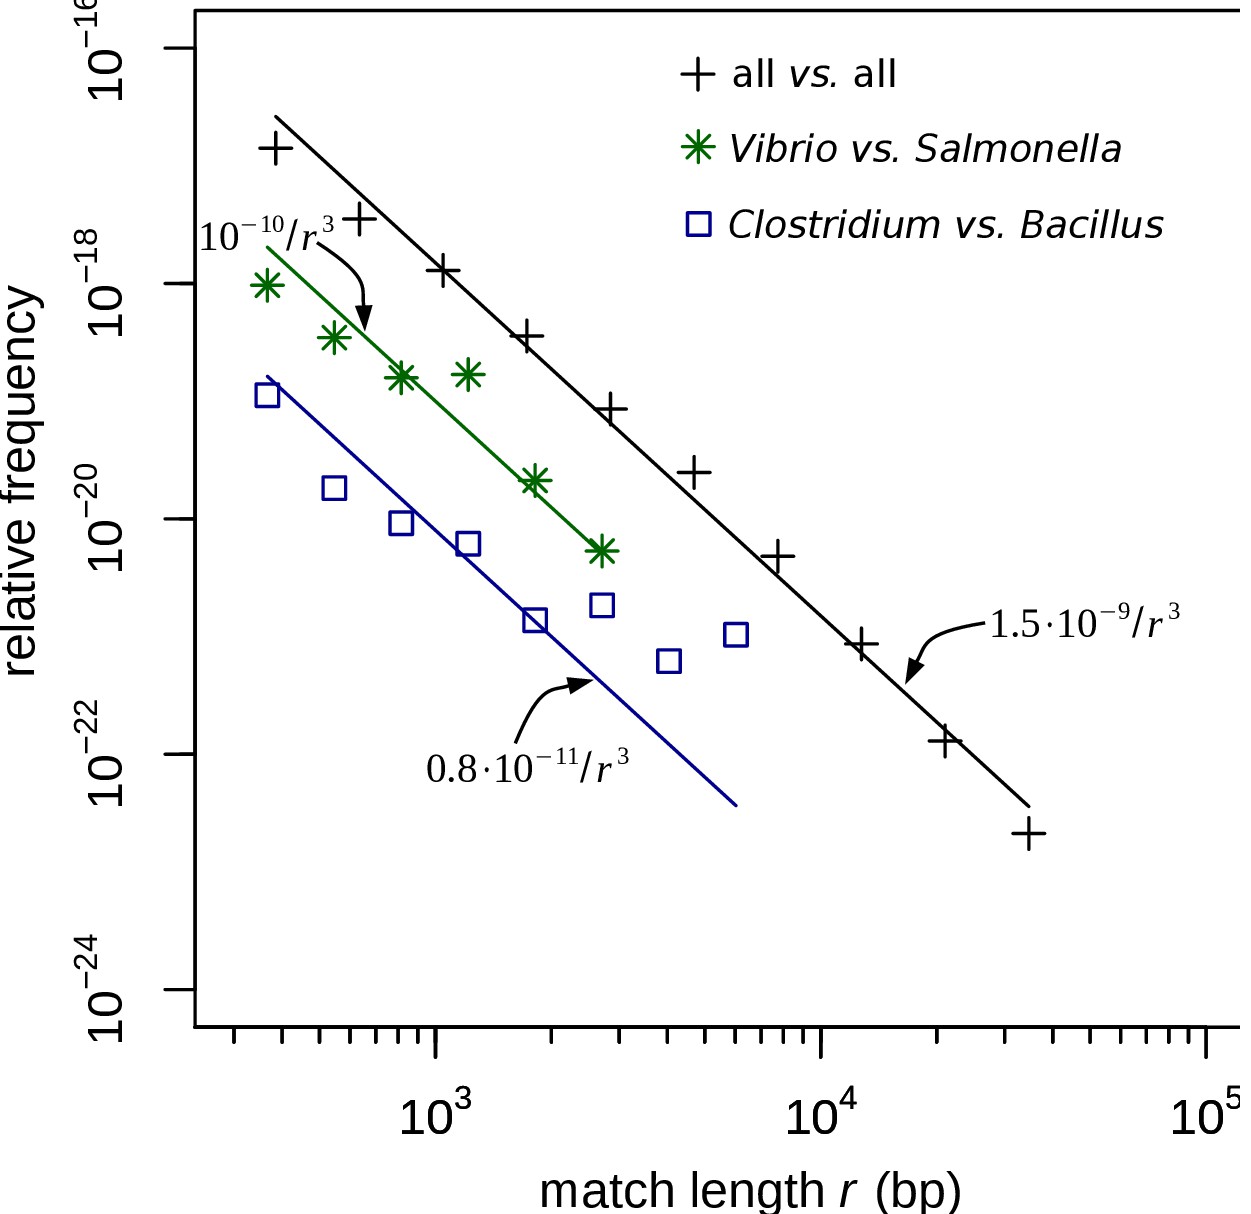
Match-length distributions (MLDs) obtained by identifying exact sequence matches in pairs of genomes from different genera in the curated set.
MLDs obtained by identifying exact sequence matches in pairs of genomes from different genera. In contrast to Figure 2, for this figure the restricted dataset was used, based on contigs larger than 106 bp that were manually curated, as described in Restricted dataset in Materials and methods. MLDs are shown based on matches between Vibrio and Salmonella (green stars), and Clostridium and Bacillus (blue squares). Black plus signs represent the MLD obtained by combining the MLDs for all pairs of genera from different families. (Remember that the restricted dataset only contains matches between contigs belonging to different families.) Each MLD is normalised to account for differences in the number of available genomes in each genus (see Empirical calculation of the MLD for pairs of genera and sets of genera in Materials and methods). Only the tails of the distributions (length ) are shown. Solid lines are fits of power laws with exponent −3 (Equation (1)) with just a single free parameter.
Figure 2—figure supplement 2

Match-length distributions (MLDs) computed for shorter matches.
MLDs obtained by identifying exact sequence matches in pairs of genomes from different species (see legend). Each MLD is normalised to account for differences in the number of available genomes in each genus (see Empirical calculation of the MLD for pairs of genera and sets of genera in Materials and methods). Here, shorter matches () are shown. Solid lines are fits of power laws with exponent −3 (Equation (1)) with just a single free parameter (see legend). For short matches ( bp), the MLDs deviate from the power law with exponent −3.
Box 1—figure 1
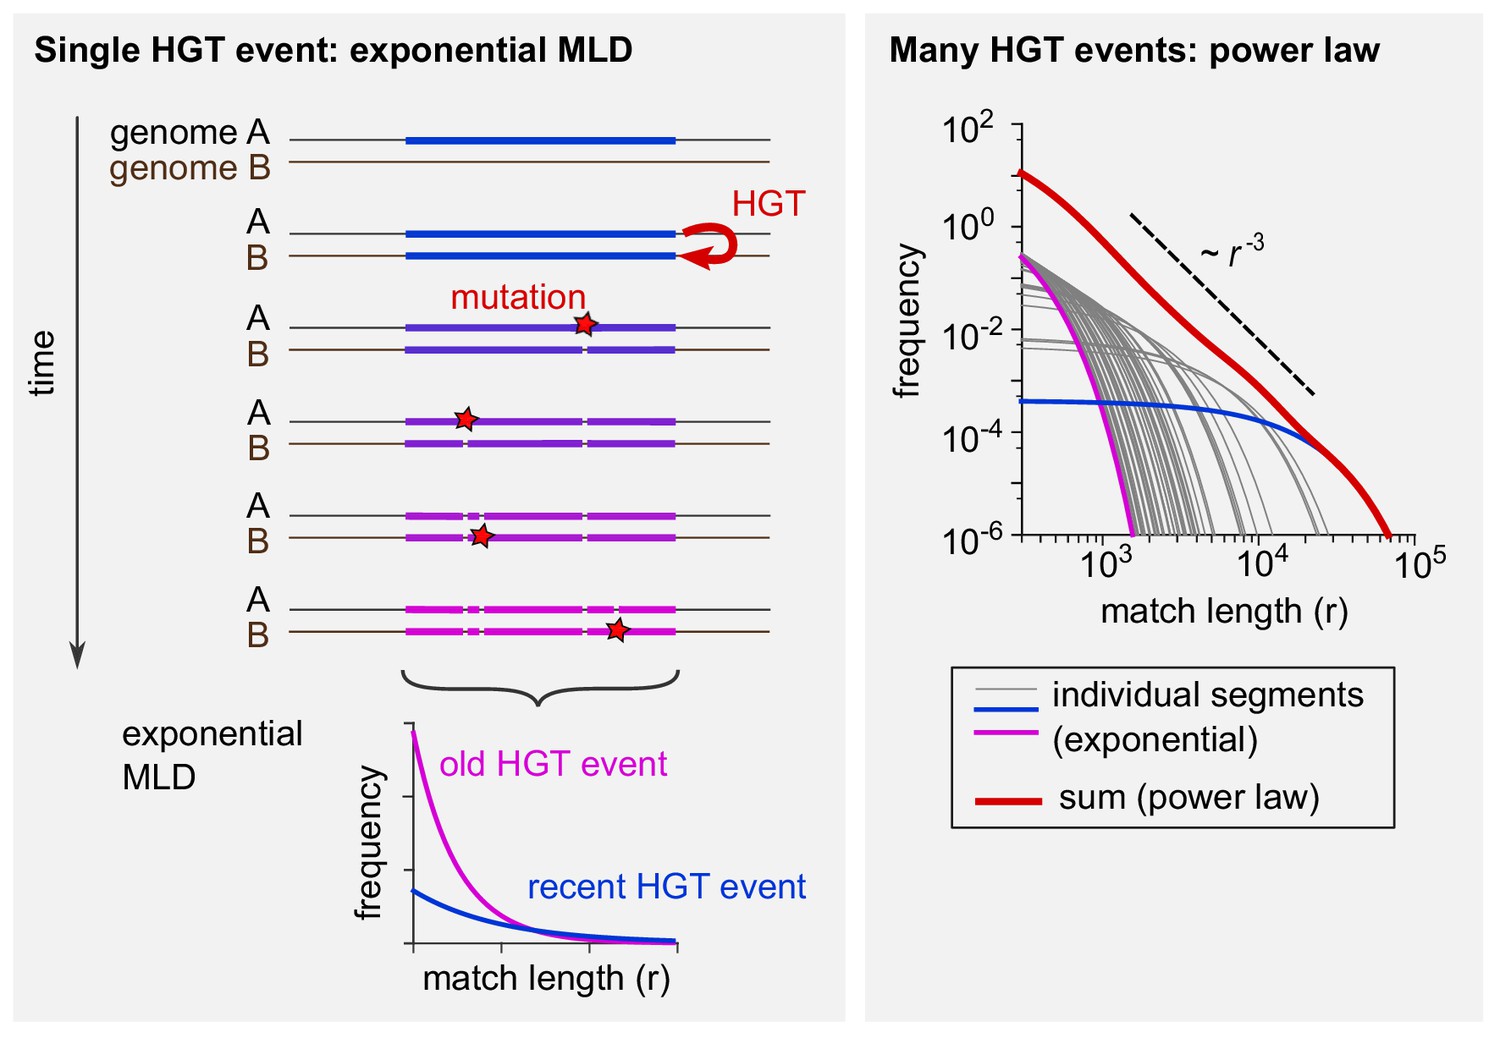
Schematic explanation of the mathematical model.
(Left) The evolutionary fate of a DNA segment following HGT. Initially, the event generates a single long exact match between genomes A and B. As time passes, mutations break this match into more and more pieces that are shorter and shorter. The MLD stemming from a single segment follows an exponential distribution with a mean decreasing with the age of the transfer, as represented at the bottom of the scheme. (Right) Exponential MLDs (log-log scale) for many segments originating from different HGT events (blue: very recent event, purple: older event). The red curve is the sum of all blue, purple and grey curves and follows a power law with exponent –3.
Figure 3 with 2 supplements
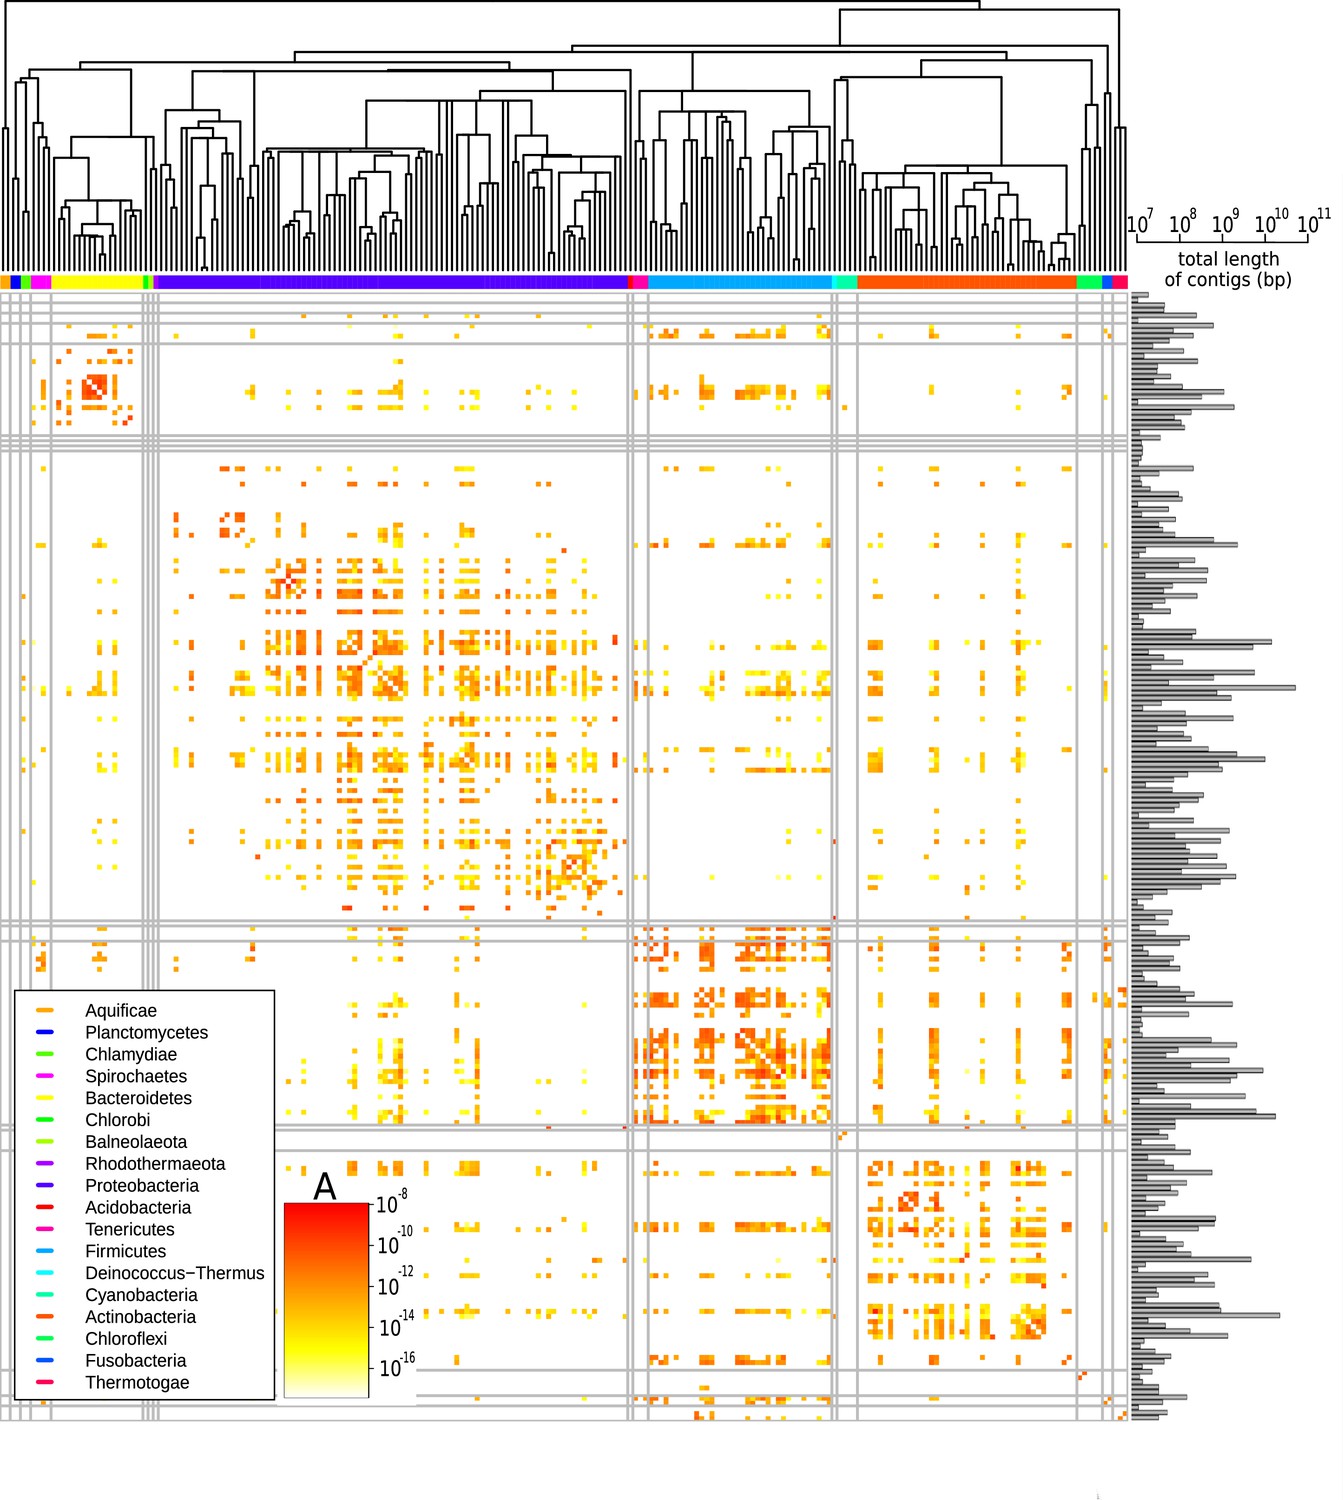
Effective pairwise horizontal gene transfer (HGT) rate at the family level.
For each pair of families, the prefactor is displayed (decimal logarithmic scale, see colourbar and Supplementary file 1). The values on the diagonal are set to zero. The phylogenetic tree of bacterial families, taken from Kumar et al., 2017, is shown at the top. Phyla are indicated with coloured bars next to the upper axes of the heatmap (see legend); grey vertical and horizontal lines represent borders between phyla. The barplot on the right-hand side of the heatmap shows the cumulative genome sizes of each family (decimal logarithmic scale).
Figure 3—figure supplement 1
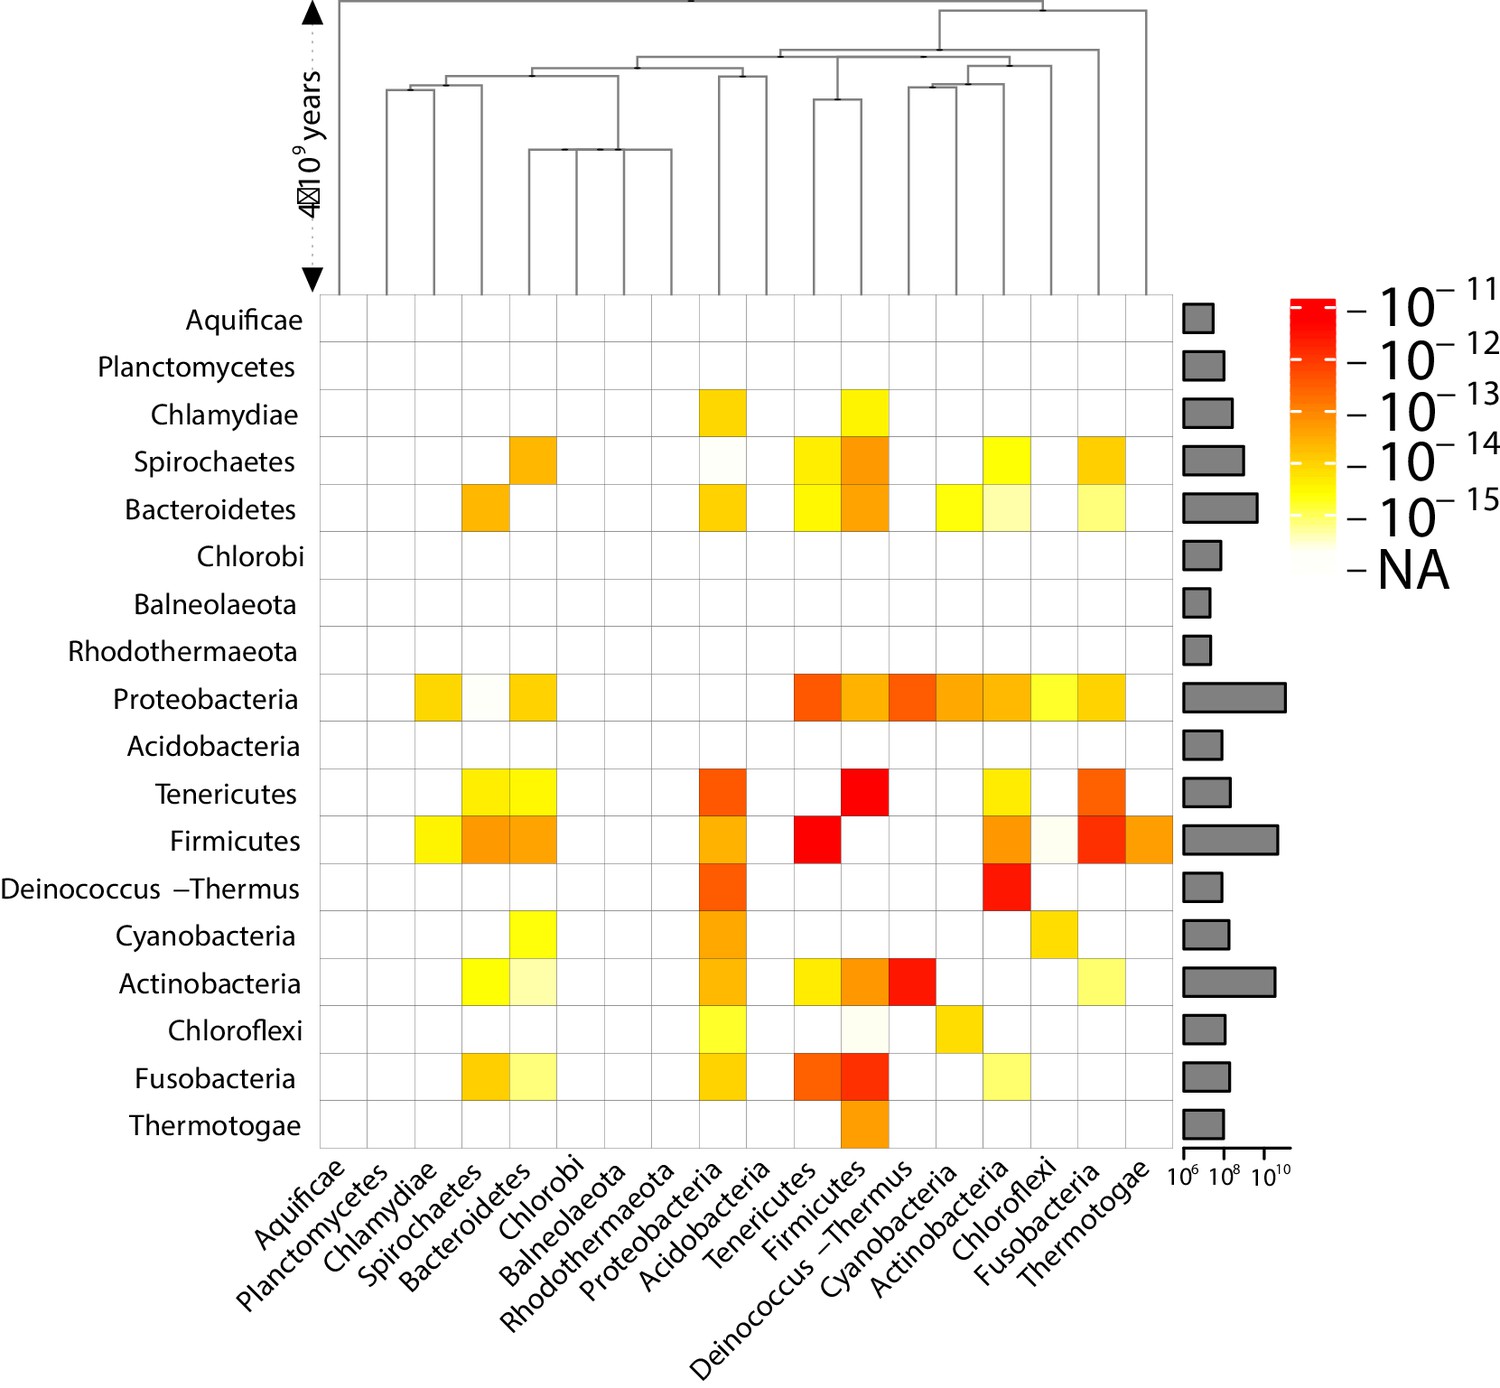
Effective pairwise horizontal gene transfer (HGT) rate at the phylum level (coarse-grained version of Figure 3).
For each pair of phyla, the prefactor is displayed (decimal logarithmic scale, see colourbar). On the diagonal, the values are set to NA. The barplot on the right-hand side of the heatmap shows the total length of the available contigs for each phylum (decimal logarithmic scale).
Figure 3—figure supplement 2
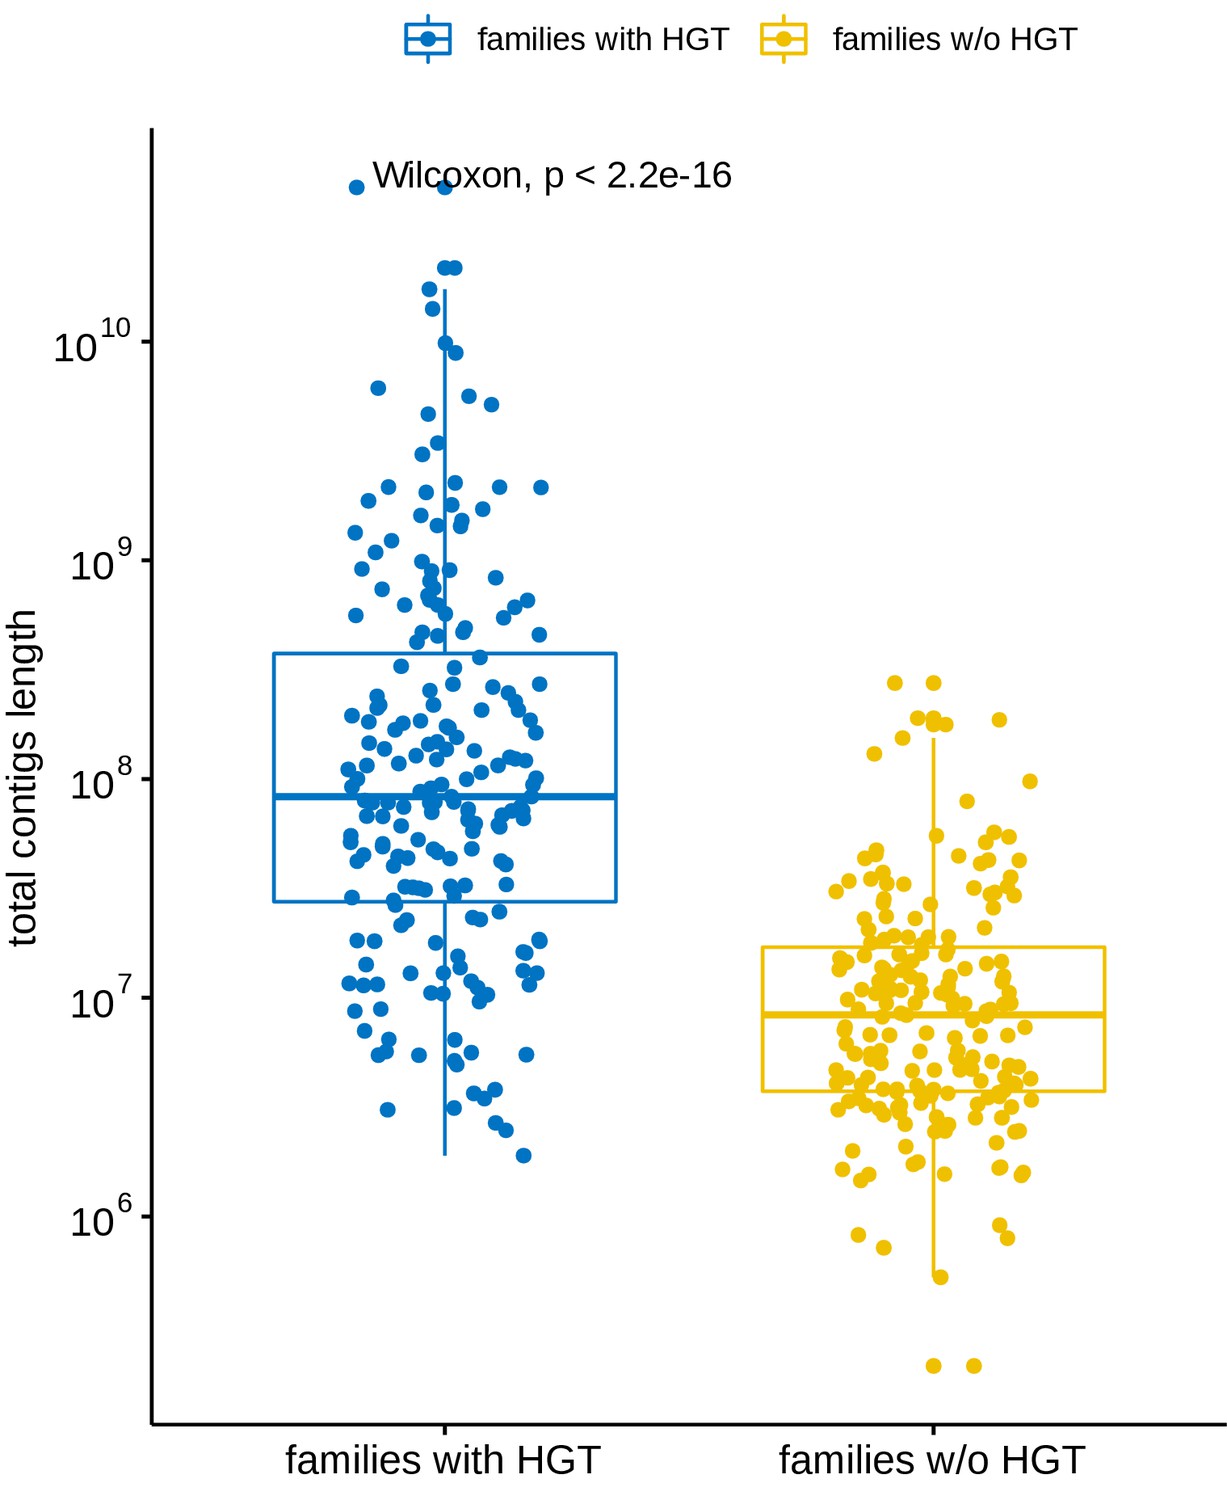
Total contig length distribution of families versus their involvement in long-distance horizontal gene transfer (HGT) events.
Blue: Families involved in at least one HGT event with another family. Yellow: Families not involved in any of the observed long-distance HGT event. The total contig length of a family is defined as the sum of the length of all the contigs belonging to that family.
Figure 4
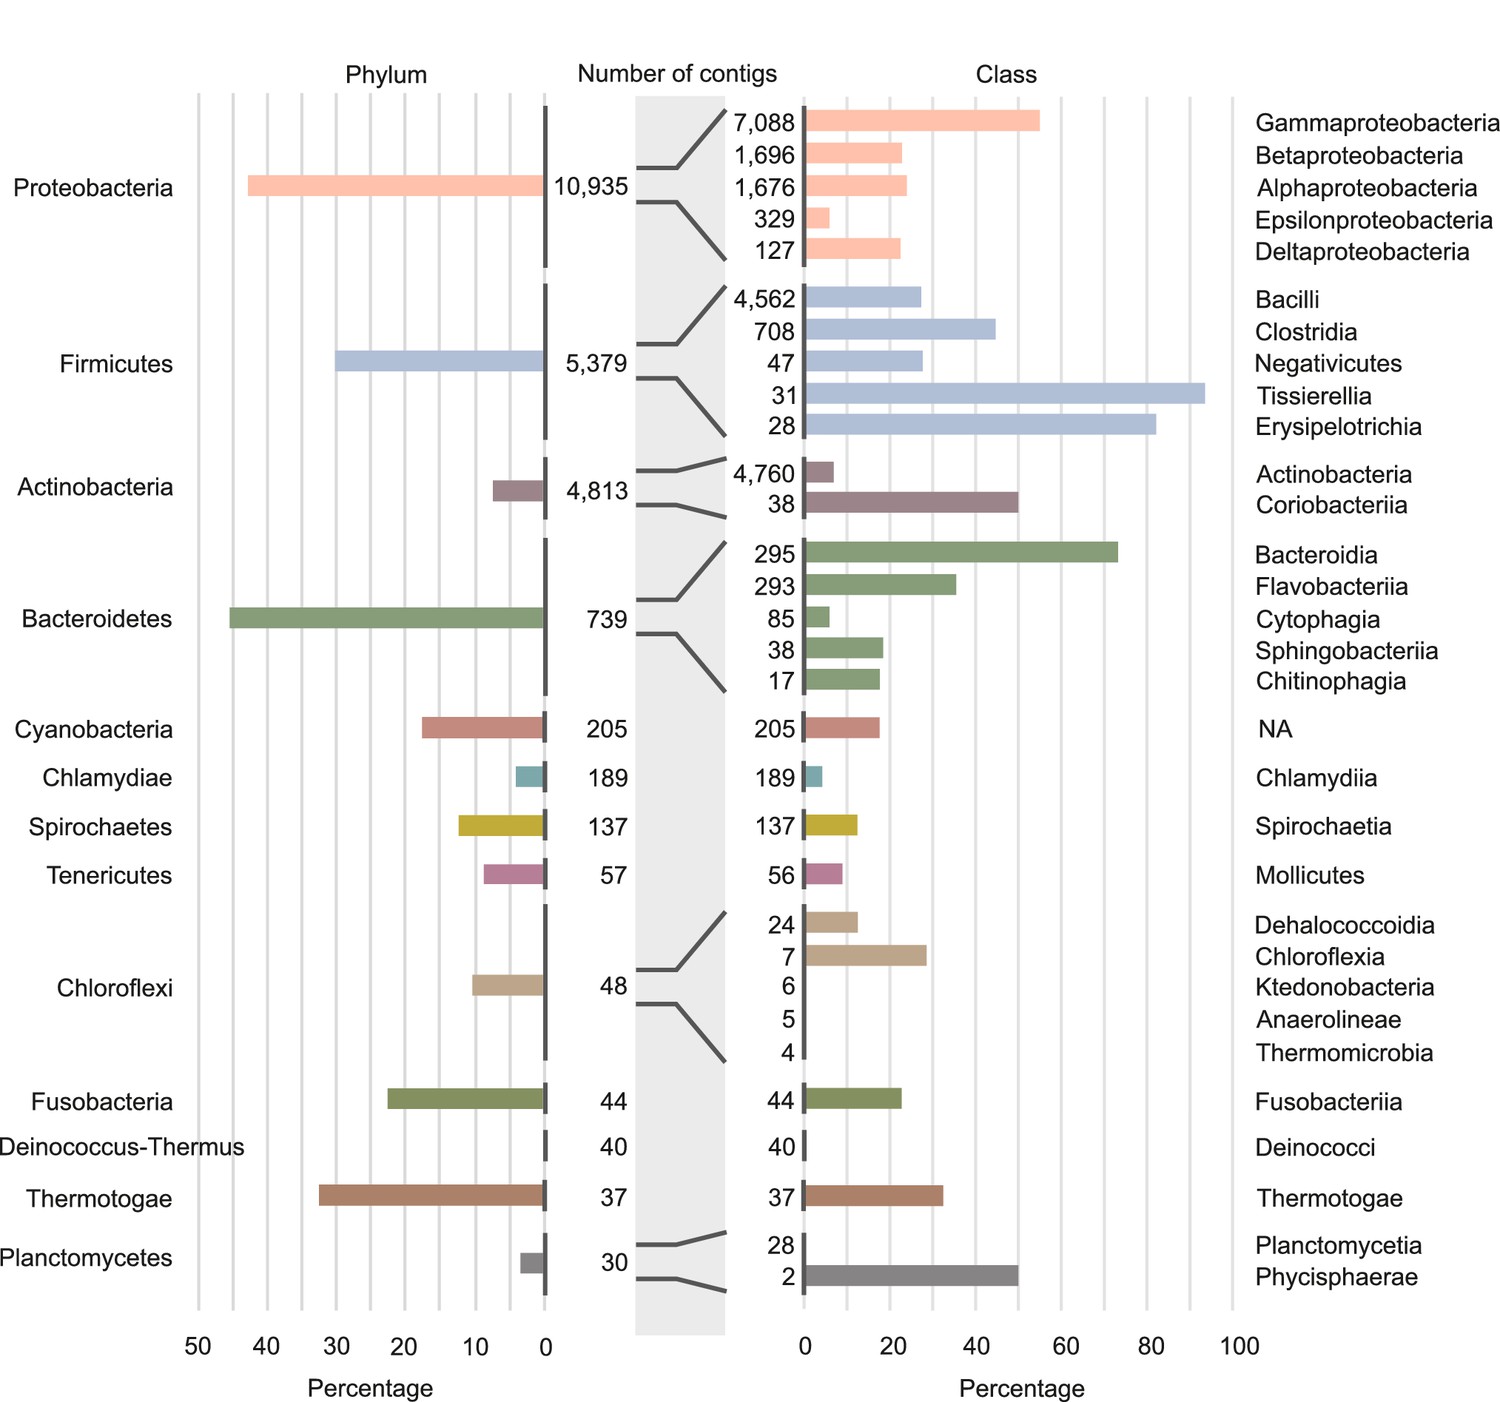
Involvement of different phyla and classes of bacteria in long-distance horizontal gene transfer (HGT).
Percentage of contigs involved in at least one of the observed long-distance HGT event grouped at phylum level (left panel) and at classes level (right panel). Note that only the classes with the largest numbers of contigs are shown (see Supplementary file 4 for all data). Numbers of contigs belonging to the phyla and classes are given in the middle part of figure.
Figure 5 with 4 supplements
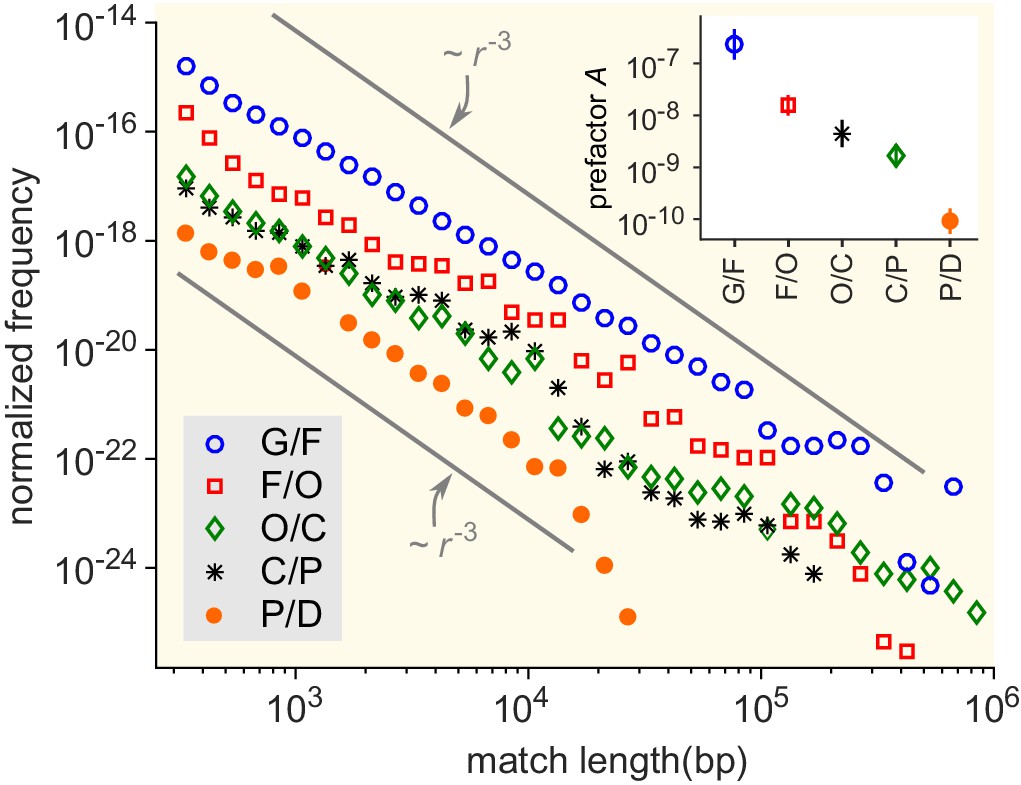
Match-length distributions (MLDs) resulting from comparison of genera at a given taxonomic distance.
Statistically, the prefactor obtained for a pair of genera decreases with the taxonomic distance between those genera. To demonstrate this, the figure shows averaged MLDs based on the MLDs of all pairs of genera at given taxonomic distances. G/F (blue circles): MLD obtained by averaging MLDs of pairs of genera that belong to the same family. F/O (red squares): MLD obtained by averaging MLDs of pairs of genera that belong to the same order, but to different families. O/C (green diamonds): Pairs of genera from the same class, but different orders. C/P (black stars): Same phylum, different classes. P/D (red circles): Same domain, different phyla. Grey lines indicate power laws , for comparison. Inset: Prefactor for each of the distributions in the main figure. The prefactor decreases by orders of magnitude as the taxonomic distance increases.
-
Figure 5—source data 1
Raw data corresponding to the inset of Figure 5: prefactor for each of the distributions in the main figure.
- https://cdn.elifesciences.org/articles/62719/elife-62719-fig5-data1-v2.txt
-
Figure 5—source data 2
MLD obtained by averaging MLDs of pairs of genera that belong to the same domain, but to different phyla (P/D).
- https://cdn.elifesciences.org/articles/62719/elife-62719-fig5-data2-v2.txt
-
Figure 5—source data 3
MLD obtained by averaging MLDs of pairs of genera that belong to the same phylum, but to different classes (P/C).
- https://cdn.elifesciences.org/articles/62719/elife-62719-fig5-data3-v2.txt
-
Figure 5—source data 4
MLD obtained by averaging MLDs of pairs of genera that belong to the same class, but to different orders (O/C).
- https://cdn.elifesciences.org/articles/62719/elife-62719-fig5-data4-v2.txt
-
Figure 5—source data 5
MLD obtained by averaging MLDs of pairs of genera that belong to the same order, but to different families (F/O).
- https://cdn.elifesciences.org/articles/62719/elife-62719-fig5-data5-v2.txt
-
Figure 5—source data 6
MLD obtained by averaging MLDs of pairs of genera that belong to the same family (G/F).
- https://cdn.elifesciences.org/articles/62719/elife-62719-fig5-data6-v2.txt
Figure 5—figure supplement 1
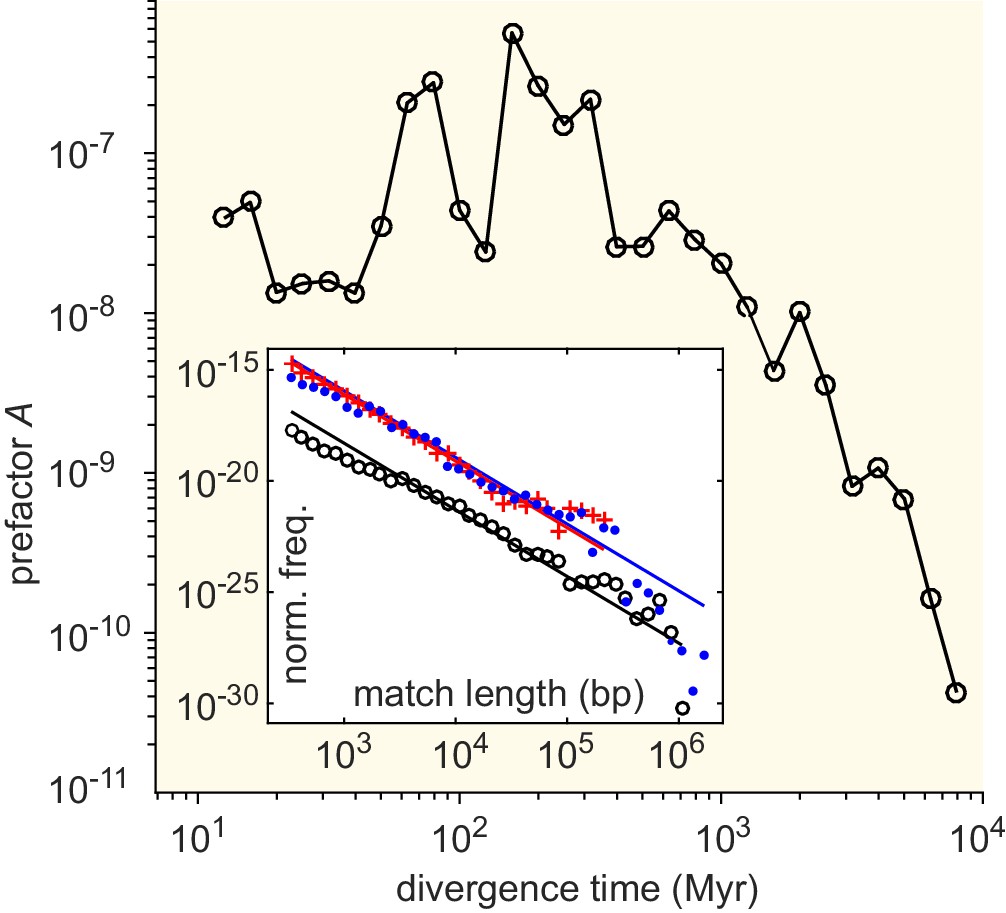
Effective horizontal gene transfer (HGT) rate as a function of the divergence time between genera.
Divergence times (in Myr) were obtained from Kumar et al., 2017. Main panel: The prefactor of the MLD resulting from the comparison of pairs of genera with a given divergence time (binned). Inset: MLD for divergence times in the intervals Myr (blue dots), Myr (red plus signs), and Myr (black circles). Lines represent dependence.
Figure 5—figure supplement 2
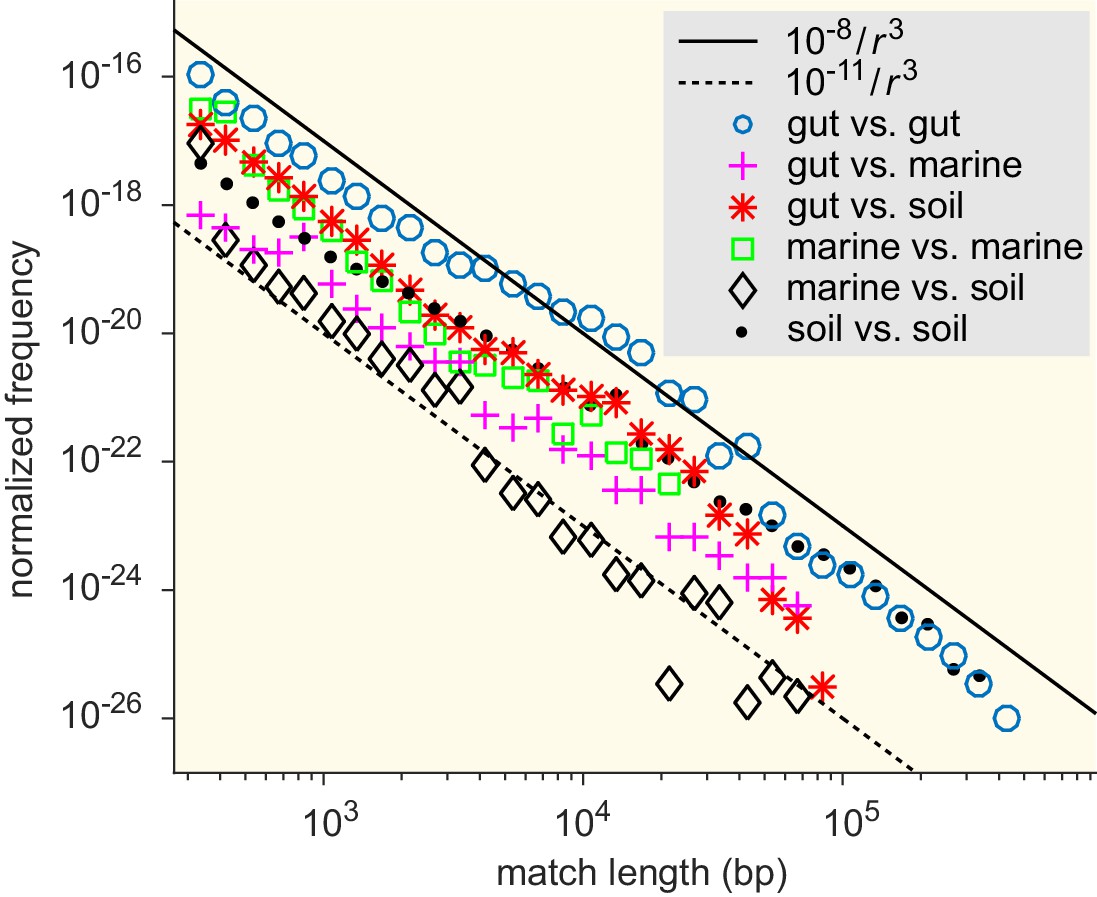
Match-length distributions (MLDs) resulting from comparison of sets of genera associated with different ecological environments: gut, soil, and marine (see Supplementary file 7 for detailed annotation).
Figure 5—figure supplement 3
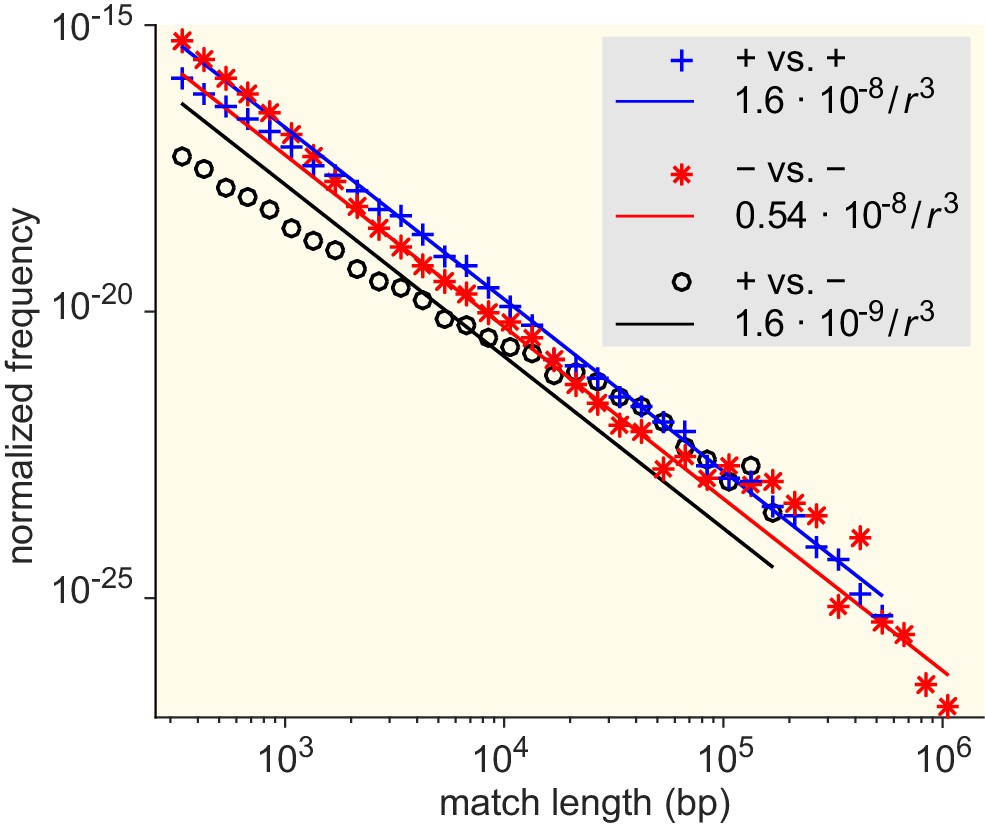
Match-length distributions (MLDs) resulting from comparison of sets of genera associated with different Gram staining test results (see Supplementary file 7 for detailed annotation).
Figure 5—figure supplement 4
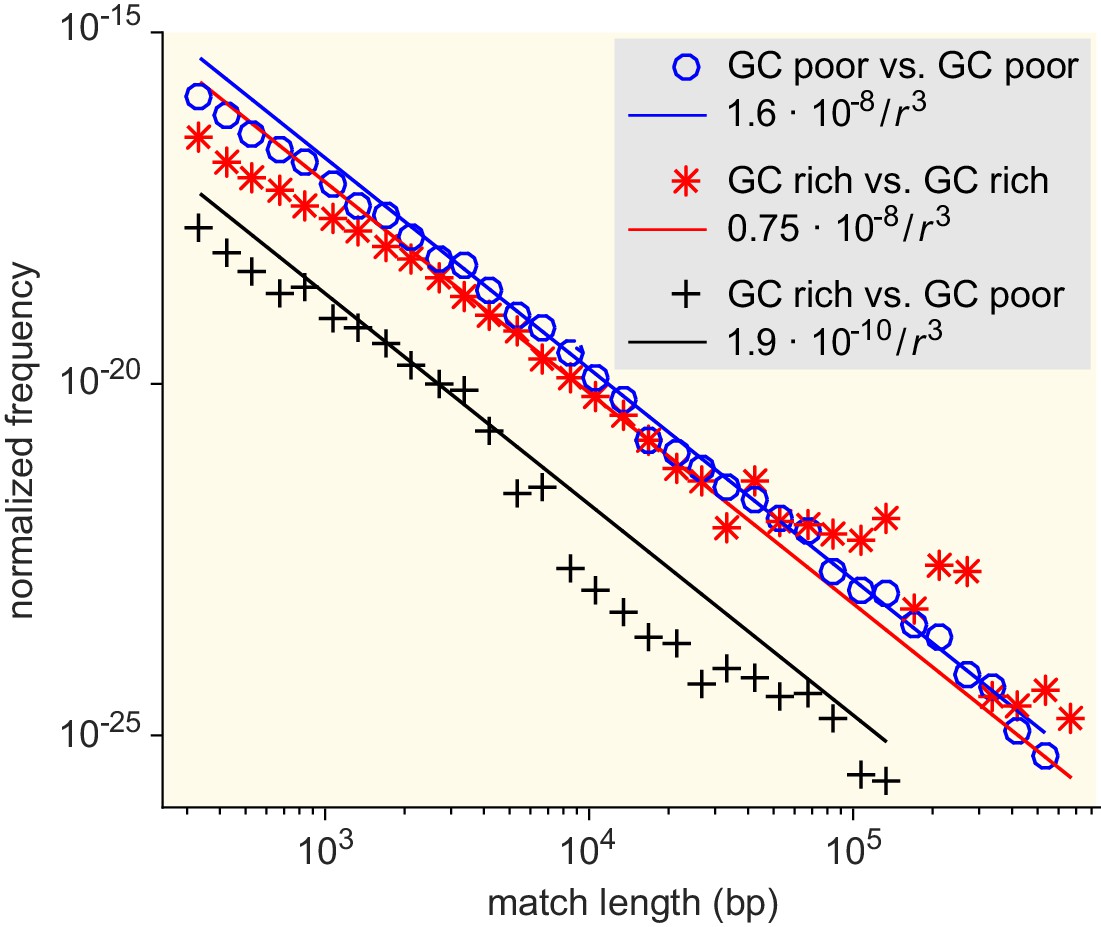
Match-length distributions (MLDs) resulting from comparison of sets of bacteria associated with different GC content (see Supplementary file 7 for detailed annotation).
Figure 6

Functional enrichment of the sequences involved in horizontal gene transfer (HGT) based on the analysis of 12 specialised databases.
Enrichments for each gene category (vertical axis) are computed relative to a control set obtained by sampling random sequences from the contigs that contained the matches (see Materials and methods). Enrichment for genes offering resistance against various types of antibiotics and biocides can be found in Supplementary file 5.
Author response image 1
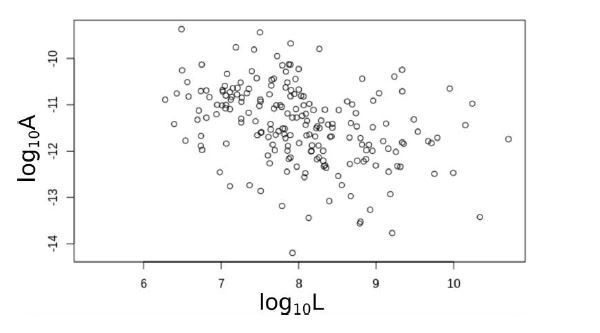
The prefactor A versus the (average) total genome length of pairs of families.
Tables
Appendix 1—table 1
Enrichment of different gene categories relative to the control set (see Gene enrichment analyses in Materials and methods).
| Database | Enrichment |
|---|---|
| Antimicrobial resistance, Zankari et al., 2012 | |
| Biocide and metal resistance, Pal et al., 2014 | |
| Restriction enzymes, Roberts et al., 2015 | |
| Transmembrane proteins, Kozma et al., 2013 | |
| Peptidases, Rawlings et al., 2012 | |
| Exotoxins, Chakraborty et al., 2012 | |
| Integrative, conjugative, Bi et al., 2012 | |
| Virulence factors, Chen et al., 2016 | |
| Essential genes, Luo et al., 2014 | |
| Small regulatory RNAs, Li et al., 2013 | |
| Toxin-antitoxin, Shao et al., 2011 | |
| Transport proteins, Saier et al., 2016 | |
| Channels/pores | |
| Electrochemical transporters | |
| Primary active transporters | |
| Group translocators | |
| Transmembrane electron carriers | |
| Accessory factors | |
| Incompletely characterised | |
| Enzymes, Placzek et al., 2017 | |
| Isomerases | |
| Hydrolases | |
| Ligases | |
| Oxidoreductases | |
| Transferases | |
| Lyases |
Additional files
-
Supplementary file 1
The estimate of the effective horizontal gene transfer (HGT) rate () for all pairs of families.
- https://cdn.elifesciences.org/articles/62719/elife-62719-supp1-v2.xlsx
-
Supplementary file 2
The estimate of the effective horizontal gene transfer (HGT) rate () for all pairs of genera.
- https://cdn.elifesciences.org/articles/62719/elife-62719-supp2-v2.xlsx
-
Supplementary file 3
Cumulative genome length per family.
- https://cdn.elifesciences.org/articles/62719/elife-62719-supp3-v2.txt
-
Supplementary file 4
Number of genomes with at least one long-distance horizontal gene transfer (HGT) per taxa and the cumulative length of all exact matches found for each taxa.
- https://cdn.elifesciences.org/articles/62719/elife-62719-supp4-v2.xlsx
-
Supplementary file 5
Enrichment of the horizontal gene transfer (HGT) sequences for different functional classes for the 12 queried databases (see Gene enrichment analyses).
- https://cdn.elifesciences.org/articles/62719/elife-62719-supp5-v2.xlsx
-
Supplementary file 6
Results of the functional enrichment analyses (SEED subsystems and gene ontology [GO] term analysis).
- https://cdn.elifesciences.org/articles/62719/elife-62719-supp6-v2.xlsx
-
Supplementary file 7
GC, Gram, and environmental annotations for each family.
- https://cdn.elifesciences.org/articles/62719/elife-62719-supp7-v2.xlsx
-
Supplementary file 8
DNA sequence of the two longest matches found between an archaea and bacteria.
- https://cdn.elifesciences.org/articles/62719/elife-62719-supp8-v2.fa
-
Supplementary file 9
Matlab code to calculate the horizontal gene transfer (HGT) rate (A) from the comparison of a pair of genera computed with the MUMmer software.
- https://cdn.elifesciences.org/articles/62719/elife-62719-supp9-v2.zip
-
Transparent reporting form
- https://cdn.elifesciences.org/articles/62719/elife-62719-transrepform-v2.docx.pdf
Download links
A two-part list of links to download the article, or parts of the article, in various formats.
Downloads (link to download the article as PDF)
Open citations (links to open the citations from this article in various online reference manager services)
Cite this article (links to download the citations from this article in formats compatible with various reference manager tools)
Identical sequences found in distant genomes reveal frequent horizontal transfer across the bacterial domain
eLife 10:e62719.
https://doi.org/10.7554/eLife.62719


