GTPBP1 resolves paused ribosomes to maintain neuronal homeostasis
- Howard Hughes Medical Institute, Department of Cellular and Molecular Medicine, Section of Neurobiology, Division of Biological Sciences, University of California, San Diego, United States
- Graduate School of Biomedical Sciences and Engineering, University of Maine, United States
- The Jackson Laboratory for Genomic Medicine, United States
- Department of Genetics and Genome Sciences, Institute for Systems Genomics, UConn Health, United States
- Division of Biological Sciences, Section of Molecular Biology, University of California, San Diego, United States
- The Jackson Laboratory for Mammalian Genetics, United States
Figures
Figure 1 with 2 supplements
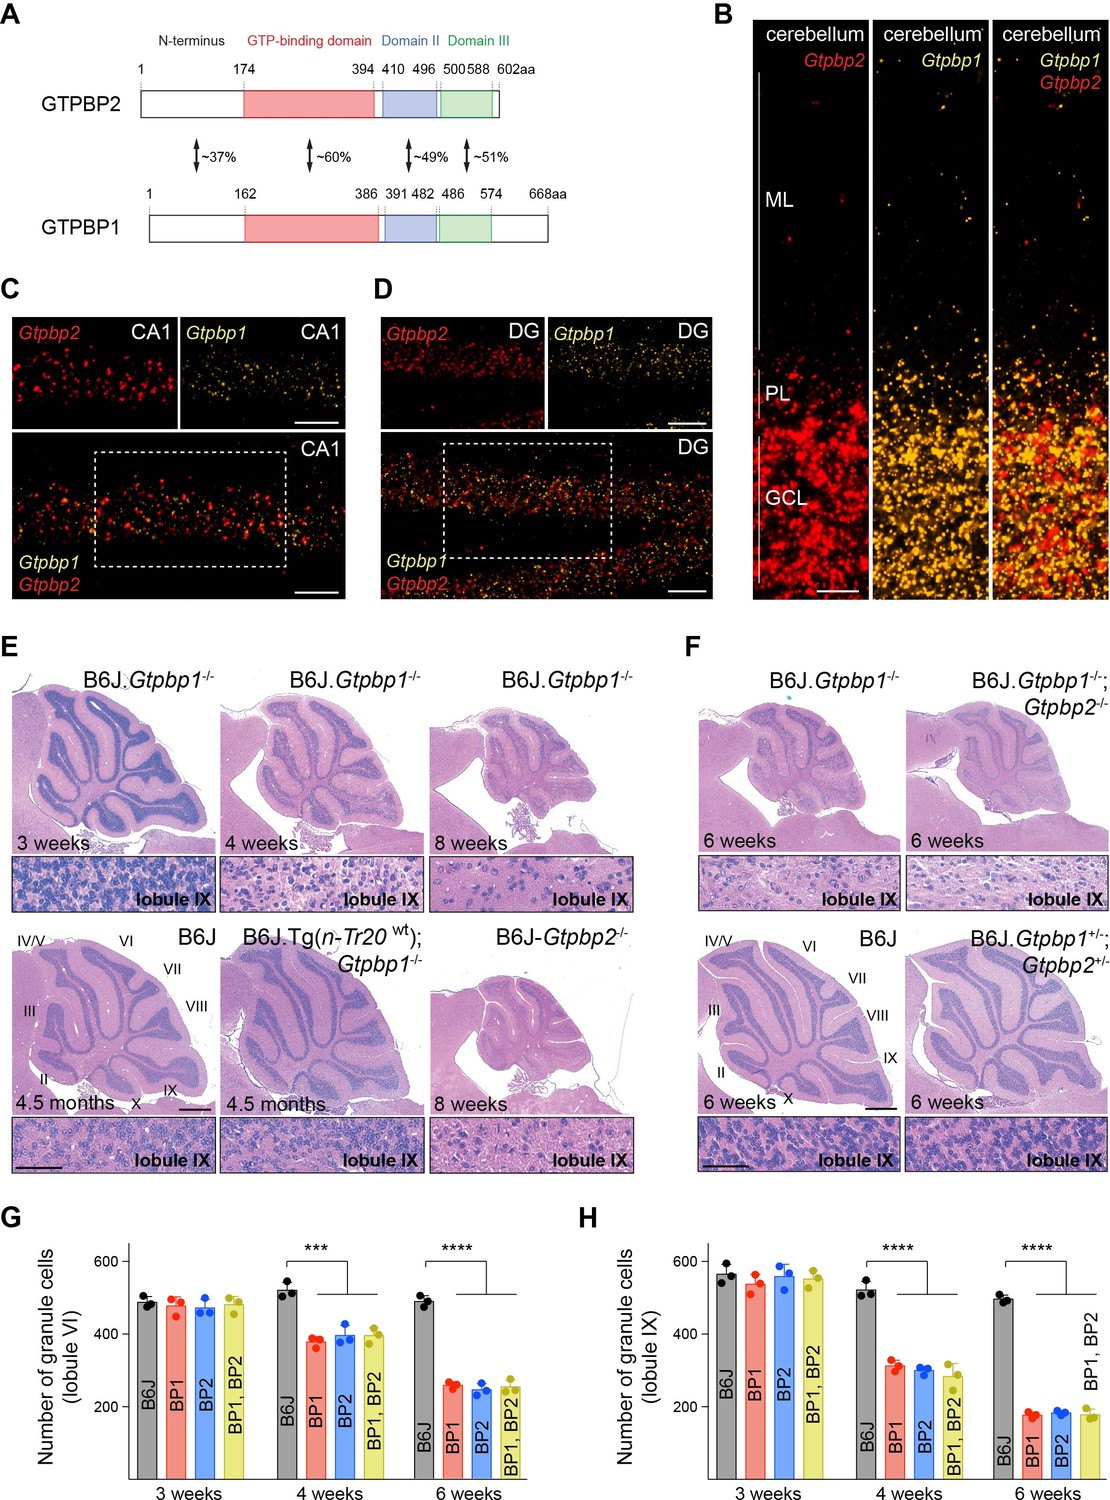
tRNA deficiency induces neurodegeneration in B6J.Gtpbp1-/- mice.
(A) Domain structure of mouse GTPBP2 and GTPBP1. The percent of identical amino acids for each domain is shown. (B–D) In situ hybridization demonstrating ubiquitous expression of Gtpbp1 (yellow) and Gtpbp2 (red) in the P28 wild type (B6J) cerebellum (B), and CA1 region of the hippocampus (C), dentate gyrus (DG) (D) (n = 2 mice). Images of individual probes from areas defined by rectangles in C and D are shown above merged images. (E, F) Hematoxylin and eosin staining of sagittal sections of the cerebellum (n = 3–4 mice/genotype). Higher magnification images of lobule IX are shown below each genotype. Cerebellar lobes are indicated by Roman numerals. (G, H) Number of cerebellar granule cells in lobule VI (G) and lobule IX (H) of 3-, 4-, and 6-week-old BP1 (B6J.Gtpbp1-/-); BP2 (B6J-Gtpbp2-/-); and BP1, BP2 (B6J.Gtpbp1-/-; Gtpbp2-/-) mice (n = 3 mice/genotype). Data represent mean + SD. ML, molecular cell layer; PL, Purkinje cell layer; GCL, granule cell layer. Scale bars: 20 μm (B, C, D); 500 μm and 50 μm (higher magnification) (E, F). One-way ANOVA was corrected for multiple comparisons using Tukey method (G, H). ***p≤0.001, ****p≤0.0001.
-
Figure 1—source data 1
tRNA deficiency induces neurodegeneration in B6J.Gtpbp1-/- mice.
- https://cdn.elifesciences.org/articles/62731/elife-62731-fig1-data1-v2.xlsx
Figure 1—figure supplement 1
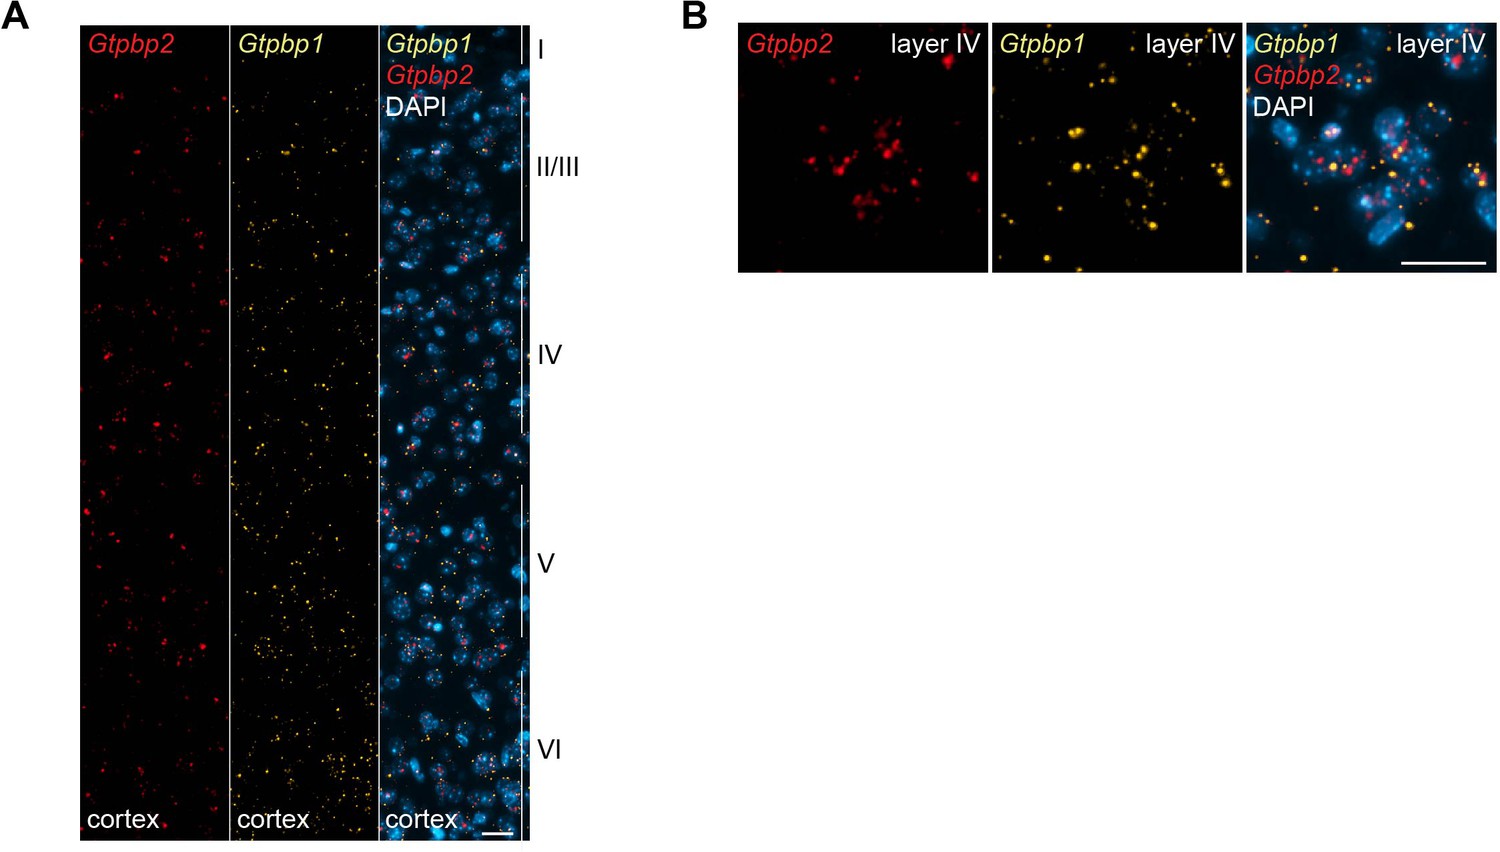
Expression of Gtpbp1 and Gtpbp2 in the mouse cortex.
(A and B) In situ hybridization was performed on P28 B6J mice demonstrating ubiquitous expression of Gtpbp1 (yellow) and Gtpbp2 (red) throughout the cortex (A) and specifically in layer IV (B) (n = 2 mice). Sections were counterstained with DAPI (blue). Cortical layers are indicated by Roman numerals. Scale bar: 20 μm (A, B).
Figure 1—figure supplement 2
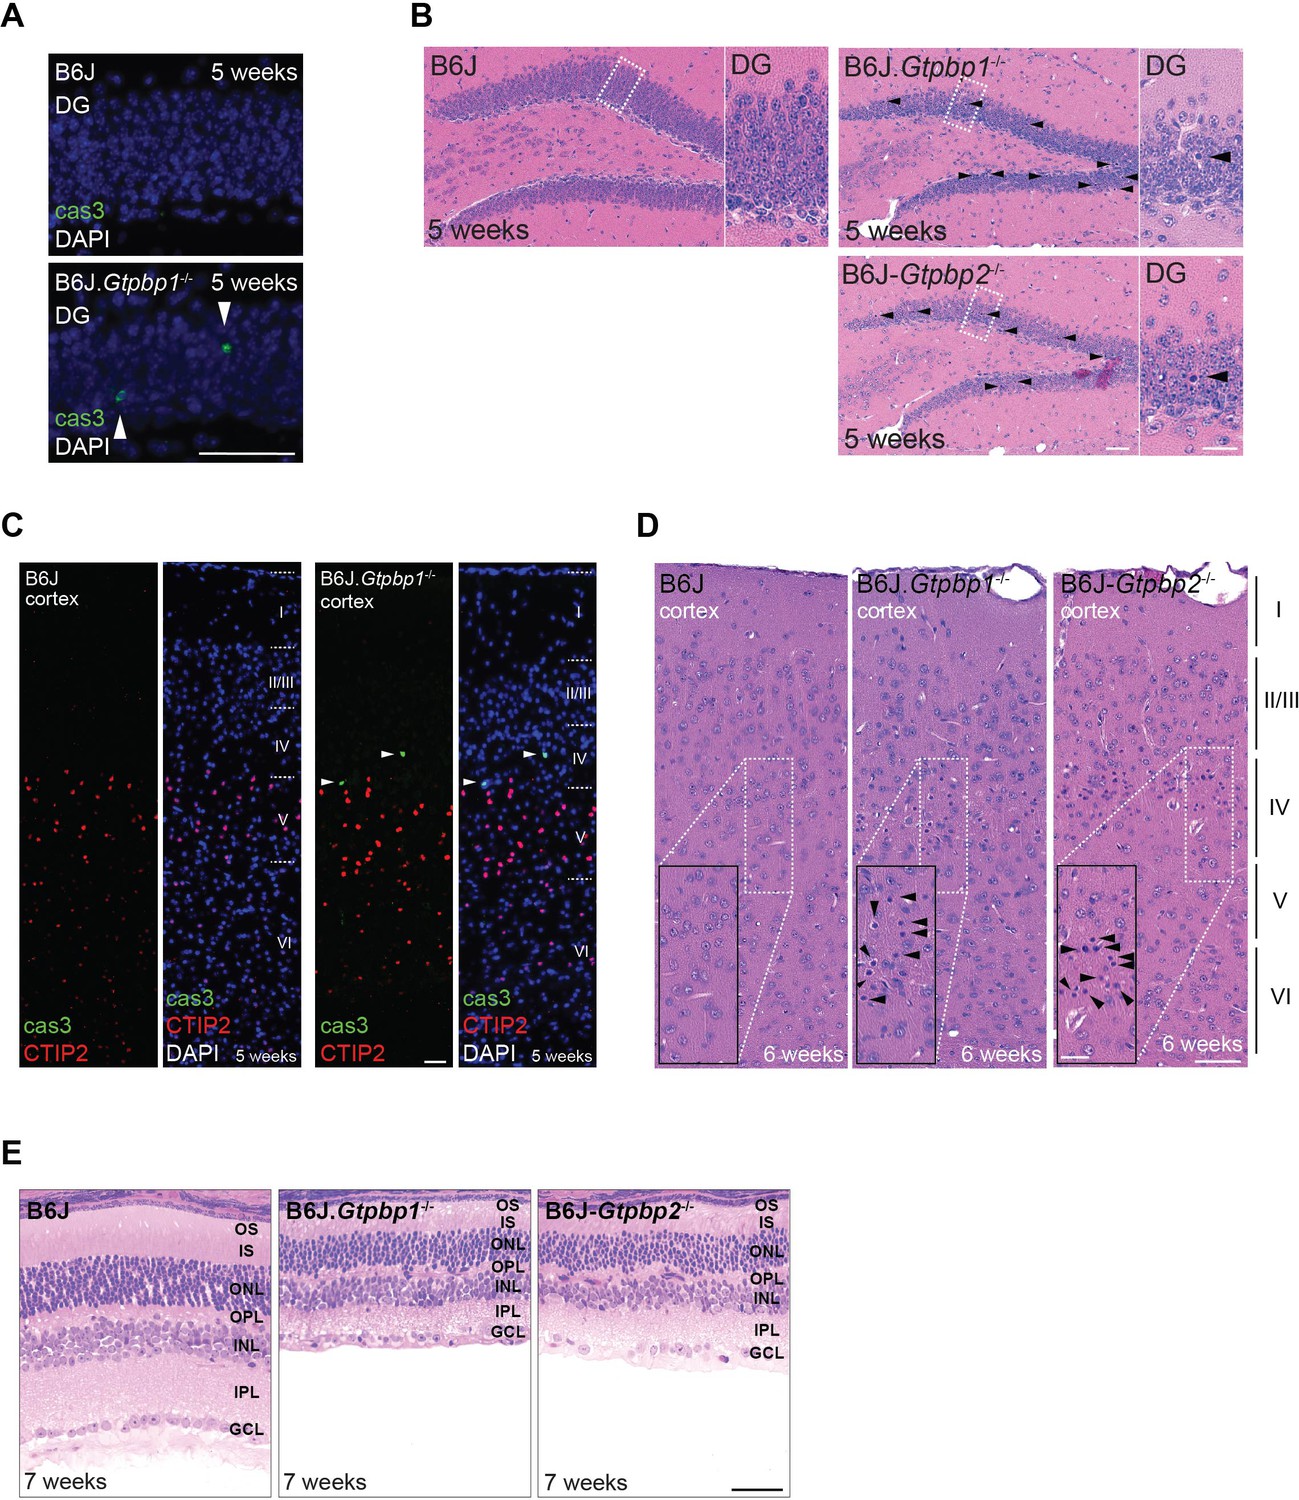
Extensive neurodegeneration in B6J.Gtpbp1-/- mice.
(A) Immunofluorescence of hippocampal sections of the dentate gyrus (DG) with antibodies against cleaved caspase 3 (cas3, green; arrowheads indicate positive cells). Sections were counterstained with DAPI, (n = 3 mice/genotype). (B) Hematoxylin and eosin-stained sagittal sections of the DG (n ≥ 3 mice/genotype). Higher magnification images of the region indicated by the rectangle are shown for each genotype. Arrowheads indicate pyknotic cells. Note the similarity in neurodegeneration between mutant genotypes. (C) Immunofluorescence on cortical sections with antibodies against cleaved caspase 3 (cas3, green) and CTIP2 (red) to identify layer V neurons (n = 3 mice). Sections were counterstained with DAPI. Cortical layers are indicated by Roman numerals. Note the cas3-positive neurons in layer IV (above layer V CTIP2+ neurons). (D) Hematoxylin and eosin-stained sagittal sections of the cortex from 6-week-old mice (n ≥ 3 mice/genotype). Cortical layers are indicated by Roman numerals and higher magnifications (dashed line rectangle) of layer IV of the cortex are shown. (E) Hematoxylin and eosin-stained retina sections (n = 2–3 mice/genotype). Note the similarity in neurodegeneration between mutant genotypes. Scale bars: 50 μm (A, E); 25 μm (C); 50 μm and 20 μm (higher magnification) (B, D). OS, outer segment; IS, inner segment; ONL, outer nuclear layer; OPL, outer plexiform layer; INL, inner nuclear layer; IPL, inner plexiform layer; GCL, ganglion cell layer.
Figure 2 with 1 supplement
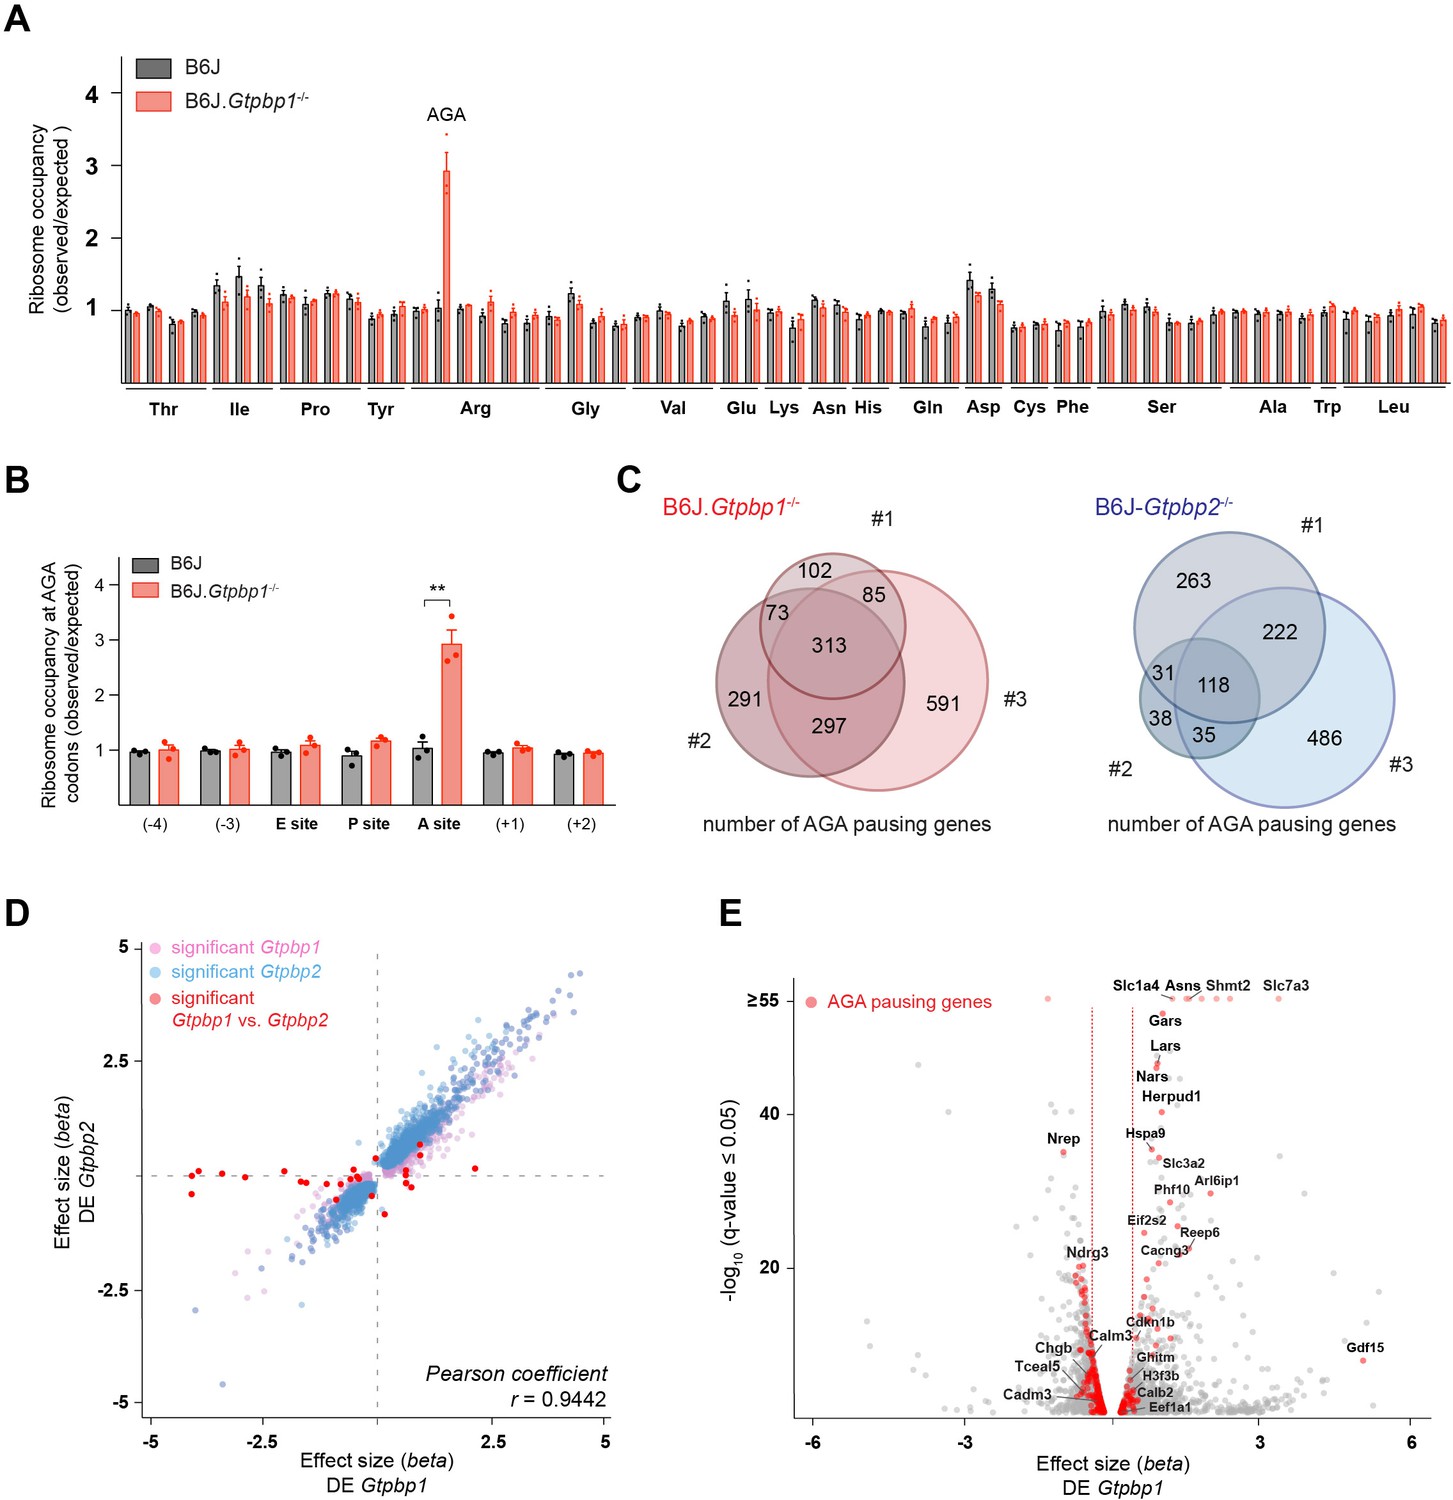
GTPBP1 resolves ribosome pausing induced by tRNA deficiency.
(A) Ribosome occupancy was calculated by dividing the number of genome-wide reads at codons by the expected reads in the ribosomal A-site (n = 3 biological replicates). Data represent mean + SEM. Note that ribosome occupancy increased only at AGA codons in P21 B6J.Gtpbp1-/- mice. (B) Ribosome occupancy at AGA codons was calculated by dividing genome-wide reads at AGA codons by expected reads. Data represent mean + SEM from ribosome profiling from cerebella of P21 B6J and B6J.Gtpbp1-/- mice (n = 3 biological replicates). (C) Venn diagram of genes with increased ribosome occupancy at AGA codons (z-score ≥10) between libraries prepared from individual B6J.Gtpbp1-/- (red) or B6J-Gtpbp2-/- (blue) mice (biological replicates 1–3). (D) Significant (q-value ≤0.05, q-value refers to the corrected p-value using Benjamini-Hochberg correction) transcriptional changes in gene expression between P21 B6J and B6J.Gtpbp1-/- cerebellum (x-axis, DE Gtpbp1) are plotted against those between P21 B6J and B6J-Gtpbp2-/- cerebellum (y-axis, DE Gtpbp2) (n = 3 biological replicates). Significant (q-value ≤0.05) Gtpbp1-dependent expression changes are colored in pink and Gtpbp2-dependent expression changes in blue. Significant (q-value ≤0.05) transcriptional changes in gene expression between B6J.Gtpbp1-/- and B6J-Gtpbp2-/- are shown in red (27 genes). The beta effect size is analogous to the natural log fold change in expression. (E) Analysis of differential gene expression between P21 B6J and B6J.Gtpbp1-/- mice (DE Gtpbp1). Significant (q-value ≤0.05) transcriptional changes in gene expression are shown in grey, and genes with increased AGA ribosome occupancy (z-score ≥10, detected in at least two biological replicates) that are differentially expressed are highlighted in red (260 genes). The beta effect size is analogous to the natural log fold change in expression and 1.5-fold changes in gene expression are indicated by the red dashed lines. Multiple t tests were corrected for multiple comparisons using Holm-Sidak method (B). **p≤0.01.
-
Figure 2—source data 1
GTPBP1 resolves ribosome pausing induced by tRNA deficiency.
- https://cdn.elifesciences.org/articles/62731/elife-62731-fig2-data1-v2.xlsx
Figure 2—figure supplement 1
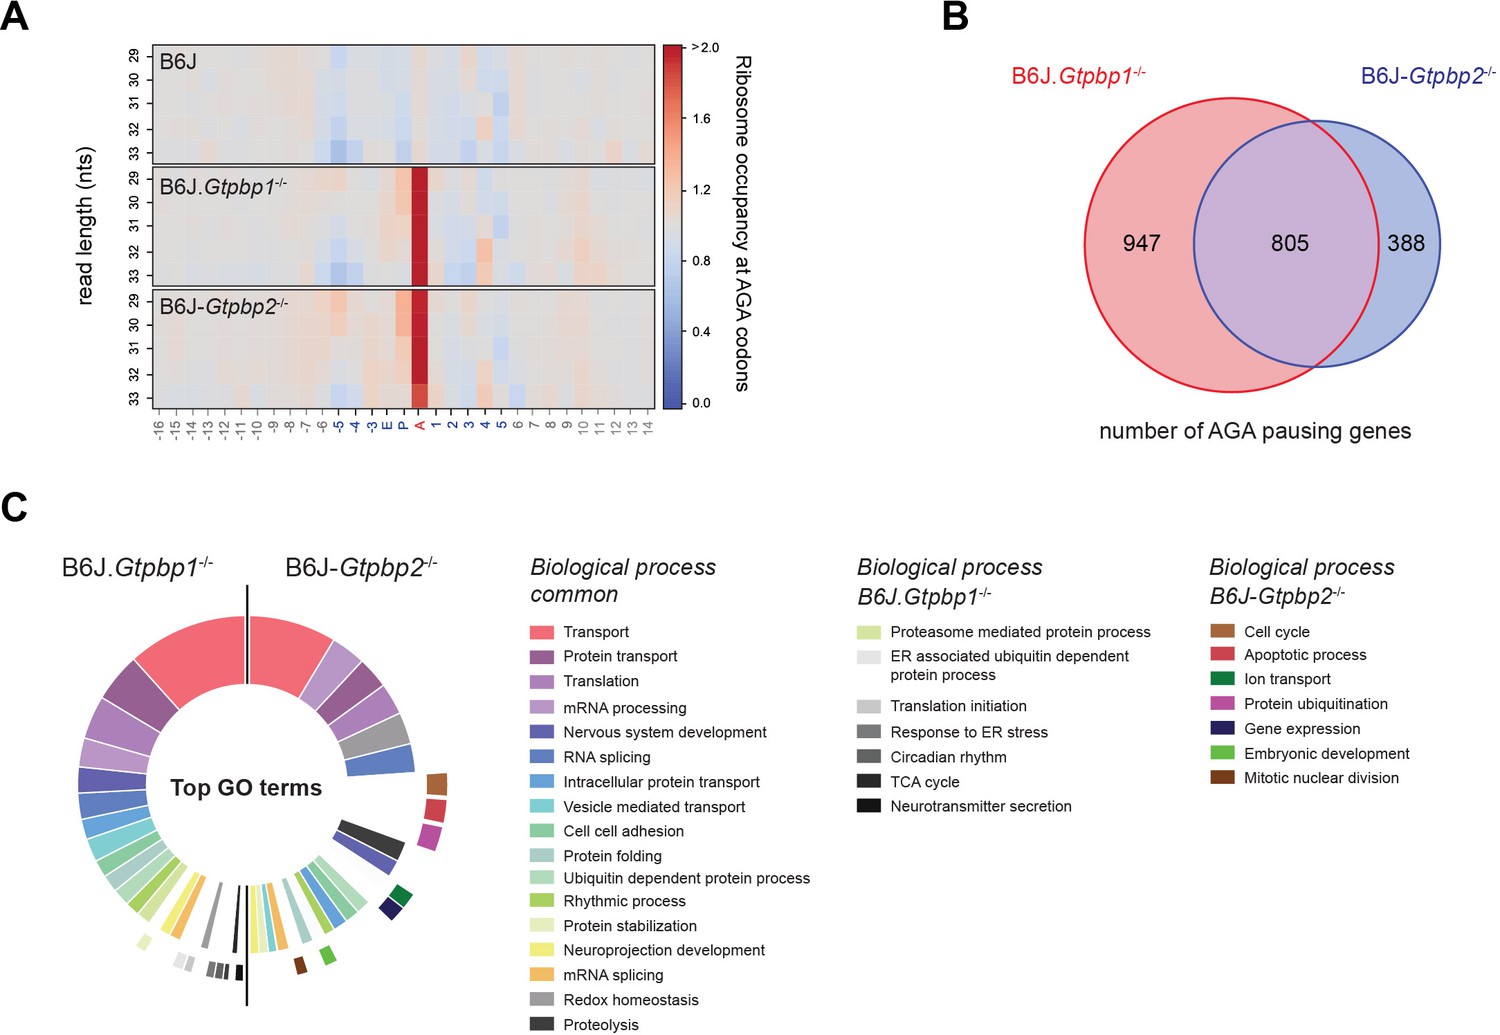
Gtpbp1 and Gtpbp2 resolve AGA pauses.
(A) Heatmap of ribosome occupancy (observed/expected reads) at AGA codons relative to nucleotide (nts) length of ribosome protected fragments. Note the increase in ribosome occupancy at the A-site AGA codon in P21 B6J.Gtpbp1-/- and B6J-Gtpbp2-/- mice (n = 3 biological replicates). (B) Venn diagram of all genes with increased AGA ribosome occupancy (z-score ≥10) observed in P21 B6J.Gtpbp1-/- and B6J-Gtpbp2-/- mice (n = 3 biological replicates). (C) Gene Ontology (GO) analysis using all AGA pausing genes (z-score ≥10) from P21 B6J.Gtpbp1-/- and B6J-Gtpbp2-/- mice. Top 24 enriched categories (Benjamini-Hochberg adjusted p-value≤0.05) are shown. The inner circle and outer circle represent GO categories that are shared between mutant genotypes or unique to each genotype, respectively.
Figure 3 with 1 supplement
Ribosome pausing activates the integrated stress response (ISR) to ameliorate neurodegeneration in Gtpbp1-/- mice.
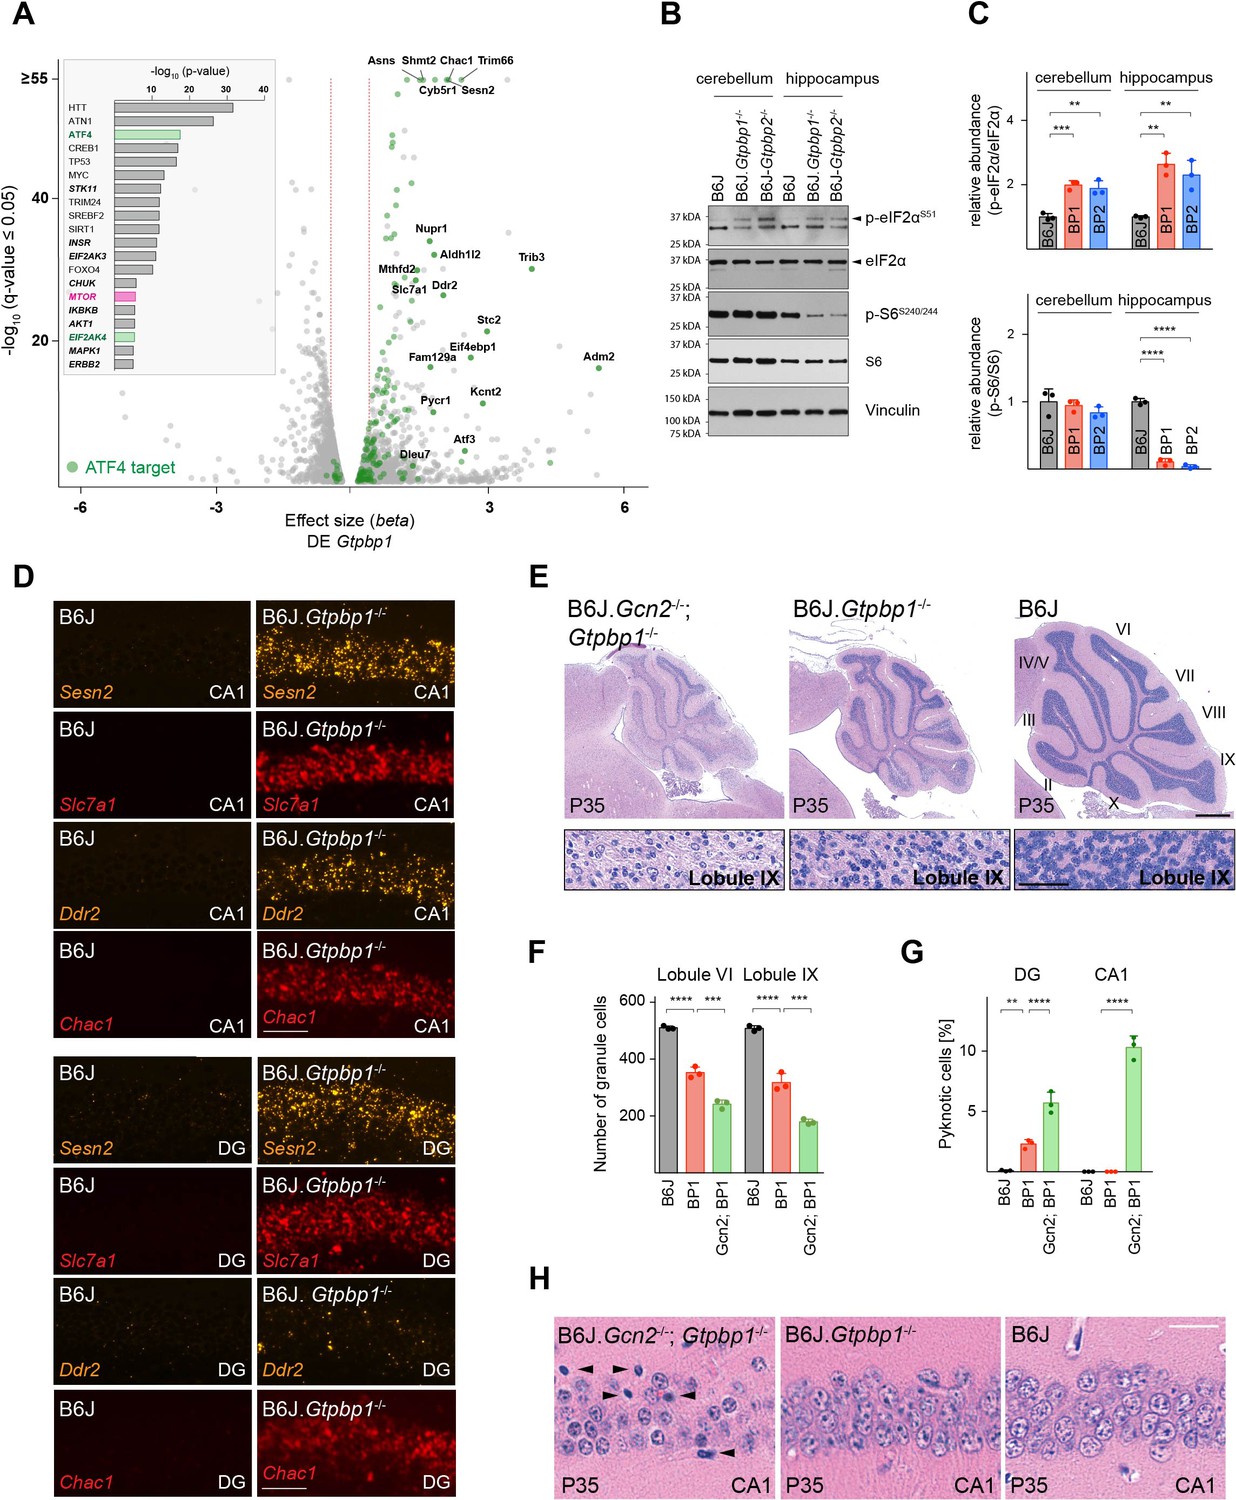
(A) Analysis of transcriptional changes in gene expression between P21 B6J and B6J.Gtpbp1-/- mice (DE Gtpbp1) (n = 3 biological replicates). Significant (q-value ≤0.05, q-value refers to the corrected p-value using Benjamini-Hochberg correction) changes in expression are shown in grey and differentially expressed ATF4 targets are highlighted in green. The beta effect size is analogous to the natural log fold change in expression and 1.5-fold changes in gene expression are indicated (red dashed lines). (Inset) Identification of upstream regulators using Ingenuity Pathway Analysis (IPA) of differentially expressed genes between B6J and B6J.Gtpbp1-/- mice (DE Gtpbp1). Top ten transcription factors and kinases (italics) are shown. (B) Western blot analysis of tissue lysates from P21 mice. Vinculin was used as an input control. (C) Relative abundance of p-eIF2αS51 and p-S6S240/244 in the hippocampus and cerebellum of BP1 (B6J.Gtpbp1-/-), BP2 (B6J-Gtpbp2-/-), and control (B6J) mice (n = 3 mice/genotype). Levels of p-eIF2αS51 or p-S6S240/244 were normalized to total level of eIF2α or S6, and phosphorylation levels are relative to those of B6J. Data represent mean + SD. (D) In situ hybridization of ATF4 targets in the hippocampal CA1 and dentate gyrus (DG) at P21 (n = 3 mice/genotype). (E) Sagittal cerebellar sections stained with hematoxylin and eosin. Higher magnification images of lobule IX are shown below each genotype (n = 3 mice/genotype). Cerebellar lobes are indicated by Roman numerals. (F) Quantification of cerebellar granule cells of lobule VI and lobule IX of control (B6J), BP1 (B6J.Gtpbp1-/-), and Gcn2; BP1 (B6J.Gcn2-/-; Gtpbp1-/-) mice at P35 (n = 3 mice/genotype). Data represent mean + SD. (G) Percent of DG and CA1 neurons that are pyknotic in control (B6J), BP1 (B6J.Gtpbp1-/-), and Gcn2; BP1 (B6J.Gcn2-/-; Gtpbp1-/-) mice at P35 (n = 3 mice/genotype). Data represent mean + SD. (H) Sagittal sections of the CA1 area of the hippocampus stained with hematoxylin and eosin (n = 3 mice/genotype). Arrowheads indicate pyknotic cells. Scale bars: 50 μm (D); 500 μm and 50 μm (higher magnification) (E); 20 μm (H). One-way ANOVA was corrected for multiple comparisons using Tukey method (C, F, G). **p≤0.01, ***p≤0.001, ****p≤0.0001.
-
Figure 3—source data 1
Ribosome pausing activates theintegrated stress response (ISR) to ameliorate neurodegeneration in Gtpbp1-/- mice.
- https://cdn.elifesciences.org/articles/62731/elife-62731-fig3-data1-v2.xlsx
Figure 3—figure supplement 1
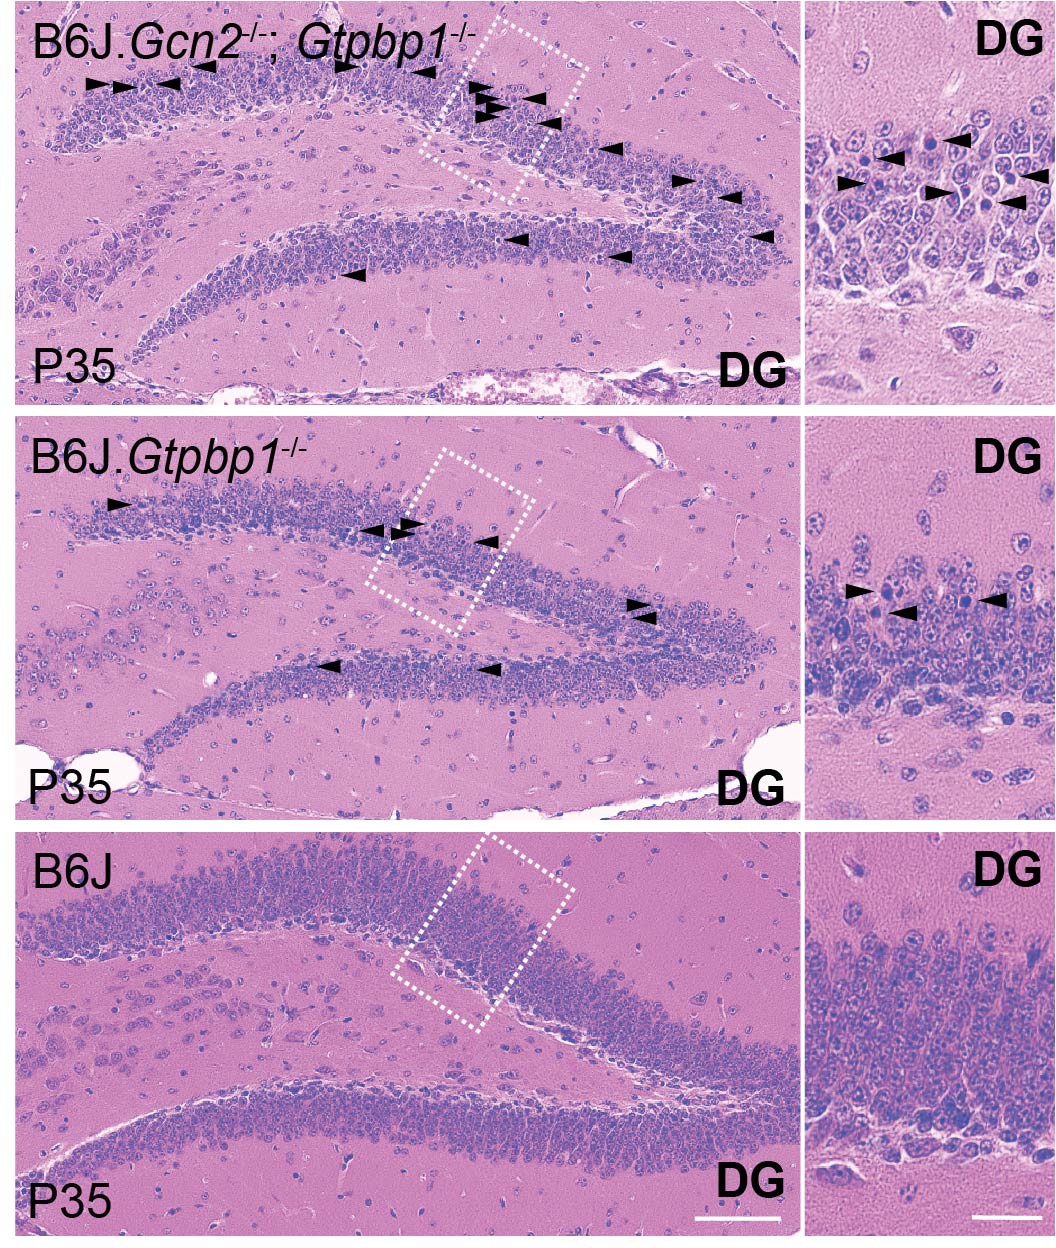
Loss of GCN2 enhances hippocampal degeneration in B6J.
Gtpbp1-/- mice. Hippocampal sagittal sections of the dentate gyrus (DG) stained with hematoxylin and eosin (n = 3 mice/genotype). Higher magnification images of the DG region defined by the rectangle are shown. Arrowheads indicate pyknotic cells. Scale bars: 50 μm and 20 μm (higher magnification).
Figure 4 with 2 supplements

Decreased mTOR signaling enhances neurodegeneration in trGTPase-deficient mice.
(A) Immunofluorescence of P21 hippocampal sections with antibodies against p-S6S240/244 (orange) and S6 (green). Sections were counterstained with DAPI (blue). Higher magnifications of CA1 and dentate gyrus (DG) are shown (n = 3 mice/genotype). (B) Sagittal cerebellar sections of P28 mice injected with vehicle or rapamycin for 14 days stained with hematoxylin and eosin (n = 3 mice/genotype). Higher magnification images of lobule IX are shown below each genotype. Cerebellar lobes are indicated by Roman numerals. (C) Quantification of cerebellar granule cells in lobule VI and lobule IX of either vehicle (V) or rapamycin (R) treated control (B6J), BP1 (B6J.Gtpbp1-/-), and BP2 (B6J-Gtpbp2-/-) mice (n = 3 mice/genotype). Data represent mean + SD. Scale bars: 100 μm and 50 μm (higher magnification) (A); 500 μm and 50 μm (higher magnification) (B). Two-way ANOVA was corrected for multiple comparisons using Tukey method (C). **p≤0.01, ***p≤0.001, ****p≤0.0001.
-
Figure 4—source data 1
Decreased mTOR signaling enhances neurodegeneration in trGTPase-deficient mice.
- https://cdn.elifesciences.org/articles/62731/elife-62731-fig4-data1-v2.xlsx
Figure 4—figure supplement 1
Analysis of mTOR signaling in trGTPase-deficient mice.
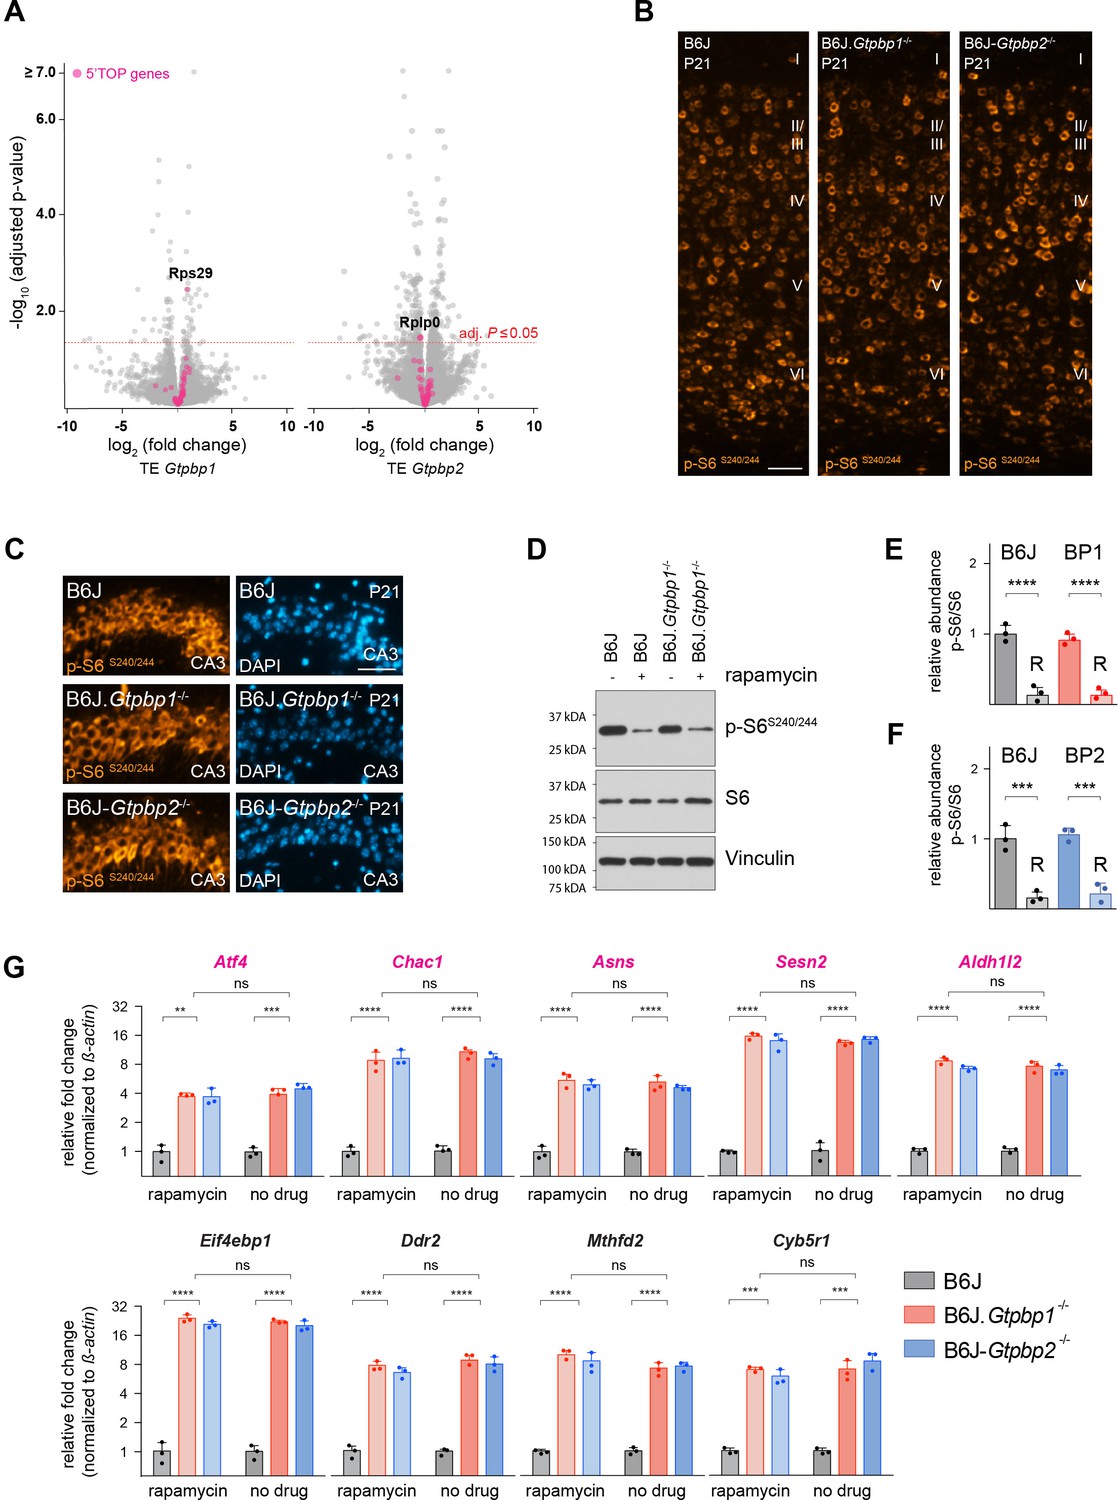
(A) Analysis of differential translation efficiency (TE) in the cerebellum of P21 B6J and B6J.Gtpbp1-/- (TE Gtpbp1) or B6J and B6J-Gtpbp2-/- (TE Gtpbp2) mice (n = 3 biological replicates/genotype). The TE of genes was determined by normalizing the abundance of ribosomal footprints to that of RNA-sequencing reads. 5’TOP genes regulated by mTOR are shown in magenta. The red dashed line marks significant changes in TE (adjusted p-value≤0.05). (B) Immunofluorescence of P21 cortical sections with antibodies against p-S6S240/244 (orange) (n = 3 mice/genotype). Cortical layers are indicated by Roman numerals. (C) Immunofluorescence of P21 hippocampal (CA3) sections with antibodies against p-S6S240/244 (orange) and counterstained with DAPI (blue) (n = 3 mice/genotype). (D) Western blotting analysis of p-S6S240/244 in cerebellar tissue extracts from P21 B6J and B6J.Gtpbp1-/- mice untreated or injected with rapamycin for 7 days. Vinculin was used as an input control. (E) Relative abundance of p-S6S240/244 in the cerebellum of P21 B6J and BP1 (B6J.Gtpbp1-/-) mice treated with rapamycin (R) (n = 3 mice/genotype/treatment). Levels of p-S6S240/244 were normalized to total levels of S6 and phosphorylation levels are relative to those of untreated B6J mice. Data represent mean + SD. (F) Relative abundance of p-S6S240/244 in the cerebellum of P21 B6J and BP2 (B6J-Gtpbp2-/-) mice treated with rapamycin (R). Levels of p-S6S240/244 were normalized to total levels of S6 and phosphorylation levels are relative to those of untreated B6J mice (n = 3 mice/genotype/treatment). Data represent mean + SD. (G) Quantitative RT-PCR analysis of ATF4 targets using cerebellar cDNA from P21 B6J, B6J.Gtpbp1-/-, and B6J-Gtpbp2-/- mice injected with rapamycin for 7 days or untreated (n = 3 mice/genotype/treatment). Data were normalized to beta-actin and fold change in gene expression is relative to that of B6J. Magenta colored genes were previously shown to be sensitive to mTOR inhibition (Park et al., 2017). Data represent mean + SD. Scale bar: 50 μm (B, C). Two-way ANOVA was corrected for multiple comparisons using Tukey method (E, F, G). ns, not significant, **p≤0.01, ***p≤0.001, ****p≤0.0001.
-
Figure 4—figure supplement 1—source data 1
Decreased mTOR signaling enhances neurodegeneration in trGTPase-deficient mice.
- https://cdn.elifesciences.org/articles/62731/elife-62731-fig4-figsupp1-data1-v2.xlsx
Figure 4—figure supplement 2
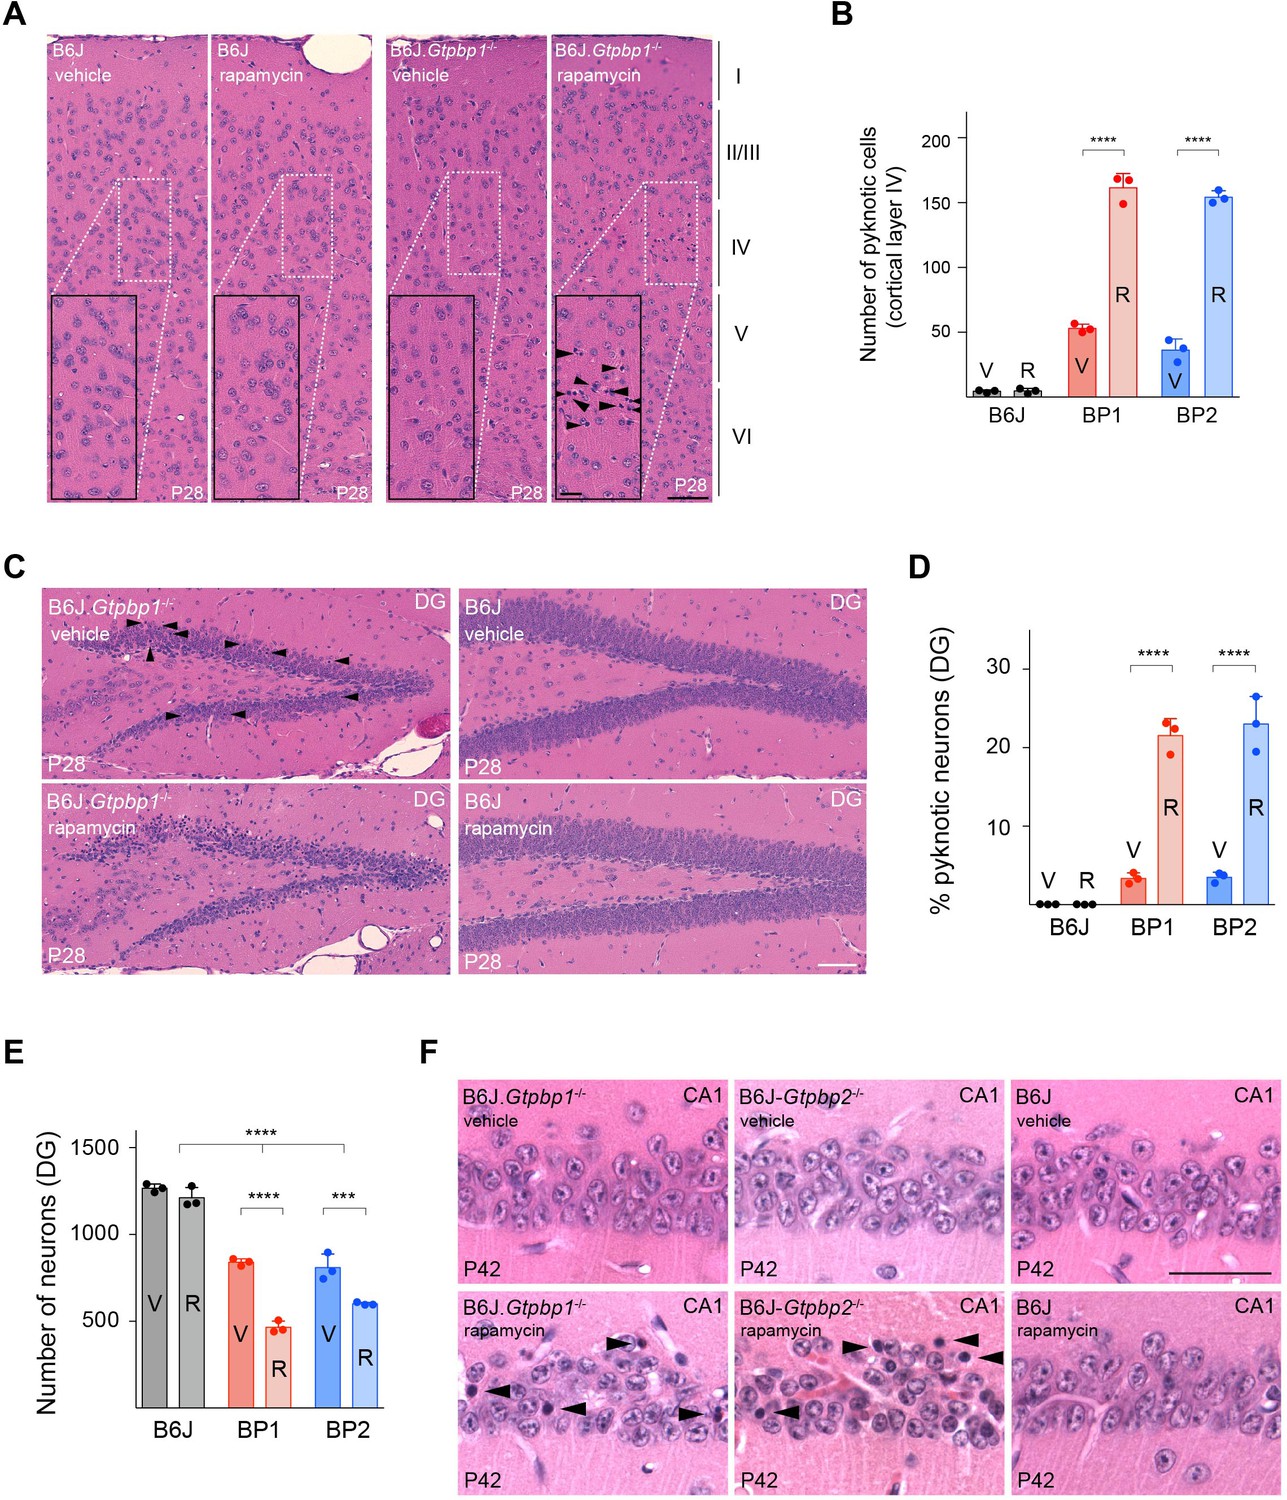
Inhibition of mTOR signaling accelerates cell death in B6J.Gtpbp1-/- and B6J-Gtpbp2-/- mice.
(A) Sagittal sections of the cortex of P28 mice injected with vehicle or rapamycin for two weeks stained with hematoxylin and eosin. Higher magnification images of layer IV (rectangle) are shown for each genotype (n = 3 mice/genotype/treatment). Cortical layers are indicated by Roman numerals and arrowheads indicate pyknotic cells. (B) Number of pyknotic cells in layer IV of the cortex in (B6J), BP1 (B6J.Gtpbp1-/-), and BP2 (B6J-Gtpbp2-/-) mice injected with vehicle (V) or rapamycin (R) (n = 3 mice/genotype/treatment). Data represent mean + SD. (C) Hematoxylin and eosin stained sagittal sections of the hippocampus of P28 mice injected with vehicle or rapamycin for 14 days (n = 3 mice/genotype/treatment). Arrowheads indicate pyknotic cells. Note: Due to the large number of pyknotic cells in rapamycin-treated B6J.Gtpbp1-/- mice, arrowheads to indicate pyknotic cells were not included. (D) Percent of neurons with pyknotic nuclei in the dentate gyrus (DG) in vehicle (V) or rapamycin (R) treated control (B6J), BP1 (B6J.Gtpbp1-/-), and BP2 (B6J-Gtpbp2-/-) mice (n = 3 mice/genotype/treatment). Data represent mean + SD. (E) Total number of neurons of the DG in vehicle (V) or rapamycin (R) treated control (B6J), BP1 (B6J.Gtpbp1-/-), and BP2 (B6J-Gtpbp2-/-) mice (n = 3 mice/genotype/treatment). Data represent mean + SD. (F) Sagittal sections of the hippocampus of P42 mice injected with vehicle or rapamycin for two weeks stained with hematoxylin and eosin (n = 3). Arrowheads indicate pyknotic cells. Scale bars: 50 μm and 20 μm (higher magnification) (A); 50 μm (C, F). Two-way ANOVA was corrected for multiple comparisons using Tukey method (B, D, E). ***p≤0.001, ****p≤0.0001.
-
Figure 4—figure supplement 2—source data 1
Inhibition of mTOR signaling accelerates cell death in B6J.Gtpbp1-/- and B6J-Gtpbp2-/- mice.
- https://cdn.elifesciences.org/articles/62731/elife-62731-fig4-figsupp2-data1-v2.xlsx
Tables
Key resources table
| Reagent type (species) or resource | Designation | Source or reference | Identifiers | Additional information |
|---|---|---|---|---|
| Strain, strain background (mouse) | Gtpbp1 < tm1Ynim/tm1Ynim> | Senju et al., 2000 | RRID:MGI:3036546 | Gtpbp1-/- strain (mixed genetic background) |
| Strain, strain background (mouse) | B6J.Gtpbp1<tm1Ynim/tm1Ynim> | This study | MGI:6467940 | B6J.Gtpbp1-/- strain (congenic background, C57BL/6J) |
| Strain, strain background (mouse) | B6J-Gtpbp2-/-(C57BL/6J-Gtpbp2nmf205/J) | Ishimura et al., 2014 | RRID:IMSR_JAX:004823 | |
| Strain, strain background (mouse) | B6J.Gcn2-/-(B6.129S6-Eif2ak4tm1.2Dron) | The Jackson Laboratory | RRID:IMSR_JAX:008240 | |
| Sequence-based reagent | Genotyping wild type allele Gtpbp1 | This study | N/A | Forward Primer: 5’GAGTACGGGCTGAGTGAAGC3’; Reverse Primer:5’TGGACAGGAACCTGATGTGA3’ |
| Sequence-based reagent | Genotyping mutant allele Gtpbp1 | This study | N/A | Forward Primer: 5’TACGCCACCGTGAAGAGCAT3’; Reverse Primer:5’AGGGGAGGAGTGGAAGGTGG3’ |
| Sequence-based reagent | Quantitative RT-PCR (beta actin) | This study | N/A | Forward Primer: 5’GGCTGTATTCCCCTCCATCG3’; Reverse Primer:5’ CCAGTTGGTAACAATGCCATGT3’ |
| Sequence-based reagent | RNAscope probe Gtpbp2 (mouse) | Advanced Cell Diagnostics | #527461 | |
| Sequence-based reagent | RNAscope probe Gtpbp1 (mouse) | Advanced Cell Diagnostics | #527451-C3 | |
| Sequence-based reagent | RNAscope probe Sesn2 (mouse) | Advanced Cell Diagnostics | Probe (reference number: 574751-C2) was modified for this study to be compatible with manual RNAscope protocol but is otherwise equivalent to #574758-C2 | |
| Sequence-based reagent | RNAscope probe Slc7a1 (mouse) | Advanced Cell Diagnostics | #461021 | |
| Sequence-based reagent | RNAscope probe Ddr2 (mouse) | Advanced Cell Diagnostics | #405991-C2 | |
| Sequence-based reagent | RNAscope probe Chac1 (mouse) | Advanced Cell Diagnostics | #514501 | |
| Commercial assay or kit | RNAscope Multiplex Fluorescent Reagent Kit v2 | Advanced Cell Diagnostics | #323100 | |
| Commercial assay or kit | TSA Plus Cyanine 5 | PerkinElmer | NEL745001KT | (1:1000) |
| Commercial assay or kit | TSA Plus Cyanine 3 | PerkinElmer | NEL744001KT | (1:2000) |
| Commercial assay or kit | DNA-free DNA Removal Kit | Life Technologies | AM1906 | |
| Commercial assay or kit | SuperScript III First-Strand Synthesis System | Invitrogen | #18080051 | |
| Commercial assay or kit | iQ SYBR Green Supermix | Bio-Rad | #1708880 | |
| Commercial assay or kit | TruSeq v2 mRNA kit | Illumina | RS-122–2001 | |
| Chemical compound, drug | Rapamycin | LC Laboratories | R5000 | |
| Antibody | Rabbit anti-phospho-EIF2alpha (polyclonal) | Cell Signaling Technology | CST #9721; RRID:AB_330951 | WB (1:1000) |
| Antibody | Rabbit anti- EIF2alpha (polyclonal) | Cell Signaling Technology | CST #9722; RRID:AB_2230924 | WB (1:2000) |
| Antibody | Rabbit anti-phospho S6 ribosomal protein, S240/244(polyclonal) | Cell Signaling Technology | CST #5364; RRID:AB_10694233 | WB (1:4000) IF (1:1000) |
| Antibody | Mouse anti-S6 ribosomal protein (monoclonal) | Santa Cruz Biotechnology | sc-74459; RRID:AB_1129205 | WB (1:2000) IF (1:500) |
| Antibody | Mouse anti-Vinculin (monoclonal) | Sigma | V9131; RRID:AB_477629 | WB (1:20000) |
| Software, algorithm | GraphPad Prism 7 | GraphPad software | RRID:SCR_002798 | |
| Software, algorithm | kallisto v0.42.4 | Bray et al., 2016 | RRID:SCR_016582; https://pachterlab.github.io/kallisto/about | |
| Software, algorithm | sleuth v0.30.0 | Pimentel et al., 2017 | RRID:SCR_016883; https://pachterlab.github.io/sleuth/about | |
| Software, algorithm | featureCounts | Liao et al., 2014 | RRID:SCR_012919; http://bioinf.wehi.edu.au/featureCounts | |
| Software, algorithm | hisat2 v2.1.0 | Kim et al., 2019 | RRID:SCR_015530; https://daehwankimlab.github.io/hisat2/ | |
| Software, algorithm | fastx_clipper | Hannon Lab | http://hannonlab.cshl.edu/fastx_toolkit/ | |
| Software, algorithm | fastx_trimmer | Hannon Lab | http://hannonlab.cshl.edu/fastx_toolkit/ | |
| Software, algorithm | bowtie2 v 2.2.3 | Langmead and Salzberg, 2012 | RRID:SCR_005476; http://bowtie-bio.sourceforge.net/bowtie2/index.shtml | |
| Software, algorithm | RiboWaltz v1.0.1 | Lauria et al., 2018 | RRID:SCR_016948; https://github.com/LabTranslationalArchitectomics/RiboWaltz | |
| Software, algorithm | DESeq2 v1.22.2 | Love et al., 2014 | RRID:SCR_015687; https://bioconductor.org/packages/release/bioc/html/DESeq2.html | |
| Software, algorithm | riborex v2.3.4 | Li et al., 2017 | RRID:SCR_019104; https://github.com/smithlabcode/riborex | |
| Software, algorithm | ensembldb v2.6.8 | Rainer et al., 2019 | RRID:SCR_019103; https://www.bioconductor.org/packages/release/bioc/html/ensembldb.html | |
| Software, algorithm | Pause site identification algorithm | Ishimura et al., 2014 | N/A | |
| Software, algorithm | Ingenuity Pathway Analysis (IPA) | QIAGEN, Inc | RRID:SCR_008653; https://www.qiagenbioinformatics.com/products/ingenuity-pathway-analysis | |
| Software, algorithm | DAVID bioinformatics web server | Huang et al., 2009 | RRID:SCR_001881; http://david.abcc.ncifcrf.gov |
Additional files
-
Supplementary file 1
All AGA pausing genes with increased ribosome occupancy (z-score ≥10) observed in P21 B6J.Gtpbp1-/- (sheet 1) and B6J-Gtpbp2-/- (sheet 2) mice (n = 3 mice/genotype).
- https://cdn.elifesciences.org/articles/62731/elife-62731-supp1-v2.xlsx
-
Supplementary file 2
Transcriptional gene expression analysis in the cerebellum of P21 B6J and B6J.Gtpbp1-/- (sheet 1), B6J and B6J-Gtpbp2-/- (sheet 2), or B6J.Gtpbp1-/- and B6J-Gtpbp2-/- (sheet 3) mice (n = 3 mice/genotype).
- https://cdn.elifesciences.org/articles/62731/elife-62731-supp2-v2.xlsx
-
Supplementary file 3
Analysis of differential translation efficiency in the cerebellum of P21 B6J and B6J.Gtpbp1-/- (sheet 1) or B6J and B6J-Gtpbp2-/- (sheet 2) mice (n = 3 mice/genotype).
- https://cdn.elifesciences.org/articles/62731/elife-62731-supp3-v2.xlsx
-
Transparent reporting form
- https://cdn.elifesciences.org/articles/62731/elife-62731-transrepform-v2.docx
Download links
A two-part list of links to download the article, or parts of the article, in various formats.
Downloads (link to download the article as PDF)
Open citations (links to open the citations from this article in various online reference manager services)
Cite this article (links to download the citations from this article in formats compatible with various reference manager tools)
GTPBP1 resolves paused ribosomes to maintain neuronal homeostasis
eLife 9:e62731.
https://doi.org/10.7554/eLife.62731


